Article

Consider the Multi-Objective Topology Optimization Design of a Space Structure Under Complex Working Conditions

School of Mechanical and Electrical Engineering, Xi’an Technological University, Xi’an 710021, China
*
Author to whom correspondence should be addressed.
Mathematics 2025, 13(13), 2133; https://doi.org/10.3390/math13132133
Submission received: 13 May 2025 / Revised: 20 June 2025 / Accepted: 21 June 2025 / Published: 30 June 2025

Abstract

In order to improve the stiffness and dynamic performance of the connecting frame and realize the lightweight, based on the topological optimization theory of the variable density method, the mathematical model of topology optimization of the connecting frame under multiple working conditions is established by the compromise programming method, considering the influence of thermal, dynamic, and static loads of the connecting frame, the weights of each working condition are decomposed by analytic hierarchy process, a whole is effectively improved, and the first-order frequency of the connecting frame is increased from 1700 Hz to 1932 Hz, which is increased by 13.6%. Two sets of comparative experiments are used to verify the effectiveness of the simulation results and the rationality of using the multi-objective topology optimization design method for the lightweight design of space structures under complex working conditions. The conclusion can provide a theoretical reference for the lightweight design of supporting components for spacecraft and other systems.

1. Introduction

With the increasing scope and needs of human space activities, higher requirements have been put forward for the weight of spacecraft. Advanced aerospace equipment is developing in the direction of high performance, high reliability, long life, and economic affordability, and the harsh and contradictory requirements of space structure configuration, light weight, and high efficiency. The lightweight space structure has become an important strategic goal for the development of aerospace technology in the future, and at the same time, the lightweight of institutions is also the direction of unremitting efforts in the aerospace field. Due to the limitation of launch vehicle launch capacity, the weight of the spacecraft is closely related to the launch conditions and launch cost, and relevant studies have shown that the cost of the spacecraft can decrease by about US$10,000 for every 1 kg decrease in mass [1]. Reducing the weight of spacecraft can be used to increase the payload of spacecraft to ensure the completion of spacecraft missions and space expansion [2]. In the process of component lightweighting, the manufacturing cost can be reduced, but the bearing capacity and safety factor of the component can also be reduced, and the safety and use intensity of the component in the work are the most fundamental requirements of lightweight design, so it is very important to find a balance between the contradictory needs of lightweight and performance.
The space structure environment includes all the natural environments that the space structure is subjected to during its life cycle, including not only the environment in the orbit phase but also all the environments in the storage, transportation, launch stage, and re-entry and return stages of ground products. The design and analysis of spatial structure includes the analysis of a variety of environments and influences, such as thermal environment analysis, thermodynamic coupling analysis, etc. These environmental and effect analyses are an important part of the overall design foundation [3]. The focus of this paper will be on how to comprehensively and effectively analyze the environment of spacecraft, correctly apply mathematical models and methods to realize the reasonable analysis and design of spacecraft, and effectively combine traditional topology optimization methods with complex working conditions of space structure to carry out correct and effective multi-objective optimization design of space structure.
Since the birth of the finite element method and the proposal of mathematical programming in the early 1960s of the 20th century, structural optimization technology has ushered in vigorous development and is widely used in engineering practice. Ref. [4] used the spacecraft structure optimization system to optimize the design of a complex satellite structure, and the lightest weight and the thickness of the composite sheet were used as design variables, and the satellite weight was reduced by 30.6 kg. Ref. [5] The structure of the discontinuous laminated composite satellite solar wing substrate was optimized by using composite structure optimization technology, and the weight of the solar wing substrate panel was reduced by 53%. In Ref. [6], a reasonable optimization model was established for the satellite architecture structure through finite element analysis and modal test verification, and the weight was reduced by 10%. In Ref. [7], various schemes were proposed for the topology of the main frame of the space solar telescope, and the topology of the main frame was compared and optimized, and the weight of the main frame was reduced by 36% by shape optimization and size optimization. Ref. [8] optimizes the design of the composite structure of the satellite load-bearing tube, and the weight of the structure is reduced by 13.09% while meeting the requirements. A multi-objective topology optimization algorithm based on neural networks and the criterion method was studied in Ref. [9]. Based on the fuzzy theory, the multi-objective topology optimization method was used to optimize the design of the part and the dynamic performance and stiffness of the part were maximized [10]. Ref. [11] verifies the feasibility of the multi-objective topology optimization design method based on fuzzy theory and the multi-level sequence method. In Ref. [12], the compromise programming method is used to transform the multi-objective topology optimization problem into a single-objective topology optimization problem, and the optimal topology structure of the frame is obtained. In Ref. [13], the eclectic programming method was used to optimize the multi-objective topology of auto parts, and the optimal design of parts was realized. Based on the compromise programming method and the reciprocal method of the eigenvalue of the penalty factor, the multi-objective topology optimization design of the control arm was carried out in Ref. [14], and finally, the weight reduction of the structure was realized while the natural frequency of the structure was increased. Based on the genetic algorithm for the multi-objective topology optimization design and size optimization design of the bus body frame, the torsional stiffness was increased by 13.14%, while the weight of the body frame was reduced by 3.43% [15]. Ref. [16] used the KLS formula to optimize the multi-objective topology of multi-structure components in the automation industry based on the genetic algorithm, and the results show that the KLS formula can effectively reduce the number of multi-objective topology optimization designs and make them independent of the mesh size. The above-mentioned researchers have applied the topology optimization method to the lightweight design of the space agency and obtained a good weight reduction effect, but most of them only consider a single important working condition or use the multi-objective topology optimization method to optimize the corresponding structural parts in other fields and do not fully consider the problem of multi-objective topology optimization design under the complex working conditions suffered by the space agency in the whole life cycle.
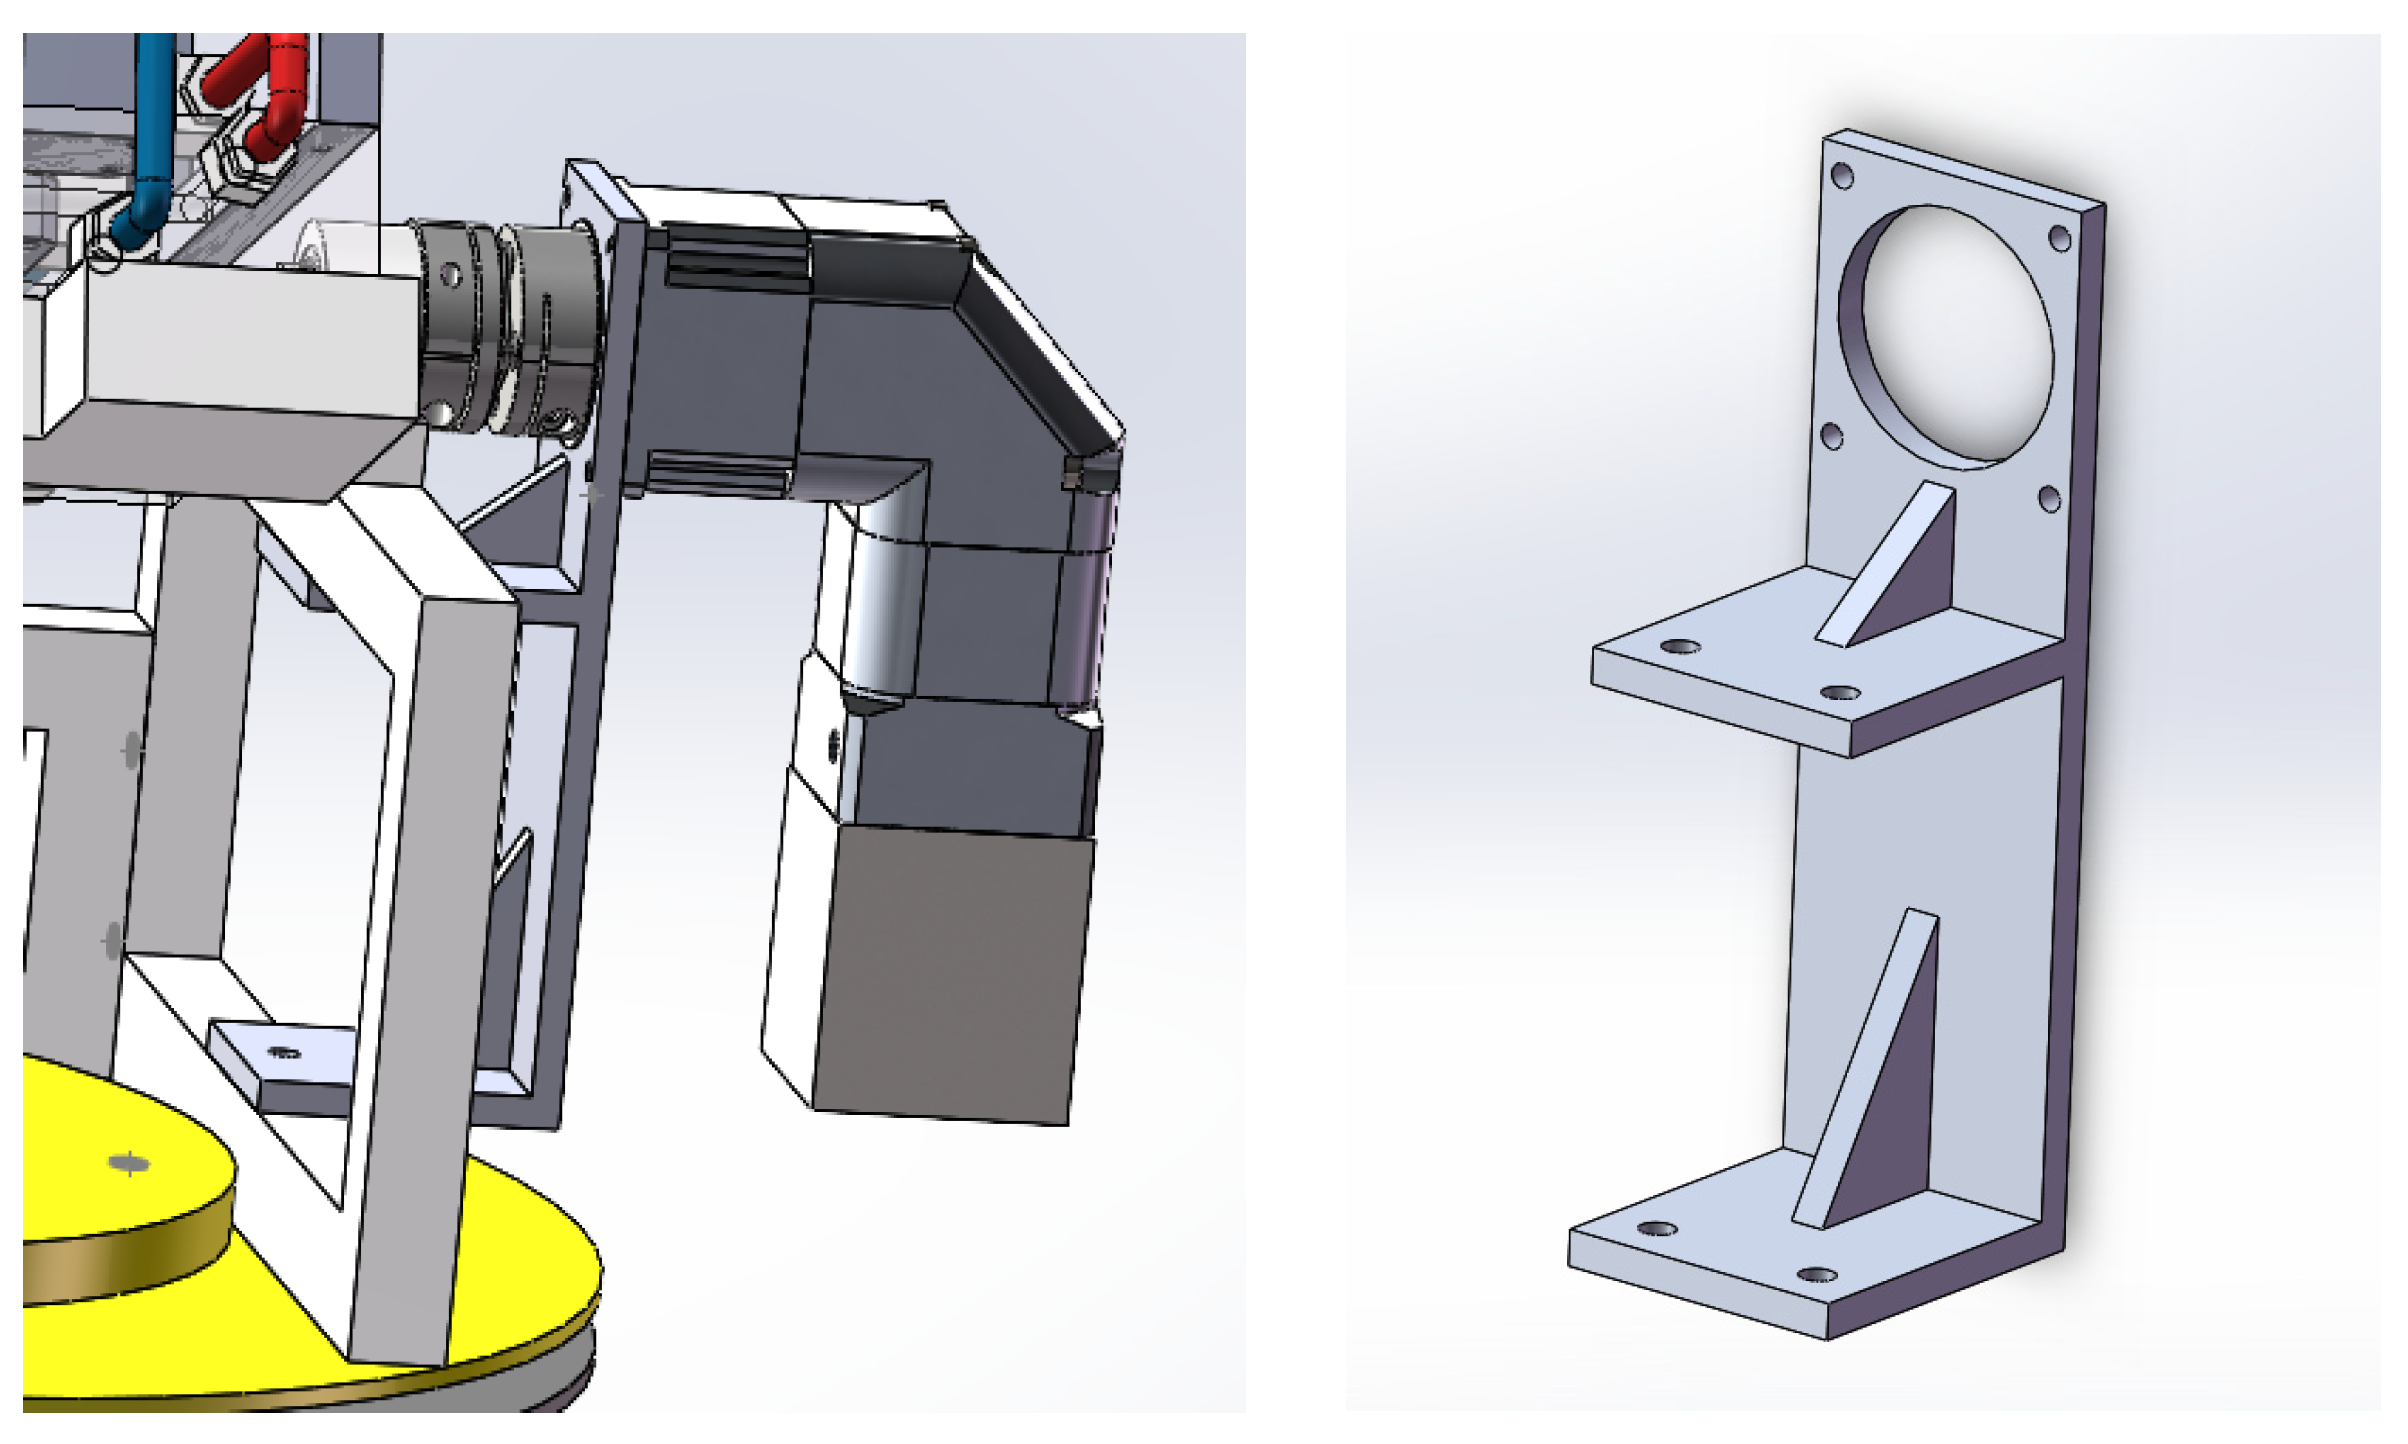
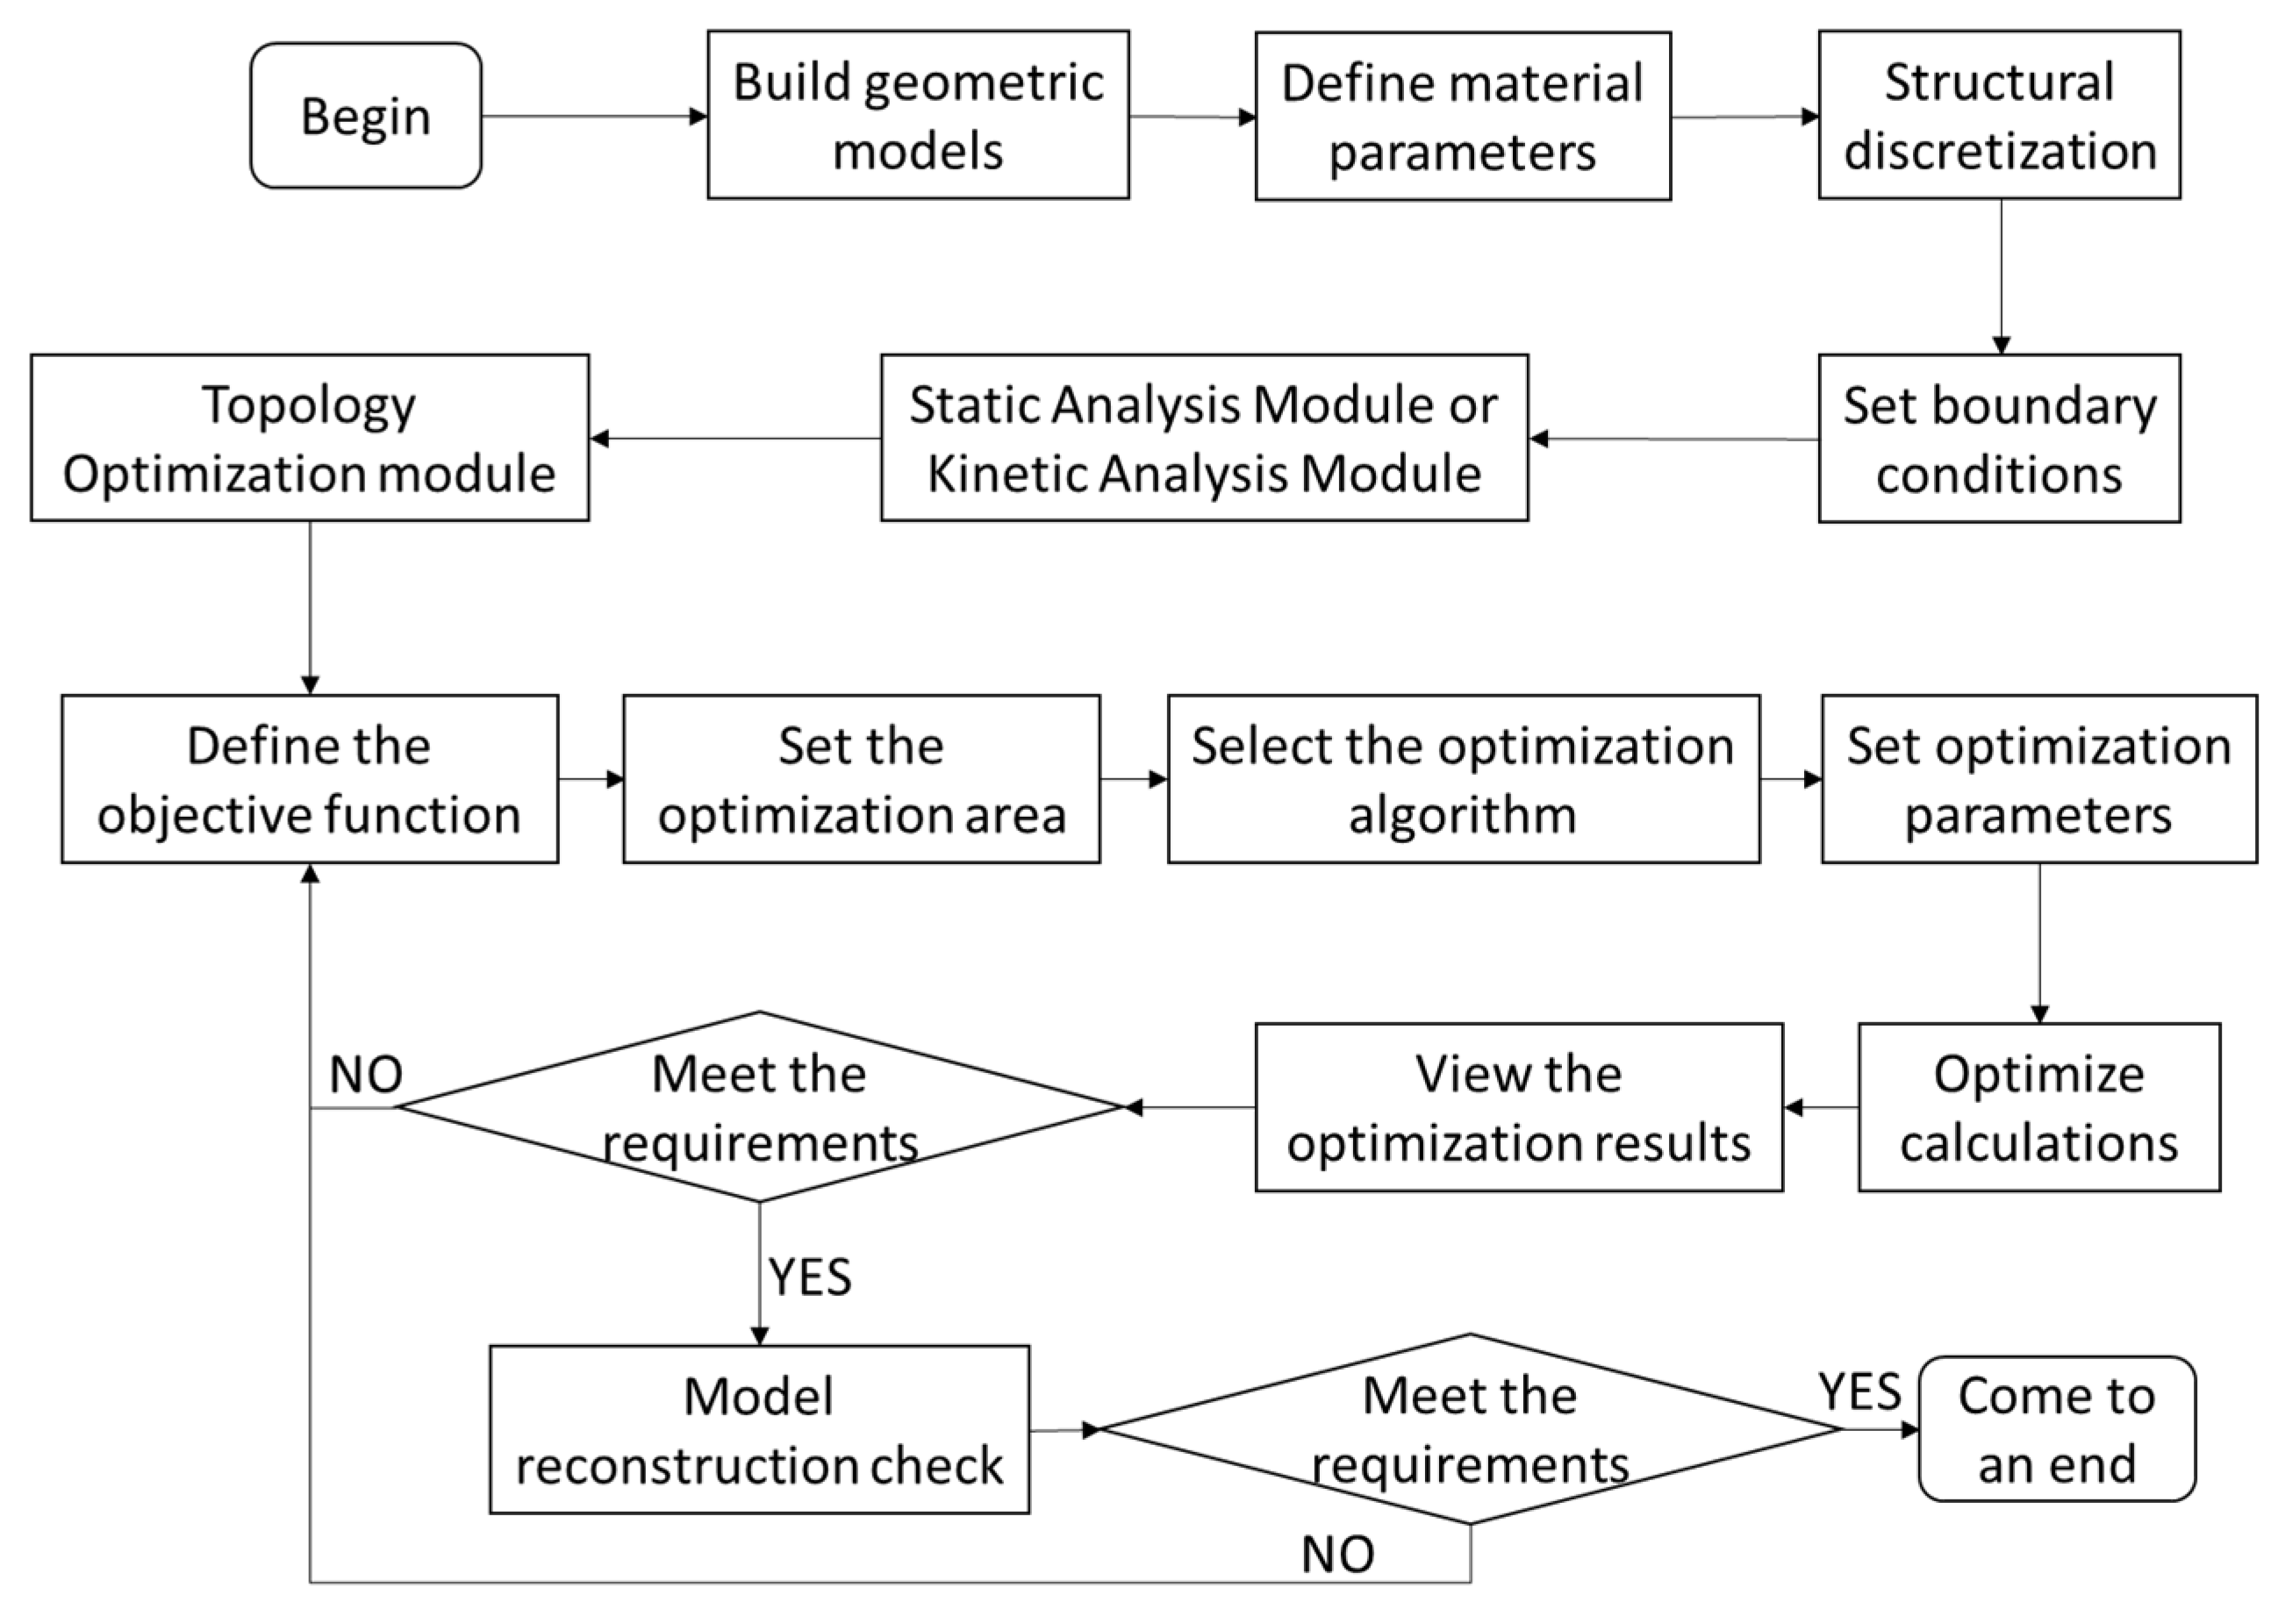
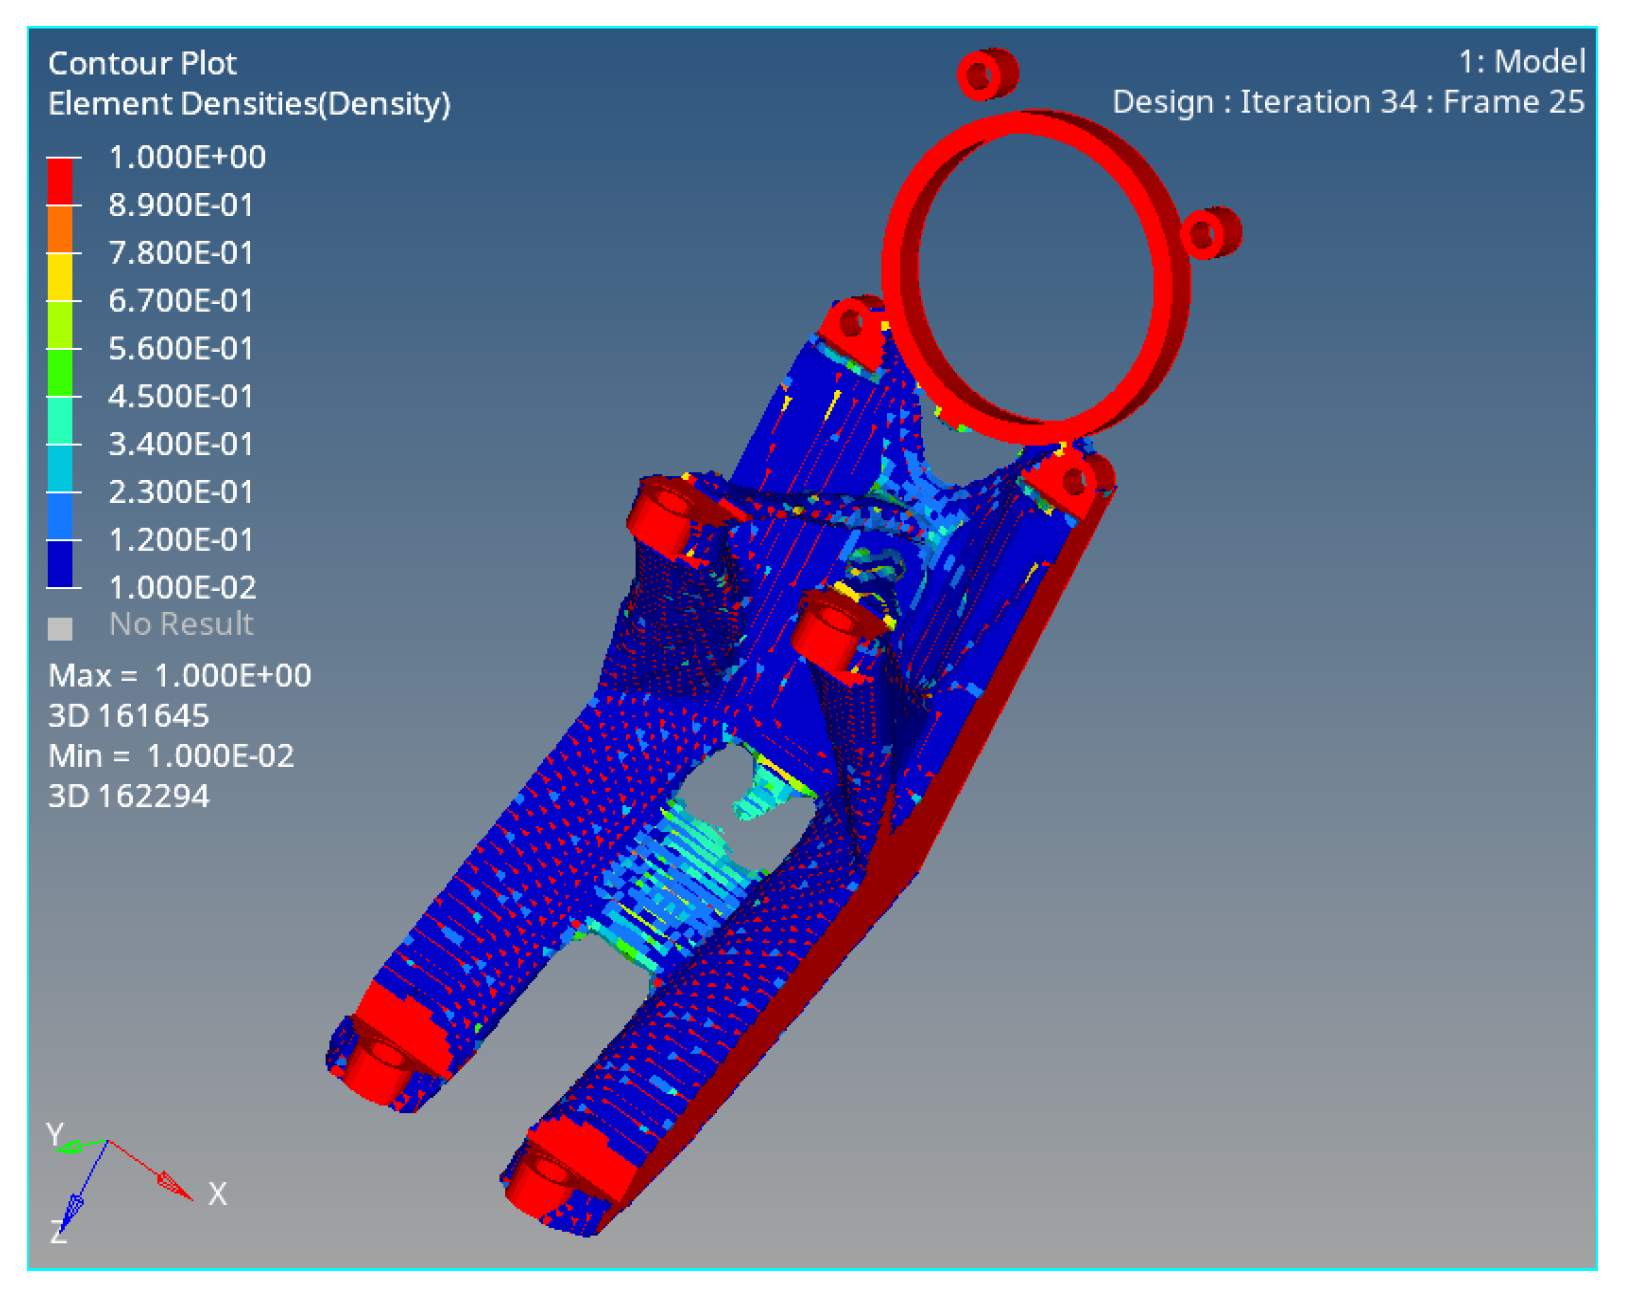
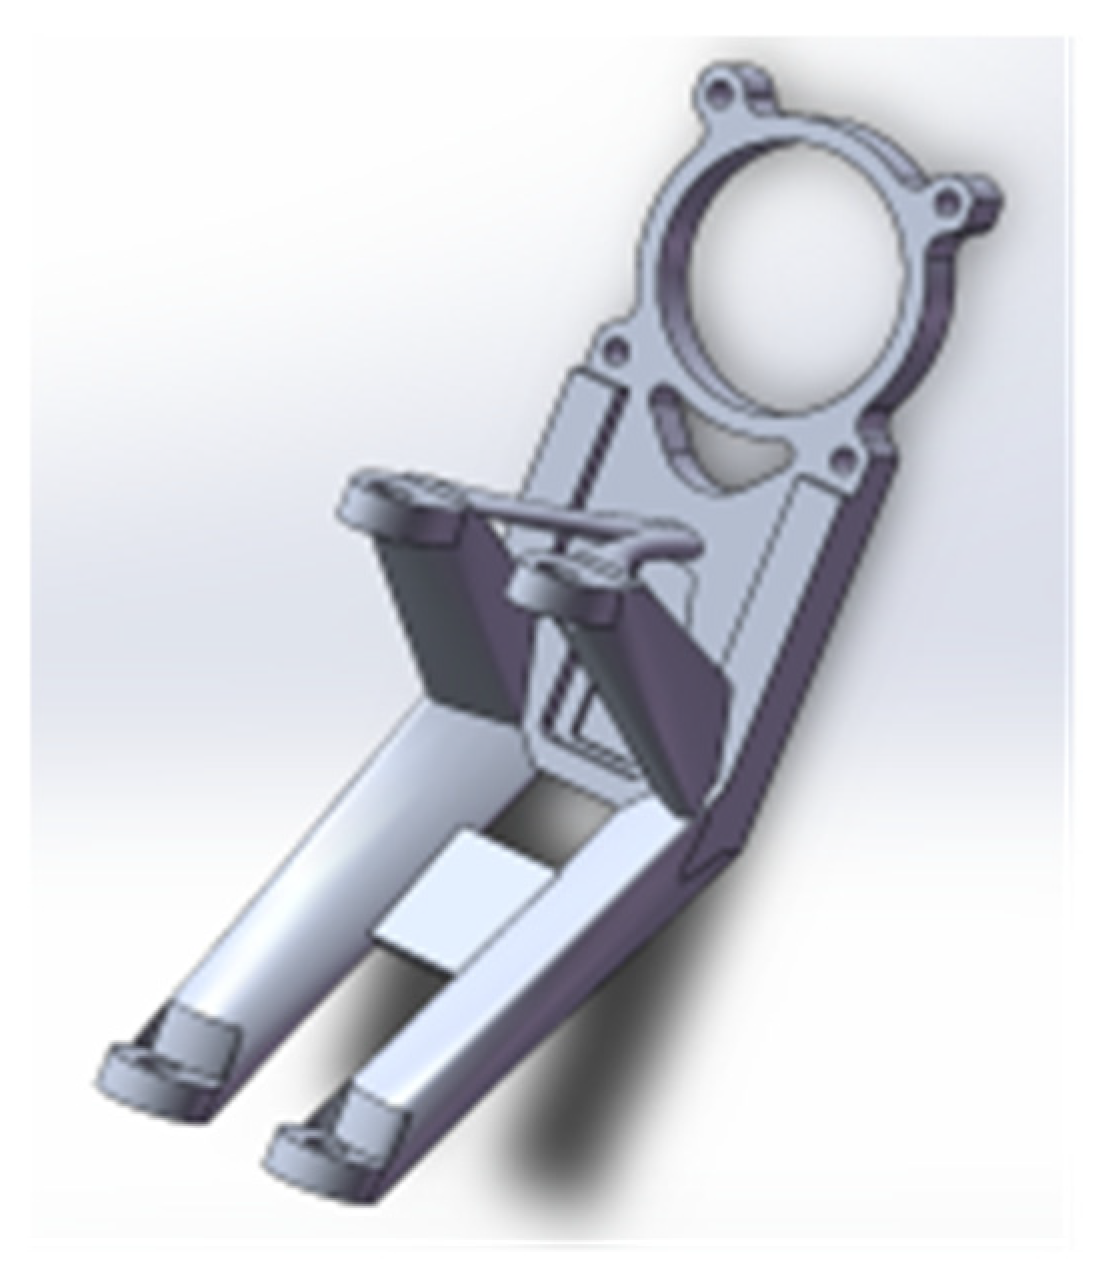
Based on this, the structural optimization design method is applied to the lightweight design of a spatial structure. Considering the complex working conditions of the spatial structure, the weight reduction of the structure is taken as the goal, the multi-objective topology optimization method is used to find the optimal force transmission path of the spatial structure, and the basic model of the spatial structure is obtained by interpreting the optimization results and geometric reconstruction. The performance of the spatial structure under extreme operating conditions is analyzed and explored, and the performance of the spatial structure, such as stiffness, dynamic response, and stability, is investigated to prove the rationality of the lightweight design.

2. Optimization Theory and Complex Operating Conditions

2.1. Variable Density Method and Interpolation Model

Topology optimization is more difficult than material optimization, but it is a very dynamic research direction in structural optimization design. With the continuous development of continuum topology optimization techniques, the following mature and widely used topology optimization methods have emerged: homogenization method [17], variable density method (VDM) [18], level set method (LSM) [19,20,21], movable deformable component method (MMC) [22,23], and progressive structure optimization method (ESO) [24]. The above-mentioned homogenization method has the problems of too many design variables and too complicated calculations, and the progressive structure optimization method has the shortcoming that it is not easy to converge during calculation iterations. Compared with the above methods, the variable density method has many advantages, such as a small number of design variables, high calculation efficiency, and a simple and easy-to-learn program. In this paper, the variable density method (VDM) is selected as the optimization method.
The variable density method is one of the topology optimization methods extended by the homogenization method, which was proposed by Bendsoe [25] in 2021 and Rozvany [18] in 2025 and used for topology optimization of continuum structures. The main ideas are as follows: the artificially conceived variable density material is introduced into the design domain to replace the homogenization theory of the single-cell microstructure, and assuming that there is some functional relationship between the variable density and the Young’s modulus of the material, the pseudo-density value of the topological optimization model is taken as [0, 1]: the element pseudo-density of 0 indicates that there is a void at the element; if the element pseudo-density is equal to 1, the element is solid; if the element density is close to 0.5, then it is necessary to introduce a power exponential penalty term to punish the median value so that the median value can be better approached to the two ends of 0 and 1. Changing the penalty factor p value can obtain different intermediate density penalty results.

SIMP Interpolation Model

The SIMP (Solid Isotropic Material with Penalization) method is a density-stiffness interpolation model based on the solid isotropic material penalty model, which is a typical variable density method and is widely used in the optimal design of structural topology. In 2001, Sigmund [26] developed a 2023b version MATLAB algorithm program based on the SIMP method, which has become one of the most popular topology optimization designs, and his research field has expanded from stiffness maximization optimization design to other fields, such as geometric nonlinearity problems [27], multi-physics coupling problems [28], and continuum structure vibration problems [29]. The functional relationship between the modulus of elasticity and the relative density of a material is as follows:
E P x i = E m i n + x i P ( E 0 E m i n )
where x is the relative density of the element, P is the penalty factor, E 0 is the elastic modulus of the material before the penalty, and E m i n is the elastic modulus of the material at the hole in the structure, and its value is a minimum value equal to about 0. It can be obtained after simplification:
E p ( x i ) = x i p E 0

2.2. Complex Case Analysis

The original design of the connecting frame mainly relied on the experience of the designer, and the utilization efficiency of structural materials was not high. Structural optimization focuses on the material layout and force transmission path of the connecting frame other than the connection part. Solidoworks 2019 was used to model the connection frame in 3D. The assembly relationship of the connecting frame, the motor, and the bracket, and the installation space and the structure of the connecting frame are shown in Figure 1.
The environment in which the connector is located is complex and harsh, such as the transportation, launch, and operation of spacecraft. The three main working conditions of the connecting frame were selected as the focus of structural optimization consideration, and the working conditions of the connecting frame were simplified for the completion of the follow-up study. According to the aerospace structure, typical working conditions are selected in the whole life cycle. The maximum acceleration of the spacecraft during the launch is 20 g, and at this time, 20 times (280 N) of the net force of the external attachment of the motor on the connecting frame is mainly considered as the static load condition; in the space operation environment, the connecting frame will be affected by thermal radiation (the temperature is about 100 °C when the sun is irradiated, and the temperature is about −50 °C when the sun is shining); at the same time, the connecting frame is subjected to the structural vibration induced when the rocket engine is working stably (20~2000 Hz), and the first 6 modes are considered as dynamic load conditions. Table 1 shows the three typical operating conditions.
The various working conditions subject to the connecting frame mentioned above are shock load, thermal load, and external excitation load. The dynamic solution is calculated by taking the load of 600 times the weight of the motor applied to the four threaded connections on the upper part of the connecting frame. Take the center of the four RBE center points as the application point of the force. The direction is positive on the Z-axis, and the magnitude is 8614 N. Constrained by four bolted connections to the bracket. This is shown in Figure 2.
After simplifying the effects of thermal radiation, they are loaded into the connection frame in the form of thermal loads, and then the thermal stress simulation analysis and topology optimization are carried out. The reference temperature is 100 °C, and the temperature load is set to −50 °C, as shown in Figure 3 below.
The modal simulation analysis of the connecting frame was carried out to obtain the first six natural frequency values to ensure that the low-order natural frequencies of the connecting frame met the design requirements after weight reduction optimization. The details are as follows in Figure 4.

2.3. Multi-Objective Topology Optimization Process

Before optimizing the structural topology, it is first necessary to ensure the completeness of the structural analysis, such as the type of input material, the setting of boundary conditions, and the loading of loads. HyperWorks 2019 and 2020 finite element analysis software were used to analyze and optimize the statics module and dynamics module of the finite element model. And the optimization solver HyperWorks was selected to analyze and construct the model with sensitivity, and the optimal results were obtained iteratively. Figure 5 shows the topology optimization process of the connecting frame.

3. Structural Optimization Simulation Analysis

3.1. Optimize the Iteration Initial Configuration

The configuration of the connecting frame is restricted by the position of the surrounding pipelines, brackets, and motors, and the initial model of topology optimization iteration is based on the following aspects: the connecting frame will not interfere with the motor, the bracket, and the pipeline and leave a gap; ensure that the connecting frame has a certain reserved space in the installation and disassembly process; and the structural characteristics of the connecting frame, the part and direction of the load, and the space required to support the motor. From the application point of view, the connection between the connecting frame and the bracket and the connection between the connecting frame and the motor are in position, size, and form all retain the original parameters. Because the optimal force transmission path of the connecting frame is required, the original empirical design model spatially limits the solution of the optimal path, so the solvable space of the model is increased as much as possible under the premise of satisfying the functions of the main parts of the connecting frame, so the optimal optimized initial model that can better find out the conditions is established. The simulation material is ALSI10Mg. The design and non-design regions of the initial configuration are represented in purple and blue, as shown in Figure 6.

3.2. Static Load Simulation and Optimization

For static load optimization problems, since flexibility can be correlated with structural strain energy, the maximum stiffness is converted into the minimum flexibility, making the solution in the finite element easier. The finite element node displacement equation can be obtained as follows:
c = f δ c = F T u F = k u
where c is the structural strain energy; f is the external force; δ is nodal displacement; F is the external force vector; u is the nodal displacement vector; k is the node stiffness matrix. The unit density is used as the design variable, the volume is used as the constraint, and the minimum flexibility is the objective function, and the mathematical model is as follows:
x = x 1 , x 2 , , x n , T m i n C x = U T K U = i = 1 n x i p u i p k 0 u i V x = i = 1 n x i v i α V 0 0 < x m i n x i x m a x , i = 1,2 , , n
where x i is the relative density of the elements; C is the overall flexibility of the structure; U is the displacement matrix; p is the penalty factor; K is the structural stiffness matrix; u i is the unit displacement column vector; k 0 is the element initial stiffness matrix; V 0 is the initial volume of the structure; α is the upper bound limit of the volume fraction; v i is the initial volume of the unit; and x m i n is the lower bound of the design variable.
The load of 20 times the weight of the motor loaded at the 4 threaded joints on the connecting frame was taken as the static load, and the static solution was carried out. The results of the connection frame analysis are shown in Figure 7. The left figure is the deformation contour of the connecting frame, and the right figure is the equivalent stress contour. The maximum deformation of the connecting frame is 3.58 × 10⁻² mm, which appears at the top of the connecting frame. The equivalent force diagram of the connecting frame is shown in Figure 7. The maximum stress occurs at the bolted connection between the connecting frame and the bracket, and the maximum value reaches 2.08 MPa, and the connecting frame has a high safety factor under static load conditions. The results before and after optimization showed that the minimum compliance value was 1.78 × 10⁻¹ and the maximum compliance value was 3.40 × 10⁻¹.

3.3. Thermal Load Simulation and Optimization

In order to establish the topology optimization model of the thermal load of the spatial structure, the thermal intensity of the spatial structure is expressed by the strain energy as the objective function, and the material volume fraction in the design domain is used as the constraint, and the optimization model is established as follows:
F i n d     x = x 1 , x 2 , , x n , T M i n     C x = D T W s . t . V x = i = 1 n x i v i α V 0 D = J W 0 < x m i n x i x m a x , i = 1,2 , , n
where x = x 1 , x 2 , , x n , T is the element density variable; V 0 is the volume of the structure before optimization; V is the structure volume after topology optimization; W is the global node temperature vector of the model, D is the external heat load vector, J is the global heat conduction matrix, and x m i n is the lower limit of density.
The effects of thermal radiation are simplified and loaded onto the connection frame with thermal loads, and then the thermal stress simulation analysis and topology optimization are performed. The results of the thermal deformation analysis of the connecting frame are shown in Figure 8, and the maximum deformation is 3.69 × 10⁻¹ mm, which occurs above the connecting frame. The thermal stress analysis results of the connecting frame are shown in Figure 8. The left image is the thermal deformation contour of the connecting frame, and the right image is the thermal stress contour. The maximum equivalent stress is 583 MPa, which appears at the model constraint and the threaded connection, which is due to the expansion and deformation of the connecting frame under the thermal load, and the threaded connection at the constraint position extrudes each other; therefore, the position with greater stress is the installation position of the connecting frame. The results before and after optimization show that the minimum compliance of the connecting frame is 124,014 and the maximum compliance is 604,992 under thermal load.

3.4. Modal Simulation and Optimization

However, the following problems often arise in the optimization process: when the frequency of one order reaches the maximum value, the frequency of other orders may drop to a lower value, and the order of the frequency orders may be reversed. This creates the problem of oscillation of the objective function. In order to overcome the existing oscillation phenomenon, the average frequency formula is used to define the objective function of natural frequency topology optimization. The mathematical model is as follows:
f i n d   x = x 1 , x 2 , , x n T max λ x = λ 0 + η r = 1 s ω r λ r λ 0 1 s . t .     V x V 0 f K x λ r M x β r = 0 r = 1,2 , , n
where λ x is the average frequency; λ r is the characteristic frequency of order r ; λ 0 and s are the parameters that need to be set; s is the order of frequency; ω r is the weighting coefficient of order r ; f is the upper limit of the volume fraction and M x is the element mass matrix; β r is the eigenvector corresponding to the r-order eigenvalues; Parameter η = 1 ,   λ 0 = 0 .
The first-order eigenvalues of the connecting frame are obtained through modal analysis, and the low-order natural frequencies of the optimized structure meet the design requirements (the first-order frequency is greater than 2000 Hz) under the premise of ensuring the weight reduction of the connecting frame. The results of the analysis are shown in Figure 9. Figure 6 shows the modal shape diagram of each order of the connecting frame in turn.
The eigenvalues of the first six orders are shown in Table 2. Based on the average eigenvalue formula, the mean value of the first 6 orders of the model before topology optimization is 4608. The results before and after optimization show that the first-order natural frequency values of the connecting frame are λ m a x = 2216   H z and λ m i n = 1467   H z under vibration load.

3.5. Multi-Objective Programming

Multi-objective topology optimization mainly considers that the target has structural displacement, stiffness, and low-order frequency, which should not only have sufficient stiffness of the structure but also make the low-order natural frequency meet the requirements and have a high safety factor so as to make the mechanical properties of the structure excellent. The difficulty of multi-objective optimization is how to unify multiple objective function dimensions. The optimal values of single-objective topology optimization under three working conditions are calculated respectively, and the mathematical model of multi-objective topology optimization of static stiffness and dynamic vibration frequency is defined by using the compromise programming method according to Equations (4)–(6) with the construction function minimization as the objective function and the volume fraction, maximum deformation, and stress as constraints:
f i n d   x = x 1 , x 2 , , x n T minF x = ω P i = 1 n ω i C i x C i m i n C i m a x C i m i n P + 1 ω P λ m a x λ x λ m a x λ m i n P 1 P s . t .     V x V 0 f K x U i = F i , i = 1,2 , , n K x λ r M x β r = 0 ,   r = 1,2 , , n J x W k = D k , k = 1,2 , , n
where F x is the comprehensive objective function; ω is the static load case weight coefficient; 1 ω is the weight coefficient of the dynamic load case; C i m a x is the maximum flexibility value; C i m i n is the minimum flexibility value; ω i is the weighted value between operating conditions; λ m a x is the average frequency maximum; and λ m i n is the average frequency minimum.

3.5.1. The Analytic Hierarchy Process Determines the Weight Coefficients

When establishing the multi-objective topology optimization function, the conventional method mainly gives the importance value of each working condition based on the design experience, and the weight coefficient is used as the qualitative judgment value to be very wrong. To solve the problem, using the analytic hierarchy method, construct a decision matrix A = a i j n × n , n is the number of working conditions, compare the i and j working conditions, and a i j is the comparison result of the importance of element i and element j . The decision matrix is written as follows:
A = 1 a 1 n a n 1 1
When the weight coefficient is determined by analytic hierarchy, the decision matrix consistency test is essential. To measure the alignment of the decision matrix, Saaty defines the following consistency metrics:
C I = λ m a x n n 1
where: C I is the consistency indicator; λ m a x is the maximum eigenvalue of the matrix; n is the order of the matrix.
When C I = 0 , the decision matrix is consistent; the greater the C I , the greater the inconsistency. Saaty’s consistency ratio C R specifies the acceptable range of inconsistency, the order is greater than 2, and the consistency ratio is as follows:
C R = C I R I < 0.1
Then consistency is accepted. Formula: R I is the consistency index of the randomly generated matrix, as shown in Table 3.
The load conditions applied to the connecting frame are overload load, thermal load, and vibration load three working conditions, n = 3 , and the importance of the working conditions is compared. The resulting decision matrix is as follows:
A = 1 1 / 9 1 / 7 9 1 9 / 7 7 7 / 9 1
The maximum eigenvalue of the matrix is 3, and according to Equation (10), when C I is equal to 0, the matrix is consistent. The eigenvectors corresponding to the maximum eigenvalues are (0.0874, 0.7863, 0.6116)T, and the weight coefficients of the three working cases are 0.0874, 0.7863, and 0.6116, which are brought into the objective function formula. The stiffness weight coefficient ω is 0.6, the frequency weight coefficient is 0.4, and the weight coefficient of static load and thermal load is determined according to the importance of the working condition and the analysis of the simulation results above. The weight coefficient of static load is 0.1, and the weight coefficient of thermal load is 0.9.

3.5.2. Multi-Objective Programming Function Solving

Combined with the analysis of static load, thermal load, and vibration load in the first three sections, a multi-case mathematical model based on the SIMP method is established, and the weight coefficients of each case are decomposed according to the analytic hierarchy process. The final established function is as follows:
minF x = 0.6 2 0.1 2 x 1 0.178 0.340 0.178 2 + 0.9 2 x 2 124014 604992 124014 2 + 0.4 2 2216 x 3 2216 1467 2 0.5
Based on the above calculation results, the multi-objective topology optimization of the connecting frame is carried out. Regarding the setting of response and constraint, the static load optimization and thermal load optimization compliance values are extracted respectively to ensure the stiffness strength of the connecting frame, the first-order modal value is extracted during the vibration load analysis to ensure the dynamic performance of the connecting frame, the material yield limit is obtained as a constraint condition according to the material selection of the connecting frame (ALSI10Mg), and the upper limit is 505 MPa to ensure that the connecting frame has a high safety factor. Considering the mass relationship between the empirical design model and the initial model and the lightweight requirements of the realized structure, the volume fraction of 0.2 was finally taken as the global constraint. According to the single-target topology optimization results of the connecting frame under the thermal load condition, the node displacement at the installation position of the connecting frame is taken as the constraint condition, and the upper limit is 0.35 mm. Finally, the minimum value of the evaluation function constructed above is taken as the optimization objective function. Considering the connectivity and manufacturability of the connecting frame, the topology optimization element density threshold was taken as 0.3. The threshold value is in the range of 0.3, and the structural change is relatively stable, which is judged to be an ideal structure, and the topology optimization results are shown in Figure 10 after 34 iterations of the final convergence. The boundaries of the material are relatively clear, which provides an important reference object for the reconstruction of the model in the later stage.

4. Comparative Analysis of Optimization Results

4.1. Geometry Model Reconstruction

The results of topology optimization design are mainly used as a reference in the conceptual design stage, and the boundaries are mostly non-smooth structures, after the corresponding boundary smoothing processing, they become a model that can be recognized by the CAD system, and then the CAD system reconstructs the smooth model and constructs a parametric model. The basic criterion of model reconstruction is to retain important structural features and ignore minor structural features, and there will inevitably be some deviations between the reconstruction model and the optimization results. The reconstruction of the model is mainly divided into the following three steps:
  • Smooth the selected configuration to obtain its outline;
  • On the basis of the outline, the main features of the model should be retained to the greatest extent, and the geometric entity should be restored as much as possible;
  • Improvement of local details, such as adding chamfers, etc.
The final geometry of the connecting frame is shown in Figure 11. It can be seen from this that the junction of the connecting frame and the bracket form four irregular cylinder supports; one group is connected with each other with similar plates, and one group is connected with irregular cylinders, respectively, and then jointly connected to the bottom plate. The connection between the connecting frame and the motor should be appropriately designed and simplified. The overall structure is solid, and there is no hollow structure.

4.2. Comparison of Structural Performance Before and After Optimization

The connecting frame is located on the outside of the pitching mechanism, between the bracket and the motor, which mainly plays the role of a bearing and does not need to consider the collection and discharge of gas and liquid. The total mass of the structure before optimization is 0.129 kg, and the total mass of the structure after optimization is 0.100 kg, and the weight is reduced by 22.5%. Considering the influence of the above three working conditions on the connecting frame in the whole life cycle of the space agency, according to the analysis of the simulation and optimization results above, the thermal load condition (the temperature is about 100 °C when the sun is irradiated, and the temperature is about −50 °C when the sun is shining) is compared. The stiffness and stress of the connecting frame before and after optimization are compared, and the results before and after optimization of the connecting frame are shown in Figure 12 and Figure 13. In Figure 12, the left image is the thermal deformation contour before optimization, and the right image is the thermal deformation contour after optimization. Figure 13 shows the thermal stress contour before optimization on the left and the thermal stress contour on the right.
From the above results, it can be seen that the maximum displacement occurs at the top of the connecting frame, which is consistent with the simulation results before weight reduction. The maximum deformation is 0.432 mm, which is 17.1% higher than the deformation of 0.369 mm before optimization, and the stress concentration part is also located in the restraint part of the connecting frame and the weaker part of the new design material, and the maximum local stress is 668 MPa, which is 14.6% higher than the maximum local stress of 583 MPa before optimization. Numerically, the stiffness of the reconstructed frame is reduced to a certain extent compared with the stiffness of the multi-objective optimized frame, but because it is a slow process of temperature load change under the condition of thermal radiation, the model reconstructed according to the optimization results meets the performance requirements. The main reasons for the poor optimization results under the above thermal load conditions are too many human errors are added to the reconstruction of the model of the final optimization results, and the temperature load is set to the spatial structure where the temperature difference directly acts, and the actual thermal radiation is not considered to change slowly with time, so the actual thermal stress is much smaller than the simulation result. Based on the simulation analysis results of the reconstructed frame model and the original empirical design of the connecting frame, the structural compliance of the connecting frame under the same thermal load is 13,494 and 17,269, respectively, indicating that the stiffness of the optimized structure under the thermal radiation condition is improved. According to the results of multi-objective topology optimization, as shown in Figure 14, the maximum stress is 424 MPa, which is lower than the yield value of the material of 505 MPa; the connecting frame has a high safety factor.

5. Experimental Validation

In order to better explore how multi-objective topology optimization affects the static and dynamic characteristics of the connecting frame, two mechanical comparison experiments were used to compare the results of the rigid strength (thermal deformation) and natural frequency of the connecting frame before and after optimization. The original empirical design structure of the connecting frame and the final optimized connecting frame were used as comparison specimens for experiments, and these experiments were designed to provide support for the simulation results in the previous paper.

5.1. Process Preparation

In this project, the connection frame is produced through the SLM process, the basic process of which is digitization, printing, and post-processing [30]. The connecting frame is fabricated with AlSi10Mg alloy powder (30 microns in diameter), and the main parameters of the manufacturing process are laser power, layer thickness, scanning rate, etc., as shown in Table 4. By adjusting the parameters and printing strategy, and then non-destructive testing verifies that the defects inside the connecting frame meet the requirements. In the end, the mass of the prepared connecting frame was 0.100 kg. As shown in Figure 15, it is the physical object of the connecting frame. Figure 12 shows the physical object before optimization on the left and the physical object after optimization on the right.

5.2. Comparative Experiment of Thermal Deformation of the Connecting Frame

During the experiment, the front and rear frames of the optimized connecting frame were named the original connecting frame and the optimized connecting frame, and the connecting frame was placed on the workbench to simulate the influence of the thermal load of the specimen. To determine the experimental conditions, the RK-TTD-100 incubator was used, and the temperature range was set between 0 °C and 150 °C. In this temperature range, the initial temperature and the final temperature are set, and the heat preservation is carried out for 1 h to make the specimen completely deformed. In addition, to ensure data accuracy, the device is kept warm for at least half an hour before each data acquisition.
In the experiment, the measurement method of the high-precision laser displacement sensor was adopted, and the deformation of the experimental object after constant temperature treatment was measured by using the high-precision laser displacement sensor, and the value measured by the high-precision laser displacement sensor was the deformation of the connecting frame when the upper contour of the front and rear connecting frame was optimized relative to the temperature difference of 150 °C. Ten sets of data were stored in the device and processed evenly to form the results of the thermal deformation experiment.
Taking the original connecting frame and the reconstructed connecting frame as an example, the experimental results of the deformation of the two connecting frames under the influence of thermal load are compared with the numerical results of finite element analysis. The maximum deformation data of the upper part of the connecting frame is shown in Table 5.
It can be seen that the experimental value is smaller than the numerical result, which may be caused by the thermal deformation test carried out by the connecting frame alone and not together with the whole mechanism. The relative change trend of the two sets of data are basically the same, so the experimental measured data can correctly reflect the deformation of the connecting frame, and the main factors leading to the error in this experiment are: because the measured upper end minus the motor connection, there is a gap with the theoretical upper end threaded connection motor, the workpiece temperature change error, the workpiece manufacturing error and other factors.
Through the above analysis, although the experimental data are slightly smaller than the finite element results, the two show consistent rules. Through the comparative analysis of the finite element numerical analysis results and the experimental measurement results, it is concluded that the multi-objective lightweight design of the connecting frame, considering complex working conditions, is reliable, and the credibility of the experimental data acquisition system of the connecting frame is also concluded.

5.3. Optimize the Modal Experiments of the Front and Rear Connection Frames

In the percussion method, a hammer is used to strike the corresponding part of the connecting frame to obtain an excitation force that can encompass the required frequency. The force signal is generated by the hammer when striking, and the vibration signal is picked up by the accelerometer attached to the structure and the two sets of signals are amplified by the charge adapter and stored in the dynamic signal acquisition system on the computer and analyzed. The input force signal and the output vibration response signal are recorded by the dynamic signal acquisition system, and the post-processing of the acquired signal is carried out by MATLAB programming, and the natural frequency curve of the connecting frame is obtained, and the peak abscissa value of the curve in the figure corresponds to the natural frequency of the connecting frame. The connection diagram of the modal experimental circuit of the connection frame and the supporting signal acquisition software interface are shown in Figure 16 and Figure 17, respectively, and the set parameters of the sensor can realize the simultaneous acquisition of the excitation force signal and the vibration signal after the sensor is energized.
In this experiment, the purpose of this experiment is not only to obtain the natural frequencies of the connecting frame but also to compare the finite element analysis values with the experimental values. In most experiments, the correct setting of constraints can accurately simulate the working conditions of the measured parts and reduce the interference of the corresponding errors on the experimental results. However, the experimental conditions are limited, and in order to better obtain the natural frequency of the connecting frame, the specimen is suspended on the fixed support for the hammering test. The experimental scenario is shown in Figure 18. Figure 19 shows experimental equipment such as sensors, hammers, and signal acquisition.

5.3.1. Comparison of Modal Experimental Results with Numerical Analysis

This section describes the comparison of the experimental results of the optimized connector with the results of the numerical analysis. Firstly, the signals obtained in the experiment are optimized by a series of post-processing in MATLAB to obtain the optimized two-order modal frequencies of the post-connector, and the comparison results are compared with the simulation results, which are shown in Table 6. The presentation of these data and graphs provides strong support for the objective evaluation of the optimization effect of the connecting frame structure.
The above is a list of the deviations between the numerical and experimental results, and although there are deviations between the experimental and simulated results, they are all within 15%, and the trend is similar. These deviations are mainly due to the difficulty of replicating boundary conditions, the influence of hanging mounts on modal experiments, and the possible introduction of errors due to the limitations of sensor position and number. In addition, errors in the equipment can have an impact on the results. The experimental data effectively confirm the correctness of the simulation analysis of the connecting frame structure by using the method of finite element analysis. In order to obtain relatively accurate comparative data, it is necessary to ensure the accuracy of the measurement conditions and reduce the errors caused by occasional errors and negligence by taking multiple measurements.

5.3.2. Comparative Analysis of Modal Experiments of Two Types of Connecting Frame Structures

In Table 7, the data results obtained from the first two natural frequency measurement signals of two different frame specimens after signal post-processing using MATLAB are listed.
Through the analysis of tabular data, it can be seen that the low-order frequency of the optimized connecting frame has a certain improvement compared with that before optimization; although the mass of the connecting frame is reduced by 22.5%, the first-order natural frequency value is increased by 32.1%. Figure 20 shows the natural frequency curves of the optimized front and rear connecting frames, and the abscissa values of the corresponding peaks in the curve are the low-order natural frequency values of the optimized front and rear connecting frames. The image shows the frequency response curve obtained after processing the collected frequency signal using signal processing software (MATLAB). The peaks represent the first two natural frequencies of the structure before and after optimization.

6. Conclusions

(1)
According to the topology optimization theory of the variable density method, supplemented by the compromise programming method as the multi-objective topology optimization method and the analytic hierarchy process to optimize the multi-objective topology of the connecting frame, the optimal topology structure of the connecting frame is obtained, and the topological optimization results are as follows: (1) The mass of the connecting frame is reduced from 0.129 kg to 0.100 kg, which is reduced by 22.5%; (2) The stiffness of the connecting frame under the condition of thermal radiation and the whole has been effectively improved; and (3) The first-order natural frequency of the connecting frame has increased from 1700 Hz to 1932 Hz, an increase of 13.6%.
(2)
The multi-objective topology optimization design of the connecting frame is carried out so that the connecting frame realizes the ultimate goal of lightweight under the premise of ensuring the structural performance, and the overall stiffness and dynamic performance of the connecting frame have been effectively improved, which is of great significance for enhancing the overall supporting stiffness and dynamic load performance of the transmission system and improving the operation stability. Two sets of comparative experiments verify the effectiveness of the simulation results and the rationality of using the multi-objective topology optimization design method for the lightweight design of space structures under complex working conditions.

Author Contributions

Conceptualization, F.J.; Methodology, F.J.; Validation, F.J.; Formal analysis, F.J.; Investigation, F.J.; Data curation, F.J.; Writing—original draft, P.G.; Writing—review & editing, A.M.; Visualization, F.J. and P.G.; Supervision, F.J. All authors have read and agreed to the published version of the manuscript.

Funding

This research was funded by [Shaanxi Province Bearing Digital Design and Testing Technology Innovation Service Platform] grant number [2022PT-02] and the APC was funded by [Feng Jia].

Data Availability Statement

The data that support the findings of this study are not publicly available due to privacy restrictions. However, the data are accurately recorded and owned by the authors. Requests for access to the data may be made to the corresponding author upon reasonable justification.

Conflicts of Interest

The authors declare no conflict of interest.

References

  1. Burton, R.L.; Brown, K.; Jacobi, A. Low-Cost Launch of Payloads to Low Earth Orbit. J. Spacecr. Rocket. 2006, 43, 696–698. [Google Scholar] [CrossRef]
  2. Li, Z.N. Aircraft Structure; Beijing University of Aeronautics and Astronautics Press: Beijing, China, 2010; p. 376. ISBN 978-7-512-40043-6. [Google Scholar]
  3. Dahm, W.J.A.; Allen, N.; Razouk, R.R.; Shyy, W. Challenges and Opportunities in the next Two Decades of Aerospace Engineering. In Encyclopedia of Aerospace Engineering; Blockley, R., Shyy, W., Eds.; Wiley: Hoboken, NJ, USA, 2010; ISBN 978-0-470-75440-5. [Google Scholar]
  4. Zhou, Z.C.; Qu, G.J.; Huang, H. Optimal Design of a Satellite Platform under Multi-Structure Conditions. J. Beijing Univ. Aeronaut. Astronaut. 2009, 35, 821–823, 851. [Google Scholar] [CrossRef]
  5. Sheng, C.; Zeng, F.M.; Pu, H.L. Optimization of Solar Panel Structuresby Using OptiStruct. Spacecr. Eng. 2011, 20, 63–68. [Google Scholar] [CrossRef]
  6. Xia, L.J.; Yu, Y.; Jin, X.D. Experimental Research and Optimal Design for Mode Characteristic of the Frame Structure on Satellite. J. Shanghai Jiaotong Univ. 2004, 38, 1889–1891. [Google Scholar] [CrossRef]
  7. Feng, M.; Liu, S.; Cheng, H.; Zhang, K.; Li, Y.; Yu, G.; Liu, B.; Liang, B. Multi-Objective Optimal Design for Flexible Bio-Inspired Meta-Structure with Ultra-Broadband Microwave Absorption and Thin Thickness. Chin. J. Aeronaut. 2025, 38, 103399. [Google Scholar] [CrossRef]
  8. Wang, X.; Chen, Y.; Wang, Z.; Tang, Y.; Wang, X.; Lu, C. Multi-Scale Modeling and Optimization of Single-Layer Reticulated Shell Structures Using Multi-Point Constraint and Variable Density Methods. Buildings 2025, 15, 174. [Google Scholar] [CrossRef]
  9. Shao, X.Y.; Chen, Z.M.; Fu, M.G.; Gao, L. Multi-Objective Topology Optimization of Structures Using NN-OC Algorithms. In Advances in Neural Networks—ISNN 2007; Sun, C., Zhang, H., Hou, Z., Fei, S., Liu, D., Eds.; Lecture Notes in Computer Science; Springer: Berlin/Heidelberg, Germany, 2007; Volume 4493, pp. 204–212. ISBN 978-3-540-72395-0. [Google Scholar]
  10. Wiedemann, M. System Lightweight Design for Aviation; essentials; Springer Nature: Cham, Switzerland, 2024; ISBN 978-3-031-44164-6. [Google Scholar]
  11. Luo, Z.; Chen, L.P.; Yang, J.Z.; Zhang, Y.Q.; Abdel-Malek, K. Fuzzy Tolerance Multilevel Approach for Structural Topology Optimization. Comput. Struct. 2006, 84, 127–140. [Google Scholar] [CrossRef]
  12. Fan, W.J.; Fan, Z.J.; Su, R.Y. Research on Multi—Objective Topology Optimization on Bus Chassis Frame. China Mech. Eng. 2008, 19, 1505–1508. [Google Scholar] [CrossRef]
  13. Sun, X.H.; Ding, X.H. Research on Multi-Objective Topology Optimization Design Methods for Structure. Mach. Des. Res. 2012, 28, 1–4+9. [Google Scholar]
  14. Jiang, D.W.; Rui, Z.Y. Research on Multi-objective Topology Optimization of Control Arm. Mech. Strength 2014, 36, 408–412. [Google Scholar] [CrossRef]
  15. Zhong, W.; Su, R.Y.; Gui, L.J.; Fan, Z.J. Multi-Objective Topology and Sizing Optimization of Bus Body Frame. Struct. Multidiscip. Optim. 2016, 54, 701–714. [Google Scholar] [CrossRef]
  16. Guirguis, D.; Hamza, K.; Aly, M.; Hegazi, H.; Saitou, K. Multi-Objective Topology Optimization of Multi-Component Continuum Structures via a Kriging-Interpolated Level Set Approach. Struct. Multidiscip. Optim. 2015, 51, 733–748. [Google Scholar] [CrossRef]
  17. Sanmugadas, V.; Agarwal, M.; Borwankar, P.; Kapania, R.K. Parametric Model Order Reduction for Structural Optimization of Fiber Composite Structures. AIAA J. 2025, 63, 2064–2079. [Google Scholar] [CrossRef]
  18. Dong, Y.; Hussain, I.; He, S. Structural Topology Optimization of Aircraft Wing Leading Edge Fabricated of Multilayer Composites. Aerosp. Sci. Technol. 2025, 159, 109993. [Google Scholar] [CrossRef]
  19. Li, H.; Zhang, Z.; Li, L.; Xiao, N.; Shi, H.; Tan, C. State Variable and Optimization Potential-Based Multi-Objective Optimization Method and Application in Compressor Blade Airfoil Design. Struct. Multidiscip. Optim. 2023, 66, 165. [Google Scholar] [CrossRef]
  20. Stoilova, S. An Integrated Multi-Criteria and Multi-Objective Optimization Approach for Establishing the Transport Plan of Intercity Trains. Sustainability 2020, 12, 687. [Google Scholar] [CrossRef]
  21. Pan, M.; He, D.; Pan, K. Energy Stable Finite Element Method for an Electrohydrodynamic Model with Variable Density. J. Comput. Phys. 2021, 424, 109870. [Google Scholar] [CrossRef]
  22. Guo, X.; Zhang, W.S.; Zhong, W.L. Doing Topology Optimization Explicitly and Geometrically—A New Moving Morphable Components Based Framework. J. Appl. Mech. 2014, 81, 81009. [Google Scholar] [CrossRef]
  23. Zhang, W.S.; Chen, J.S.; Zhu, X.F.; Zhou, J.H.; Xue, D.C.; Lei, X.; Guo, X. Explicit Three Dimensional Topology Optimization via Moving Morphable Void (MMV) Approach. Comput. Methods Appl. Mech. Eng. 2017, 322, 590–614. [Google Scholar] [CrossRef]
  24. Wan, C.; Jiao, H.; Lv, L.; Lu, C. Multi-Material Topology Optimization Based on Multiple Simp of Variable Density Method. J. Mech. Sci. Technol. 2024, 38, 749–759. [Google Scholar] [CrossRef]
  25. Drapała, J.; Frydecka, D.; Świątek, J. A Simple-Units Complex-Structure Neural Network Model of the Basal Ganglia to Simulate Reinforcement Learning Tasks. Procedia Comput. Sci. 2021, 192, 281–290. [Google Scholar] [CrossRef]
  26. Sigmund, O. A 99 Line Topology Optimization Code Written in Matlab. Struct. Multidiscip. Optim. 2001, 21, 120–127. [Google Scholar] [CrossRef]
  27. Li, Z.K.; Zhang, X.M. Topology Optimization of Multiple Inputs and Outputs Compliant Mechanisms with Geometrically Nonlinearity. J. Mech. Eng. 2009, 45, 180–188. [Google Scholar] [CrossRef]
  28. Cui, M.; Li, P.; Wang, J.; Gao, T.; Pan, M. An Improved Optimality Criterion Combined with Density Filtering Method for Structural Topology Optimization. Eng. Optim. 2023, 55, 416–433. [Google Scholar] [CrossRef]
  29. Kumkam, N.; Sleesongsom, S. Reliability-Based Topology Optimization with a Proportional Topology for Reliability. Aerospace 2024, 11, 435. [Google Scholar] [CrossRef]
  30. Zhang, M.; Wang, X.D.; Su, Y.D.; Guan, Z.D. Flexural Properties of Titanium Alloy Lattice Sandwich Structure. Chin. J. Nonferr. Met. 2018, 28, 457–464. [Google Scholar] [CrossRef]
Figure 1. Installation space and 3D model of the connecting frame.
Mathematics 13 02133 g001
Figure 2. Shock load loading model.
Mathematics 13 02133 g002
Figure 3. Thermal load loading model.
Mathematics 13 02133 g003
Figure 4. Total Settings Tree map.
Mathematics 13 02133 g004
Figure 5. Topology optimization process for connection frames.
Mathematics 13 02133 g005
Figure 6. Initial model of connector optimization.
Mathematics 13 02133 g006
Figure 7. Deformation contours and equivalent stress contours of the connecting frame.
Mathematics 13 02133 g007
Figure 8. Thermal deformation contour and thermal stress contour of the connecting frame.
Mathematics 13 02133 g008
Figure 9. Sixth-order modal osmomorphic diagram of the connector frame.
Mathematics 13 02133 g009
Figure 10. Configurations with cell densities greater than 0.3.
Mathematics 13 02133 g010
Figure 11. Model reconstruction of topology optimization results.
Mathematics 13 02133 g011
Figure 12. Optimization of the front and rear connection frame thermal deformation cloud.
Mathematics 13 02133 g012
Figure 13. Optimize the thermal stress cloud diagram of the front and rear connection frames.
Mathematics 13 02133 g013
Figure 14. Thermal stress contour of the optimization results of the connecting frame.
Mathematics 13 02133 g014
Figure 15. Product diagram of an additively manufactured connection frame.
Mathematics 13 02133 g015
Figure 16. Connection diagram of dynamic stiffness test.
Mathematics 13 02133 g016
Figure 17. Data acquisition interface diagram of a three-axis vibration sensor.
Mathematics 13 02133 g017
Figure 18. Diagram of the experimental site.
Mathematics 13 02133 g018
Figure 19. Experimental equipment.
Mathematics 13 02133 g019
Figure 20. Frequency response curve.
Mathematics 13 02133 g020
Table 1. Three typical working conditions.
Working Conditions123
State280 N50~100 °C20~2000 Hz
Table 2. The first 6 eigenvalues.
OrderEigenvalueOrderEigenvalue
1146744733
2334856141
3379568162
Table 3. Stochastic matrix consistency index RI reference values.
The Random Matrix Order n1234
Stochastic consistency indicator RI000.580.90
The random matrix order n5678
Stochastic consistency indicator RI1.121.241.321.41
Table 4. SLM process parameters.
Laser Power/WScan Rate/mmOpening Spacing/mmLayer Thickness/µm
12035000.10~0.01930
Table 5. Comparison of deformation values with experimental results.
SpecimensOriginal Connection FrameOptimized Rear Connection Bracket
Experimental results (mm)0.3210.407
Numerical results (mm)0.3690.433
relative error (%)13.06.0
Table 6. Comparison of the results of the optimized connecting frame.
OrderFirstSecond
Experimental results (Hz)16453046
Numerical results (Hz)19322949
relative error (%)14.93.3
Table 7. Natural frequencies of two different structural connectors.
SpecimensFirst OrderSecond OrderThird Order
Original connection frame (Hz)11002319NaN
Optimized rear connection bracket (Hz)16453046NaN
Disclaimer/Publisher’s Note: The statements, opinions and data contained in all publications are solely those of the individual author(s) and contributor(s) and not of MDPI and/or the editor(s). MDPI and/or the editor(s) disclaim responsibility for any injury to people or property resulting from any ideas, methods, instructions or products referred to in the content.

