A Deep Learning Framework of Super Resolution for License Plate Recognition in Surveillance System


Abstract
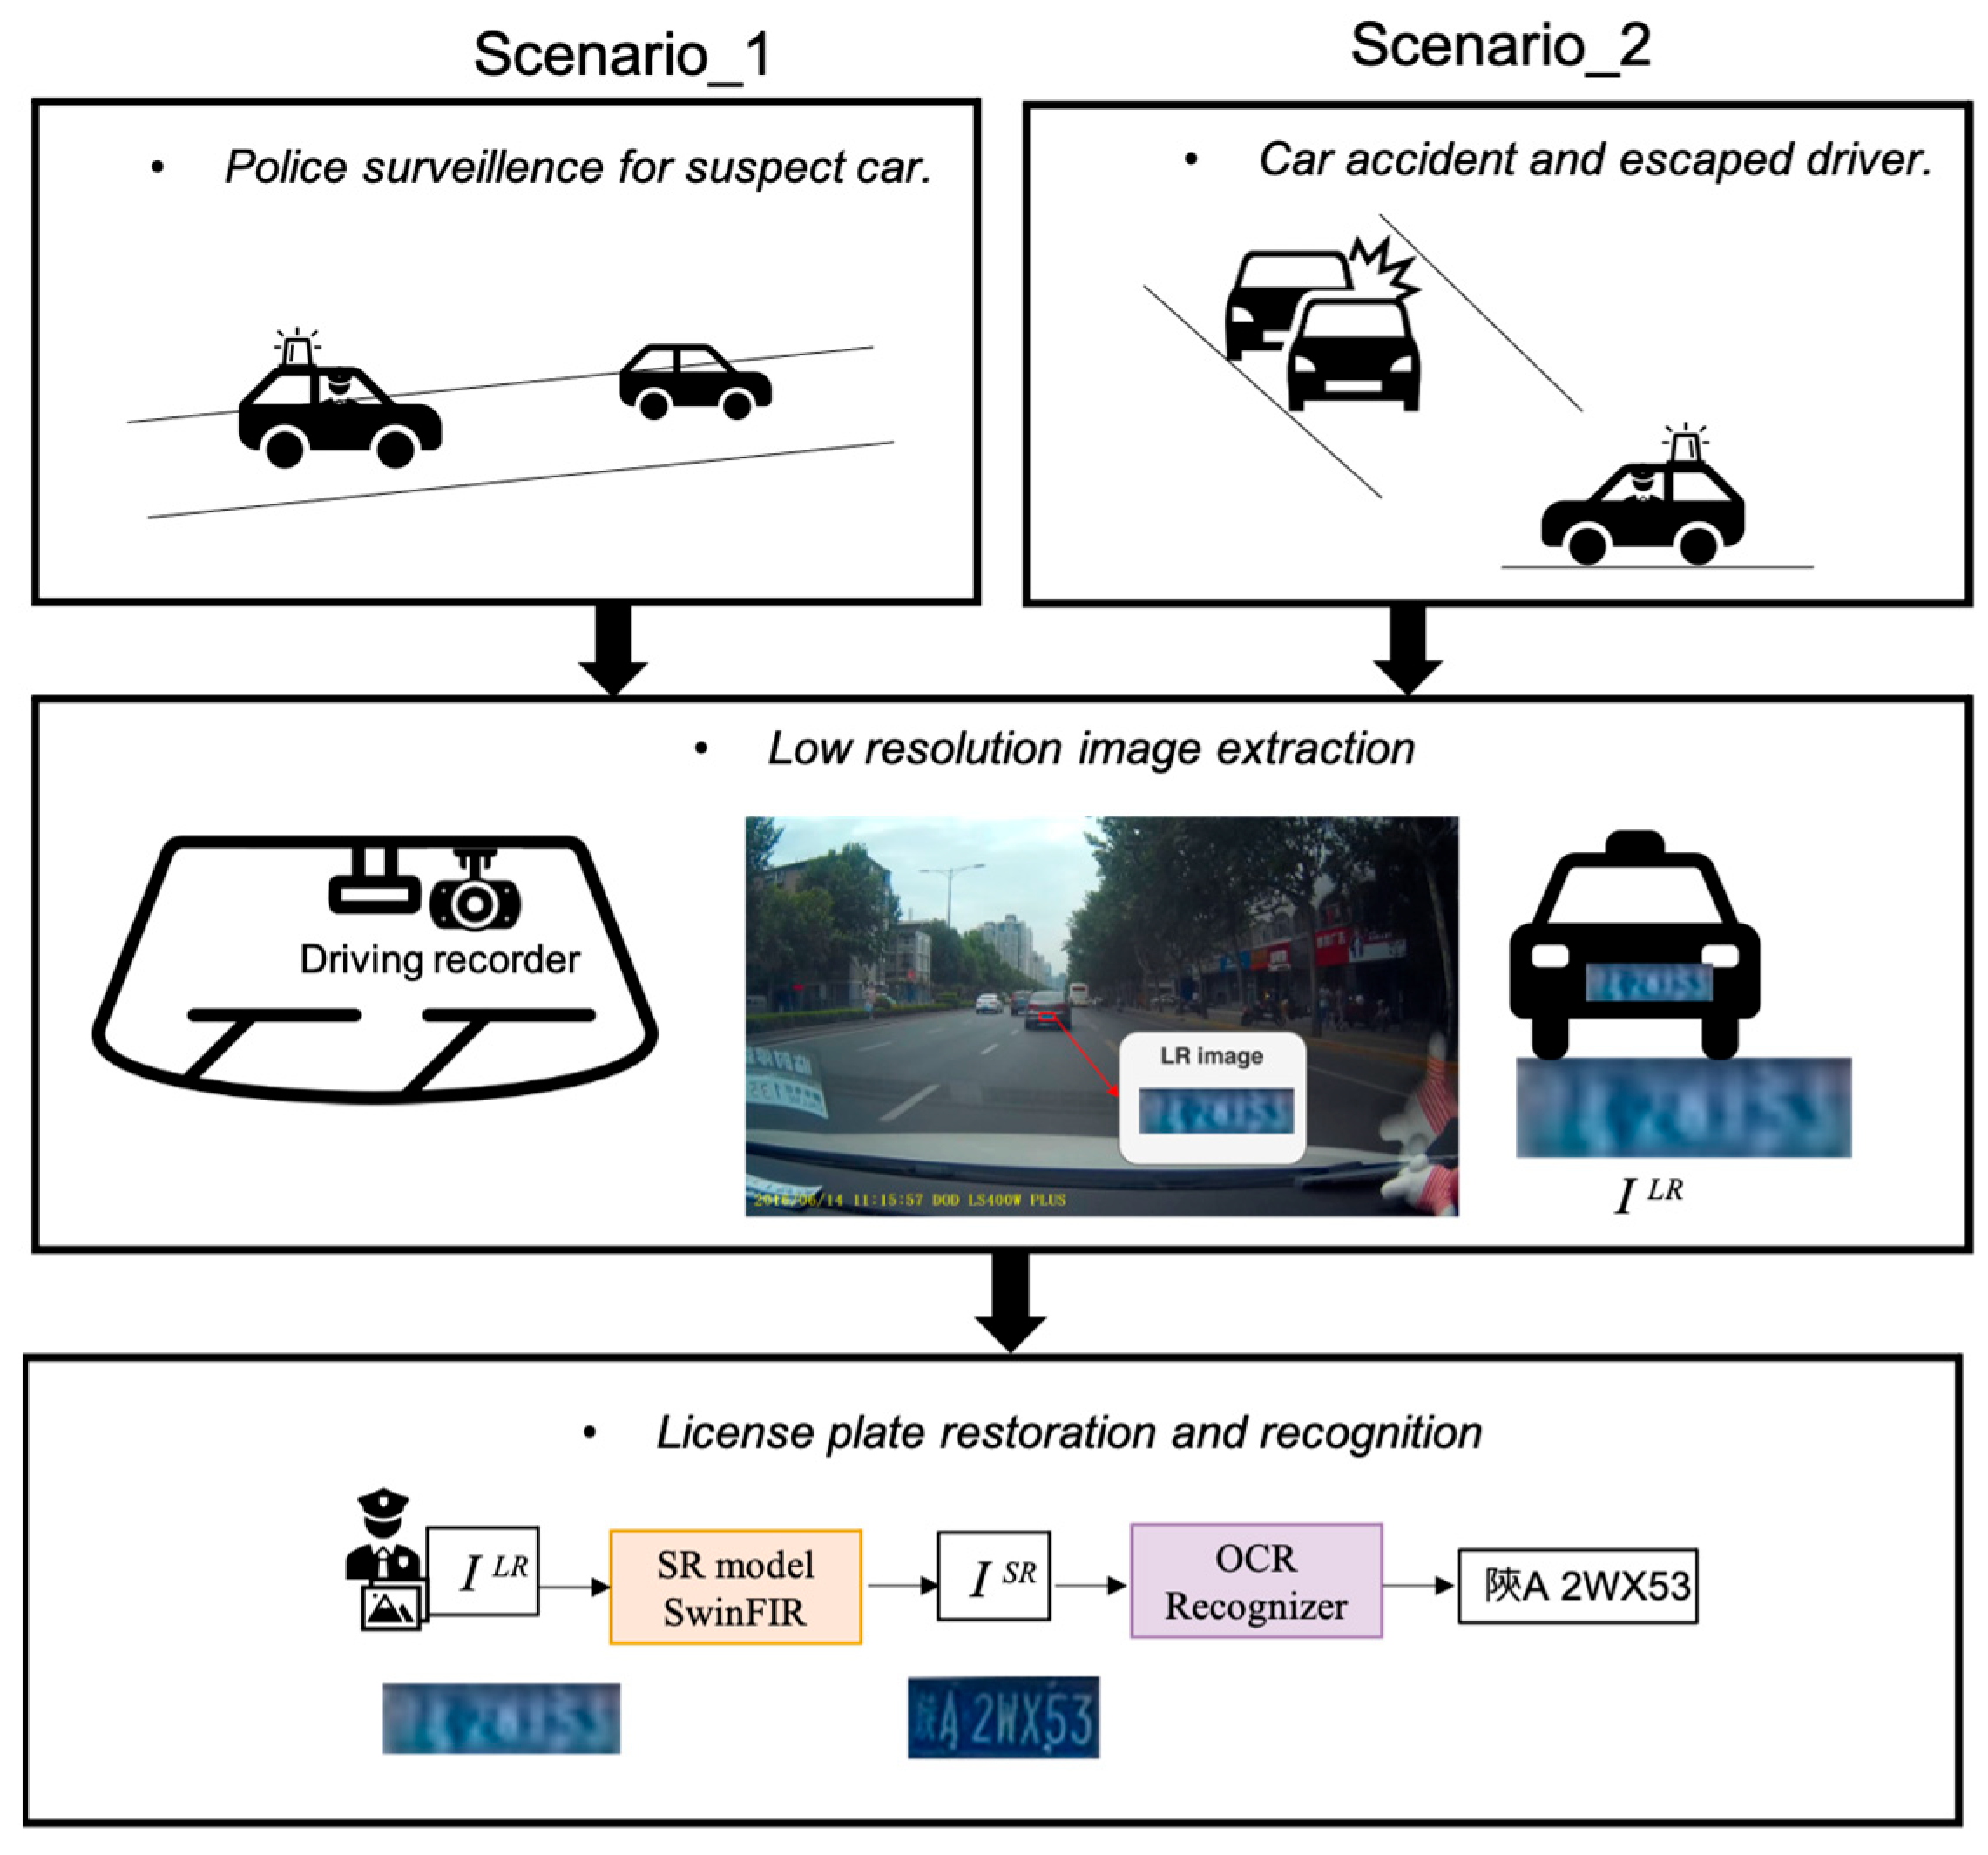
1. Introduction
2. Related Work
2.1. License Plates Dataset
- Distance variability: The dataset includes images captured from close range (e.g., toll booths) to long-range surveillance (e.g., highway cameras at 50+ meters).
- Tilt angle variability: Plates are captured from various viewpoints, including frontal, oblique, extreme tilt angles, and even partially occluded perspectives due to real-world road conditions.
- Motion blur: Unlike artificially blurred datasets, LSV-LP contains natural motion blur caused by high-speed vehicles, making it a realistic benchmark for LPR models operating under dynamic conditions.
2.2. License Plate Recognition with OCR Recognizer
2.3. Licenese Plate Restoration with Super Resolution (SR)
2.4. Perceptual Loss for Super Resolution
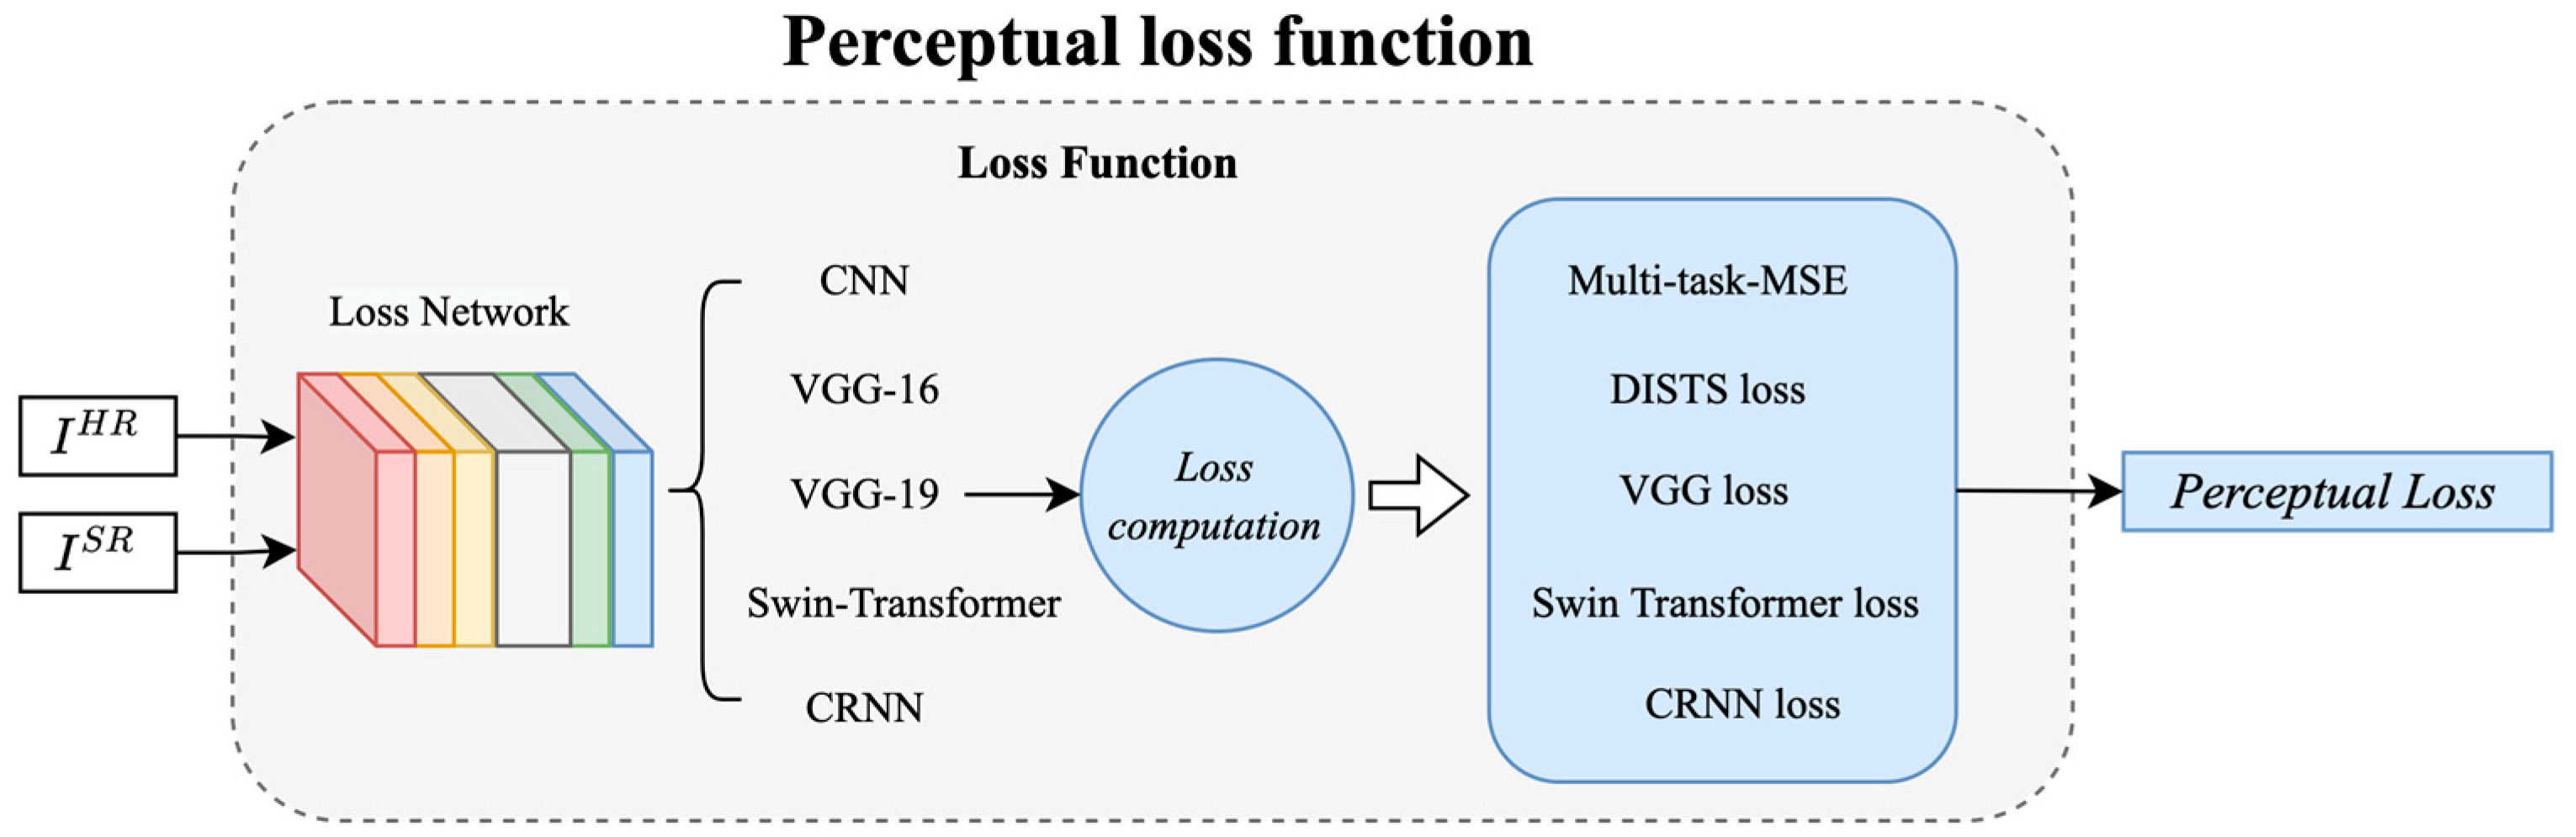
- The multi-task MSE loss function supports any OCR model for LPR, allowing the seamless integration of new models. The approach follows the multi-task model proposed by Gonçalves et al. [26] for its efficiency. By combining MSE and L1 loss, it balances structural preservation and error minimization—MSE maintains image integrity, while L1 enhances robustness and edge sharpness.
- DISTS combines structure and texture similarity, preserving both high-level content and fine details.
- Swin Transformer captures long-range dependencies, offering a strong perceptual loss by maintaining high-level semantics and global image structure.
- CRNN loss is used for text recognition tasks, helping the model align with the structural features of characters, ensuring accurate reconstruction and recognition of textual information.
3. Methodology
3.1. Overview
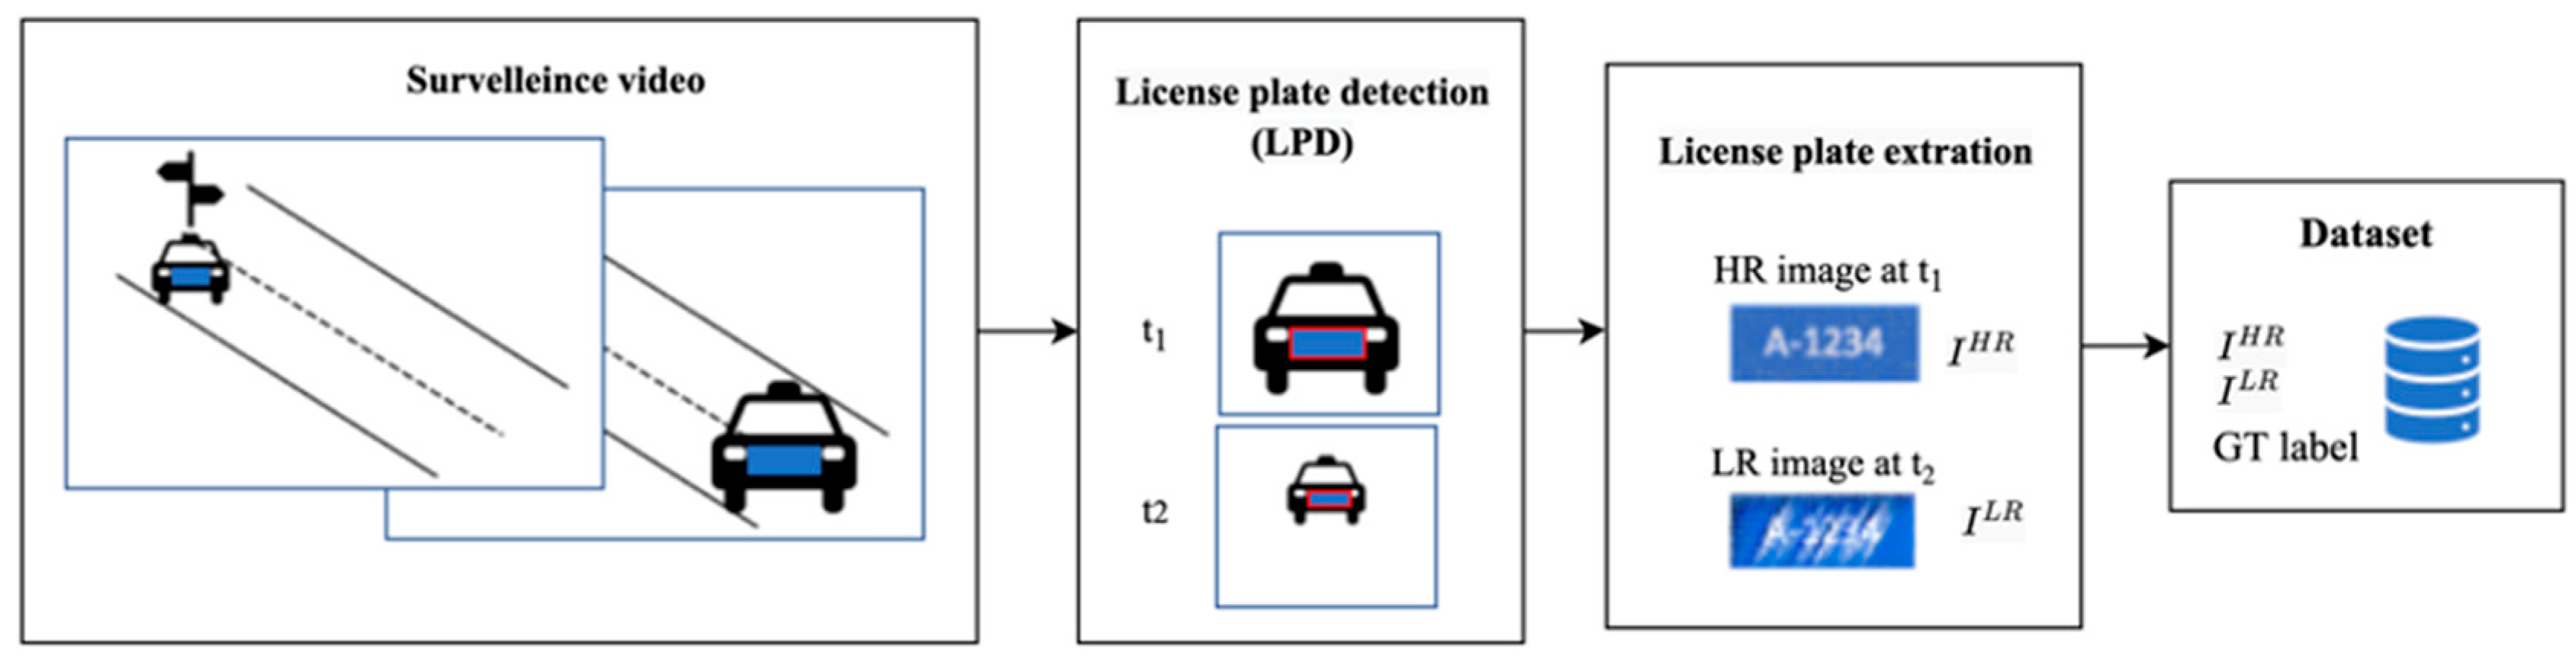
3.2. Dataset Generation
- China license plate dataset of LSV-LP [21] with seven characters.
- Data with relative motion of: move vs. move, static vs. move.
- Data pair of HR/LR images:
- ○
- HR image: Frame of near distance.
- ○
- LR image: Frame of far distance of image with OCR recognizer accuracy ≥5.
- Total images: 783 pairs of LR/HR.
- Rescale resolution: 110 × 40.
- Train, validation, test split: 7, 2, 1.
3.3. Aablation Study on PixelShuffle Three-Fold Attention Module
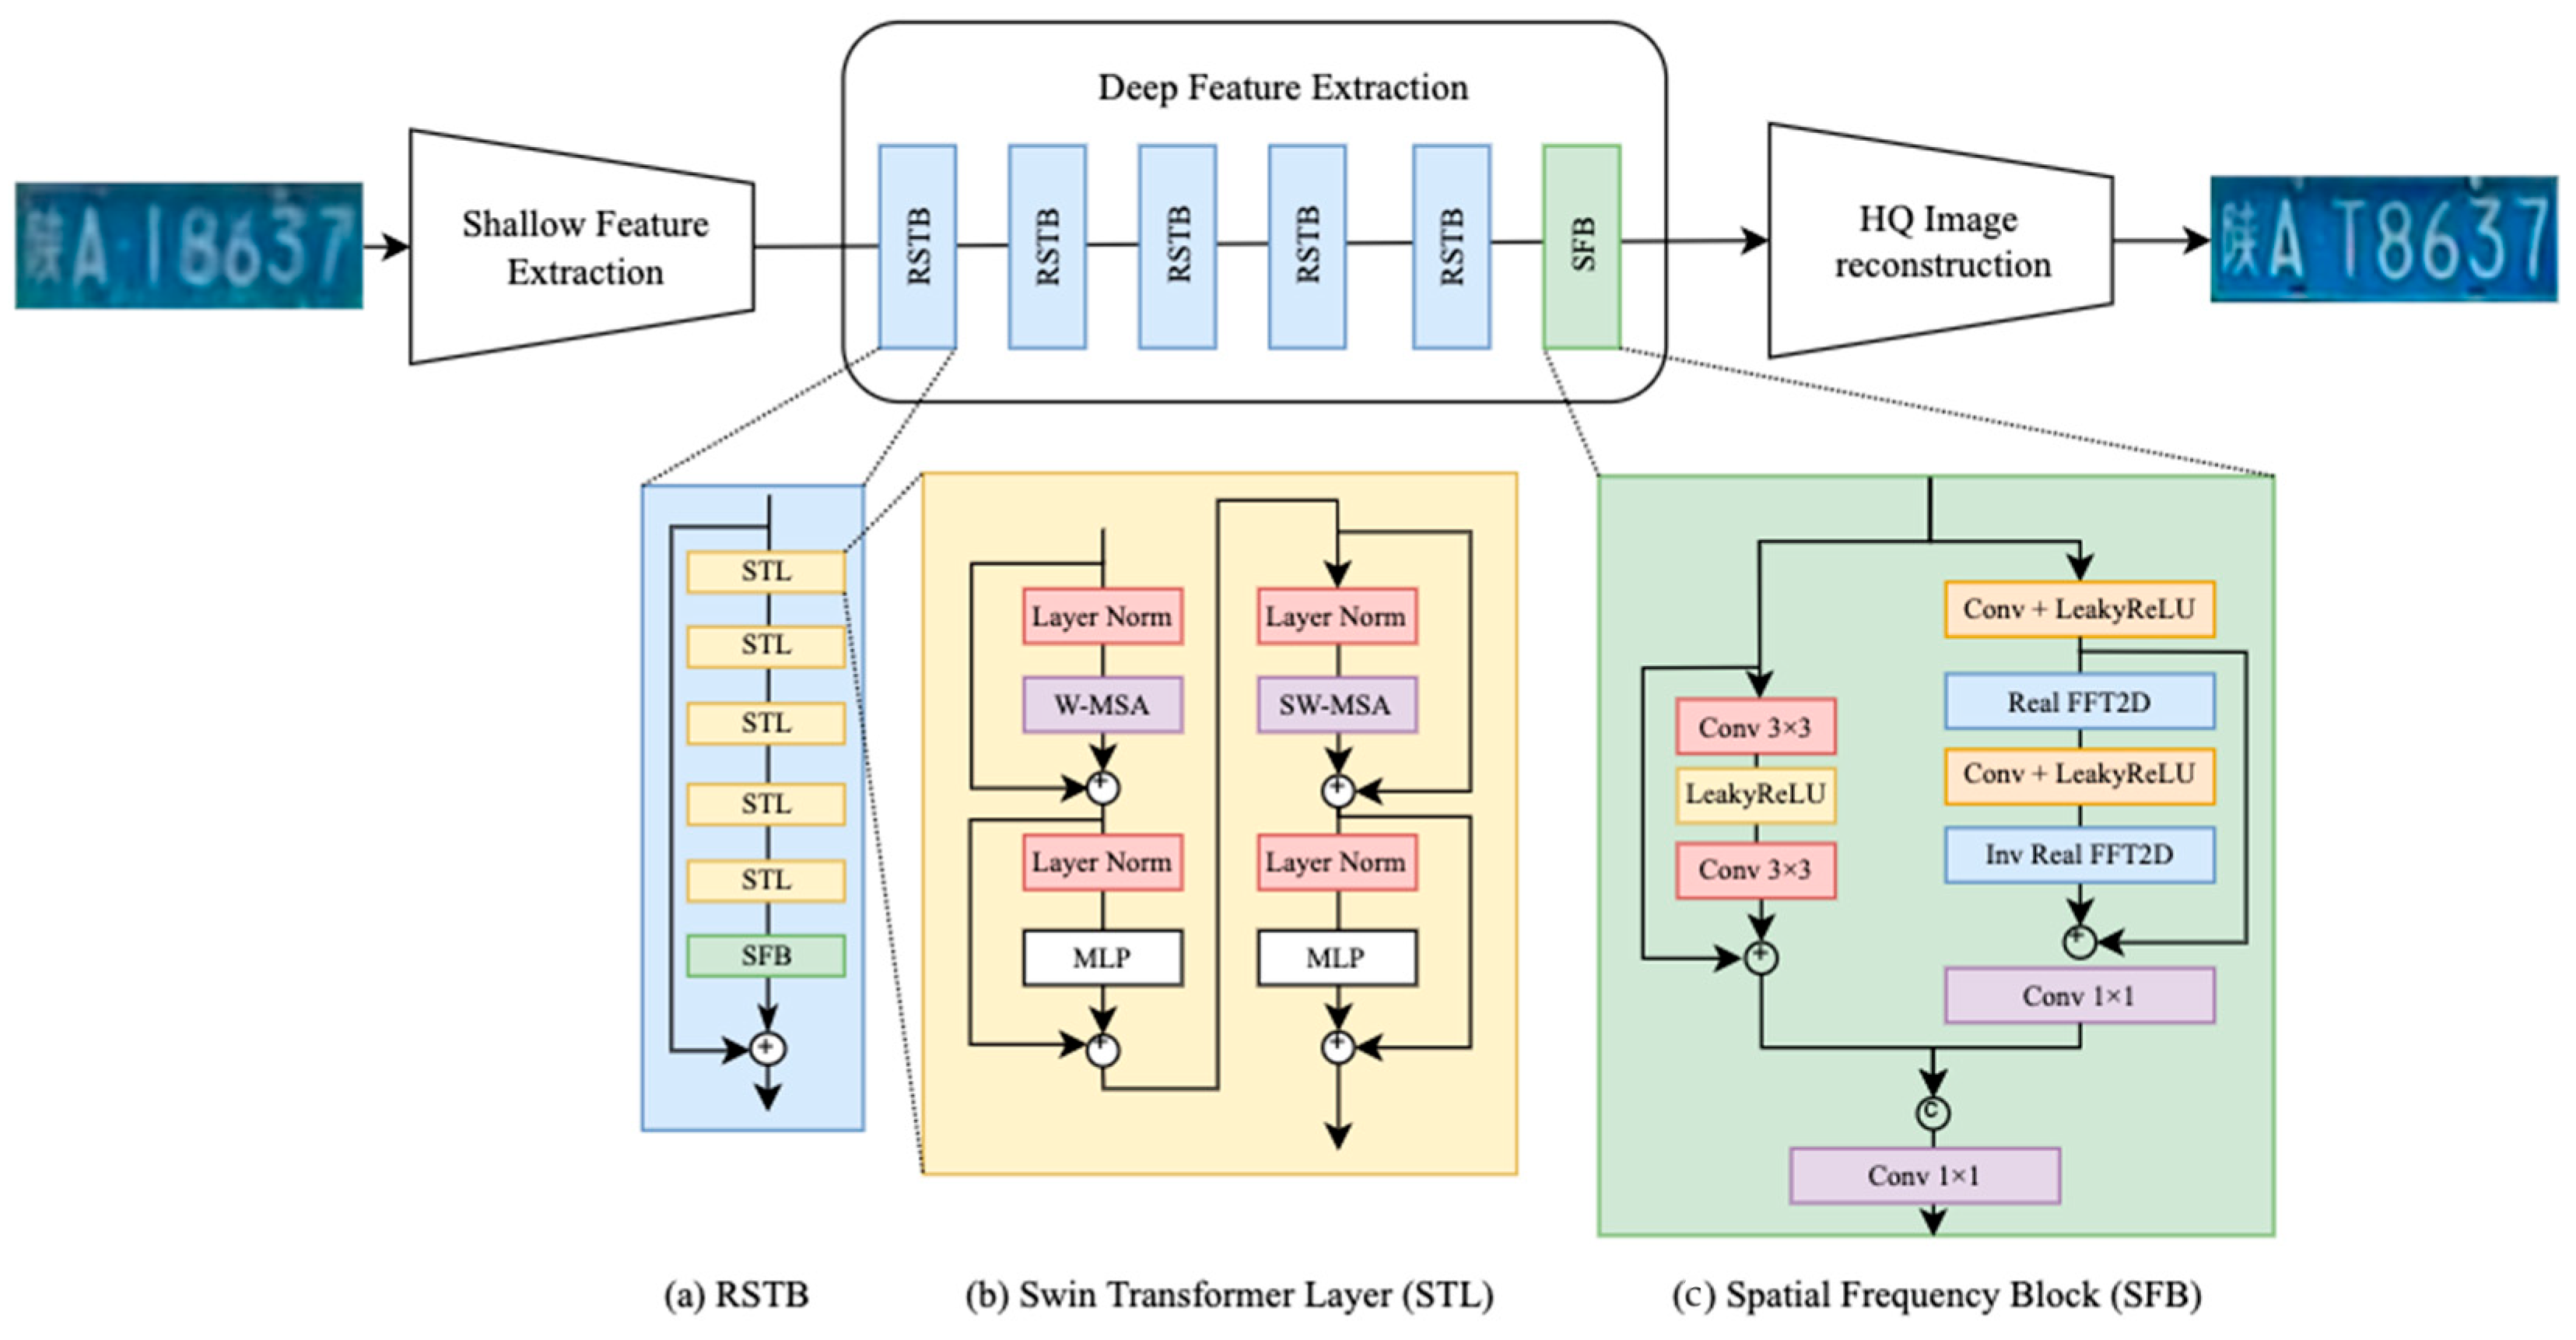
3.4. Super Resolution Model of SwinFIR
3.5. Perceptual Loss Calculation
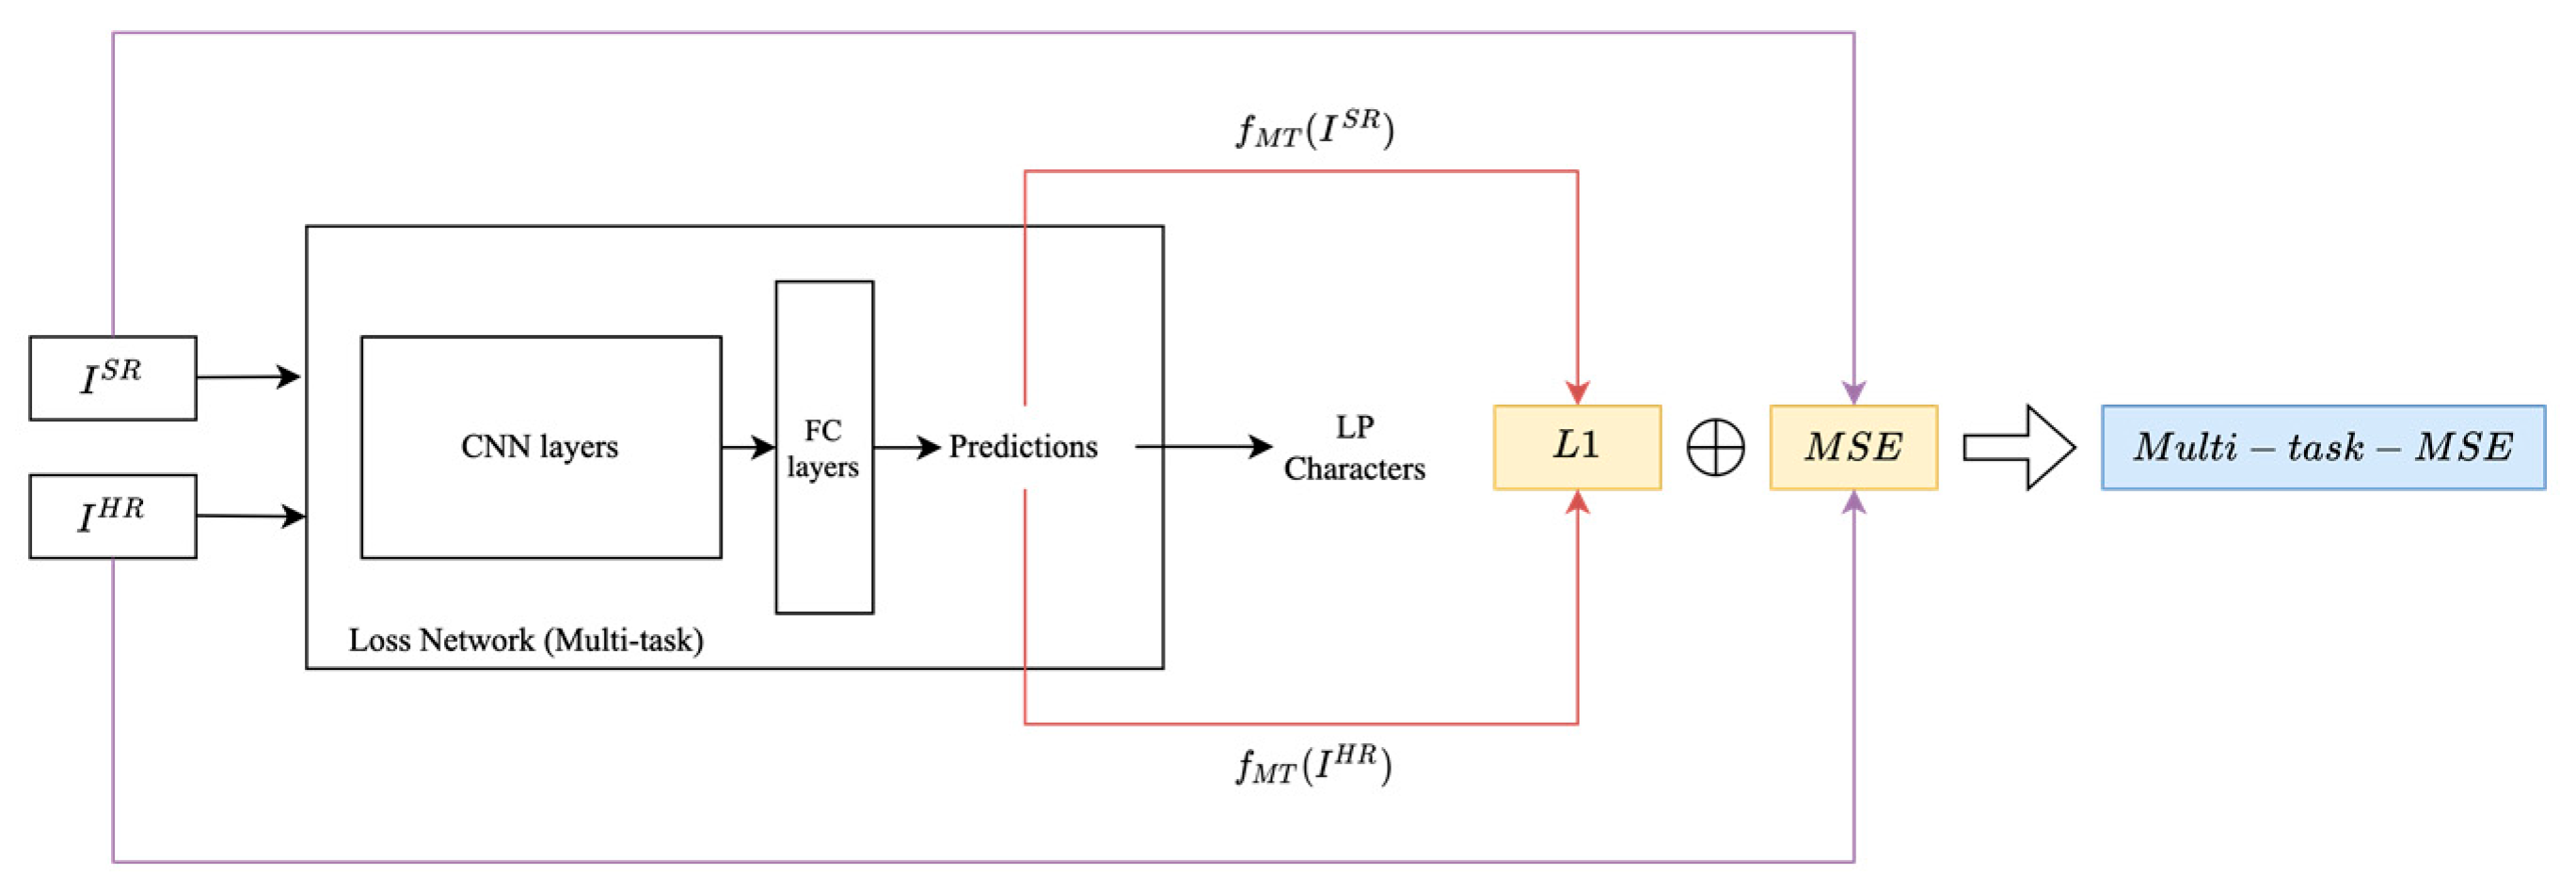
3.5.1. Multi-Task MSE Loss
3.5.2. Deep Image Structure and Texture Similarity (DISTS) Loss
3.5.3. VGG Loss
3.5.4. Swin Transformer Loss
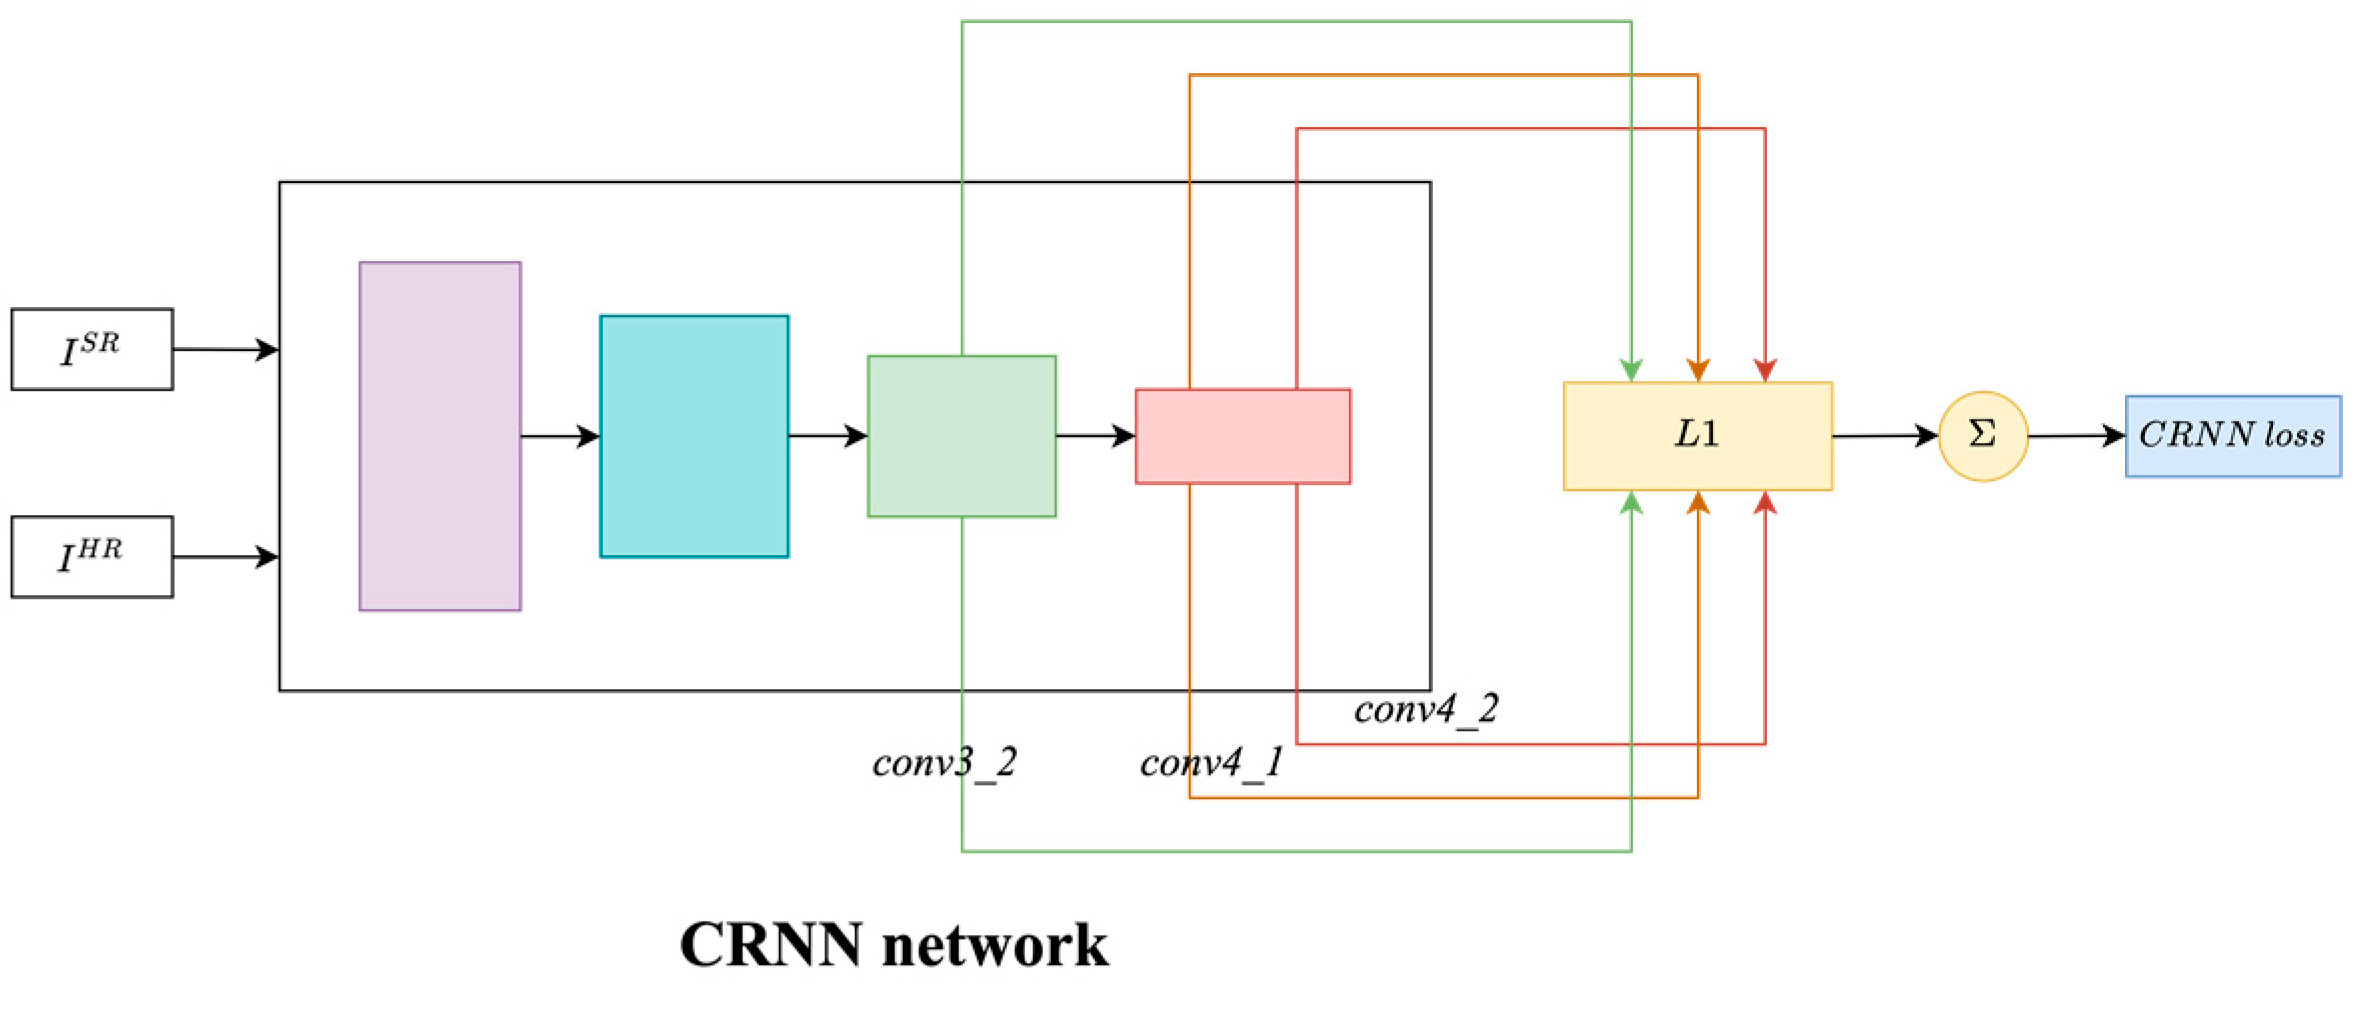
3.5.5. Convolutional Recurrent Neural Network (CRNN) Loss
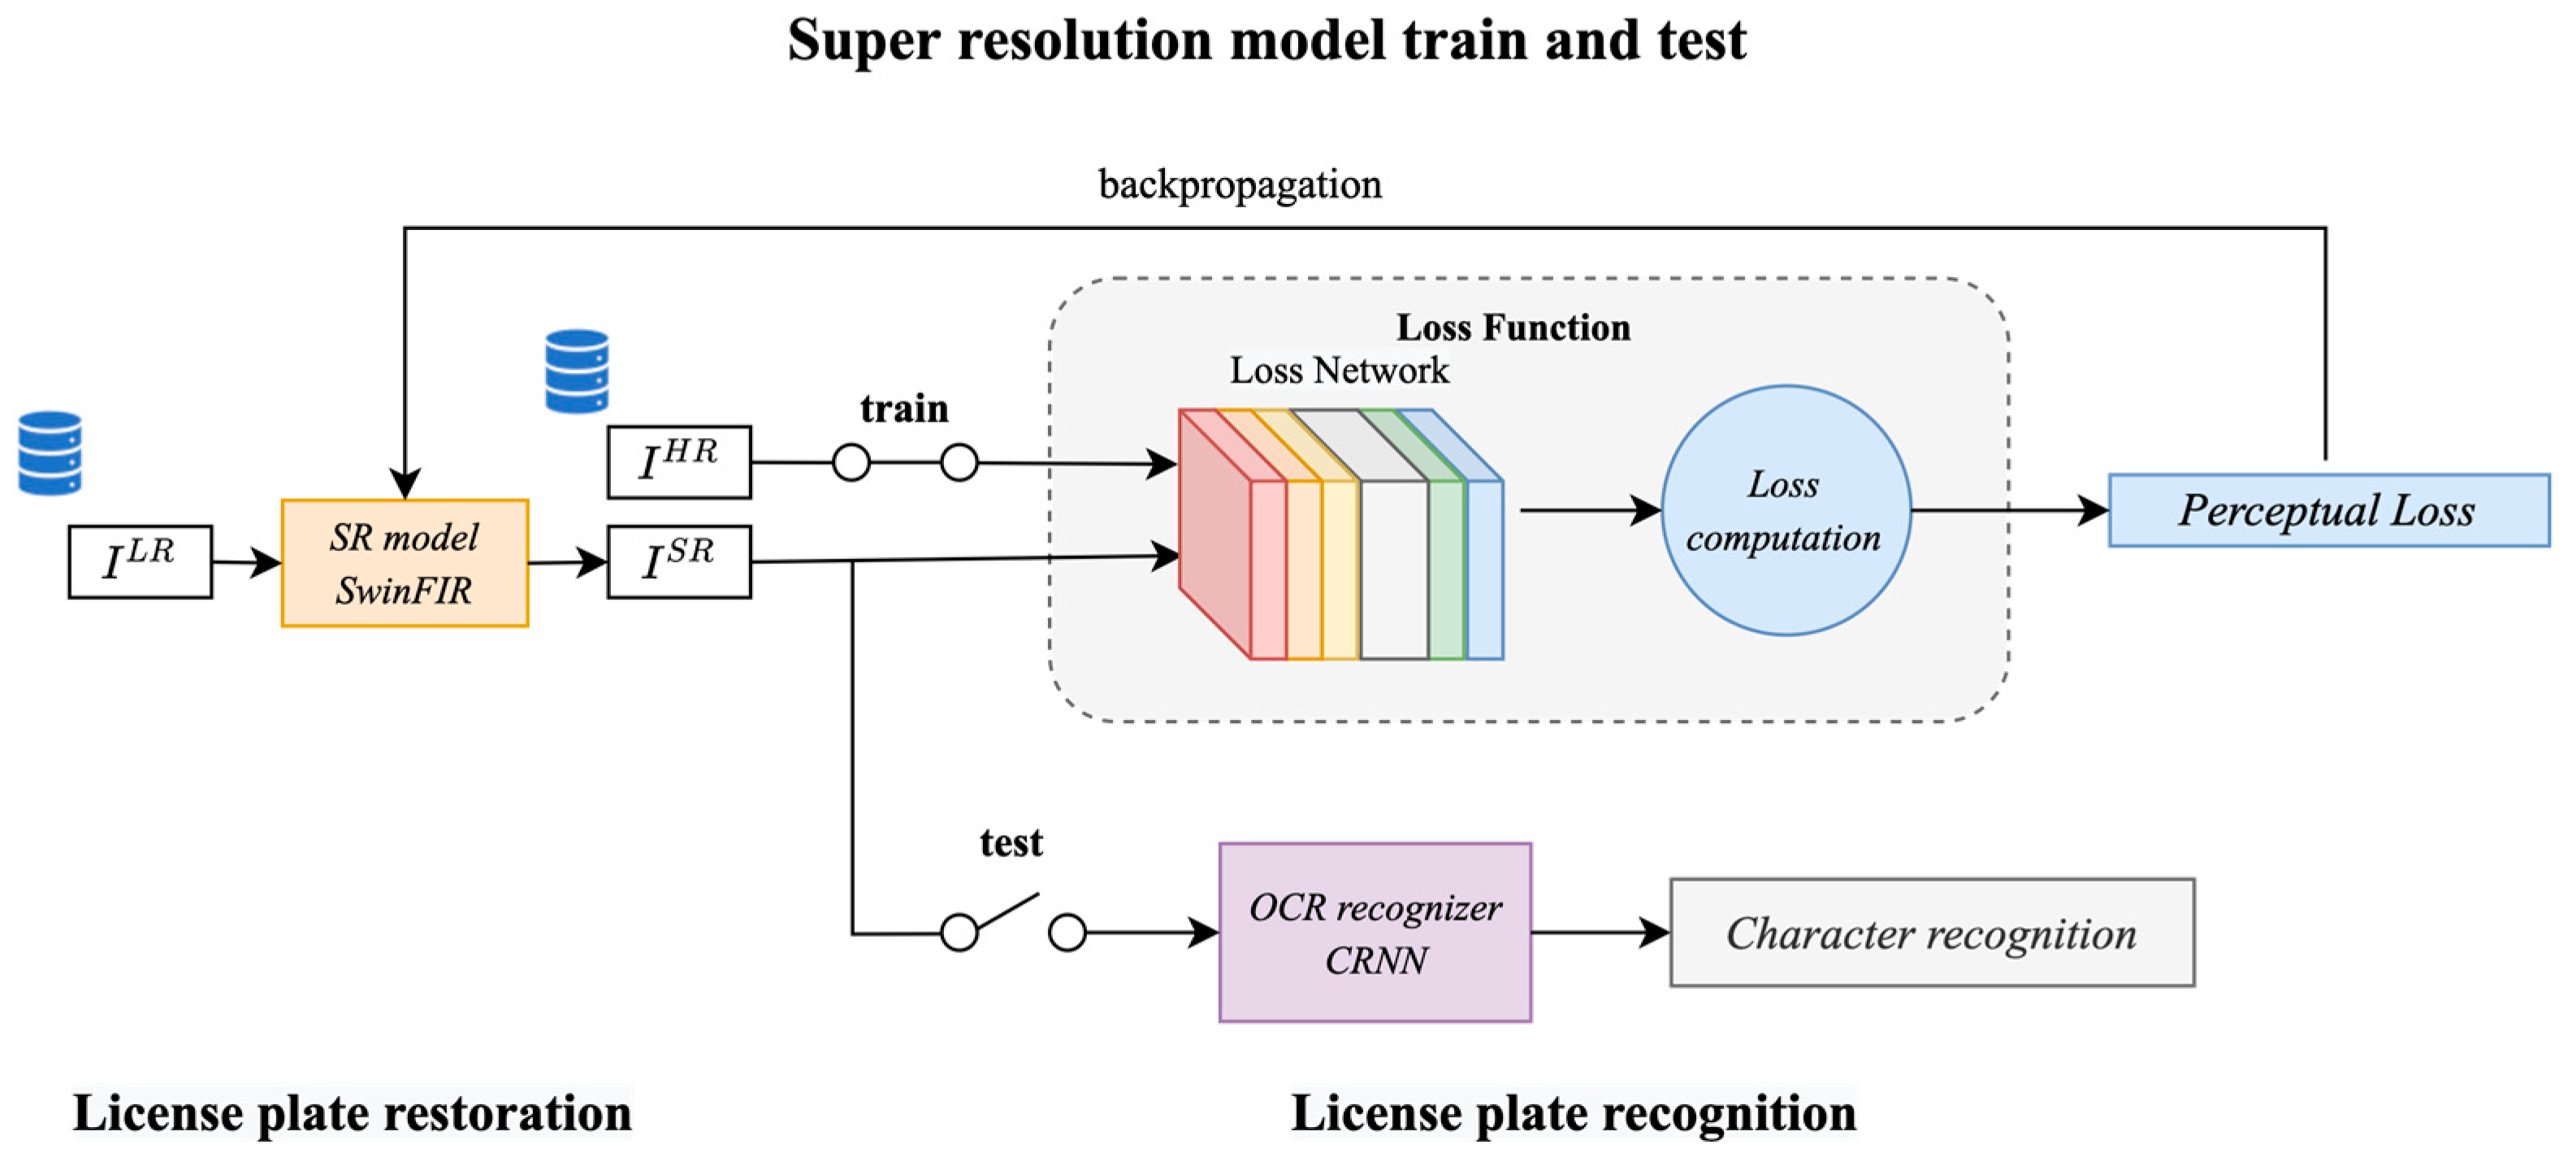
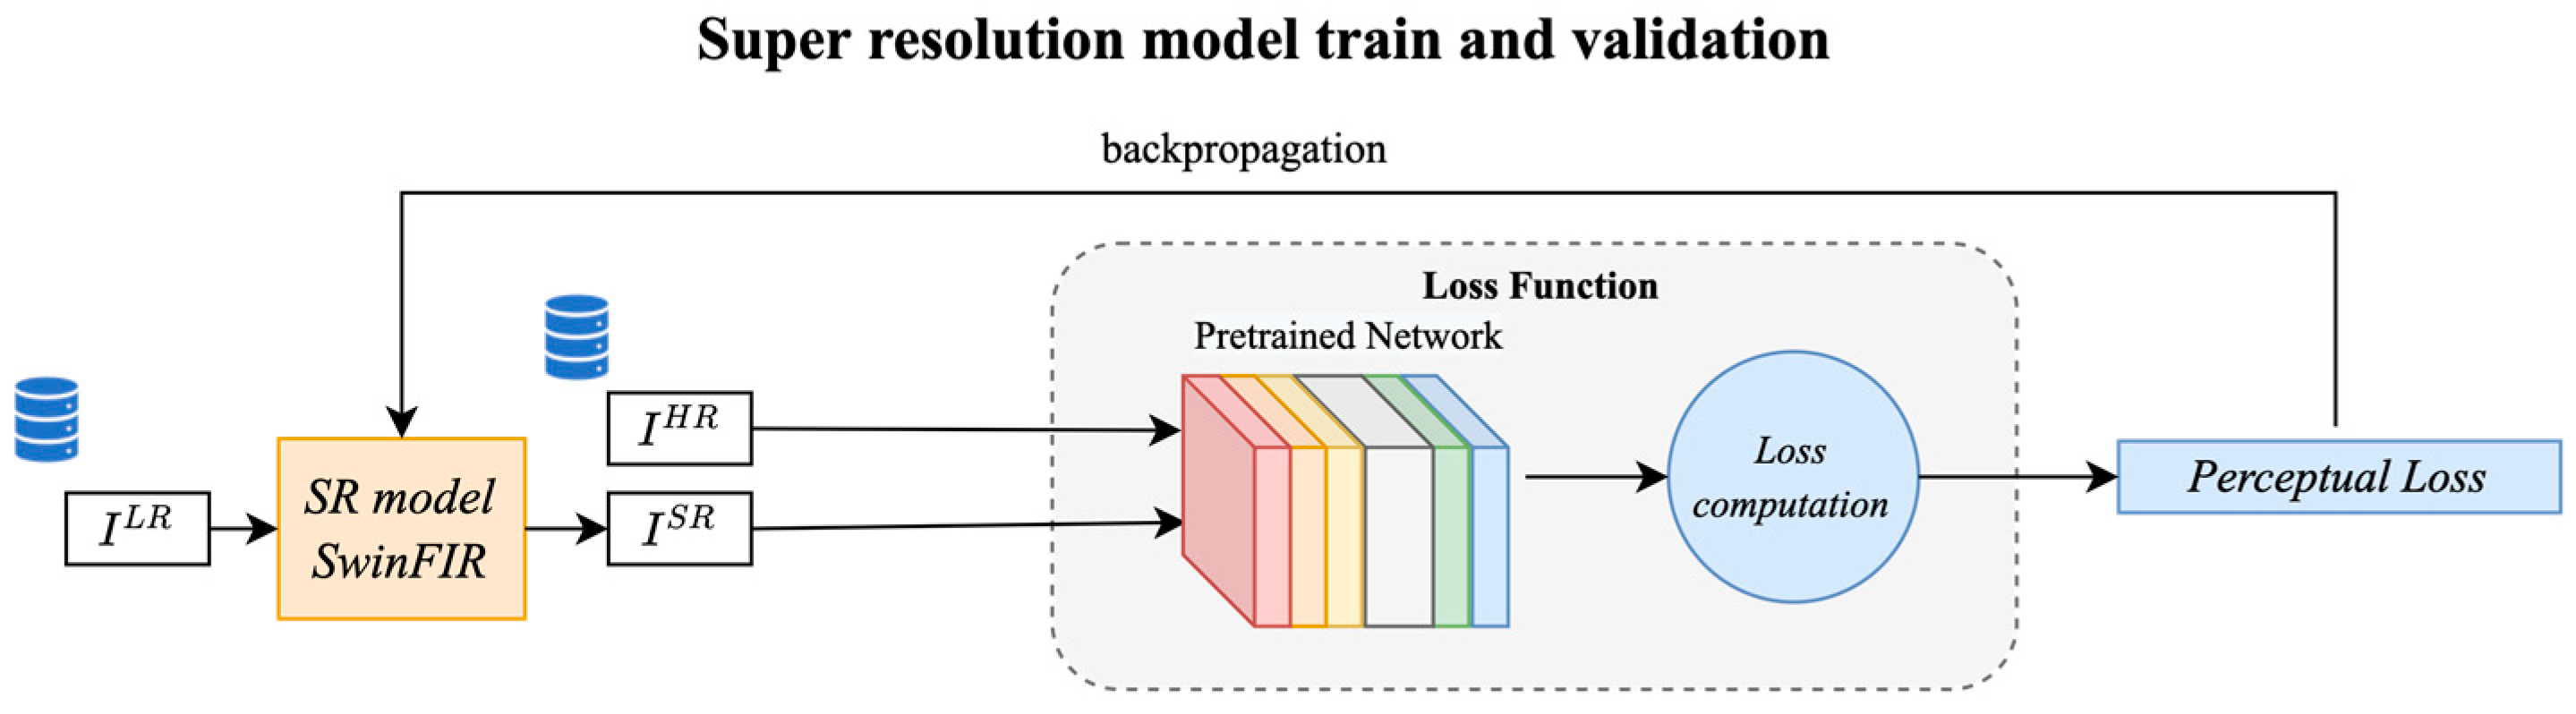
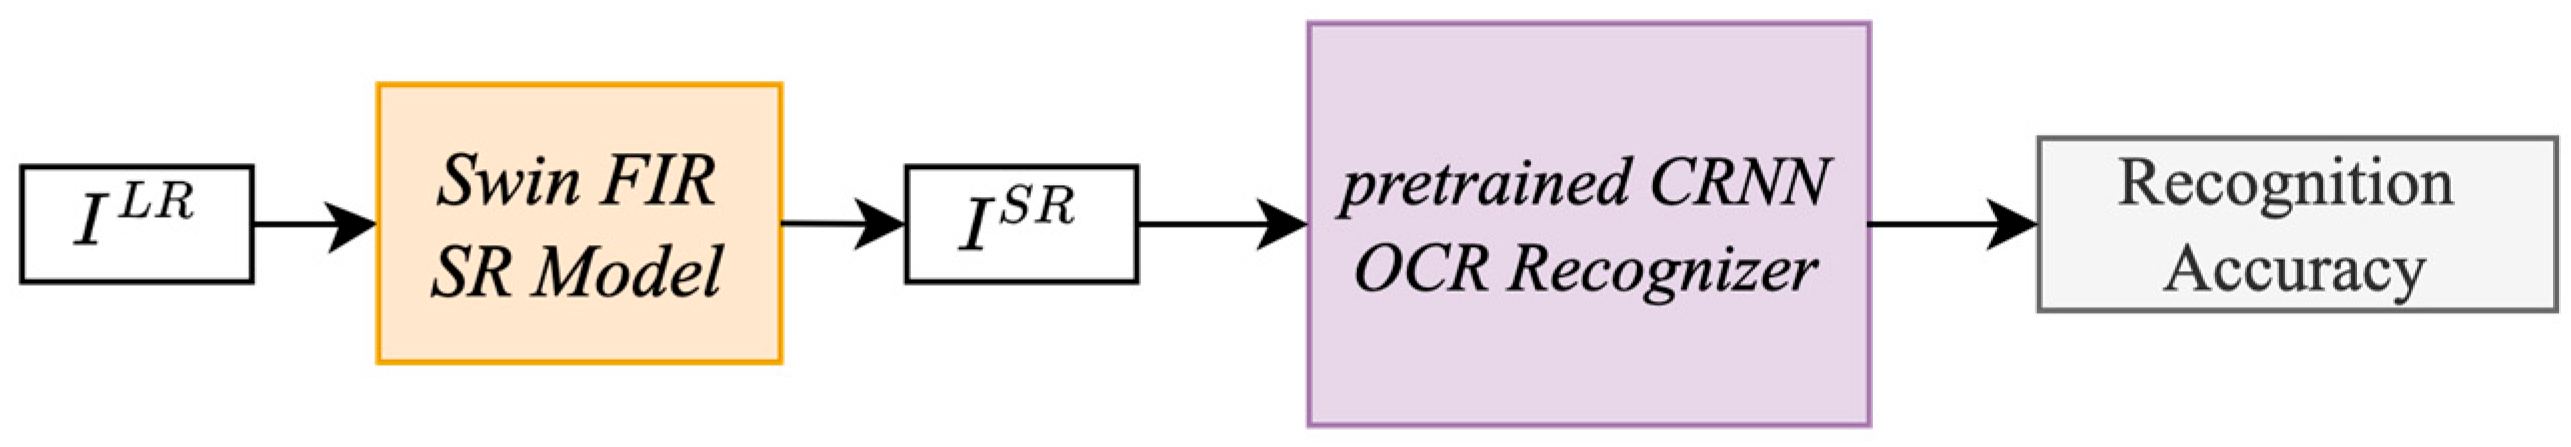
3.6. Validation and Test Flow
4. Result and Discussion
4.1. OCR License Plate Recognition Accuracy by Tiers
- Trend discovery reveals a clear performance scaling across tiers, with all models showing improved accuracy as tolerance increases from 7/7 to 6/7 to 5/7. This indicates that even models with lower full-plate accuracy retain partial character information that supports approximate recognition. For example, CRNN (grey line) improves from 25.64% at 7/7 accuracy to 61.54% at 6/7 and 82.05% at 5/7, demonstrating strong robustness despite slight degradations in image quality.
- Model ranking and pattern clustering:
- Lower-tier models: Multi-task MSE and raw LR input fall behind.They demonstrate limited ability to enhance OCR-relevant features.
- Mid-tier models: DISTS, SwinT, and VGG.All CNN- or Transformer-based—offer reliable OCR improvement. Models leveraging perceptual or deep features, as described in Table 4 (e.g., CRNN, SwinT), group in the higher performance band.
- Top-tier models: CRNN + VGG and SwinT + DISTS.They consistently outperform others, indicating the value of multi-loss and hybrid-architecture training strategies.
- Correlation with feature integration: The inclusion of semantic losses (e.g., CRNN, VGG, SwinT) or ensemble losses (e.g., CRNN + VGG, SwinT + DISTS) shows strong correlation with better OCR performance. This suggests that deeper representations and hybrid loss strategies better preserve text-relevant features.
4.2. OCR Character Recognition Accuracy on Average
- LR as baseline:
- The LR baseline yields an average OCR accuracy of 75.57%, correctly recognizing about 5.29 characters per plate.
- Any model exceeding this benchmark illustrates the positive impact of super-resolution (SR) techniques on OCR capability.
- Simple loss:
- Charbonnier loss leads to a notable performance drop (−6.89%), proving inadequate in capturing perceptual fidelity.
- Multi-task MSE, while slightly better, still falls below baseline, revealing the limitations of traditional pixel-based loss functions in restoring visually coherent character structures.
- Individual perceptual loss:
- Models with CRNN, SwinT, DISTS, and VGG as perceptual losses all surpass the baseline: Indicates the importance of architectural alignment between the SR model and perceptual loss.
- VGG stands out with 82.57% accuracy and 5.78 recognized characters, emphasizing the power of deep CNNs in capturing semantic features for OCR. This phenomenon was proposed by Y. Liu et al. [51] that generic perceptual loss is applicable to structured learning, including super-resolution, style transfer, image segmentation.
- Ensemble of Perceptual Losses:
- Combining perceptual loss functions further boosts OCR accuracy:
- ○
- CRNN + VGG: 83.43%, 5.84 characters.
- ○
- SwinT + DISTS: 85.14%, 5.96 characters, which is the best-performing combination.
- These combinations capitalize on complementary strengths:
- ○
- Spatial fidelity from CNNs and DISTS.
- ○
- Sequential structure from CRNN.
- ○
- Global context understanding from SwinT transformers
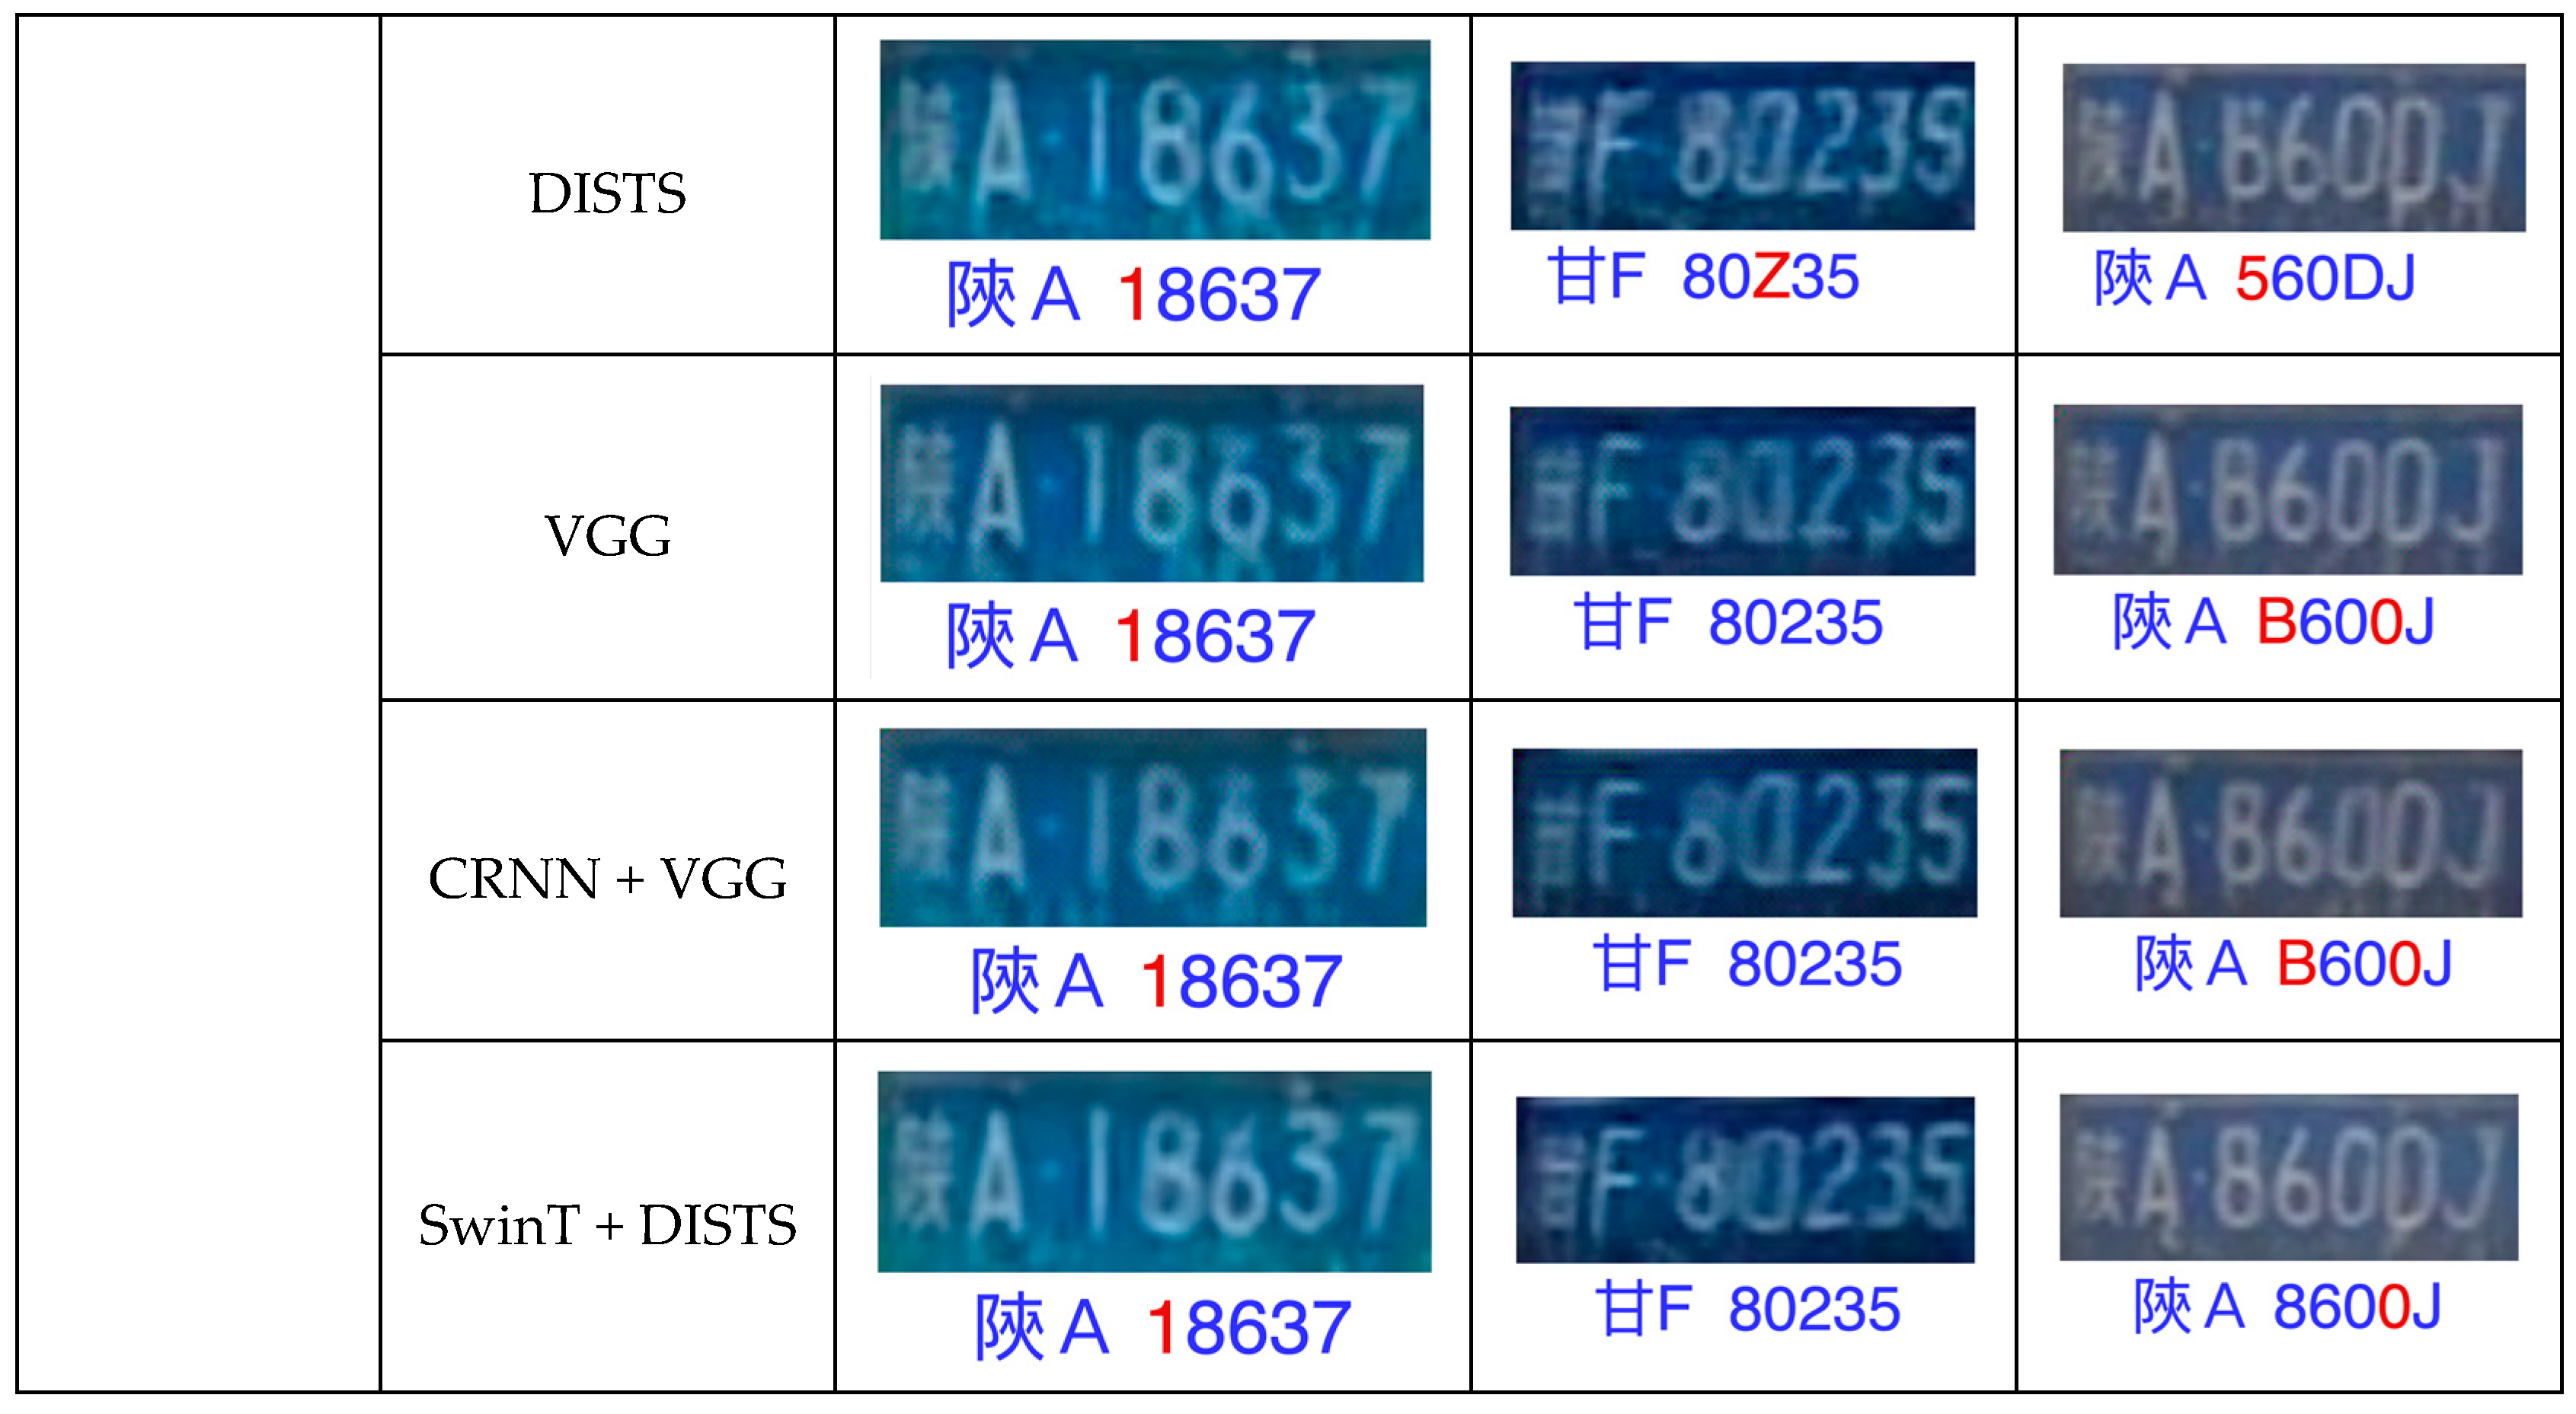
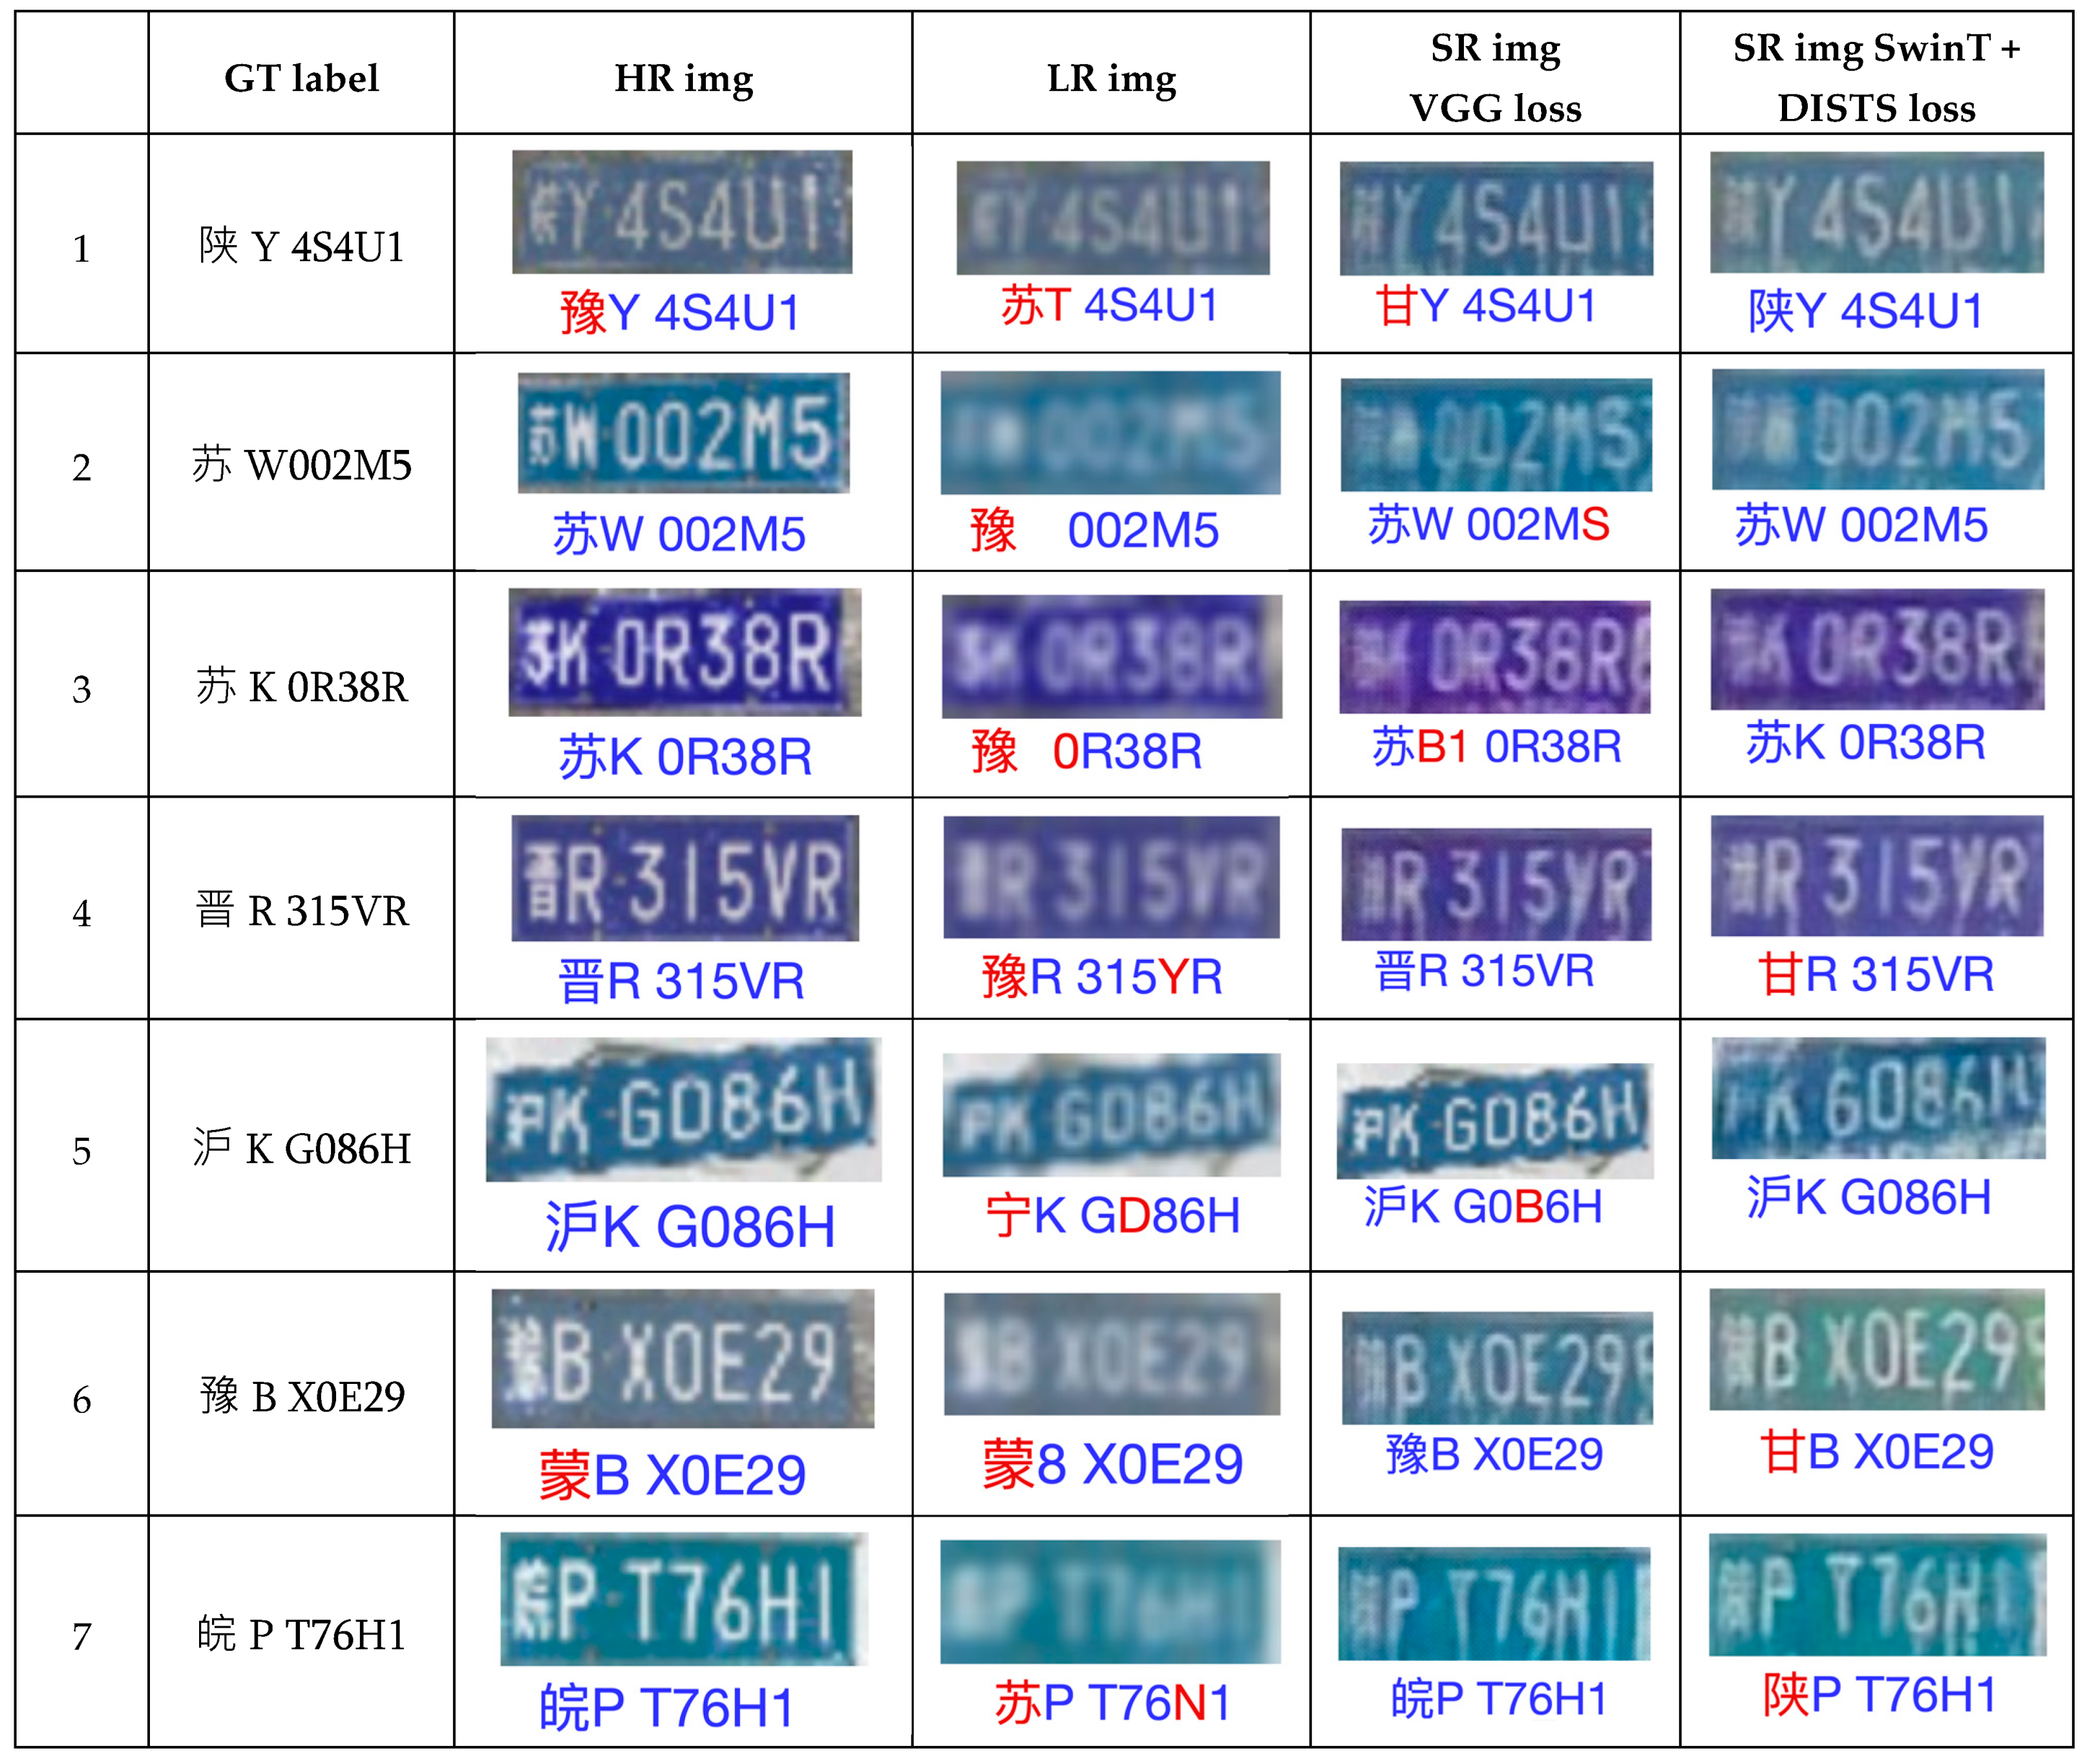
4.3. Super-Resolution Images by Perceptual Losses
- 1.
- LR image:
- 2.
- VGG loss:
- 3.
- Ensemble loss of SwinT + DISTS:
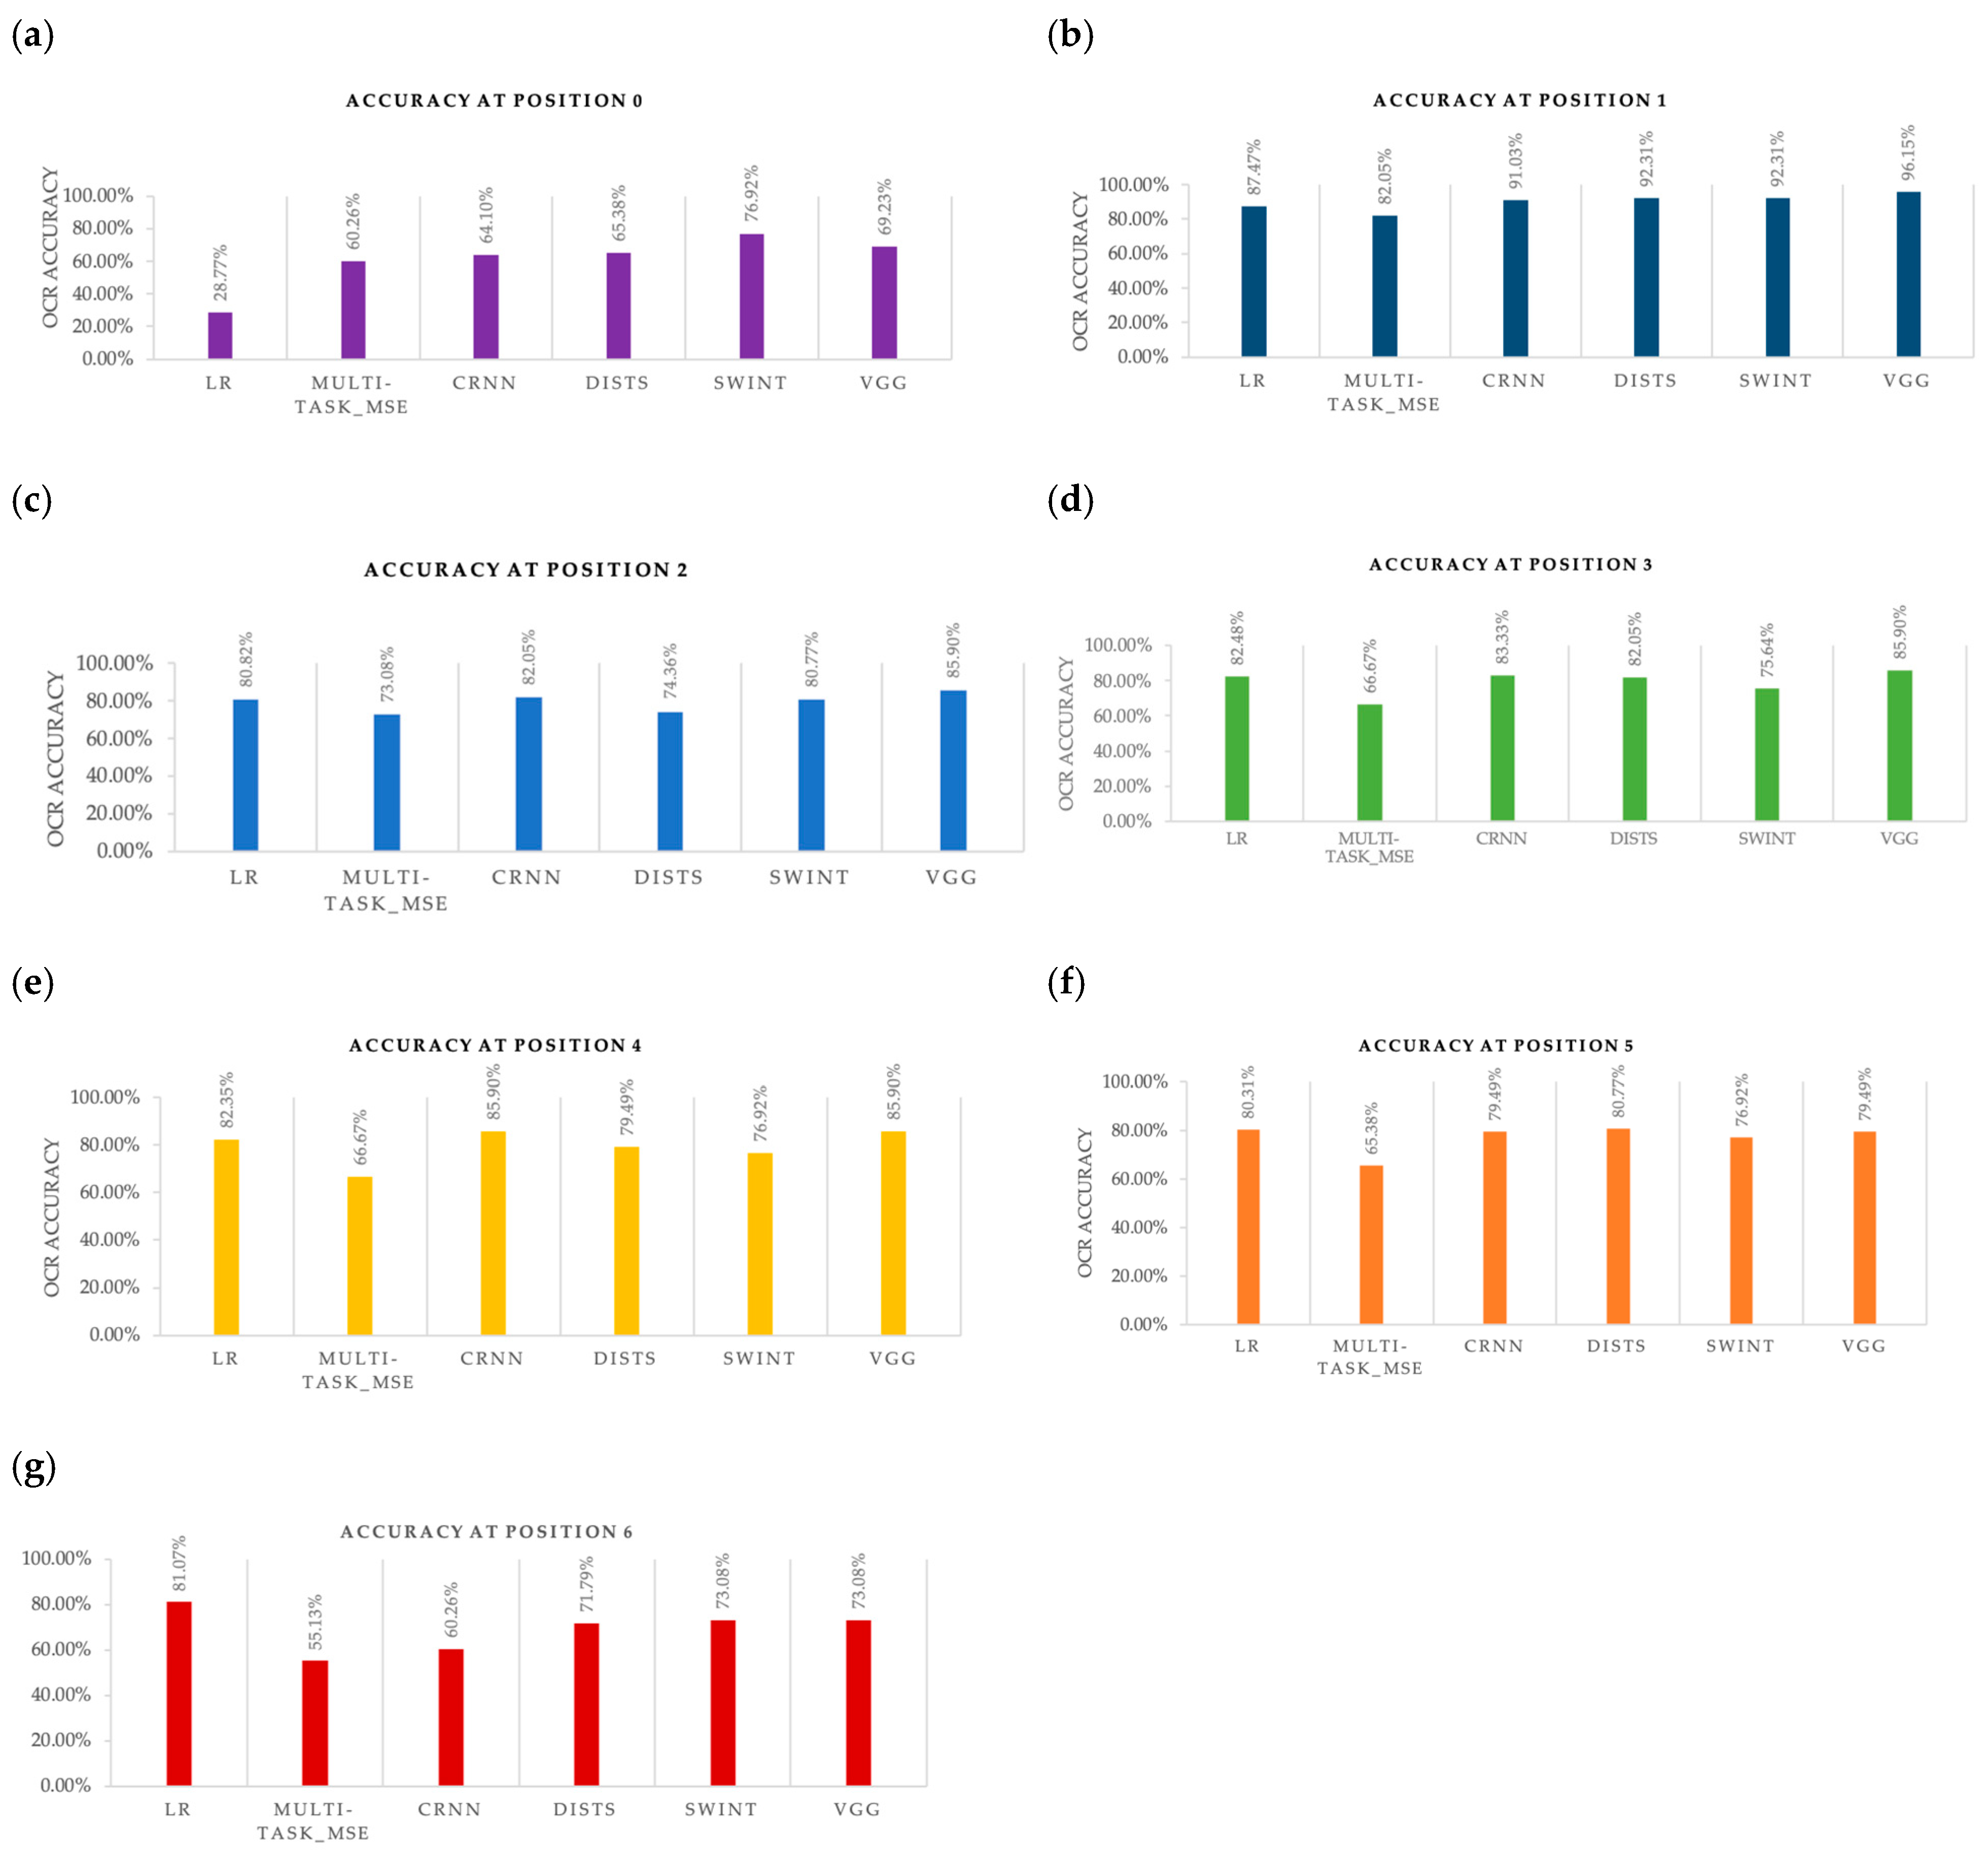
4.4. Character Recognition Accuracy for Single Loss on Each Position
4.5. Evaluation Result on Other Datasets
5. Conclusions and Future Work
Author Contributions
Funding
Data Availability Statement
Acknowledgments
Conflicts of Interest
Abbreviations
| OCR | Optical character recognition |
| HR | High resolution |
| LR | Low resolution |
| SR | Super resolution |
| LPR | License plate recognition |
| MSE | Mean square error |
| CNN | Convolutional neural network |
| CRNN | Convolutional recurrent neural network |
| DISTS | Deep Image Structure and Texture Similarity |
| SwinT | Shifted windows Transformer |
| SwinFIR | SwinIR with fast Fourier transform |
Appendix A. Formula for Different Perceptual Loss
Appendix A.1. Multi-Task MSE Loss Formula
- and represent the high-resolution ground truth and the super-resolved image for the n-th sample, respectively.
- The first term corresponds to the Mean Squared Error (MSE) loss, ensuring pixel-wise similarity between the SR and HR images.
- The second term captures the absolute difference in predictions from the multi-task OCR model, ensuring consistency in textual information between the SR and HR images.
Appendix A.2. Deep Image Structure and Texture Similarity (DISTS) Loss Formula
Appendix A.3. VGG Loss Formula
- /: Weighting coefficients for the perceptual and style losses, respectively.
- : Importance weights assigned to the j-th feature map (before activation) produced by the convolutional layer immediately preceding the i-th max-pooling layer in the VGG19 network.
- : Loss terms computed from feature maps of VGG layers, measuring content (perceptual) and style similarity.
- : Feature map extracted from the -th layer of the pretrained VGG network.
- /: Width and height of the feature maps at layer .
Appendix A.4. Swin Transformer Loss Formula
- /: Weighting coefficients for the perceptual and style losses, respectively.
- : Importance weights for each SwinT layer , where indexes the stage and the block of the stage.
- : Loss terms computed from feature maps of SwinT layers, measuring content (perceptual) and style similarity.
- : Feature map extracted from the -th layer of the pretrained SwinT network.
- /: Width and height of the feature maps at layer .
Appendix A.5. Convolutional Recurrent Neural Network (CRNN) Loss
- : Loss terms computed from feature maps of CRNN layers, measuring content (perceptual) and style similarity.
- : Importance weights assigned to the j-th feature map (before activation) produced by the convolutional layer immediately preceding the i-th max-pooling layer in the CRNN network.
- : Feature map extracted from the -th layer of the pretrained CRNN network.
- /: Width and height of the feature maps at layer .
Appendix B. Evaluation Result on Different Perceptual Loss
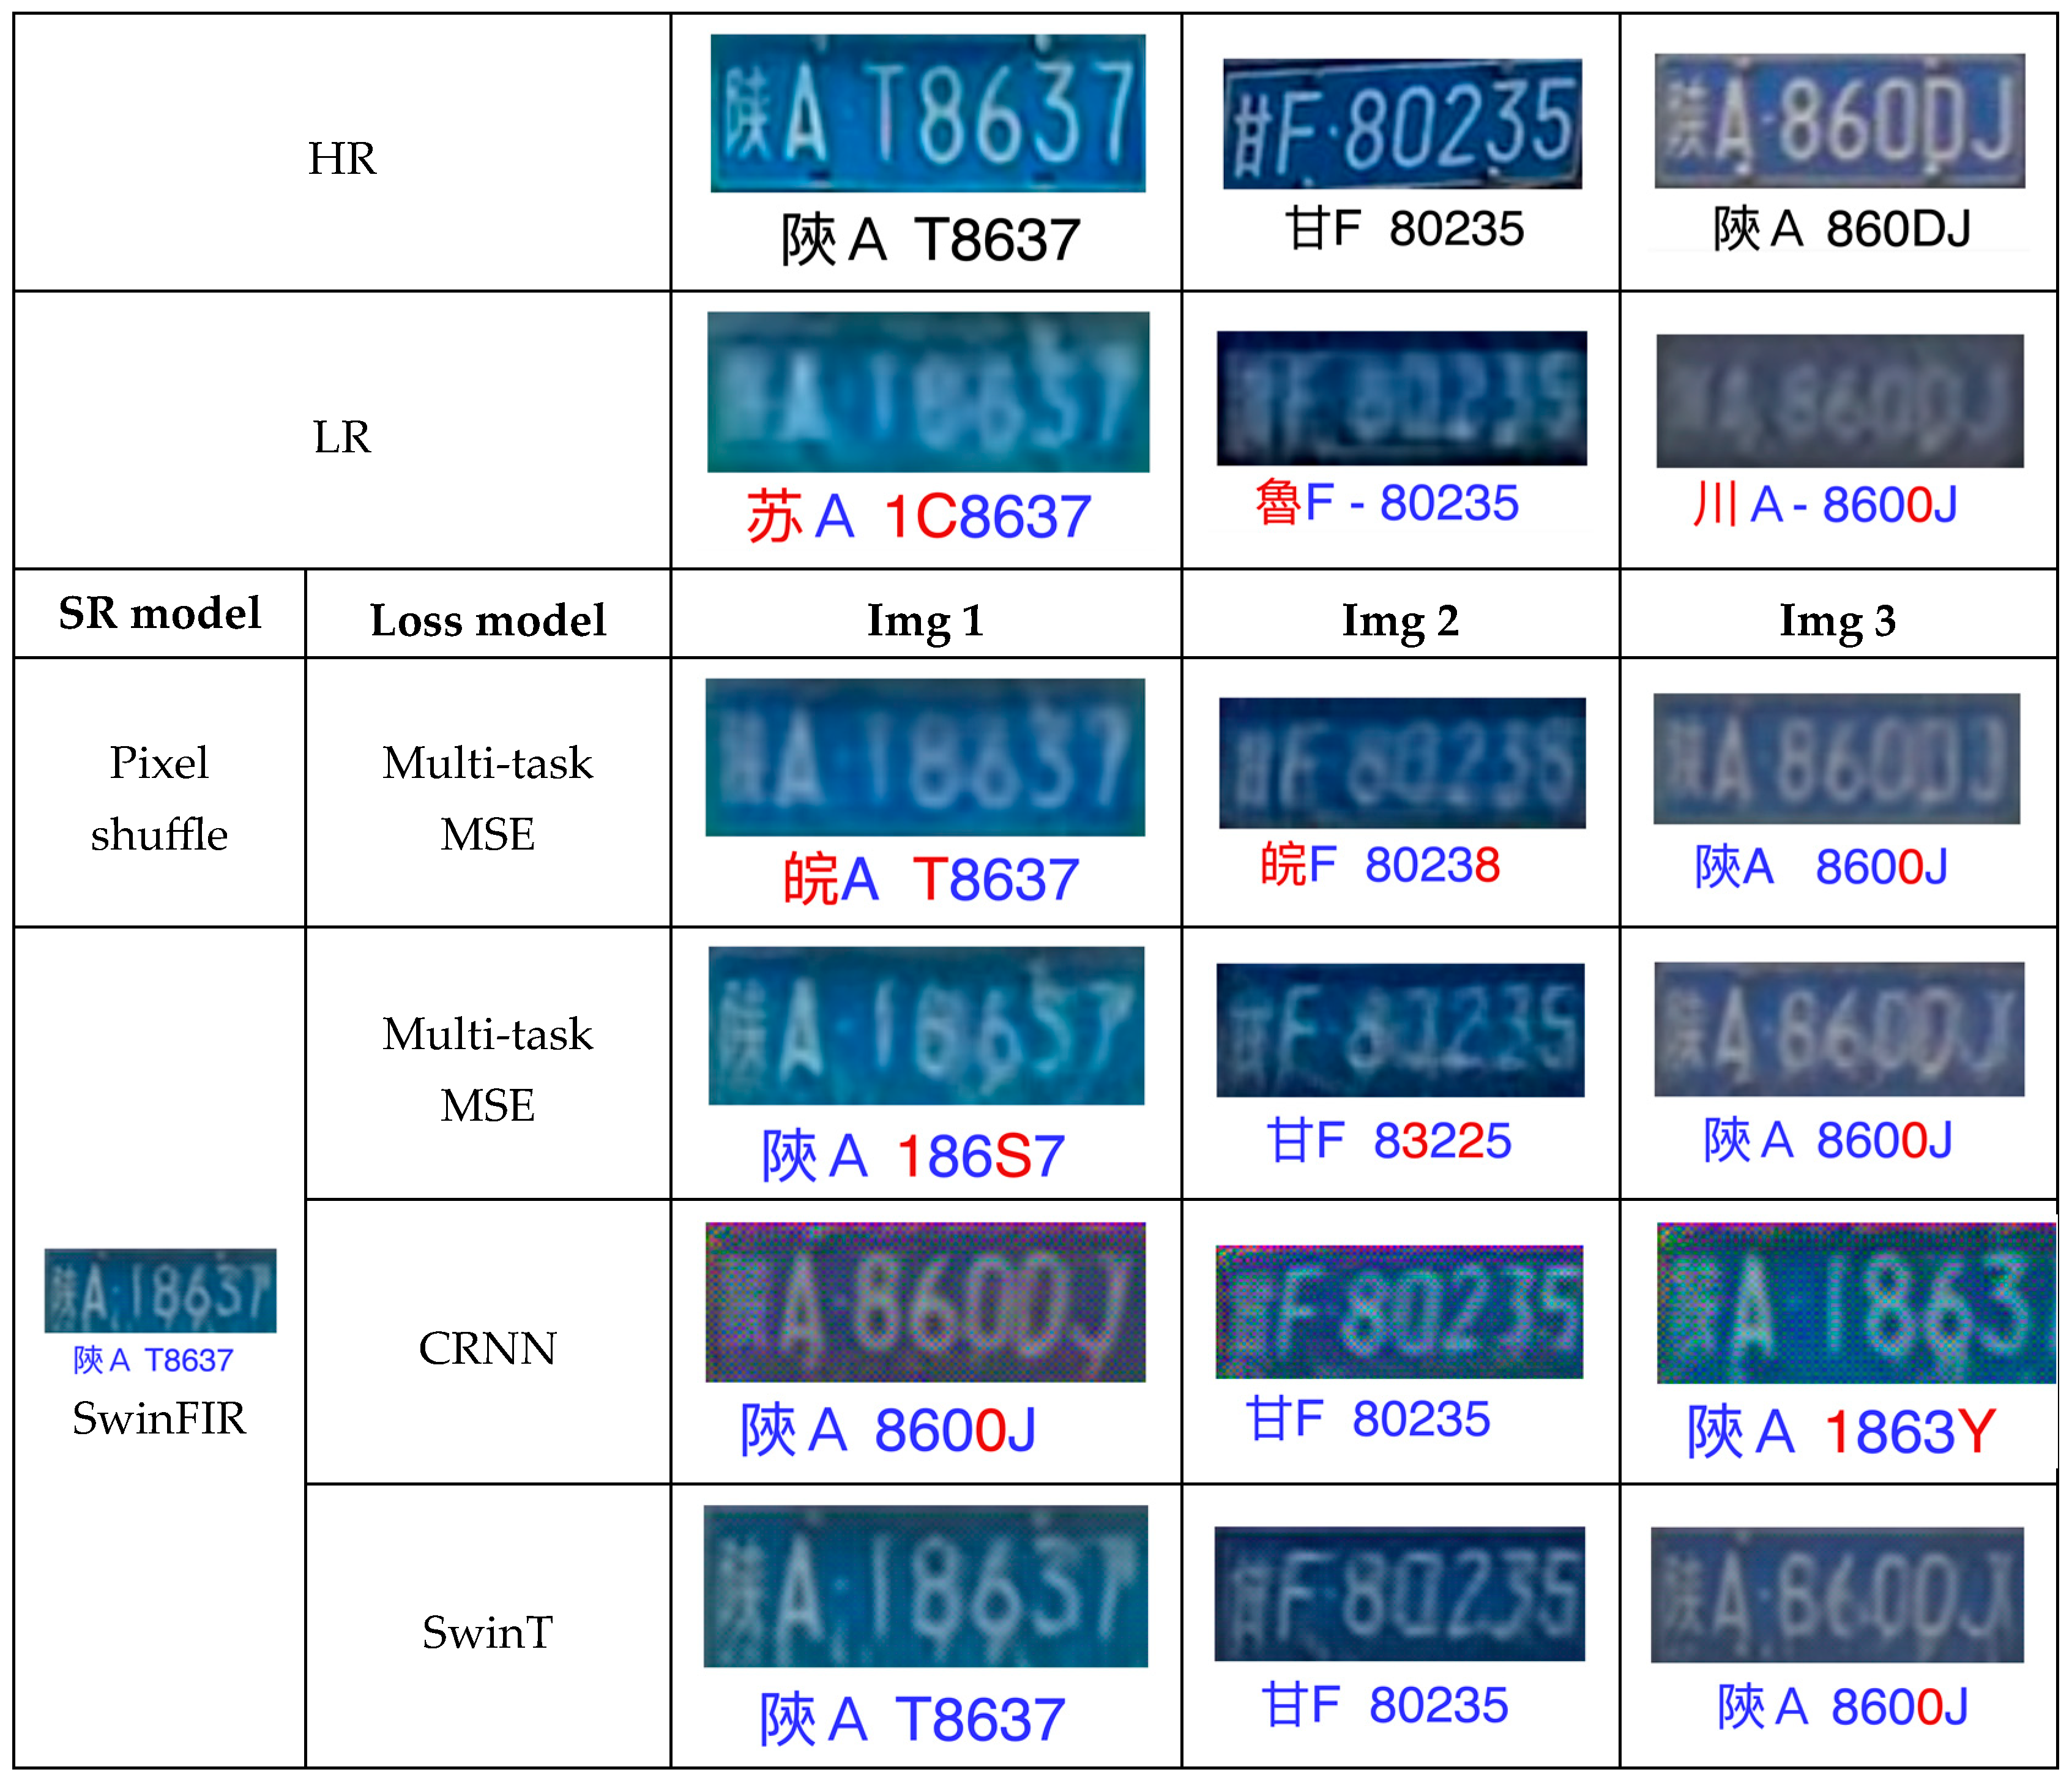
Appendix B.1. Multi-Task MSE Model Evaluation Result
- Strengths:
- ○
- The overall plate layout and structure are preserved well.
- ○
- Produces relatively smooth and clean character forms.
- ○
- Background color and plate texture are consistent with the original.
- Issues:
- ○
- Multiple character misrecognitions: 6 → 8, likely due to visual similarity and low-resolution confusion. 3 → S, a common OCR issue due to overlapping shapes.
- ○
- These errors suggest that while MSE maintains pixel-level detail, it may lack robustness to fine-grained character disambiguation.
- ○
- The auxiliary task influence is insufficient to fully correct these errors—pointing to the need for stronger character-level loss or attention mechanisms.
Appendix B.2. CRNN Loss Evaluation Result
- Strengths:
- ○
- Restores reasonable text structure and preserves character spacing.
- ○
- Characters are mostly sharp and well-formed, enabling better performance for downstream recognition.
- ○
- The CRNN loss enforces semantic alignment between the prediction and the true label, reducing nonsensical outputs.
- Issues: The final digit 7 is misclassified as Y.
- ○
- Could be due to visual noise, font thickness, or low contrast.
- ○
- CRNN loss may overemphasize alignment with learned text patterns rather than true visual fidelity.
- ○
- The overall image may appear less natural or smooth and with a mosaic pattern, as CRNN loss does not optimize for perceptual beauty.
Appendix B.3. SwinT Loss Evaluation Result
- Strengths:
- ○
- Produces clean and well-defined character structures.
- ○
- Preserves the license plate layout, including accurate character spacing and background details.
- ○
- Effectively recovers the number sequence with enhanced sharpness and clarity.
- Issues: The character 1 is incorrectly predicted as T, possibly due to:
- ○
- Overfitting to visual patterns that resemble the letter T.
- ○
- Absence of character-level semantic correction in the post-processing stage.
Appendix B.4. DISTS Loss Evaluation Result
- Strengths:
- ○
- Maintains the overall plate structure, including spacing and background.
- ○
- Produces clean and well-defined character structures.
- ○
- Balances fine detail and smoothness, avoiding excessive artifacts.
- Issues: The digit 8 is mistakenly recognized as the letter B.
- ○
- This likely stems from DISTS optimizing for perceptual quality rather than strict text fidelity.
- ○
- Visual similarity between characters (e.g., 8 → B) can confuse the model in the absence of semantic constraints.
Appendix B.5. Ensemble Loss of CRNN + VGG Evaluation Result
- Strengths:
- ○
- Produces visually appealing and structurally consistent outputs.
- ○
- Maintains smooth background, appropriate spacing, and clarity across most characters.
- ○
- The VGG loss contributes to natural textures, while CRNN guidance improves recognizability of characters.
- Issues: the digit 8 is still misinterpreted as B.
- ○
- May indicate that the model is still visually biased due to the dominant influence of perceptual loss.
- ○
- Suggests the need for stronger weighting on the recognition loss or more robust character supervision.
References
- Chang, S.-L.; Chen, L.-S.; Chung, Y.-C.; Chen, S.-W. Automatic license plate recognition. IEEE Trans. Intell. Transp. Syst. 2004, 5, 42–53. [Google Scholar] [CrossRef]
- Ozer, M. Automatic licence plate reader (ALPR) technology: Is ALPR a smart choice in policing? Police J. 2016, 89, 117–132. [Google Scholar] [CrossRef]
- Shringarpure, D.V. Vehicle Number Plate Detection and Blurring Using Deep Learning. 2023. Available online: https://norma.ncirl.ie/6662/1/darshanvijayshringarpure.pdf (accessed on 1 May 2025).
- Castriota, S.; Tonin, M. Stay or flee? Hit-and-run accidents, darkness and probability of punishment. Eur. J. Law Econ. 2023, 55, 117–144. [Google Scholar] [CrossRef]
- Gong, H.; Feng, Y.; Zhang, Z.; Hou, X.; Liu, J.; Huang, S.; Liu, H. A Dataset and Model for Realistic License Plate Deblurring. arXiv 2024, arXiv:2404.13677. Available online: https://www.ijcai.org/proceedings/2024/86 (accessed on 1 May 2025).
- Shi, C.; Wu, C.; Gao, Y. Research on image adaptive enhancement algorithm under low light in license plate recognition system. Symmetry 2020, 12, 1552. [Google Scholar] [CrossRef]
- Torkian, A.; Moallem, P. Multi-frame Super Resolution for Improving Vehicle Licence Plate Recognition. Signal Data Process. 2019, 16, 61–76. [Google Scholar] [CrossRef]
- Chen, G.-W.; Yang, C.-M.; İk, T.-U. Real-time license plate recognition and vehicle tracking system based on deep learning. In Proceedings of the 2021 22nd Asia-Pacific Network Operations and Management Symposium (APNOMS), Tainan, Taiwan, 8–10 September 2021; pp. 378–381. [Google Scholar]
- Jin, X.; Tang, R.; Liu, L.; Wu, J. Vehicle license plate recognition for fog-haze environments. IET Image Process. 2021, 15, 1273–1284. [Google Scholar] [CrossRef]
- Wu, Y.-C.; Lee, J.-W.; Wang, H.-C. Robots for search site monitoring, suspect guarding, and evidence identification. IAES Int. J. Robot. Autom. (IJRA) 2020, 9, 84. Available online: https://pdfs.semanticscholar.org/7eeb/edec1fc2cb440425a56140474652aa6afd39.pdf (accessed on 1 May 2025). [CrossRef]
- Hore, A.; Ziou, D. Image quality metrics: PSNR vs. SSIM. In Proceedings of the 2010 20th International Conference on Pattern Recognition, Istanbul, Turkey, 23–26 August 2010; pp. 2366–2369. [Google Scholar] [CrossRef]
- Sara, U.; Akter, M.; Uddin, M.S. Image quality assessment through FSIM, SSIM, MSE and PSNR—A comparative study. J. Comput. Commun. 2019, 7, 8–18. [Google Scholar] [CrossRef]
- Zhang, D.; Huang, F.; Liu, S.; Wang, X.; Jin, Z. Swinfir: Revisiting the swinir with fast fourier convolution and improved trainingfor image super-resolution. arXiv 2022, arXiv:2208.11247. [Google Scholar] [CrossRef]
- Zhao, H.; Gallo, O.; Frosio, I.; Kautz, J. Loss functions for image restoration with neural networks. IEEE Trans. Comput. Imaging 2016, 3, 47–57. [Google Scholar] [CrossRef]
- we0091234, CRNN Chinese Plate Recognition. Available online: https://github.com/we0091234/crnn_plate_recognition (accessed on 9 April 2025).
- Nascimento, V.; Laroca, R.; de A Lambert, J.; Schwartz, W.R.; Menotti, D. Super-resolution of license plate images using attention modules and sub-pixel convolution layers. Comput. Graph. 2023, 113, 69–76. [Google Scholar] [CrossRef]
- Ding, K.; Ma, K.; Wang, S.; Simoncelli, E.P. Image quality assessment: Unifying structure and texture similarity. IEEE Trans. Pattern Anal. Mach. Intell. 2020, 44, 2567–2581. [Google Scholar] [CrossRef] [PubMed]
- Simonyan, K.; Zisserman, A. Very deep convolutional networks for large-scale image recognition. arXiv 2014, arXiv:1409.1556. [Google Scholar] [CrossRef]
- Liu, Z.; Lin, Y.; Cao, Y.; Hu, H.; Wei, Y.; Zhang, Z.; Lin, S.; Guo, B. Swin transformer: Hierarchical vision transformer using shifted windows. In Proceedings of the IEEE/CVF International Conference on Computer Vision, Montreal, BC, Canada, 11–17 October 2021; pp. 10012–10022. Available online: https://openaccess.thecvf.com/content/ICCV2021/papers/Liu_Swin_Transformer_Hierarchical_Vision_Transformer_Using_Shifted_Windows_ICCV_2021_paper.pdf (accessed on 1 May 2025).
- Gong, Y.; Deng, L.; Tao, S.; Lu, X.; Wu, P.; Xie, Z.; Ma, Z.; Xie, M. Unified Chinese license plate detection and recognition with high efficiency. J. Vis. Commun. Image Represent. 2022, 86, 103541. [Google Scholar] [CrossRef]
- Wang, Q.; Lu, X.; Zhang, C.; Yuan, Y.; Li, X. LSV-LP: Large-Scale Video-Based License Plate Detection and Recognition. IEEE Trans. Pattern Anal. Mach. Intell. 2022, 45, 752–767. [Google Scholar] [CrossRef]
- Xu, Z.; Yang, W.; Meng, A.; Lu, N.; Huang, H.; Ying, C.; Huang, L. Towards end-to-end license plate detection and recognition: A large dataset and baseline. In Proceedings of the European Conference on Computer Vision (ECCV), Munich, Germany, 8–14 September 2018; pp. 255–271. Available online: https://openaccess.thecvf.com/content_ECCV_2018/papers/Zhenbo_Xu_Towards_End-to-End_License_ECCV_2018_paper.pdf (accessed on 1 May 2025).
- Gonc, G.R.; da Silva, S.P.G.; Menotti, D.; Schwartz, W.R. Benchmark for license plate character segmentation. J. Electron. Imaging 2016, 25, 053034. [Google Scholar] [CrossRef]
- Laroca, R.; Severo, E.; Zanlorensi, L.A.; Oliveira, L.S.; Gonc, G.R.; Schwartz, W.R.; Menotti, D. A Robust Real-Time Automatic License Plate Recognition Based on the YOLO Detector. In Proceedings of the 2018 International Joint Conference on Neural Networks (IJCNN), Rio de Janeiro, Brazil, 8–13 July 2018; pp. 1–10. [Google Scholar] [CrossRef]
- Laroca, R.; Cardoso, E.V.; Lucio, D.R.; Estevam, V.; Menotti, D. On the Cross-dataset Generalizationin License Plate Recognition. In Proceedings of the International Conference on Computer Vision Theory and Applications (VISAPP), Online Event, 6–8 February 2022; pp. 166–178. [Google Scholar] [CrossRef]
- Gonc, G.R.; Diniz, M.A.; Laroca, R.; Menotti, D.; Schwartz, W.R. Real-time automatic license plate recognition through deep multi-task networks. In Proceedings of the 2018 31st SIBGRAPI Conference on Graphics, Patterns and Images (SIBGRAPI), Parana, Brazil, 29 October–1 November 2018; pp. 110–117. [Google Scholar] [CrossRef]
- Singh, J.; Bhushan, B. Real time Indian license plate detection using deep neural networks and optical character recognition using LSTM tesseract. In Proceedings of the 2019 International Conference on Computing, Communication, and Intelligent Systems (ICCCIS), Greater Noida, India, 18–19 October 2019; pp. 347–352. [Google Scholar] [CrossRef]
- Du, Y.; Li, C.; Guo, R.; Yin, X.; Liu, W.; Zhou, J.; Bai, Y.; Yu, Z.; Yang, Y.; Dang, Q. Pp-ocr: A practical ultra lightweight ocr system. arXiv 2020, arXiv:2009.09941. [Google Scholar] [CrossRef]
- Yu, W.; Ibrayim, M.; Hamdulla, A. Scene text recognition based on improved CRNN. Information 2023, 14, 369. [Google Scholar] [CrossRef]
- Park, S.C.; Park, M.K.; Kang, M.G. Super-resolution image reconstruction: A technical overview. IEEE Signal Process. Mag. 2003, 20, 21–36. [Google Scholar] [CrossRef]
- Glasner, D.; Bagon, S.; Irani, M. Super-resolution from a single image. In Proceedings of the 2009 IEEE 12th International Conference on Computer Vision, Kyoto, Japan, 29 September–2 October 2009; pp. 349–356. [Google Scholar] [CrossRef]
- Dong, C.; Loy, C.C.; He, K.; Tang, X. Learning a deep convolutional network for image super-resolution. In Proceedings of the Computer Vision-ECCV 2014: 13th European Conference, Zurich, Switzerland, 6–12 September 2014; Proceedings, Part IV 13. Springer: Berlin/Heidelberg, Germany, 2014; pp. 184–199. [Google Scholar] [CrossRef]
- Ledig, C.; Theis, L.; Husza, F.; Caballero, J.; Cunningham, A.; Acosta, A.; Aitken, A.; Tejani, A.; Totz, J.; Wang, Z. Photo-realistic single image super-resolution using a generative adversarial network. In Proceedings of the IEEE Conference on Computer Vision and Pattern Recognition, Honolulu, HI, USA, 21–26 July 2017; pp. 4681–4690. Available online: https://openaccess.thecvf.com/content_cvpr_2017/papers/Ledig_Photo-Realistic_Single_Image_CVPR_2017_paper.pdf (accessed on 1 May 2025).
- O’shea, K.; Nash, R. An introduction to convolutional neural networks. arXiv 2015, arXiv:1511.08458. [Google Scholar] [CrossRef]
- Lai, W.-S.; Huang, J.-B.; Ahuja, N.; Yang, M.-H. Fast and accurate image super-resolution with deep laplacian pyramid networks. IEEE Trans. Pattern Anal. Mach. Intell. 2018, 41, 2599–2613. [Google Scholar] [CrossRef]
- Zhang, K.; Zuo, W.; Zhang, L. Learning a single convolutional super-resolution network for multiple degradations. In Proceedings of the IEEE Conference on Computer Vision and Pattern Recognition, Salt Lake City, UT, USA, 18–23 June 2018; pp. 3262–3271. Available online: https://openaccess.thecvf.com/content_cvpr_2018/papers/Zhang_Learning_a_Single_CVPR_2018_paper.pdf (accessed on 1 May 2025).
- Lin, H.; Hosu, V.; Saupe, D. KADID-10k: A large-scale artificially distorted IQA database. In Proceedings of the 2019 Eleventh International Conference on Quality of Multimedia Experience (QoMEX), Berlin, Germany, 5–7 June 2019; pp. 1–3. [Google Scholar] [CrossRef]
- Deng, J.; Dong, W.; Socher, R.; Li, L.-J.; Li, K.; Fei-Fei, L. Imagenet: A large-scale hierarchical image database. In Proceedings of the 2009 IEEE Conference on Computer Vision and Pattern Recognition, Miami, FL, USA, 20–25 June 2009; pp. 248–255. [Google Scholar] [CrossRef]
- Deng, J.; Wei, H.; Lai, Z.; Gu, G.; Chen, Z.; Chen, L.; Ding, L. Spatial Transform Depthwise Over- Parameterized Convolution Recurrent Neural Network for License Plate Recognition in Complex Environment. J. Comput. Inf. Sci. Eng. 2023, 23, 011010. [Google Scholar] [CrossRef]
- Du, S.; Ibrahim, M.; Shehata, M.; Badawy, W. Automatic license plate recognition (ALPR): A state-of- the-art review. IEEE Trans. Circuits Syst. Video Technol. 2012, 23, 311–325. [Google Scholar] [CrossRef]
- Seibel, H.; Goldenstein, S.; Rocha, A. Eyes on the target: Super-resolution and license-plate recognition in low-quality surveillance videos. IEEE Access 2017, 5, 20020–20035. [Google Scholar] [CrossRef]
- Cheriet, M.; Kharma, N.; Liu, C.-L.; Suen, C. Character Recognition Systems: A Guide for Students and Practitioners; John Wiley & Sons: Hoboken, NJ, USA, 2007. [Google Scholar]
- Medsker, L.R.; Jain, L. Recurrent neural networks. Des. Appl. 2001, 5, 2. [Google Scholar]
- Yu, Y.; Si, X.; Hu, C.; Zhang, J. A review of recurrent neural networks: LSTM cells and network architectures. Neural Comput. 2019, 31, 1235–1270. [Google Scholar] [CrossRef]
- Dey, R.; Salem, F.M. Gate-variants of gated recurrent unit (GRU) neural networks. In Proceedings of the 2017 IEEE 60th International Midwest Symposium on Circuits and Systems (MWSCAS), Boston, MA, USA, 6–9 August 2017; pp. 1597–1600. [Google Scholar] [CrossRef]
- Mehrotra, K.; Gupta, M.K.; Khajuria, K. Collaborative deep neural network for printed text recognition of indian languages. In Proceedings of the 2019 Fifth International Conference on Image Information Processing (ICIIP), Shimla, India, 15–17 November 2019; pp. 252–256. [Google Scholar] [CrossRef]
- Dutta, K.; Krishnan, P.; Mathew, M.; Jawahar, C.V. Improving CNN-RNN hybrid networks for hand-writing recognition. In Proceedings of the 2018 16th International Conference on Frontiers in Handwriting Recognition (ICFHR), Niagara Falls, NY, USA, 5–8 August 2018; pp. 80–85. [Google Scholar] [CrossRef]
- Rao, Z.; Yang, D.; Chen, N.; Liu, J. License plate recognition system in unconstrained scenes via a new image correction scheme and improved CRNN. Expert Syst. Appl. 2024, 243, 122878. [Google Scholar] [CrossRef]
- Aguilar, S.T.; Jolivet, V. Handwritten text recognition for documentary medieval manuscripts. J. Data Min. Digit. Humanit. 2023. Available online: https://hal.science/hal-03892163v3/file/HTR_medieval_latin_french_V3.pdf (accessed on 1 May 2025).
- Dosselmann, R.; Yang, X.D. A comprehensive assessment of the structural similarity index, Signal. Image Video Process. 2011, 5, 81–91. [Google Scholar] [CrossRef]
- Liu, Y.; Chen, H.; Chen, Y.; Yin, W.; Shen, C. Generic perceptual loss for modeling structured output dependencies. In Proceedings of the IEEE/CVF Conference on Computer Vision and Pattern Recognition, Nashville, TN, USA, 19–25 June 2021; pp. 5424–5432. [Google Scholar]
- Github for Chinese License Plate Generation. Available online: https://github.com/zheng-yuwei/license-plate-generator (accessed on 1 May 2025).
- Gou, J.; Yu, B.; Maybank, S.J.; Tao, D. Knowledge distillation: A survey. Int. J. Comput. Vis. 2021, 129, 1789–1819. Available online: https://arxiv.org/pdf/2006.05525 (accessed on 1 May 2025). [CrossRef]
- Wu, K.; Zhang, J.; Peng, H.; Liu, M.; Xiao, B.; Fu, J.; Yuan, L. Tinyvit: Fast pretraining distillation for small vision transformers. In European Conference on Computer Vision; Springer: Cham, Switzerland, 2022; pp. 68–85. Available online: https://arxiv.org/pdf/2207.10666 (accessed on 1 May 2025).
- Venkatesh, S.V.; Anand, A.P.; Sahar, S.G.; Ramakrishnan, A.; Vijayaraghavan, V. Real-time Surveillance based Crime Detection for Edge Devices. In VISIGRAPP; (4: VISAPP); SciTePress: Setúbal, Portugal, 2020; pp. 801–809. Available online: https://www.academia.edu/download/92679187/89901.pdf (accessed on 1 May 2025).


| Dataset | Number of Images | Country | Distance Variability | Tilt Angle Variability | Blur | Illumination Variability | Resolution |
|---|---|---|---|---|---|---|---|
| LSV-LP [21] | 1,175,390 | China | High | High | Yes | Yes | 1920 × 1080 |
| CCPD [22] | 290,000 | China | Medium | Medium | Yes | Yes | 720 × 1160 |
| SSIG-SegPlates [23] | 2000 | Brazil | Low | Low | No | Limited | 1920 × 1080 |
| UFPR-ALPR [24] | 4500 | Brazil | Medium | Low | Yes | Yes | 1920 × 1080 |
| RodoSol [25] | 20,000 | Brazil | Medium | Medium | Yes | Yes | 1920 × 1080 |
| Network Architecture | Layers for Feature Extraction | Losses | Network Weight from Pretrained Dataset |
|---|---|---|---|
| CNN [36] | last layer | Multi-task MSE loss [26] (MSE + perceptual loss) | SSIG-ALPR [26] |
| VGG-16 [13] | {conv1_2, conv2_2, conv3_3, conv4_3, conv5_3} | DISTS loss [16] (Structural loss + Texture loss) | KADID-10k [37] |
| VGG-19 | {conv1_2, conv2_2, conv3_4, conv4_4, conv5_4} | VGG loss [17] (Perceptual loss + style loss) | ImageNet-10k [38] |
| Swin Transformer [13] | {layers.0.blocks.1,layers.1.blocks.1, layers.2.blocks.5,layers.3.blocks.1} | SwinT loss [19] (proposed) (Perceptual loss + style loss) | ImageNet-1k [39] |
| CRNN [14] | {conv3_2, conv4_1, conv4_2} | CRNN loss [40] (proposed) (Perceptual loss) | CCPD [20] and CRPD [22] |
| Metric Type | Description | Implication |
|---|---|---|
| 7/7 Accuracy | Strictest—all characters correct | Best for law enforcement, tolling, legal ID. |
| 6/7 Accuracy | Tolerates 1 character error | Good for real-time monitoring, alerting where minor errors are acceptable. |
| 5/7 Accuracy | Still useful in noisy environments | Moderate-level tasks—fleet tracking, logistics where identity can be inferred with tolerable errors. |
| Average Accuracy | General OCR efficiency (across all characters and samples) | Overall system health indicator—used for model selection and benchmarking. |
| Super-Resolution Model | Loss from Pretrained Model | Architecture Type | Function/Strength | OCR Accuracy | |||
|---|---|---|---|---|---|---|---|
| 7 out of 7 | 6 out of 7 | 5 out of 7 | |||||
| Pixel Shuffle (Repro.) [16] | Single loss | Multi-Task MSE | MSE + OCR perceptual loss | Multi-task for license plate detection, character segmentation, and OCR proposed by Nascimento et al. (2023) [16] | 3.85% | 38.46% | 67.95% |
| SwinFIR | Single loss | Multi-task MSE | MSE + OCR perceptual loss | Multi-task proposed by Nascimento et al. (2023) [16] | 19.23% | 42.31% | 66.67% |
| CRNN | Recurrent Neural Network (RNN) | Excels At Sequence Learning, Beneficial For Character Continuity. | 25.64% | 61.54% | 82.05% | ||
| SwinT | Transformer (VisionTransformer) | Leverages Global Attention, Ideal For Holistic Pattern Enhancement. | 28.21% | 61.54% | 83.33% | ||
| DISTS | CNN-Based Perceptual Loss | Emphasizes Visual Similarity Using Deep Features, Enhancing Human-Perceived Quality. | 32.05% | 65.38% | 84.62% | ||
| VGG | CNN-Based Perceptual Loss | Captures Localized Textures, Aiding Character Shape Restoration. | 33.33% | 73.08% | 88.46% | ||
| Ensemble loss | CRNN + VGG | CNN + RNN (Ensemble) | Combines spatial feature extraction (VGG) with sequence modeling (CRNN); improves character-level consistency. | 39.74% | 69.23% | 89.74% | |
| SwinT + DISTS | Transformer + CNN Loss (Ensemble) | uses global attention (Swin Transformer) with deep perceptual similarity (DISTS); excels in semantic restoration. | 47.44% | 75.64% | 89.74% | ||
| Loss Model for Feature Extraction | OCR Average Accuracy (Ri) | RSR − RLR | Avg. OCR Characters Recognized | |
|---|---|---|---|---|
| LR | 75.57% | 0.00% | 5.29 | |
| SwinFIR original loss | Charbonnier Loss | 68.68% | −6.89% | 4.81 |
| Single perceptual loss | Multi-Task MSE | 70.14% | −5.43% | 4.91 |
| CRNN | 78.14% | 2.57% | 5.47 | |
| SwinT | 79.57% | 4.00% | 5.57 | |
| DISTS | 80.57% | 5.00% | 5.64 | |
| VGG | 82.57% | 7.00% | 5.78 | |
| Ensemble perceptual losses | Multi-Task MSE + SwinT | 80.14% | 4.57% | 5.61 |
| DISTS + VGG | 80.14% | 4.57% | 5.61 | |
| Multi-Task MSE + CRNN | 81.86% | 6.29% | 5.73 | |
| SwinT + VGG | 81.86% | 6.29% | 5.73 | |
| CRNN + DISTS | 82.86% | 7.29% | 5.80 | |
| SwinT + CRNN | 82.86% | 7.29% | 5.80 | |
| CRNN + VGG | 83.43% | 7.86% | 5.84 | |
| SwinT + DISTS | 85.14% | 9.57% | 5.96 | |
| HR | 99.00% | 23.43% | 6.93 | |
| GT | HR | LR | SROF VGG LOSS | SR OF SWINT + DISTS LOSS | |
|---|---|---|---|---|---|
| OCR ACCURACY OF TOTAL CHARACTERS | 413 | 389 | 300 | 363 | 364 |
| OCR ACCURACY OF CHARACTERS PER LICENSE PLATE | 7 | 6.59 | 5.08 | 6.15 | 6.17 |
| OCR AVERAGE ACCURACY (%) | - | 94.19% | 72.64% | 87.89% | 88.14% |
Disclaimer/Publisher’s Note: The statements, opinions and data contained in all publications are solely those of the individual author(s) and contributor(s) and not of MDPI and/or the editor(s). MDPI and/or the editor(s) disclaim responsibility for any injury to people or property resulting from any ideas, methods, instructions or products referred to in the content. |
© 2025 by the authors. Licensee MDPI, Basel, Switzerland. This article is an open access article distributed under the terms and conditions of the Creative Commons Attribution (CC BY) license (https://creativecommons.org/licenses/by/4.0/).
Share and Cite
Tsai, P.-F.; Shiu, J.-Y.; Yuan, S.-M. A Deep Learning Framework of Super Resolution for License Plate Recognition in Surveillance System. Mathematics 2025, 13, 1673. https://doi.org/10.3390/math13101673
Tsai P-F, Shiu J-Y, Yuan S-M. A Deep Learning Framework of Super Resolution for License Plate Recognition in Surveillance System. Mathematics. 2025; 13(10):1673. https://doi.org/10.3390/math13101673
Chicago/Turabian StyleTsai, Pei-Fen, Jia-Yin Shiu, and Shyan-Ming Yuan. 2025. "A Deep Learning Framework of Super Resolution for License Plate Recognition in Surveillance System" Mathematics 13, no. 10: 1673. https://doi.org/10.3390/math13101673
APA StyleTsai, P.-F., Shiu, J.-Y., & Yuan, S.-M. (2025). A Deep Learning Framework of Super Resolution for License Plate Recognition in Surveillance System. Mathematics, 13(10), 1673. https://doi.org/10.3390/math13101673