Abstract
With the rapid popularization of video software, video recommendation algorithms have become crucial for ensuring the quality of video platforms. This study focuses on video tags and constructs a ternary structure of user–video–tags. It proposes a bidirectional material diffusion algorithm based on fusion hypergraph random walks for video recommendation. The effectiveness of the proposed algorithm is validated by comparing it with existing algorithms on public datasets.
MSC:
68T01
1. Introduction
In recent years, with the continuous advancement of technology and the rapid development of information technology, users have been able to access more online information resources at higher speeds and with lower latency. The dissemination of large amounts of Internet content carried by videos is becoming increasingly widespread, and the number of video users is continuously growing. As a new form of user expression and content dissemination, videos are accepted by users for their intuitive and easy-to-understand characteristics, contributing to the main increase in Internet traffic and usage time, becoming a pillar medium for information dissemination.
However, as the user base continues to grow and video content becomes increasingly rich, the abundance of video information has made it more difficult for users to find what they need. Efficient and convenient retrieval of desired video information from a vast amount of data has become an urgent problem that needs to be solved. There are many related studies. Harshal Shrimali et al. [1] suggested videos based on their semantic similarity to queries using video transcripts and ranked them using natural language ranking algorithms. Changhao Huang et al. [2] proposed a Danmaku video recommendation algorithm that integrates video multifunctionality. Based on the study and application of latent factor models in short video recommendation algorithms, Xinyu Huang et al. [3] aimed to recommend video content that truly meets user needs and interests. Fan Yang et al. [4] used deep neural networks to integrate user ratings of videos on video platforms and communities, predict user preferences for videos, and improve the accuracy of personalized recommendations. Navneet Raju et al. [5] dynamically recommended similar events in videos or other videos to users based on the detailed context of specific times in the video. Peng Jiang et al. [6] proposed an intelligent recommendation method that combines a potential Dirichlet allocation model with an artificial neural network. Sun et al. [7] proposed an interpretable representation model to illustrate the hierarchical design of grammar reasoning with recommendations on complex structures, which can be better generated with related recommendations. The multi-view recommendation system [8,9] focuses on learning interactive information among users, which better learns information from different aspects, while cold-start recommendation techniques are utilized to thoroughly capture the recommended information. However, research on recommendation algorithms based on video tags is still relatively lacking.
The material diffusion recommendation algorithm is a very classic recommendation algorithm, and there are also many related studies. Yixiu Kong et al. [10] introduced the centrality of complex networks into diffusion-based recommendation systems and tested their performance. Lei Min et al. [11] studied a learning resource recommendation algorithm that combines knowledge graphs and interest diffusion mechanisms. Ya Zhi Yang et al. [12] proposed an improved adaptive learning service recommendation algorithm based on big data. Prasad et al. [13] designed a graph convolutional network model based on a bilinear diffusion mechanism to capture interactions among users and their neighbors, improving the recommendation accuracy with better user representation. Li et al. [14] proposed a RecDiff model, which aims at denoising the interruptions on user representation among the hidden-space diffusion module. The accuracy of recommendations has been largely improved with the elimination of noise. Wei and Fang [15] and Sun et al. [16] utilized bundle data to make marketing strategies based on crowd-sourcing tasks, with the combination of bundle intents and crowd-sourcing tasks. Mumin et al. [17] utilized object ratings to compute similarities among users within neighborhoods and calculated object scores using a resource diffusion method that considers user-based sources. However, the above studies did not take into account the impact of video tags.
Based on this, the contributions of this study can be summarized as follows. First, we built up a tag energy initialization method based on random walks among hypergraphs, which solves the issue of unreasonable initial resource distribution by constructing hypergraphs to strengthen the relationships between users and videos. Second, we redesigned the bidirectional material diffusion algorithm, which obtains vectors of the tags based on users’ interests and the degree of relevance of tags to videos, respectively. The issue of limited interaction with video items and the sparsity of user interaction is largely solved. Third, we analyzed the complementary role of negative feedback based on NFDTW-TF-IDF among user recommendations and redesigned the negative feedback definition algorithm to collect negative feedback behaviors. Then, the dynamic time windows were used to calculate users’ negative feedback labels. Finally, we applied the NFDTW-TF-IDF negative feedback label determination algorithm to the filtering of recommended videos and verified the correctness of this method through comparative experiments.
The organizational structure of this article is as follows: Section 1 provides the introduction to the study, Section 2 introduces the concept of recommendation algorithms, Section 3 provides a detailed introduction to the design scheme of recommendation algorithms, Section 4 describes the comparative experiments conducted, Section 5 outlines the design scheme of the negative feedback label determination algorithm based on NFDTW-TF-IDF, and Section 6 explains the comparative experiment of the bidirectional video recommendation material diffusion algorithm based on NFDTW-TF-IDF negative feedback filtering. Finally, Section 7 gives a brief discussion of our paper on future prospect of research, and Section 8 closes with a summary of the entire text.
2. The Design Philosophy of the Proposed Algorithm
The algorithm design philosophy of this study comprises several key aspects, as follows.
Initially, the study was inspired by the random walk algorithm on hypergraphs, positing that the approach of calculating the importance of nodes within a graph network based on a transition probability matrix can provide a reasonable initial energy value for the material diffusion algorithm.
Second, the hypergraph represents a graph structure that describes multivariate relationships and can depict the complex relationships among users, tags, and video items based on user interaction behaviors. By focusing on the influence of users who tag and the activity level of videos associated with tags, we can construct various hypernode and hyperedge weighting strategies. These strategies provide transition probabilities for random walks on hypergraphs, thereby enabling the calculation of the importance of each tag for the target user or video. This implicit energy initialization method, which focuses solely on user behavior logs, has a wider application than the explicit method that requires users to rate videos.
Finally, traditional material diffusion is based on user–item bipartite graphs. When a new video is released, there are few or even no records of user interactions with the video in the system, resulting in a relatively sparse user interaction graph. This sparsity significantly reduces the accuracy of personalized recommendations for users. In light of this, this paper introduces tags as intermediary elements into the graph-based material diffusion algorithm and constructs a user–tag–video graph network model. The model undertakes bidirectional diffusion by integrating users’ interest in tags and the relevance of tags to videos, thereby calculating the final score of users for videos.
The proposed algorithm, which integrates bidirectional material diffusion with random walks on hypergraphs, is divided into three main steps:
Step 1: Constructing two different types of hypergraphs on the user–tag and tag–video sides, respectively, and performing random walks on the hypergraphs to calculate the initial energy values of the tags;
Step 2: Calculating the user–tag interest and tag–video relevance through material diffusion algorithms on both sides;
Step 3: Normalizing the tag interest and relevance and then integrating them through the inner product to construct the user–video rating matrix. The Top-N algorithm is then used to determine the top N video items of greatest interest to users, thereby achieving personalized recommendations.
3. The Detailed Design Scheme of the Algorithm
3.1. Definition of Hypergraph Construction
In tag-based video recommendation systems, user interaction data can be represented as a triplet , where represents the set of users, ; represents the set of video items, ; and represents the set of tags, . A user tagging action sequence indicates that user has tagged video with tag , thereby establishing associative relationships between users and tags and tags and videos. Users, tags, and videos are considered nodes, and their interactions are considered connections. This forms a tag-based graph network model, as illustrated in Figure 1.
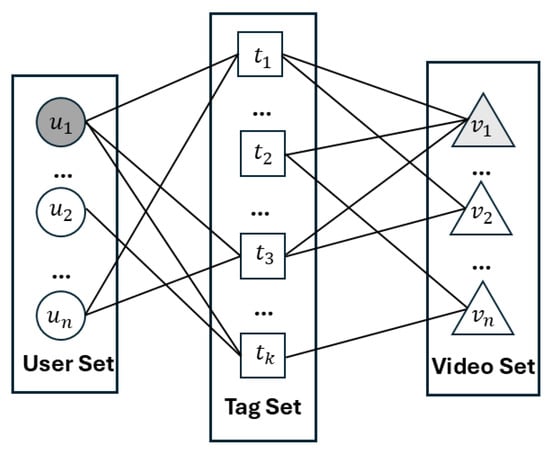
Figure 1.
Tag-based graph network model.
Combined with Figure 1, a user–tag side hypergraph was established, as shown in Figure 2. In the figure, tags are first considered as hypernodes. For the target user , the user’s browsing or clicking behaviors in the recommendation system affect different videos. Therefore, the hypernodes represented by tags associated with user behavior can be aggregated into different hyperedges based on the diversity of the source videos.
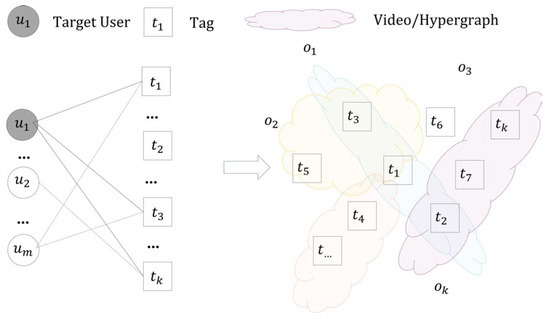
Figure 2.
User–tag side hypergraph.
Combined with Figure 1, a video–tag side hypergraph was established, as shown in Figure 3. Under the target video , the tags associated with the video item are those marked by different users during posting or commenting. Therefore, the tags marked by different users can be aggregated into different hyperedges.
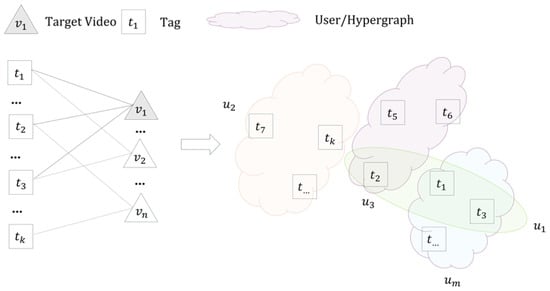
Figure 3.
Video–tag side hypergraph.
3.2. Hypergraph Construction Considering the Source of Tags
In the hypergraphs and defined in the previous subsection, the hypernodes representing tags have been aggregated into hyperedges based on their sources of association as either video types or user types, thereby constructing the hypergraphs. In this section, we set up weighting strategies for hyperedges and hypernodes based on activity levels within these hypergraph structures, assigning different weights to calculate transition probabilities. Since different weights signify different transition probabilities, the higher the weight, the greater the transition probability, thus increasing the likelihood of traversal toward it.
In video recommendation systems, activity level refers to the degree of activity of users or video items over a certain period. Activity level can usually be measured by several indicators, including the duration and frequency of views, the number of likes, the number of comments, the number of shares, and the number of uploads, among others.
Subsequently, separate weighting settings are applied to the user–tag and tag–video hypergraphs.
In the user–tag hypergraph, the concept of video activity level is utilized to weight the hyperedges. If the target user interacts with a more active video item through behaviors such as playing, commenting, liking, or sharing, it indicates that the video is widely popular and more likely to attract the target user’s attention. This video, in comparison to other videos the target user interacts with, better reflects the target user’s level of engagement. Therefore, it is proposed that video activity levels be used to indicate the importance of a video to the target user. The formula for calculation is as follows:
where represents the weight of the hyperedge corresponding to video item , represents the number of comments for video item , represents the number of likes for video item , represents the number of views for video item , and represents the number of shares for video item .
To measure the weights of the hypernodes in the user–tag hypergraph, the relevance between tags and video items is used to weight the hypernodes. When users tag video items, the tags applied earlier are considered to have greater relevance to the item. Therefore, the order in which a user tags the current item can be used to quantify the weight of the hypernode, with the specific formula as follows:
where represents the weight of hypernode within hyperedge , where is the chronological order of the target user tagging label , and is the size of the set of tags that the target user has applied to video item , that is, the number of hypernodes in the hyperedge.
In the tag–video hypergraph, the concept of user activity level is also utilized to weight the hyperedges. If the target video is interacted with by more active users through behaviors such as playing, commenting, liking, or sharing, and these users exhibit higher engagement and loyalty, then the tags marked by these active users are more relevant to the content of the target video, and thus the target video should place greater emphasis on active users. Therefore, it is proposed that user activity levels be used to indicate the significance of a user to the target video. The formula for calculation is as follows:
where represents the weight of the hyperedge corresponding to user , represents the number of comments made by user , represents the number of likes given by user , represents the number of times user has watched the content, and represents the number of times user has shared the content.
In the tag–video hypergraph, the hypernodes are weighted based on the user’s interest level in tags. User tag interest takes into account the frequency of tagging by the user. The more frequently a user tags a target video, the greater their interest in that tag is considered. Therefore, the proportion of a user’s tag annotation frequency for the current item can be used to quantify the weight of the hypernode. The specific formula is as follows:
where represents the weight of hypernode within hyperedge , and denotes the number of times user interacts with tag . The higher the number of interactions, the greater the user’s interest in the tag. The notations mentioned in this section are listed in Table 1 below.

Table 1.
Basic hypergraph weighting strategy parameters.
3.3. Tag Energy Initialization Based on Random Walks
In this subsection, the newly defined hyperedge and hypernode weighting strategies are combined to calculate the importance of different tags for the target user and the importance of different tags for the target video, providing differentiated initial tag energy values for the bidirectional material diffusion algorithm described in the next subsection.
The random walk process based on the hypergraph is as follows: first, transition from the initial point to an adjacent hyperedge , with the transition probability denoted by . The specific calculation formula is as follows:
Then, transition from the hyperedge to a randomly selected hypernode within it, with the transition probability calculation formula as follows:
The specific meaning of this formula is to first transition to a hyperedge adjacent to the initial point, and then continue to select a hypernode within the chosen hyperedge for further transition, with the transition probability denoted by .
Based on matrix-related knowledge, we can obtain the probability matrix for random walks on hypernodes:
where and represent the transposed matrices of the degree diagonal matrices for hypernodes and hyperedges, respectively.
Finally, by combining with the probability matrix to continue the random walk, the importance of each tag to the target user or target video can be calculated. The importance values of all tag nodes are represented by the vector , with the calculation formula as follows:
where is the damping coefficient, which is a crucial parameter in graph-based algorithms, representing the probability of continuing the walk to other adjacent nodes from the current tag node. The selection of the damping coefficient value aims at maintaining the balance between exploring new paths and limiting the walk to immediate neighbors; typically, the value of is set to 0.85. Conversely, represents the probability of stopping the visit from the current tag node and randomly jumping to other nodes to prevent the current node from having no neighbors. Moreover, in the formula, the vector is a unit column vector, and is the total number of all tag nodes. It is worth noting that the initial probability is . After several iterations, when the values in the vector converge and become constant, the random walk process stops, and the elements in can represent the importance of their corresponding tag items. These values are then used as the initial tag energy values for the material diffusion process described later. The general parameters utilized in this section are shown in Table 2.
Table 2.
Basic tag energy parameters.
3.4. Bidirectional Tag Energy Diffusion
Following the random walk process on the hypergraph in the previous subsection, we can determine the importance of different associated tags to the target user and the target video. These values can serve as the initial energy values for the bidirectional material diffusion method in this section. Considering the energy diffusion weighting issue, the tag interaction frequency is used to determine the energy diffusion weighting distribution strategy. The general parameters utilized in this section are shown in Table 3.
Table 3.
General bidirectional tag energy diffusion parameters.
First, we focus on the target user for tag–user–tag direction energy diffusion. We set up a user–tag two-dimensional relationship adjacency matrix , where the internal element is defined as the number of interactions between the user and the tag. We then define the tag energy initialization vector associated with the target user after the random walk as , and proceed to material diffusion. The user energy calculation formula in the tag–user diffusion direction is known as:
where represents the sum of the out-degree edge weights of tag , which are toward the user side. Next, we substitute into the formula and continue the diffusion toward the tag direction. The user–tag diffusion formula is as follows:
After substitution:
where is an element in the transpose matrix of the user–tag matrix , represents the sum of out-degree edge weights of user , and represents the final energy obtained by tag , differentiating from the tag variable involved in the first diffusion.
According to matrix theory, the user energy vector can be obtained as follows:
Furthermore, the final energy vector of tags associated with the target user , , can be obtained, as follows:
Similarly, we proceed with tag–video–tag direction energy diffusion to obtain the video energy vector :
where represents the sum of out-degree edge weights of tag toward the video side, similarly through the video–tag direction energy diffusion to obtain the final tag energy vector :
where is an element in the transpose matrix of the video–tag matrix , represents the sum of out-degree edge weights of video , and represents the final energy obtained by tag
The video energy vector is:
Furthermore, the final tag energy vector can be obtained:
3.5. User Rating Calculation
The calculated from the above content represents the interest vector of the target user toward associated tags, while represents the content relevance vector of associated tags to the target video . By normalizing and and then performing an inner product fusion, the rating of the target video by target user can be determined. Subsequently, the Top-N algorithm is used to calculate and recommend the top N videos to the target user .
To generalize the calculation results to the ratings of all users for video items, we define the elements in as representing the interest level of a target user in the associated tag , and define the elements in as indicating the content relevance of the target video with its associated tag .
After normalizing the elements in , we have:
After normalizing the elements in , we have:
We calculate the rating of target user for target video as follows:
After the aforementioned operations, a set of ratings for video items by each user can be obtained. Subsequently, using the relevant Top-N algorithm, the top N video items with the highest user ratings can be calculated. These items can then be compiled into a candidate playlist and recommended to users.
4. HRW-BMD Experiment
To verify the effectiveness and accuracy of the algorithm, comparative experiments were conducted on the KuaiRec dataset, evaluating the algorithm’s precision, recall, and F1-score to validate its performance. The KuaiRec dataset was collected by a video social media platform based on the interaction behaviors of 7176 users in 10,728 videos. The dataset contains users’ interaction, social network, user characteristics, video daily characteristics, and video category files. These files typically describe users’ information and preferences on social media.
Our experimental data were randomly extracted from an original social media source, consisting of 5000 records of user interactions with video content. The 5000 user records in our experiment were randomly extracted from the “big_matrics” file. We utilized the pandas library to extract user-related interactive video data and concatenated the attributes based on requirements.
The comparison algorithms used in this experiment included MD [18], BGRA [19], WTG [20], and the HRW-BMD algorithm proposed in this section. This experiment analyzed the performance of these algorithms using precision, recall, and F1-score metrics, conducting multiple independent repeated experiments at different recommendation list lengths to examine the improvement effects on the algorithm’s performance.
When the recommendation list length K was 20, the precision rates all decreased, but the HRW-BMD algorithm experienced the smallest decline, while the MD algorithm saw the largest drop. For recommendation list lengths of 5 and 10, the difference in F1-scores between the MD and WTG algorithms was small, but for recommendation list lengths of 15 and 20, WTG performed better, surpassing MD’s performance. The WTG algorithm showed relatively stable performance across all recommendation list lengths, but with a comparatively lower F1-score. As can be seen from Figure 4, Figure 5 and Figure 6, the HRW-BMD algorithm proposed in this paper performed exceptionally well under all metrics and conditions.
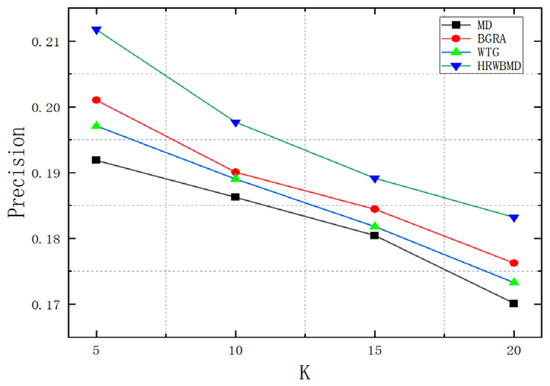
Figure 4.
Precision results.
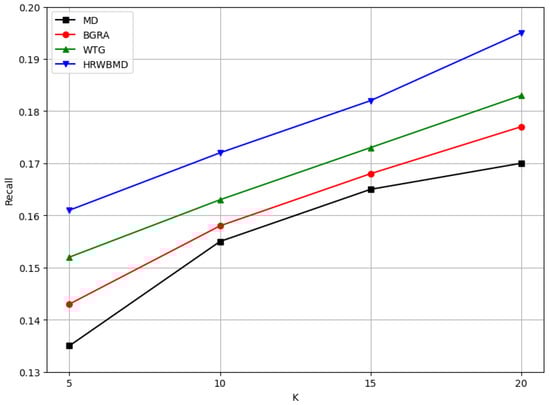
Figure 5.
Recall results.
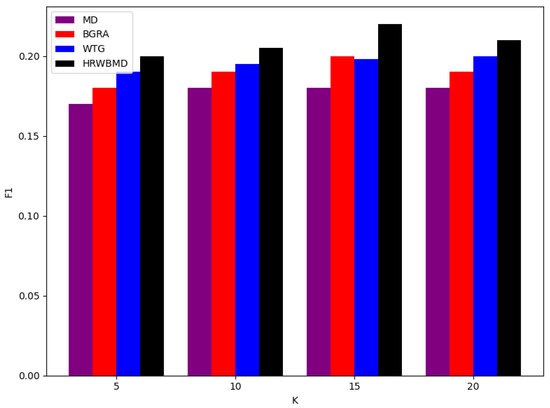
Figure 6.
F1-score results.
5. The Negative Feedback Dynamic Time Window TF-IDF Tag Determination Algorithm
The algorithm proposed in Section 3, which combines hypergraph and bidirectional material diffusion, analyzes user–tag interest and video–tag relevance from a positive perspective to calculate user–video ratings for recommendations. However, it does not consider utilizing negative feedback information to filter out videos that users dislike in order to optimize recommendation effectiveness. Therefore, we propose a user negative feedback tag determination algorithm. This algorithm calculates the user dislike value for a tag by using an improved TF-IDF algorithm on user negative feedback video data within a dynamic time window (NFDTW-TF-IDF) and determines the video items containing this negative feedback tag that need to be filtered based on the calculation results.
The operational process of the algorithm proposed in this section mainly consists of three stages. The first stage is to determine a user’s negative feedback behavior. The second stage is to calculate the degree of dislike based on TF-IDF for the set of tags associated with the user’s negative feedback behavior. The third stage is to determine user negative feedback tags based on the magnitude of dislike values for tags and their frequency of occurrence within a sliding time window.
The algorithm for determining negative feedback tags based on NFDTW-TF-IDF follows these steps:
Step 1: Determine negative feedback behavior. Define videos with a playback duration less than the threshold and a playback ratio less than the threshold but greater than 0 as videos that the user dislikes, which is a form of negative feedback signal. Classify these videos as negative feedback videos;
Step 2: Set a sliding time window for user negative feedback video data, with the unit as days. represents a collection of negative feedback videos gathered in a day. is the set of tags contained in the videos;
Step 3: Iterate through the tags associated with negative feedback videos within each unit time window, and calculate the negative feedback tags for that day based on the NFDTW-TF-IDF algorithm;
Step 3.1: Calculate the aversion coefficient of tag in the unit time window ;
Step 3.2: Calculate the frequency ratio of tag in the unit time window ;
Step 3.3: Calculate the frequency ratio of tags in the sliding time window;
Step 3.4: Combine the data calculated in steps 3.1, 3.2, and 3.3 to calculate the user dislike value of tag in the unit time window and use to represent the collection of dislike values of various tags in the unit time window ;
Step 3.5: Identify the tag with the highest dislike value of the day, represented as the negative feedback tag for that day added to the set ;
Step 4: Determine the tag with the highest frequency in the set as the user’s negative feedback tag for the current time window.
5.1. Calculating the Dislike Value of Tags
The traditional TF-IDF algorithm is a term frequency weighting technique used to calculate the importance of terms in a collection of documents. This method implies that the importance of a term is directly proportional to its frequency of occurrence in the document and inversely proportional to the number of documents in the entire document set where it appears. Assuming a document set , with documents containing a set of terms , and using to count the number of times a term appears in a document, the TF-IDF algorithm is calculated as follows:
Here, represents the term frequency ratio of term in the document, while is the inverse document frequency, which represents the reciprocal of the total number of documents divided by the number of documents containing term .
In the traditional TF-IDF calculation process, the term frequency is used as the basis for determining the weight of a term, calculated based on the proportion of the term’s occurrences. However, this method does not consider that different terms appearing in different positions have different meanings, and their contributions to the weight of term importance should vary. For example, a title summarizes the entire text, providing a focus and deepening the main idea. Additionally, the beginning of a paragraph serves as a summary and refinement of the paragraph. Terms appearing in these positions should be given greater weight. Therefore, the algorithm proposed in this paper considers positional weight factors, treating tags as terms and the videos they are associated with as different paragraphs. The algorithm assigns different dislike weights to video-associated tags based on the proportion of time the user has not watched the video. Even for the same tag, its dislike weight when associated with different videos depends on the user’s dislike weight for the video, rather than just the frequency of the tag’s appearance.
The dislike weight of a video, denoted as , represents the user’s dislike for the video. In the user’s negative feedback dataset, although all express content that the user dislikes, considering that the user watches different videos for different lengths of time, it also represents the user’s different levels of aversion to different videos. The longer the user allows the video to play, the more it indicates that the user can tolerate the content of the video. Conversely, the shorter the playback time, the more the user may dislike the video. The calculation of is as follows:
where represents the dislike weight of the video in the unit time window, is the total duration of videos in the unit time window, and and are the start and end times, respectively, of the most recent user playback behavior. Equation (22) quantifies the proportion of the user’s weight for the unplayed time of a video to the total unplayed time of all videos for that day, representing the user’s aversion to the video in the unit time window.
The dislike coefficient for a tag represents the user’s aversion to the tag in the unit time window, and its calculation depends on the video dislike weight. The calculation formula is as follows:
where is the proportion of the dislike weight of a tag in the unit time window to the total dislike weight of all tags that appeared on that day. Here, is the dislike weight of the tag associated with a video in the unit time window. If the tag exists in the video, its dislike weight is equivalent to the dislike weight of the video. If the tag does not exist in the video, its weight is 0.
The more a tag appears as a proportion of the total appearances on a given day, the more the user dislikes that particular tag. This is a vertical consideration based on the current unit of time, and it is calculated using the following formula:
In the traditional TF-IDF algorithm, the IDF calculation process assumes that the fewer documents containing a term, the rarer the term and, thus, the more important it is. Conversely, the more documents containing a term, the less useful the term. However, this is not entirely correct. Analogously, in the field of video recommendation based on negative feedback, within a certain time window, a user’s aversion intent is relatively stable, and the videos they dislike almost all have the same characteristic tags, belonging to the same type of corpus. Therefore, when these characteristic tags appear in more time windows, the IDF value becomes smaller, and the user’s aversion value for these characteristic tags becomes lower. This is obviously not logical. Therefore, this improved method introduces the concept of a tag sliding time window frequency ratio based on the lateral consideration of the entire time window . The specific calculation formula is as follows:
where represents the count of occurrences of the target-associated tag in all n videos within a time window of length m, and is the count of occurrences of all tags in all videos within a time window of length m. This value considers the horizontal distribution of the target tag in the time window. A higher value indicates that the target tag accounts for a larger proportion of the user’s recent negative feedback behavior data, and the user often sets videos related to this tag as negative feedback videos. Finally, based on the tag dislike coefficient, tag frequency ratio in the unit time window, and tag frequency ratio in the sliding time window, the user’s dislike value for the target tag can be calculated. The calculation formula is as follows:
where is represents the user’s aversion to the tag appearing on a given day. A higher value indicates that the user dislikes the target tag more. With this, the calculation of the tag’s dislike value is completed.
5.2. Determining Negative Feedback Tags
In the previous section, a method for calculating the user’s dislike value for each tag appearing in each unit time window, denoted by , was described. The dislike values calculated for various tags on day i are added to the set . Initially, .
In the set , the items are sorted in descending order using the corresponding sorting algorithm. The item with the highest dislike value is then selected as the user’s negative feedback tag and added to the candidate list .
After repeating the above calculation process multiple times, the candidate negative feedback tags from each unit time window are added to the candidate set , such that . The occurrence count of each tag in is then calculated, and the tags are sorted in descending order based on their occurrence count. The tag with the highest occurrence count is selected as the user’s negative feedback tag, completing the determination of the user’s negative feedback tag. In this algorithm, a higher frequency of occurrence indicates that the candidate tag better describes the user’s negative feedback behavior, and selecting this tag as the user’s negative feedback tag is more accurate.
By determining the user’s negative feedback tag, the recommendation algorithm can be optimized to improve its effectiveness. Existing positive recommendation algorithms do not consider user negative feedback information. This algorithm analyzes user negative feedback behavior data in depth and performs weighted calculations to filter out tags representing the objects the user is least interested in. This allows the system to shield the user from disliked videos and only recommend videos that contain tags the user is interested in. This process ensures that the recommended objects will not cause user aversion, thereby promoting the continuous improvement and optimization of the recommendation algorithm.
6. HRW-BMD Experiments Based on NFDTW-TF-IDF
We continued to use the KuaiRec [21] dataset for these experiments. First, we determined the optimal video playback duration threshold and video playback duration ratio threshold for algorithm performance. Following that, we verified the performance of the algorithm introduced in Section 4 after incorporating negative feedback through comparative experiments.
6.1. Experiment to Determine the Video Playback Duration Ratio Threshold
By applying the negative feedback tag determination method proposed in this section to the HRW-BMD algorithm from Section 3, the performance of the negative feedback algorithm was compared by continuously adjusting the threshold size without considering the influence of playback duration. The results of the threshold’s impact on algorithm performance are shown in the Figure 7.
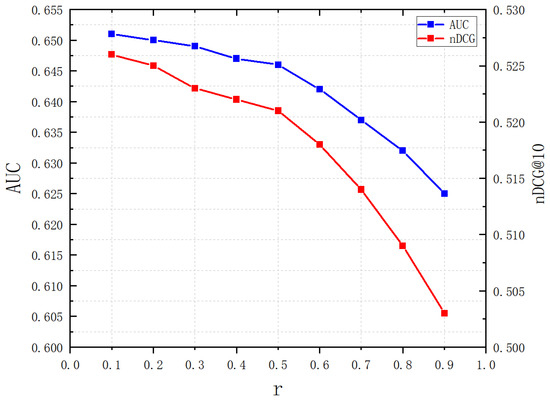
Figure 7.
Performance of AUG and nDCG based on threshold .
From the graph, it can be seen that when , both the AUC and nDCG metrics reached their highest values, indicating optimal algorithm performance. As the ratio threshold increases, the algorithm’s performance decreases. An increase in leads to a gradual increase in negative feedback and a decrease in positive feedback, resulting in a mixture of negative and positive feedback samples, thereby reducing the quality of recommendations.
Additionally, the graph shows that the threshold has a minor impact on algorithm performance. As increases, both the AUC and nDCG metrics show a decreasing trend, but the decrease is relatively small. This suggests that within this threshold range, the algorithm is not sensitive to changes in the ratio of viewing duration. It also indicates that, considering the negative feedback algorithm, the ratio between the viewing duration and the total duration of a video is not a decisive factor. Therefore, the duration of video playback should also be considered to optimize algorithm performance.
6.2. Experiment to Determine the Video Playback Stay Duration Threshold
We investigated the impact of stay time thresholds on the method. Similarly, by applying the negative feedback tag determination method proposed in this section to the HRW-BMD algorithm from Section 3 and setting the video playback duration ratio threshold to 0.1, different values were continuously adjusted to achieve optimal performance of the negative feedback tag algorithm.
Negative user feedback is identified through video items that express aversive intent after playback. For example, if users watch a video for only a short duration, it is considered negative feedback. However, determining negative feedback based on playback duration alone may have limitations, as videos have different lengths. Setting an appropriate threshold is challenging: if the threshold is too high, short videos are more likely to be incorrectly flagged as negative feedback; if it is too low, the method may fail to detect negative feedback on longer videos.
Therefore, we utilized a video playback duration threshold and a playback duration ratio threshold to evaluate users’ negative feedback intention. Specifically, if the duration of a certain video is less than the threshold and the ratio of video playback duration to the total duration of the video is less than , the interaction is considered negative feedback.
The experimental results of the algorithm are shown in Figure 8. From the graph, it can be seen that the performance of the method proposed in this section improves with an increase in the threshold , reaching its highest value when is 10. Subsequently, as continues to increase, the method’s performance gradually decreases. The reason for this trend is that when is too small, many negative feedback behaviors cannot be distinguished from positive feedback behaviors, which may also be caused by user errors. Therefore, too small a value will lead to inaccurate modeling of user interests. Additionally, the performance of our method decreases when is too large. In this case, many positive feedback video clicks may be mistakenly identified as negative, resulting in inaccurate determination of user dislike tags and poor algorithm performance. Therefore, choosing a moderate negative feedback threshold will bring better algorithm results. Here, we chose = 10 as the threshold to define the time threshold for user negative feedback playback behavior.
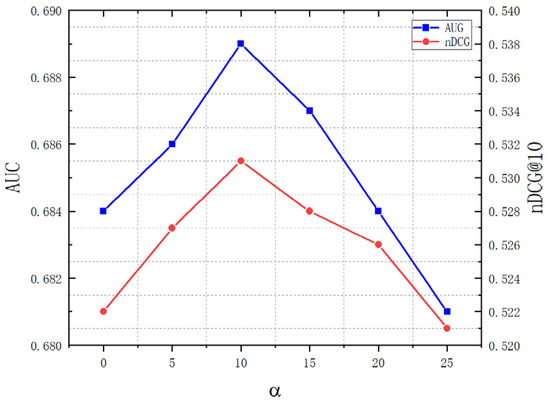
Figure 8.
Performance of AUG and nDCG based on threshold .
6.3. Performance Comparison Experiment of the Algorithms
We built upon the HRW-BMD algorithm and introduced the TF-IDF-PPC, TF-IDF-BOIT, and the NFTD-TF-IDF algorithms. By comparing the performance before and after introducing different keyword extraction algorithms, we aimed to determine negative feedback tags, filter out video projects with negative feedback from users, and analyze the optimization effect of negative feedback tag algorithms on positive recommendations. This experiment used precision, recall, and F1-score metrics to evaluate the performance improvement of the algorithms based on recommendation list lengths of 5, 10, 15, and 20. In this experiment, the parameter of the NFTD-TF-IDF algorithm was set to 0.1, was set to 10, and the time window size was set to 14. The specific analysis of the experiment results is described below (Figure 9).
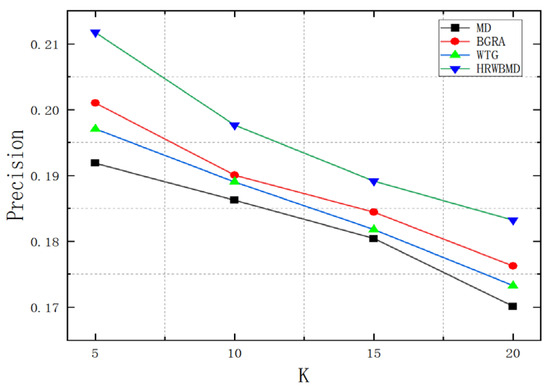
Figure 9.
Precision values among the selected algorithms based on the value of .
In terms of precision, the three algorithms based on HRW-BMD showed a significant improvement after introducing negative feedback tags. The TF-IDF-PPC + HRW-BMD algorithm, after introducing negative feedback tags, showed an average precision improvement of 12.8% across the four recommendation list lengths. The TF-IDF-BOIT + HRW-BMD algorithm improved by 15.4%, while the NFTD-TD-IDF + HRW-BMD algorithm improved by 19.6%, showing the highest improvement. The NFTD-TF-IDF algorithm had higher precision compared to the other two algorithms introduced for negative feedback tag determination. Especially in cases where the recommendation list length was short, such as K = 5, the precision of NFTD-TF-IDF+HRW-BMD was approximately 5% higher than that of TF-IDF-PPC+HRW-BMD and 4.7% higher than that of TF-IDF-BOIT+HRW-BMD (Figure 10).
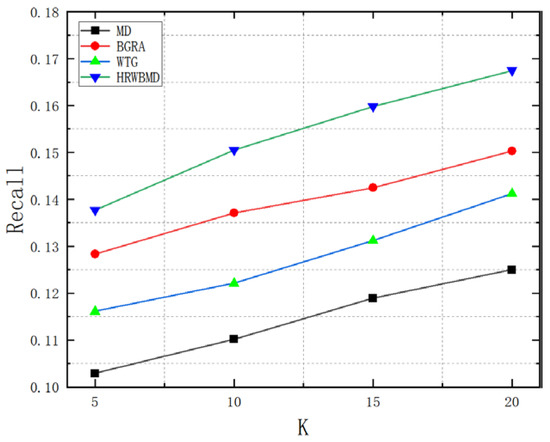
Figure 10.
Recall values among the selected algorithms based on negative feedback tags.
In terms of recall, as shown in the graph, the HRW-BMD algorithm showed some improvement in recall after introducing negative feedback tag calculation. Among them, the NFTD-TF-IDF + HRW-BMD algorithm had higher recall rates than the other three algorithms, especially when the recommendation list length K = 5, the recall rates of NFTD-TF-IDF+HRW-BMD were approximately 14.1%, 10.1%, and 5% higher than those of the HRW-BMD, TF-IDF-PPC + HRW-BMD, and TF-IDF-BOIT + HRW-BMD algorithms, respectively. This indicates that the NFTD-TF-IDF + HRW-BMD algorithm, after introducing negative feedback tags to filter out videos that users are not interested in, can better capture user interests and preferences, thereby improving the recall of the recommendation system.
Additionally, as the recommendation list length increased, the recall of each algorithm also increased. It is evident that with the introduction of negative feedback tags, incorrectly recommended video projects were filtered out. As the recommendation list length expanded, more correctly recommended video projects were included. Since the number of videos that users were interested in was a fixed value in the dataset, the recall naturally increased. Overall, when considering recall, the NFTD-TF-IDF + HRW-BMD algorithm had a significant advantage in cases where the recommendation list length was short.
As shown in the Figure 11, after introducing negative feedback tags, the NFTD-TF-IDF + HRW-BMD algorithm proposed in this paper showed a significant lead over the other algorithms in terms of the F1-score, a comprehensive metric. The F1-score increased as the recommendation list length increased, reaching its highest value at K = 20. The trend in F1-score changes for the other three algorithms is consistent with this. In particular, the NFTD-TF-IDF + HRW-BMD algorithm performed better in terms of F1-score compared to the other two algorithms that introduced negative feedback tag calculations. Its F1-score was, on average, 7% higher than that of the TF-IDF-PPC+HRW-BMD algorithm and 4.4% higher than that of the TF-IDF-BOIT + HRW-BMD algorithm.
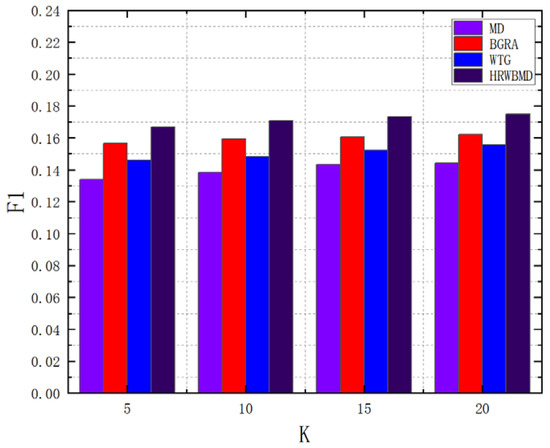
Figure 11.
F1-scores betweent the selected algorithms.
6.4. Ablation Study
We conducted a detailed ablation study to better illustrate the key parameters and individual modules of our method. First of all, we examined the key factors among hypergraph walks, bidirectional diffusion, and negative feedback. These components contributed to the major modules in our method; reducing one of them may have a large effect on our experiment. Replacing hypergraph-based random walks with a diffusion model reduced the evaluation performance in terms of F1-score and other metrics, significantly affecting the model’s accuracy. Similarly, only using forward propagation regardless of bidirectional diffusion illustrates the importance of information flow of expressing user–tag consistency. The absence of negative feedback also negatively impacted the results, though to a slightly lesser extent.
Next, we evaluated the effectiveness of key parameters. The damping factor plays a vital role in balancing locality and exploration, where lower values may cause insufficient propagation, and higher values may overemphasize local loops. The value of diffusion steps showed an impact on performance due to the accumulation of noise and computational cost and was, therefore, set to 3. The variance in the weighting scheme achieved better performance on semantic hyperedges with more informative connections.
7. Discussion
We proposed a bidirectional material diffusion algorithm for video recommendation systems based on graph networks, incorporating negative feedback to address the problem of information overload. We also provided solutions within the framework of our proposed method. Despite the rapid development of recommendation system technologies, many issues still need to be taken into account in further applications.
(1) Our proposed energy diffusion method requires constructing a hypergraph model for each target user or target video at each individual time segment, which results in significant computational resource consumption. The runtime and space complexity are largely increased with the growing number of video tags and users. It is challenging to scale the hypergraph model to large datasets like MovieLens and Netflix. Incorporating cold-start alleviation is helpful for utilizing edge probabilities inside networks among similar users, leading to more robust performance in sparse interaction cases;
(2) Although our proposed algorithm achieved ideal results on the KuaiRec dataset, the factors related to bias and cold-start issues still need to be considered. The filter bubble caused by repeated diffusion through familiar content clusters in recommendation systems, using a hypergraph structure with stochastic edge traversal, promotes diversity, which can improve the range of diffusion paths. The cold-start mitigation issue is mainly overcome by leveraging shared contextual information inside hyperedges with useful embeddings;
(3) Traditional diffusion-based models simulate information spreading in a single direction, while our proposed algorithm, HRW-BMD, simulates influences on constructing consistency between user nodes and video edges. Our HRW-BMD algorithm is integrated into the hypergraph model, which enhances the diffusion model’s representation learning strategy. However, traditional bipartite graph approaches are typically limited in finding binary relationships, and complex relationships cannot be explained clearly.
Regarding scalability and computational complexity for the proposed algorithm, the main factors comprise hypergraph construction, random walk computation, and resource redistribution. The hypergraph construction mainly considers the high-order relationships between data elements to construct hypergraphs; after that, the bidirectional diffusion process iteratively propagates scores across the network. Each diffusion step requires examining a node’s neighbors and redistributing scores. Finally, the model adjusts and normalizes scores based on the accumulated values from the diffusion phase.
While the proposed hypergraph-based bidirectional diffusion framework performs better than traditional graph-based methods, we lack the formal theoretical proof of superiority in our model. The bidirectional mechanism enables feedback loops that potentially enhance stability and convergence during diffusion. However, such a design does not provide bounds on convergence rates or formal conditions under which the model is likely better.
8. Conclusions
This paper describes research centered around the energy initialization issue of the material diffusion algorithm, combining the practical characteristics of video recommendations and user needs. The differentiated initial energy values for the material diffusion algorithm were calculated based on a random walk on the hypergraph. Bidirectional material diffusion was then conducted based on the initial energy values, obtaining user–tag interest levels and video–tag relevance. Finally, these two aspects were integrated to determine user ratings for video items, thereby completing the recommendation. This approach synthesizes a bidirectional material diffusion recommendation algorithm that integrates random walks on hypergraphs, which was compared with similar algorithms on public datasets. The experimental results demonstrated that the algorithm proposed in this paper performed exceptionally well across various metrics.
Then, this study improved the TF-IDF algorithm and proposed a negative feedback label determination algorithm based on a dynamic time window. It combined this algorithm with a video recommendation algorithm, proposing a video recommendation algorithm based on positive recommendation and negative feedback filtering. Comparative experiments were conducted with similar algorithms on public datasets. The results showed that the algorithm proposed in this paper performed very well in three dimensions of indicators, demonstrating the effectiveness of the proposed algorithm. In the future, we will pay more attention to newly developed deep learning-based mainstream frameworks such as transformers and large language models, which inherit a large number of learnable parameters. We will use graph neural networks or transformer models to perform more comparisons with experimental results.
Author Contributions
Conceptualization, Y.S.; methodology, L.Y.; software, T.H.; investigation, L.Y.; resources, T.H.; writing—original draft preparation, Y.S.; visualization, W.C.; supervision, W.C.; project administration, Z.S.; funding acquisition, Z.S. All authors have read and agreed to the published version of the manuscript.
Funding
This research was funded by the Jiangsu Agriculture Science and Technology Innovation Fund (JASTIF), CX(22)1007.
Data Availability Statement
The data presented in this study are available from the corresponding author upon request. The data are not publicly available due to privacy concerns.
Conflicts of Interest
The authors declare no conflicts of interest.
References
- Shrimali, H.; Saxena, R.; Kavita. Content based Video Recommendation System. In Proceedings of the 3rd International Conference on Intelligent Communication and Computational Techniques (ICCT), Jaipur, India, 19–20 January 2023; pp. 1–3. [Google Scholar]
- Huang, C.; Jiang, T. A Study of Danmaku Video Recommendation Algorithm Incorporating Multiple Features. In Proceedings of the 4th International Conference on Frontiers Technology of Information and Computer (ICFTIC), Qingdao, China, 2–4 December 2022; pp. 440–444. [Google Scholar]
- Huang, X.; Shi, D.; Wang, L. Design and Implementation of Short Video Recommendation Algorithm Based on Latent Factor Model. In Proceedings of the IEEE Asia-Pacific Conference on Image Processing, Electronics and Computers (IPEC), Dalian, China, 14–16 April 2021; pp. 169–172. [Google Scholar]
- Yang, F.; Li, G.; Yue, Y.; Payne, T. Accurate and Visual Video Recommendation Based on Deep Neural Network. In Proceedings of the 7th International Conference on Computer and Communication Systems (ICCCS), Wuhan, China, 22–25 April 2022; pp. 278–283. [Google Scholar]
- Raju, N.; Vankudari, S.A.; SN, D.P.; Chatterjee, S.; Kalambur, S. VetaQL: Video Metadata Querying System Powered with Video Recommendation. In Proceedings of the 2nd Asian Conference on Innovation in Technology (ASIANCON), Ravet, India, 26–28 August 2022; pp. 1–6. [Google Scholar]
- Jiang, P.; Feng, Y.; Niu, C.; Dai, Y. Study of intelligent recommendation for online video courses. In Proceedings of the IEEE 5th Information Technology, Networking, Electronic and Automation Control Conference (ITNEC), Xi’an, China, 15–17 October 2021; pp. 1290–1294. [Google Scholar]
- Sun, M.; Guo, M.; Yuan, W.; Thost, V.; Owens, C.E.; Grosz, A.F.; Selvan, S.; Zhou, K.; Mohiuddin, H.; Pedretti, B.J.; et al. Representing molecules as random walks over interpretable grammars. arXiv 2024, arXiv:2403.08147. [Google Scholar]
- Lyu, S.; Zhou, X.; Hu, X. Multi-view Hypergraph-based Contrastive Learning Model for Cold-Start Micro-video Recommendation. In Proceedings of the ICASSP 2025 IEEE International Conference on Acoustics, Speech and Signal Processing (ICASSP), Hyderabad, India, 6–11 April 2025; IEEE: Piscataway, NJ, USA, 2025; pp. 1–5. [Google Scholar]
- Liu, J.; Ke, J.; Liu, J.; Xie, X.; Tian, E. Secure event-triggered control for IT-2 fuzzy networked systems with stochastic communication protocol and FDI attacks. IEEE Trans. Fuzzy Syst. 2023, 32, 1167–1180. [Google Scholar] [CrossRef]
- Kong, Y.; Hu, Y.; Zhang, X.; Wang, C. Structural centrality of networks can improve the diffusion-based recommendation algorithm. Front. Phys. 2022, 10, 1018781. [Google Scholar] [CrossRef]
- Min, L. Research on Personalized Recommendation Technology for Learning Resources Combining Knowledge Graph and Interest Diffusion Mechanism. In Proceedings of the 3rd International Conference on Information Science and Education (ICISE-IE), Guangzhou, China, 18–20 November 2022; pp. 115–118. [Google Scholar]
- Yang, Y.; Zhong, Y.; Woźniak, M. Improvement of Adaptive Learning Service Recommendation Algorithm Based on Big Data. Mob. Netw. Appl. 2021, 26, 2176–2187. [Google Scholar] [CrossRef]
- Prasad, C.; Saritha, S.K.; Jain, S. Bilinear diffusion graph convolutional network model for social recommendation. J. Supercomput. 2025, 81, 437. [Google Scholar] [CrossRef]
- Li, Z.; Xia, L.; Huang, C. Recdiff: Diffusion model for social recommendation. In Proceedings of the 33rd ACM International Conference on Information and Knowledge Management, New York, NY, USA, 21–25 October 2024; pp. 1346–1355. [Google Scholar]
- Wei, T.R.; Fang, Y. Diffusion Models in Recommendation Systems: A Survey. arXiv 2025, arXiv:2501.10548. [Google Scholar]
- Sun, Z.; Feng, K.; Yang, J.; Fang, H.; Qu, X.; Ong, Y.S.; Liu, W. Revisiting bundle recommendation for intent-aware product bundling. ACM Trans. Recomm. Syst. 2024, 2, 1–34. [Google Scholar] [CrossRef]
- Mumin, D.; Shi, L.L.; Liu, L.; Han, Z.X.; Jiang, L.; Wu, Y. A new neighbourhood-based diffusion algorithm for personalized recommendation. Knowl. Inf. Syst. 2024, 66, 5389–5408. [Google Scholar] [CrossRef]
- Zhou, T.; Ren, J.; Medo, M.; Zhang, C. Bipartite network projection and personal recommendation. Phys. Rev. E 2007, 76, 046115. [Google Scholar] [CrossRef] [PubMed]
- Zhang, G.; Jiang, Y.; Cheng, Z.; Liu, Y. Bipartite Graph Recommendation Algorithm Based on Differentiated Resource Allocation. Comput. Simul. 2021, 38, 451–455. [Google Scholar]
- Dai, J. Research of Recommendation Algorithm Based on Weighted Tripartite Graph Model; South China University of Technology: Guangzhou, China, 2019. [Google Scholar]
- Gao, C.; Li, S.; Lei, W.; Chen, J.; Li, B.; Jiang, P.; He, X.; Mao, J.; Chua, T.S. KuaiRec: A fully-observed dataset and insights for evaluating recommender systems. In Proceedings of the 31st ACM International Conference on Information & Knowledge Management, Atlanta, GA, USA, 17–21 October 2022; pp. 540–550. [Google Scholar]
Disclaimer/Publisher’s Note: The statements, opinions and data contained in all publications are solely those of the individual author(s) and contributor(s) and not of MDPI and/or the editor(s). MDPI and/or the editor(s) disclaim responsibility for any injury to people or property resulting from any ideas, methods, instructions or products referred to in the content. |
© 2025 by the authors. Licensee MDPI, Basel, Switzerland. This article is an open access article distributed under the terms and conditions of the Creative Commons Attribution (CC BY) license (https://creativecommons.org/licenses/by/4.0/).