
A Statistical Evaluation Method Based on Fuzzy Failure Data for Multi-State Equipment Reliability

 ,
,
Abstract
1. Introduction
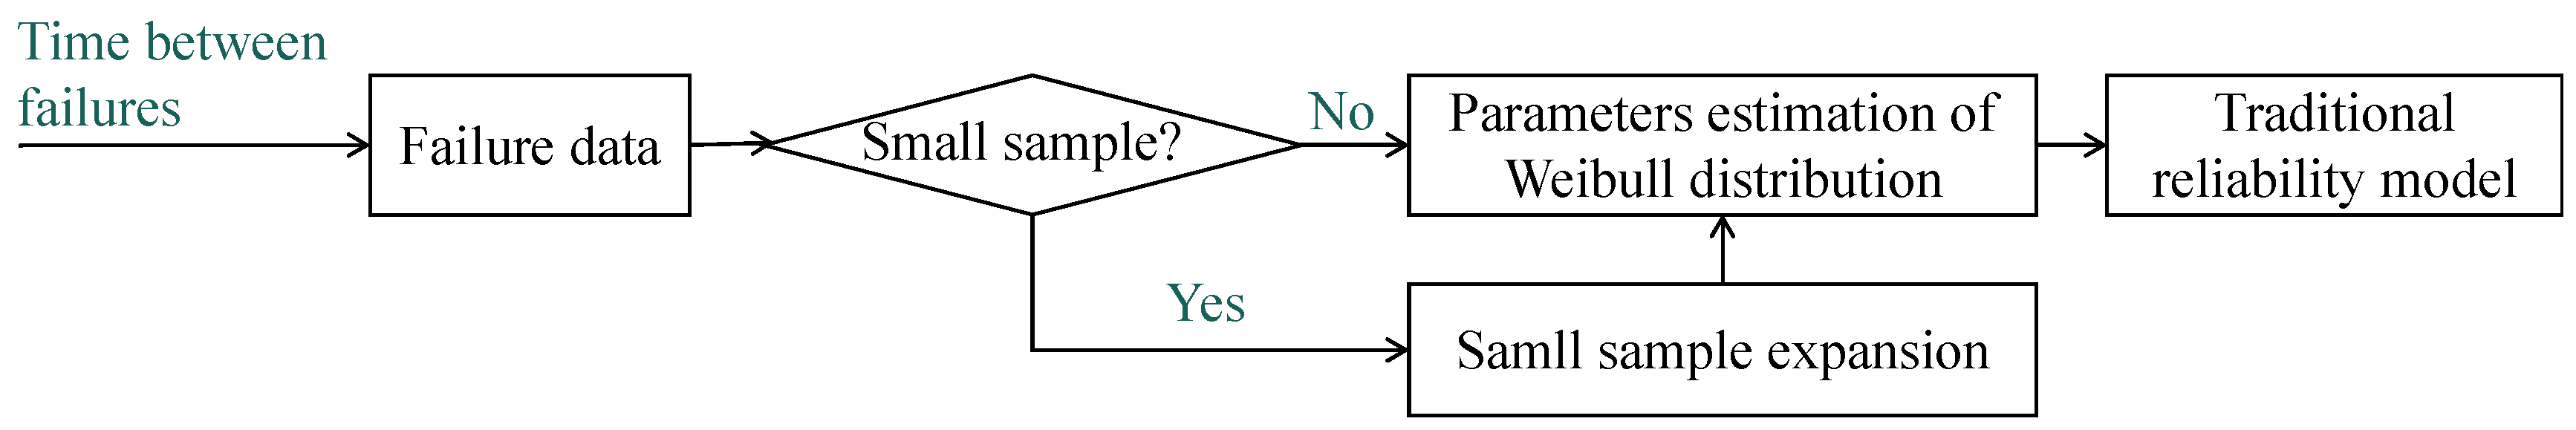
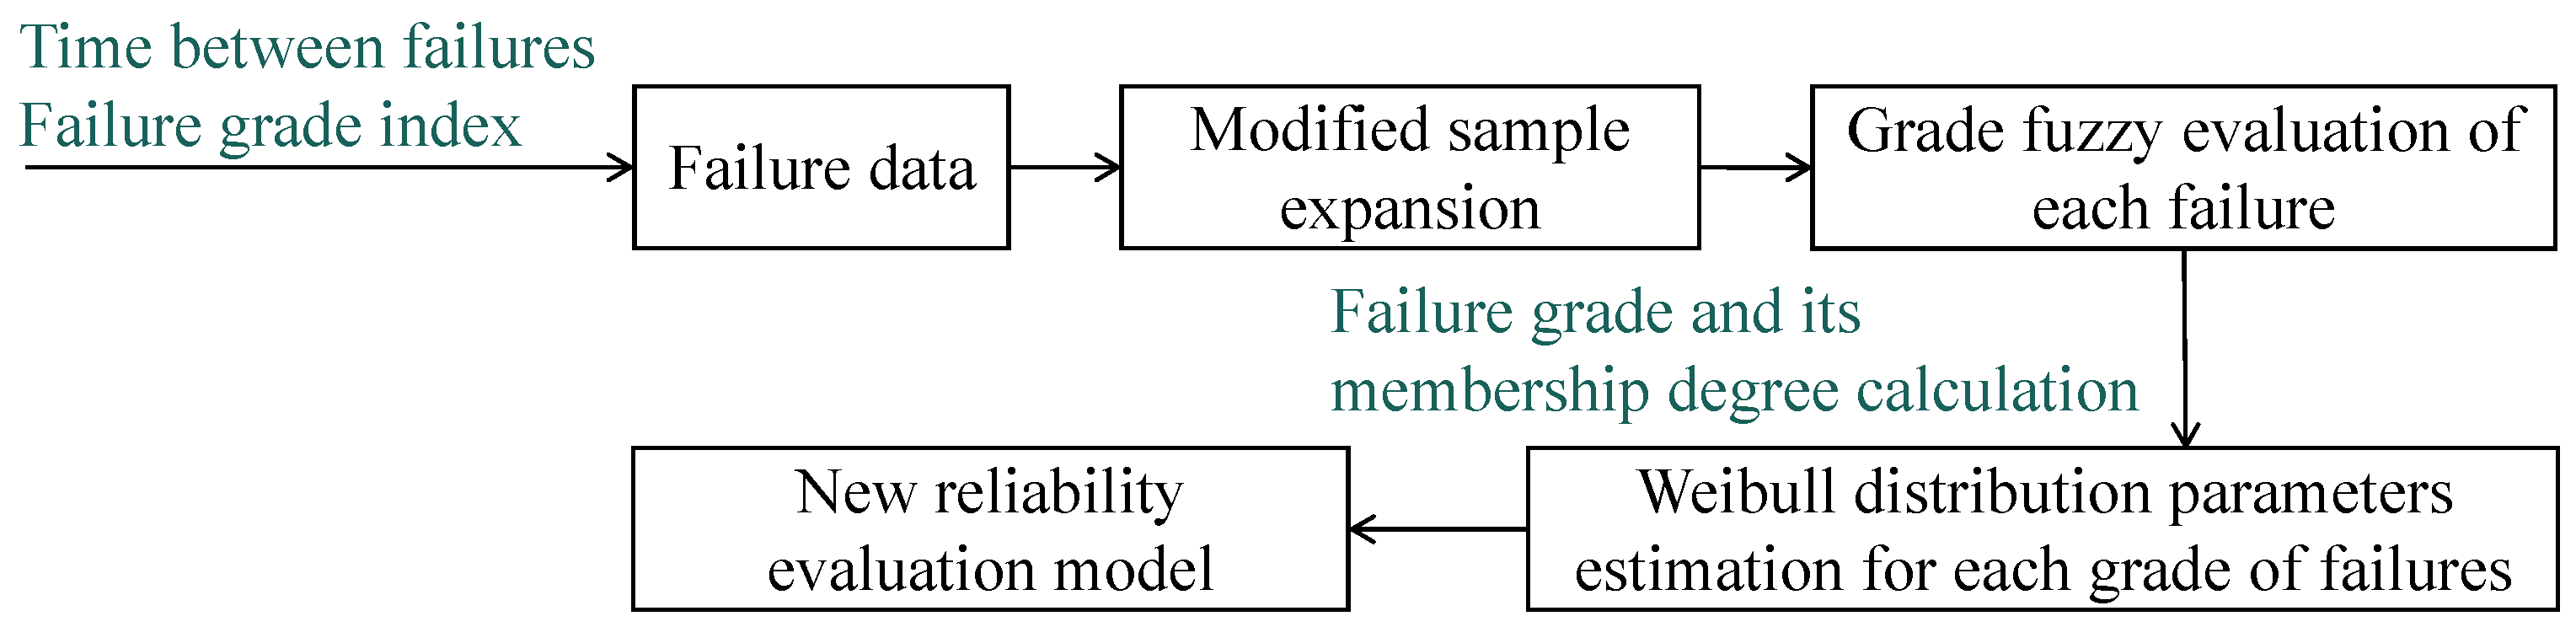
2. Reliability-Evaluation Scheme Considering Multi-State Characteristic of Failures
3. Failure-Grade Fuzzy-Evaluation Method and Example Analysis
3.1. Failure-Grade Fuzzy-Evaluation Method
- (1)
- Influence analysis. In practical applications, the equipment performance is often multifaceted. For a piece of equipment, people may be concerned not only about whether it can continuously and successfully complete specified operations but also about its productivity, accuracy, and many other factors, and different modes of failure often have different degrees of impact on equipment performance. Taking the processing machine tool as an example, the failure of the lubrication system caused by the lack of oil leakage will affect the machining accuracy and efficiency. The failure of the lubrication system caused by the oil valve, oil pump motor, etc., will directly lead to the failure of the processing task. Therefore, the failure severity is one factor that determines the failure grade. In this paper, we also used a similar method to [28] to determine the failure severity levels, which considers the influence of failures on equipment performance or function and gives detailed descriptions of each severity level: Level-1 severity can result in a decrease in accuracy or efficiency but has no impact on the production task; Level-2 severity can result in a decrease in accuracy or efficiency and has a general impact on the production task; Level-3 severity can result in a serious decline in accuracy or efficiency and has a significant impact on the production task; and Level-4 severity can cause the system to shut down, making it unable perform the production task. In addition, the maintenance time and expense required by different failures are often different; that is, the impact of failures on the actual production efficiency and cost is different. From this perspective, the maintenance time and expense of the failure are considered as two influencing factors for failure-grade evaluation.
- (2)
- Failure-grade index definition. The failure-grade index is defined to characterize the failure state, comprehensively considering the severity, maintenance time, and expense of the failure, and is written as follows,where means the severity coefficient of the failure, and its values for the Level-1, Level-2, Level-3, and Level-4 failures are taken as 0.25, 0.5, 0.75, and 1, respectively. That is, when the value is closer to zero, the influence of failure on the production task is smaller. , and are weights of severity, maintenance time, and the expense coefficient for the comprehensive index, and they can be assigned according to the actual application through weighing functional requirements, time, cost, and other resources. and are, respectively, the time proportion coefficient and expense proportion coefficient, which are mainly used to characterize the maintenance time and the maintenance expense of the failure. These are related to the and thresholds of time and expense, respectively, which can be set according to the actual production situation. and can be calculated by the following formulas.According to the above formulas, when the maintenance time or maintenance expense is larger than the threshold value, the proportion coefficient is 1, and when it is less than the threshold value, the proportional coefficient is the ratio of the maintenance time or expense to the corresponding threshold value—that is, the greater the time or expense, the closer the ratio is to 1.
- (3)
- Failure-grade fuzzy evaluation. For the fuzzy evaluation of the failure grade, it is divided into five grades 1~V, and the quantitative assignment of each grade is shown in Table 2. The failure-grade judgment matrix of the index value can be written aswhere represents the membership degree of the index value to the failure grade.
3.2. Example Analysis
4. Modified Adaptive Small-Sample-Expansion Method and Example Analysis
4.1. Modified Adaptive Small-Sample-Expansion Method
- (1)
- Take the original data for the time between failures and the failure-grade index , and two random values and in the interval [0, 1];
- (2)
- Take and , and set and ;
- (3)
- Obtain the newborn data by , , wherein and are the value for the time between failures and the corresponding failure-grade index in the original data from smallest to largest;
- (4)
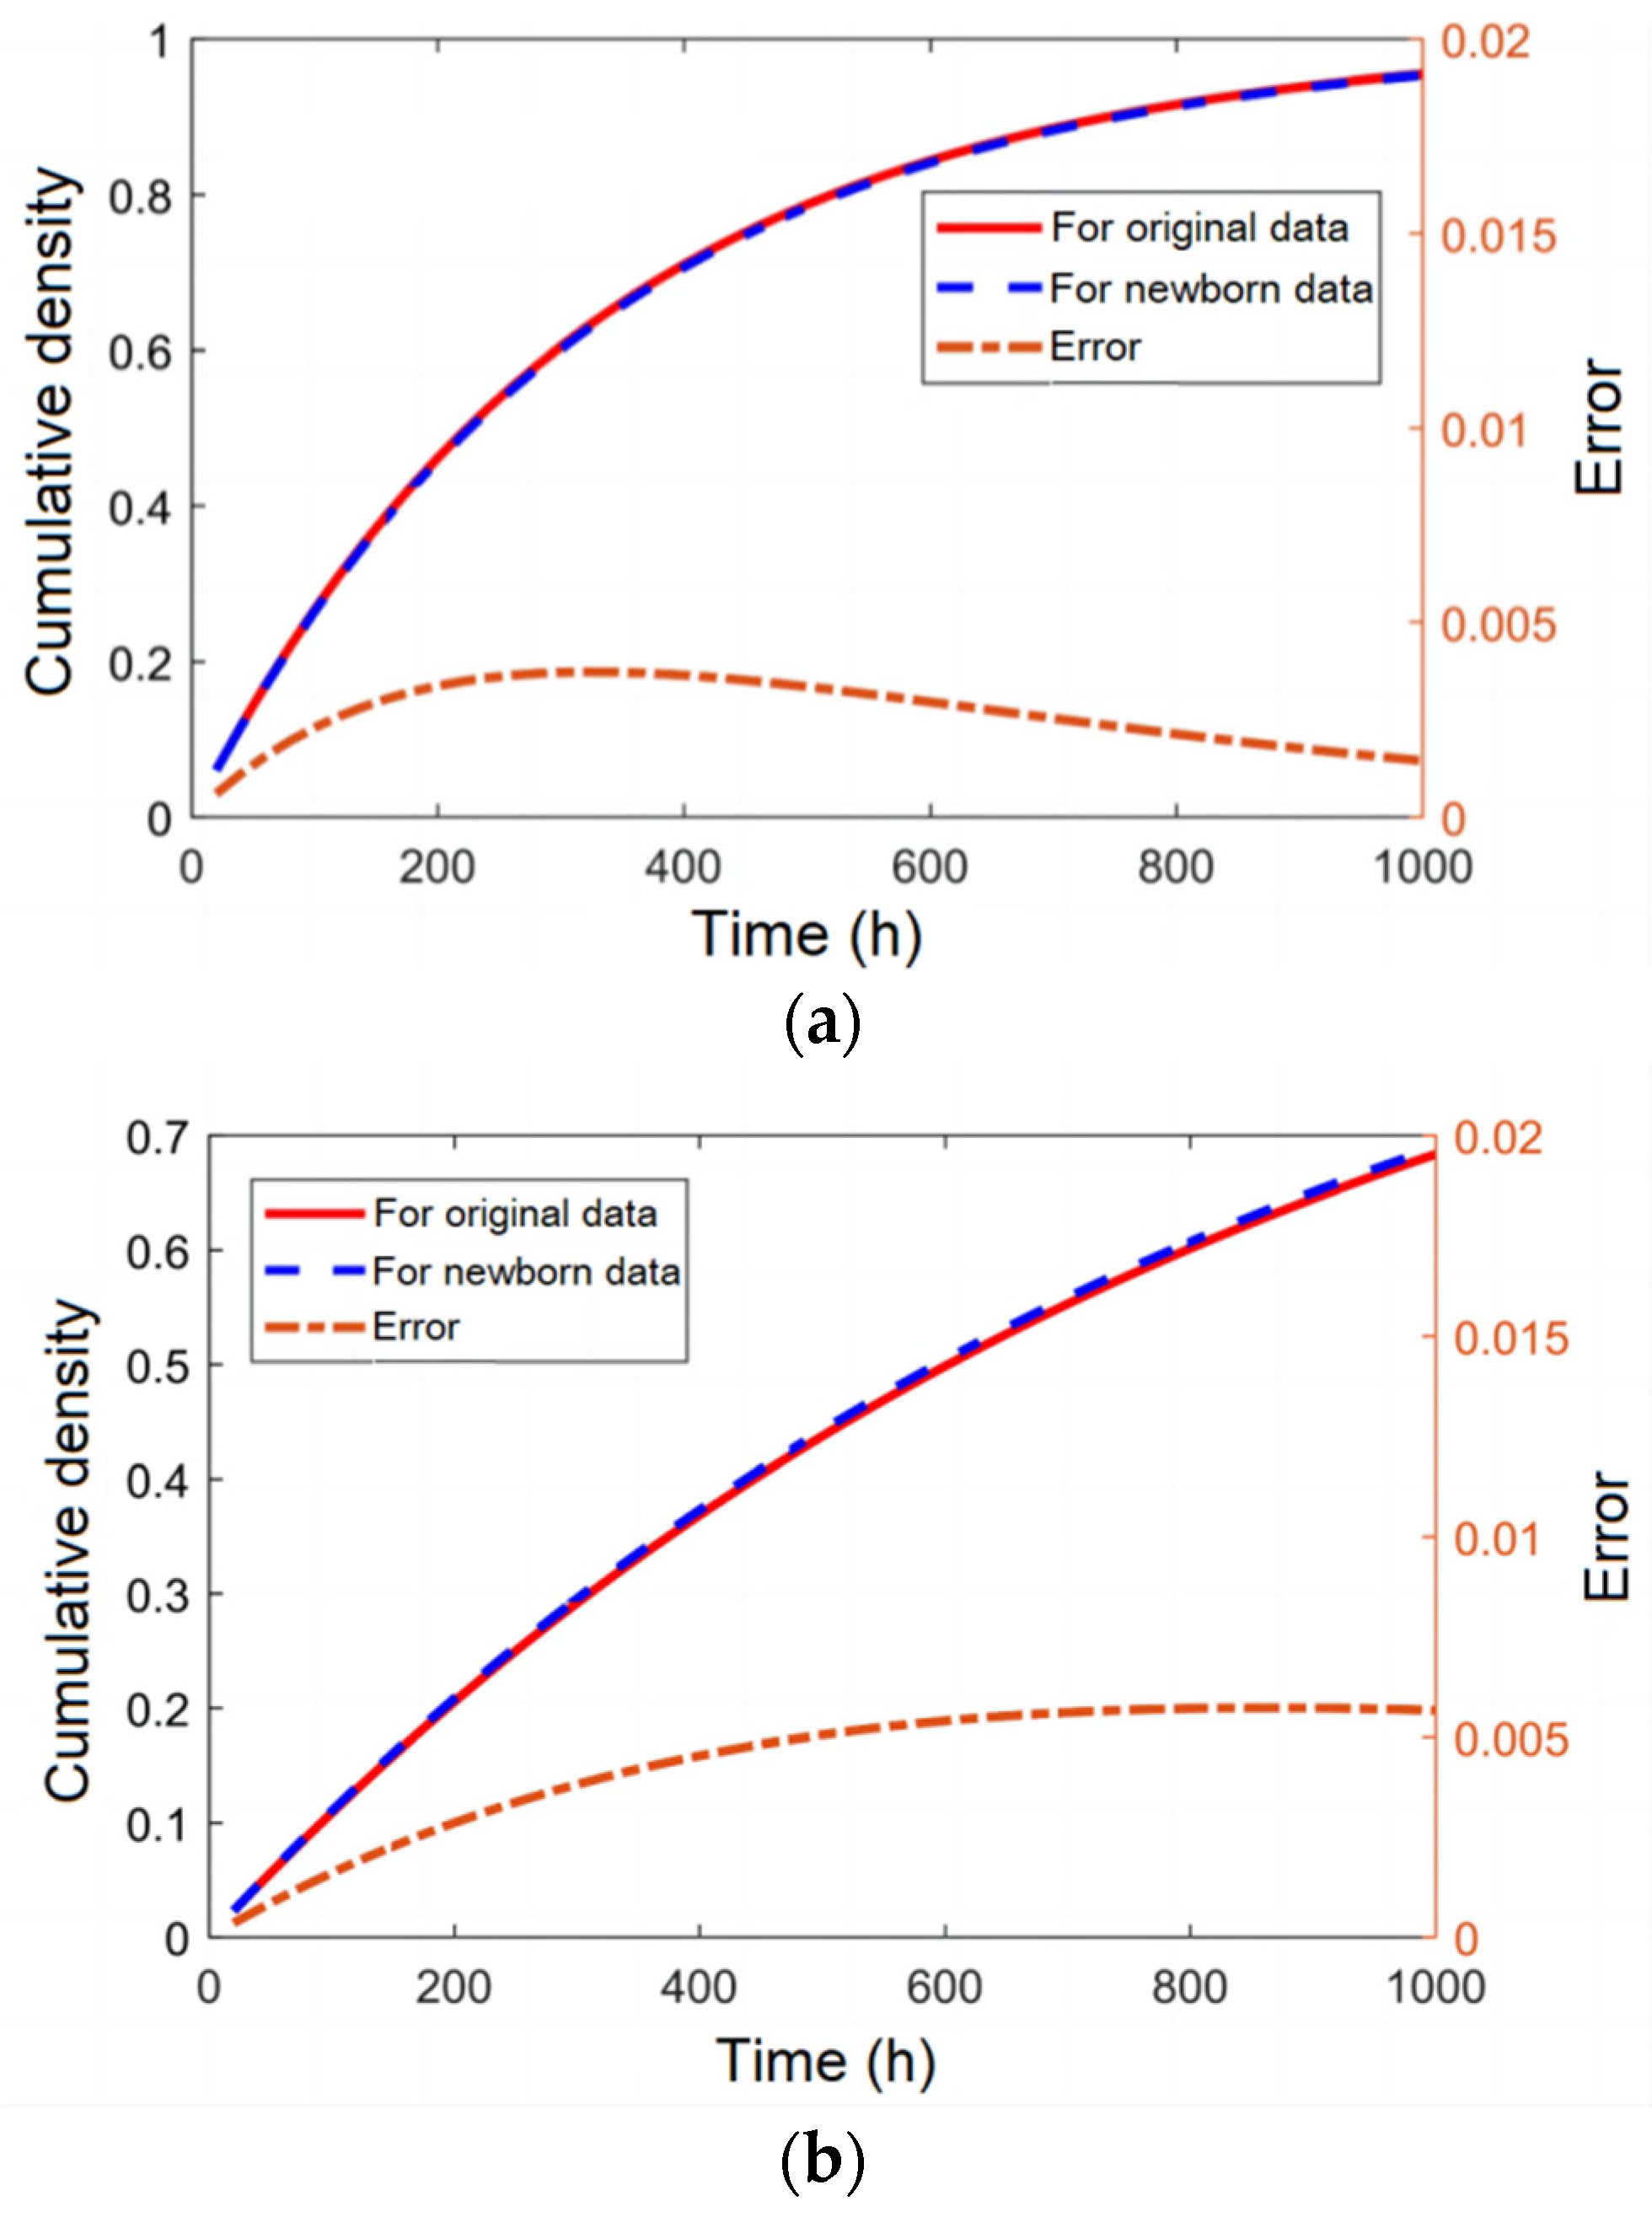
- For the data optimization of the time between failures, taking the original data and the newborn data in each iteration as failure data, respectively, the Weibull distribution functions can be determined as and according to Equation (2). Then, the largest error between two distribution curves can be calculated by . Finally, setting the error threshold as , the newborn data set can be optimized by the above steps until the threshold condition is satisfied. Based on the above embedded optimization, the data distribution of the time between failures can be ensured.
- (5)
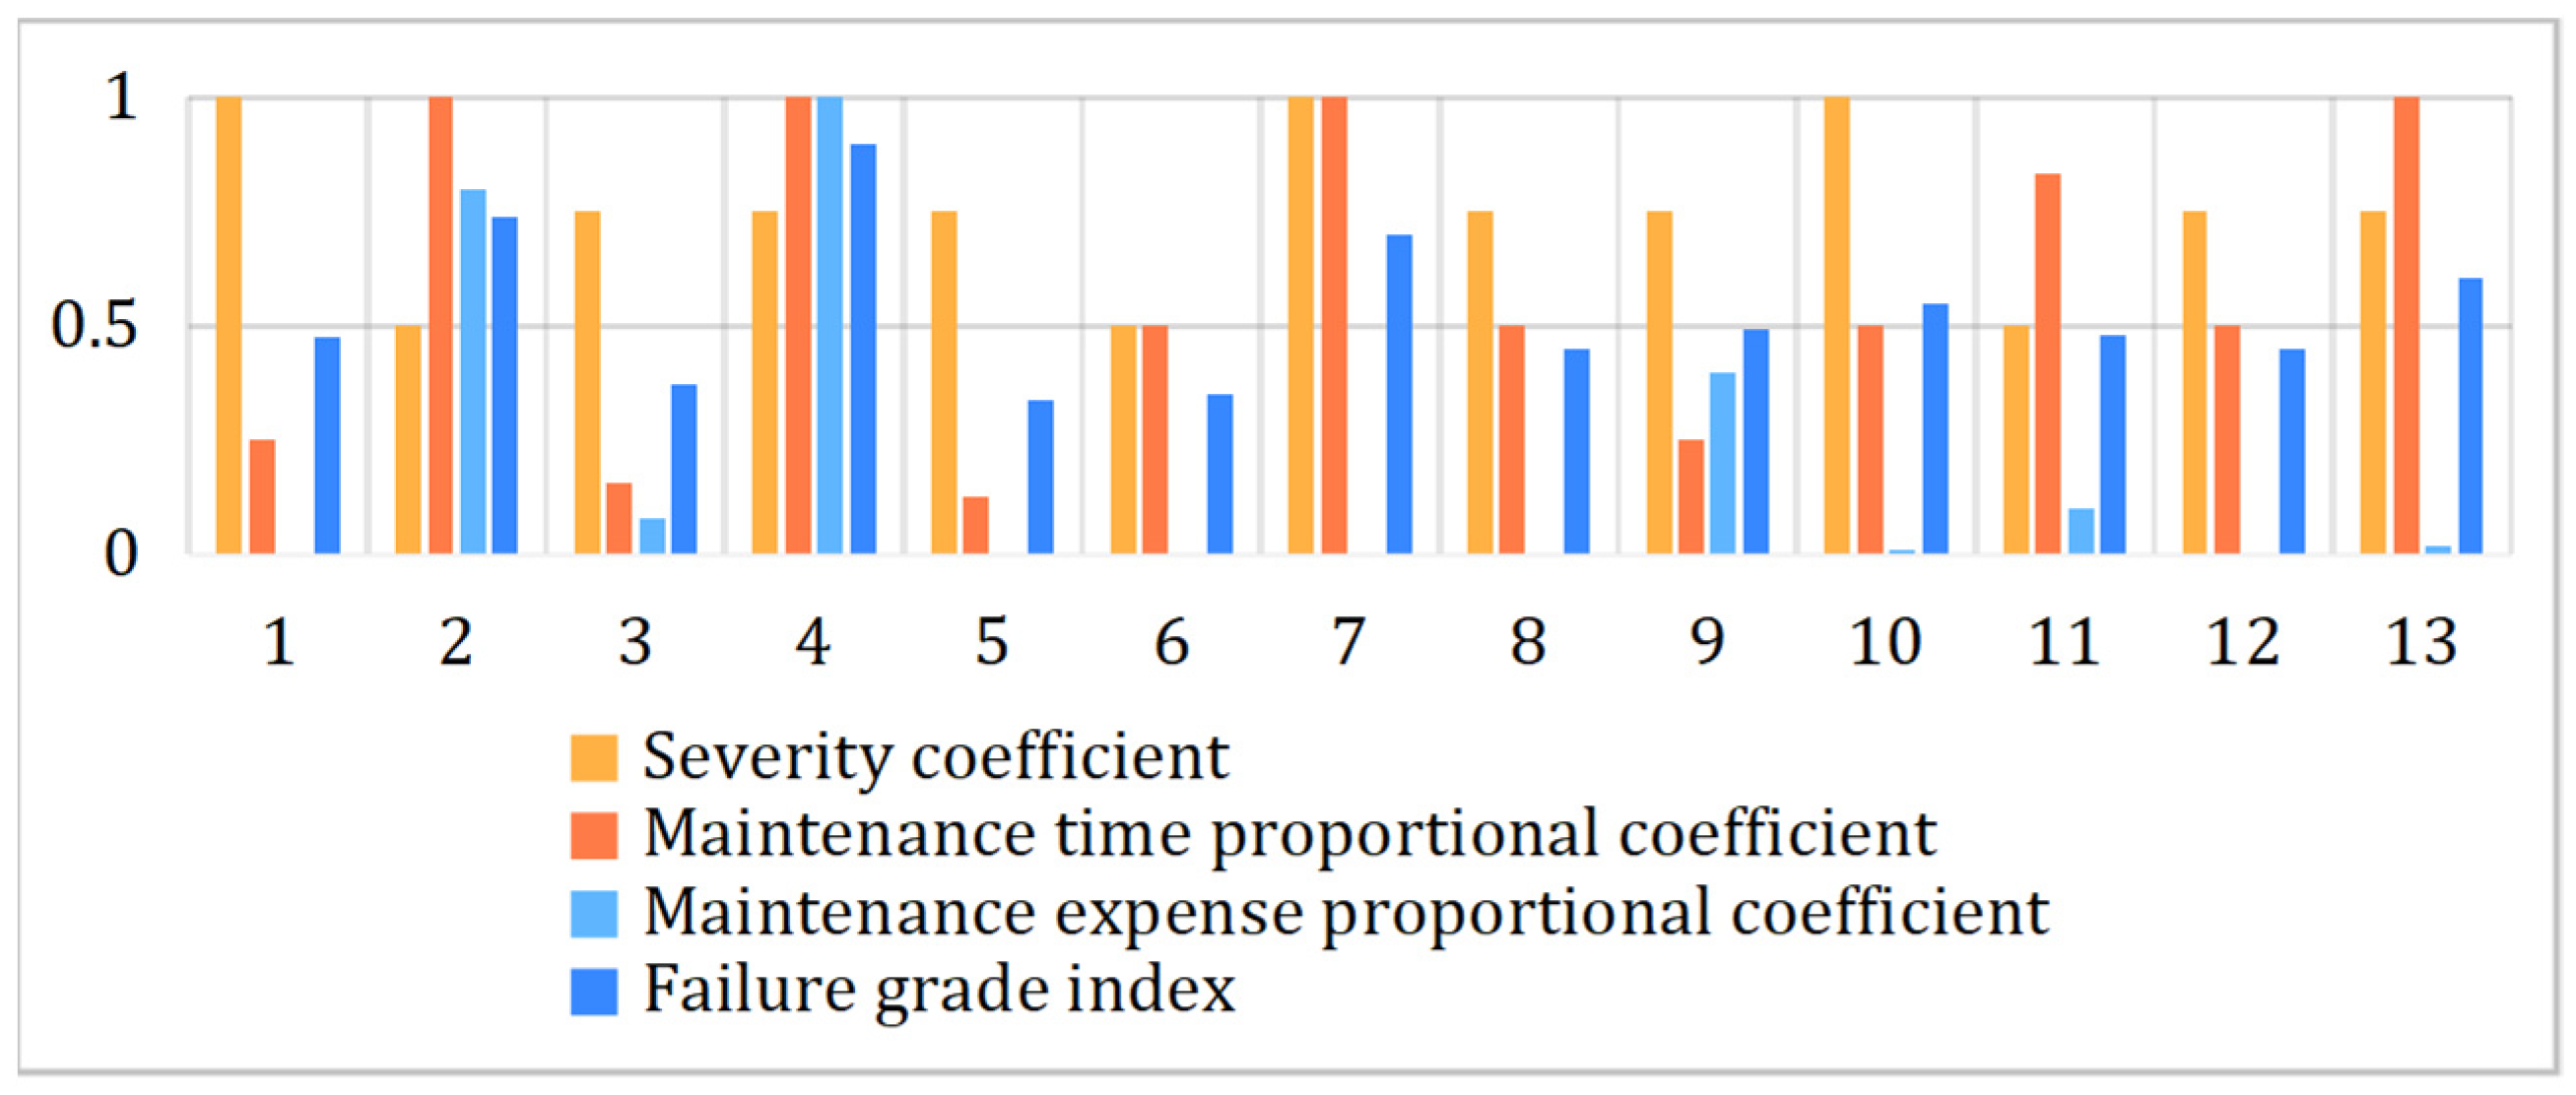
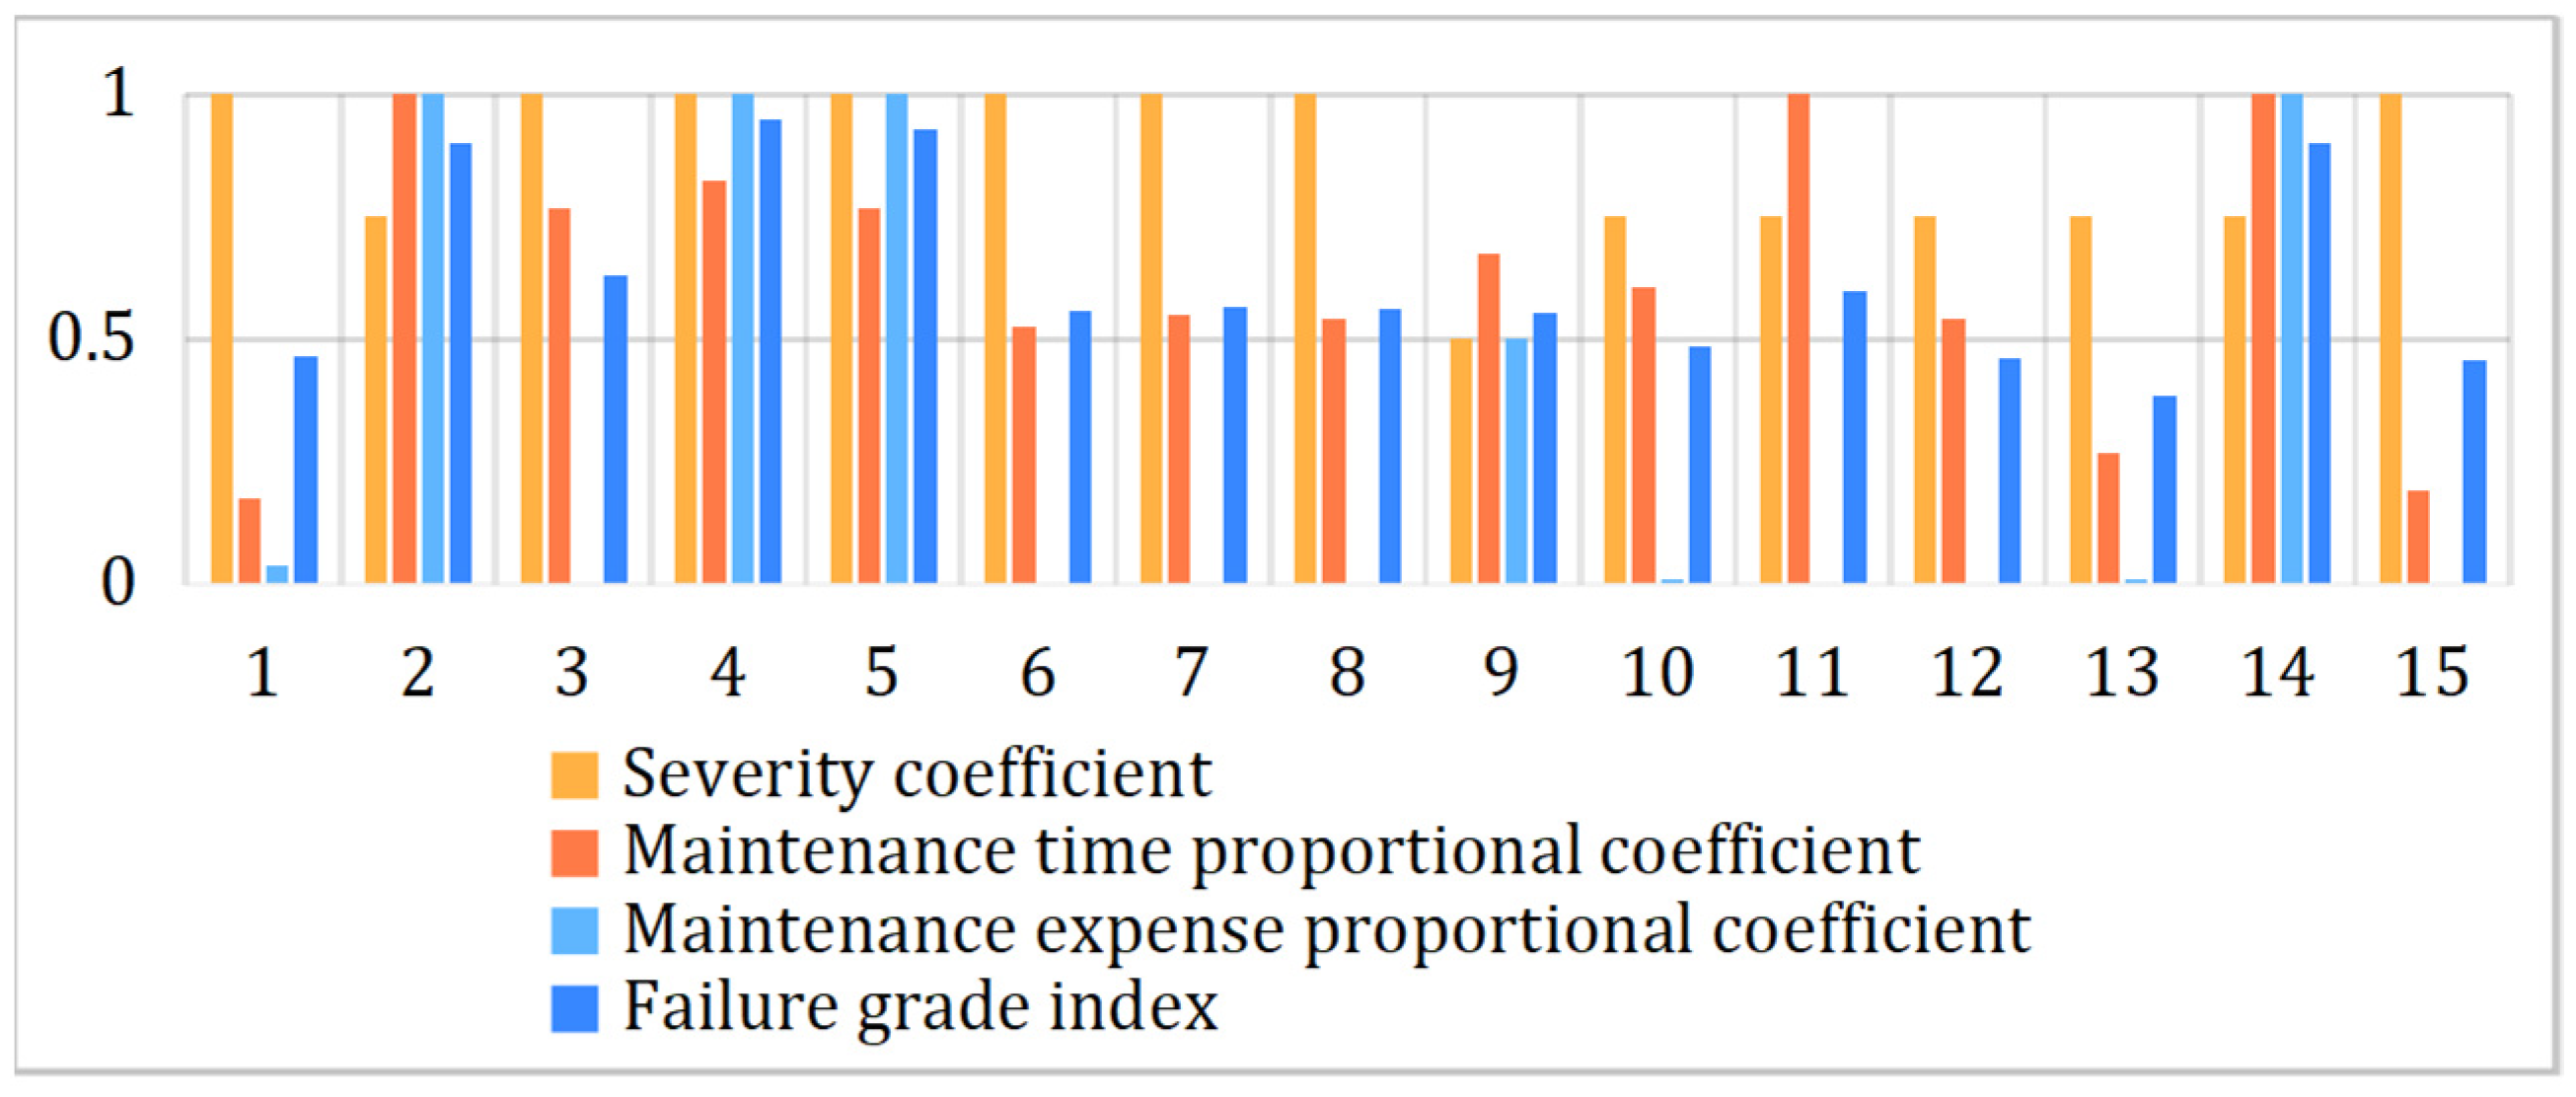
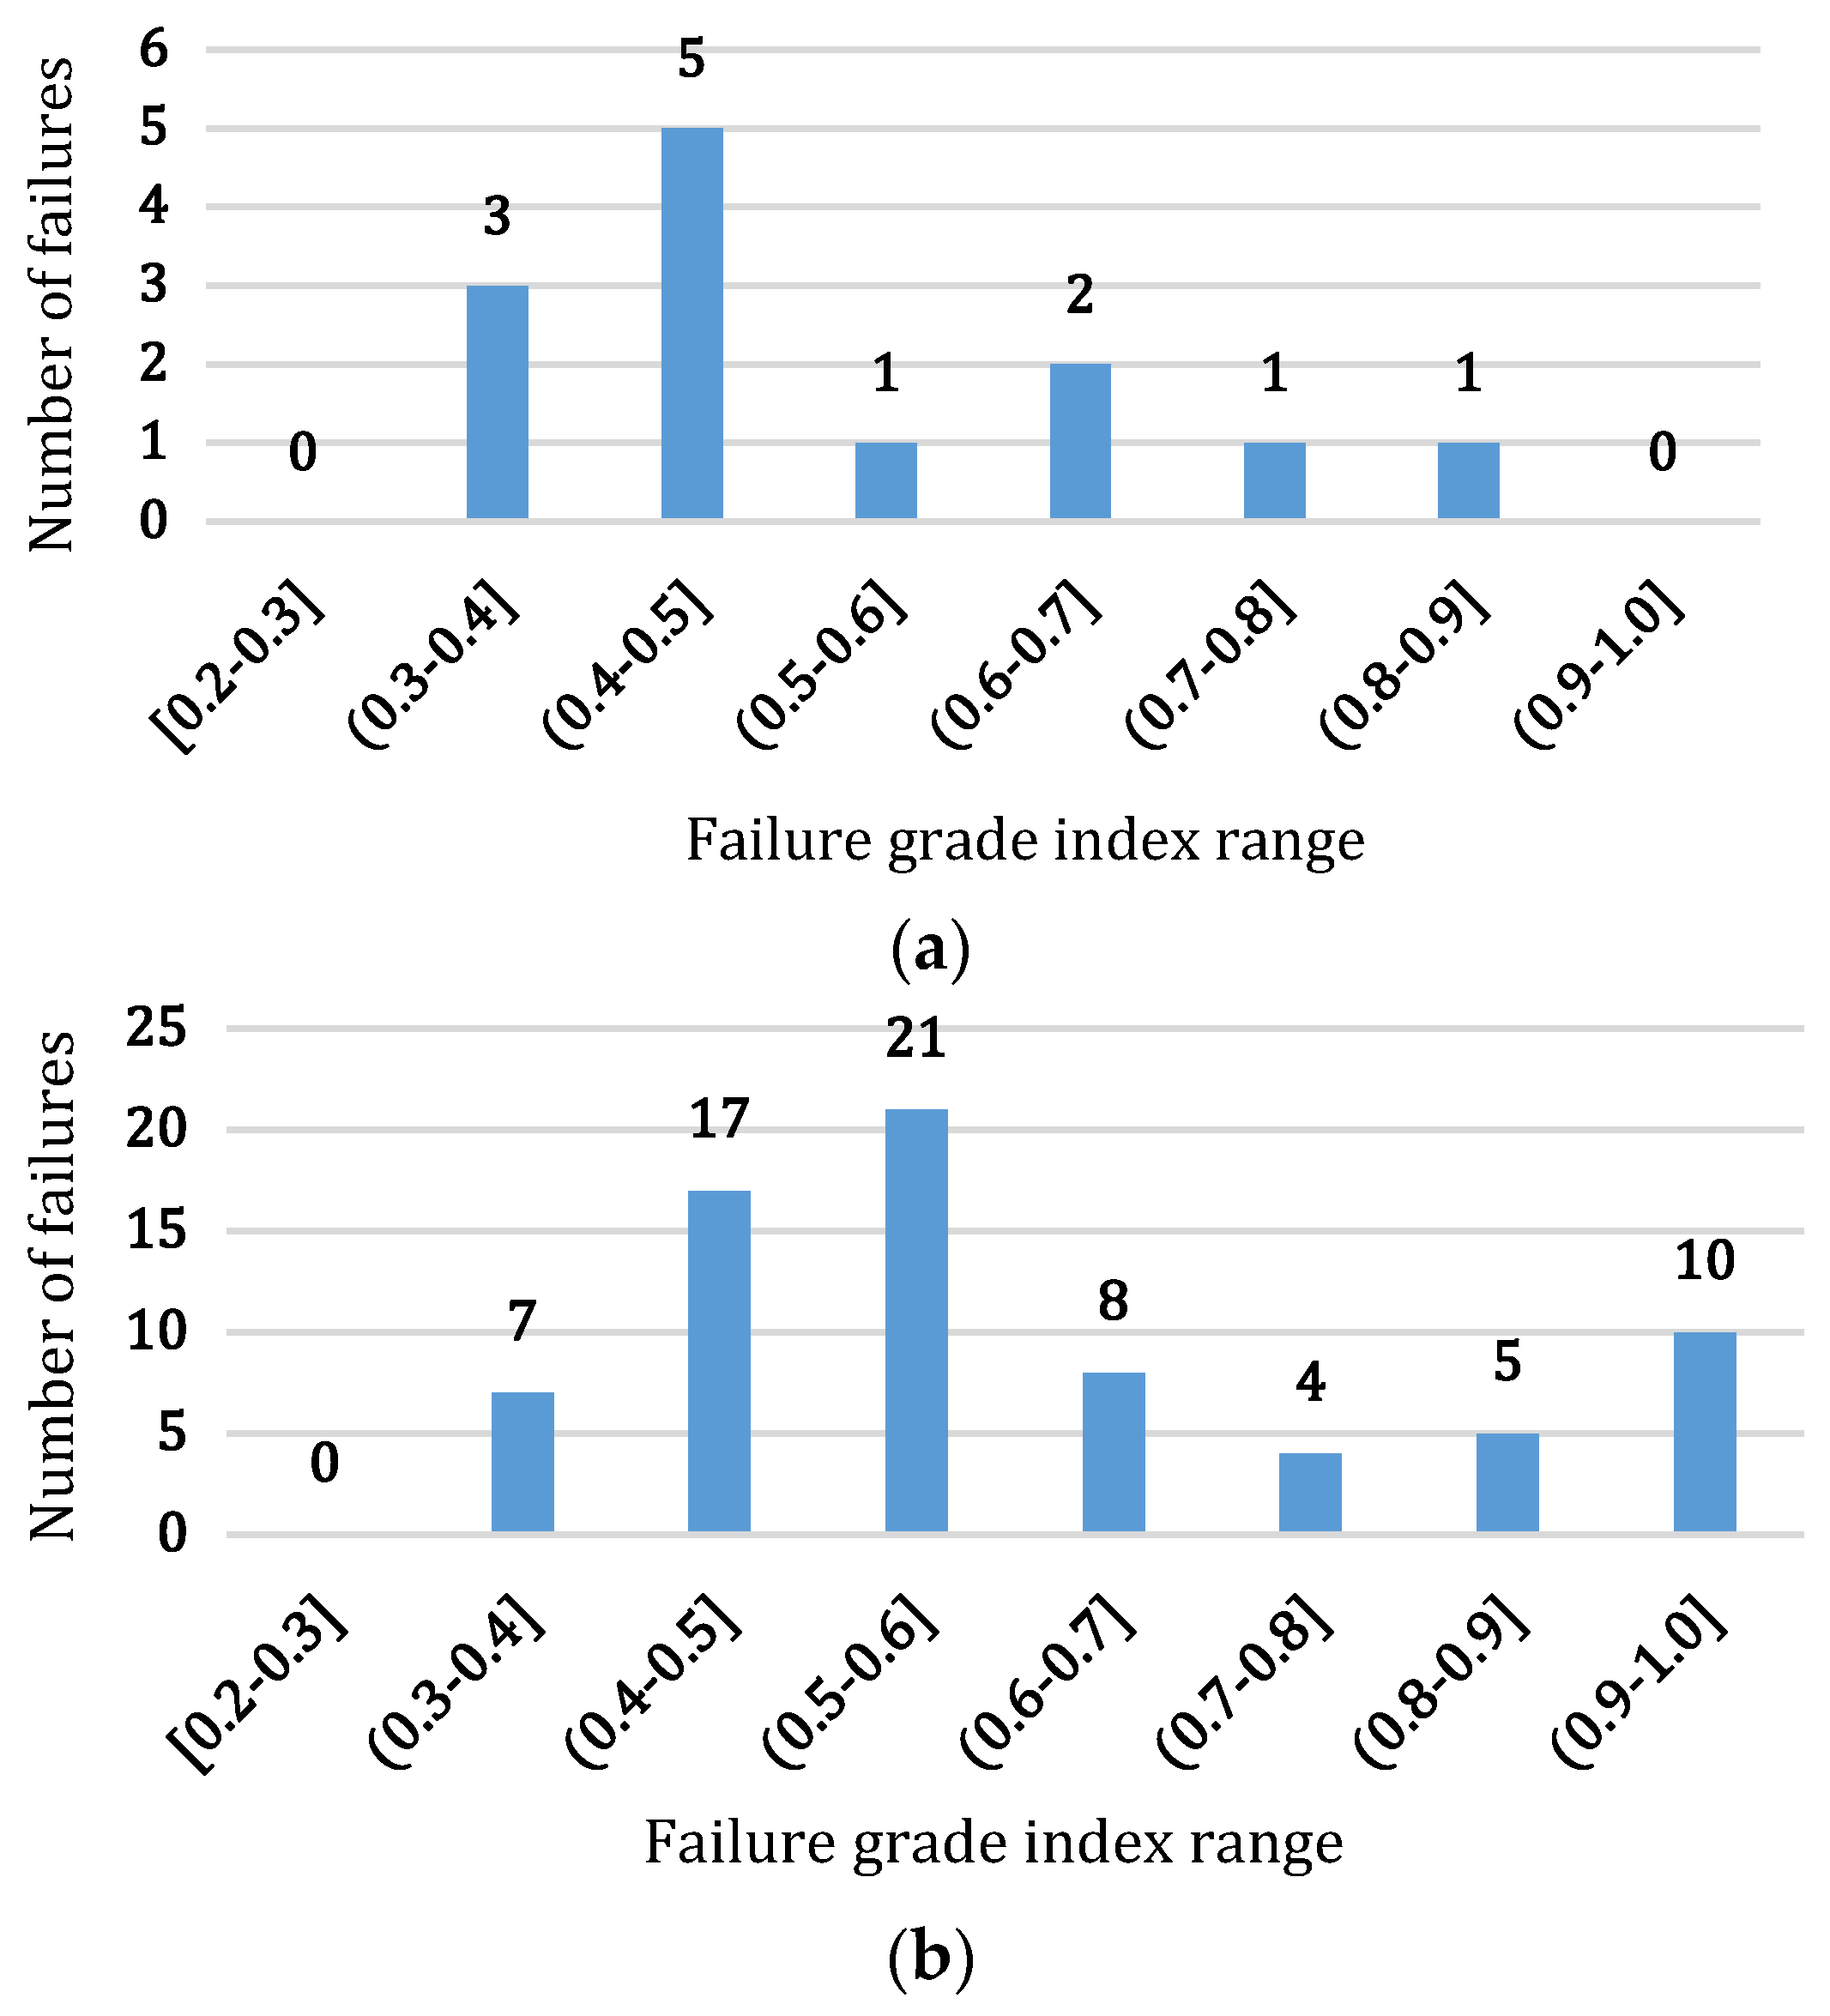
- The distribution feature of the failure-grade index is analyzed firstly based on the calculation implemented in the example cases of the above section. Figure 5a,b shows the interval distributions of the failure-grade index for the machine tool and the cooling system, respectively. In the two figures, it is shown that the distribution features a bell shape, roughly increasing first and then decreasing; thus, it can be considered that the grade index approximately follows a positive skewed distribution.
4.2. Example Analysis
5. Novel Reliability-Evaluation Model and Example Analysis
5.1. Novel Reliability-Evaluation Model
- (1)
- Failures with a membership degree of zero at each grade were eliminated. Since the membership degree of the failure at the grade is less than or equal to one and may be zero, the failures with a membership degree of zero at each grade are eliminated for the ease of the reliability modeling.
- (2)
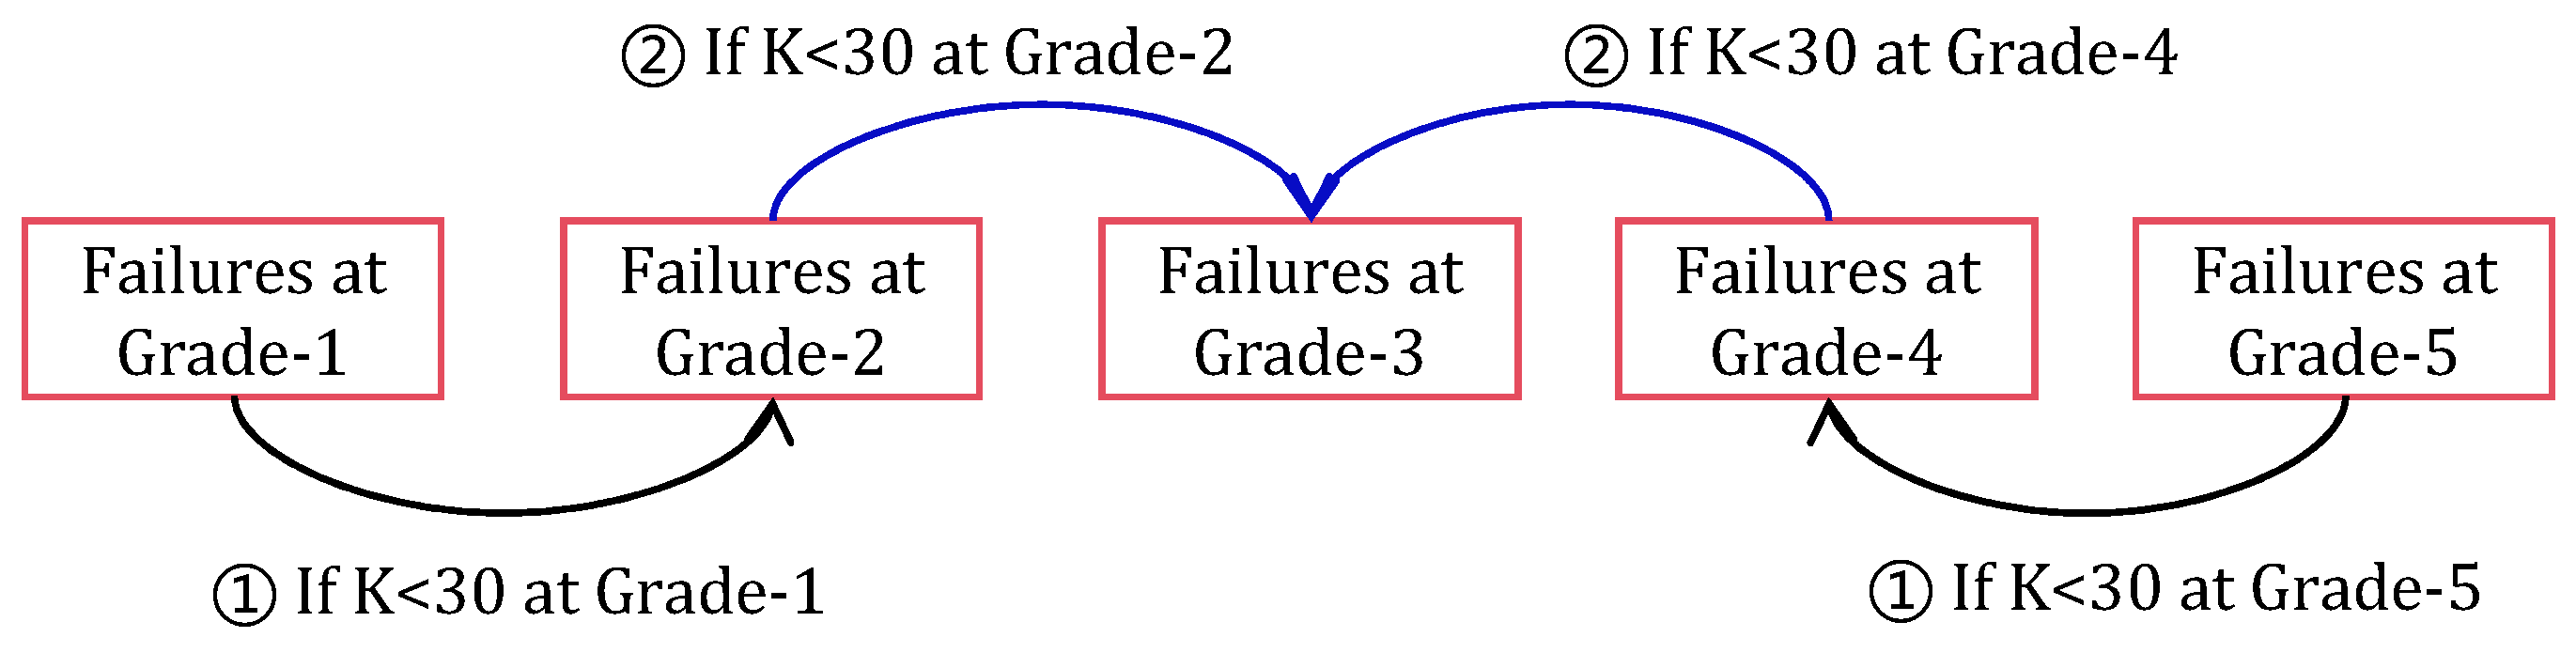
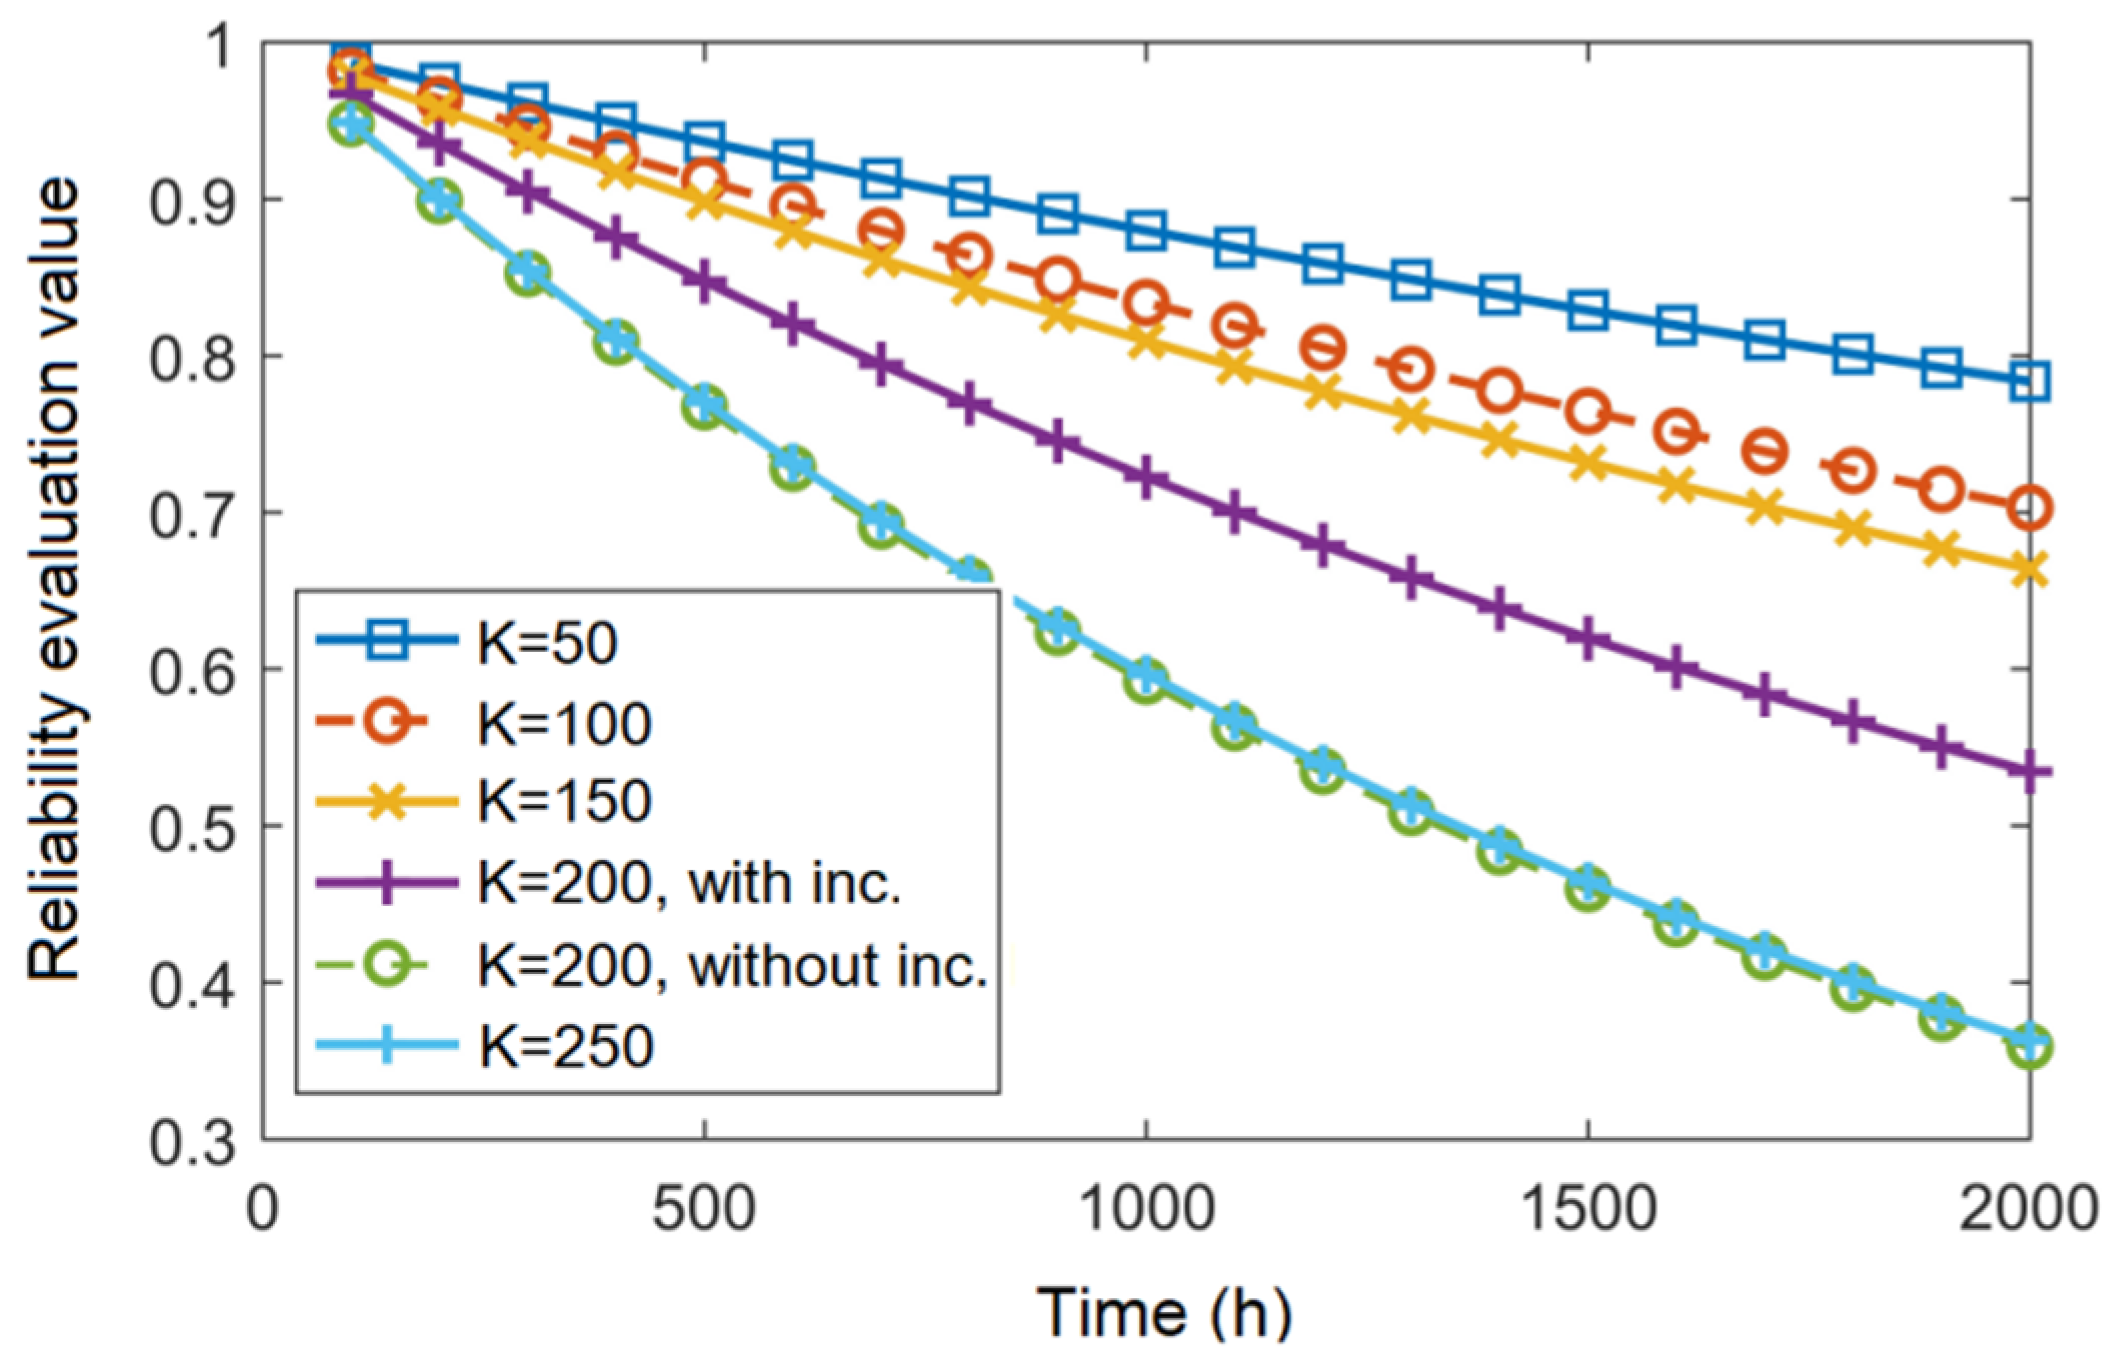
- Small sample data cases at some grades after expansion were re-handled, as in Figure 8. In detail, according to the analysis of the distribution of failure-grade index, it approximately follows a positive skewed distribution; therefore, the failure samples at some edge grades may still be small samples even after expansion. In order to avoid the serious deviation phenomenon caused by the small-sample cases at some grades, in this work, the failures at the grade with small sample data (in previous works, when the sample size K was less than 30, it was regarded as the small-sample case) are automatically incorporated into the failure data at the lower or higher grades, starting at the lowest and highest grades, respectively, until the sample size at each grade satisfies the sample-size requirement.
5.2. Example Analysis
6. Conclusions and Future Works
- (1)
- In the failure-grade fuzzy-evaluation method, the failure severity, maintenance time, and expense are considered to establish the failure-grade index model. From the simulation cases, we note that this method is effective for characterizing the state of failure based on its influence on the system performance or function.
- (2)
- In the modified adaptive small-sample-expansion method, the data of the time between failures and the failure-grade index are expanded through random-number optimization based on error judgement and correlation coefficient judgement, respectively. The results of simulation cases indicate that the distributions of the original and its corresponding newborn samples are basically the same, which verified the effectiveness of the proposed sample-expansion method.
- (3)
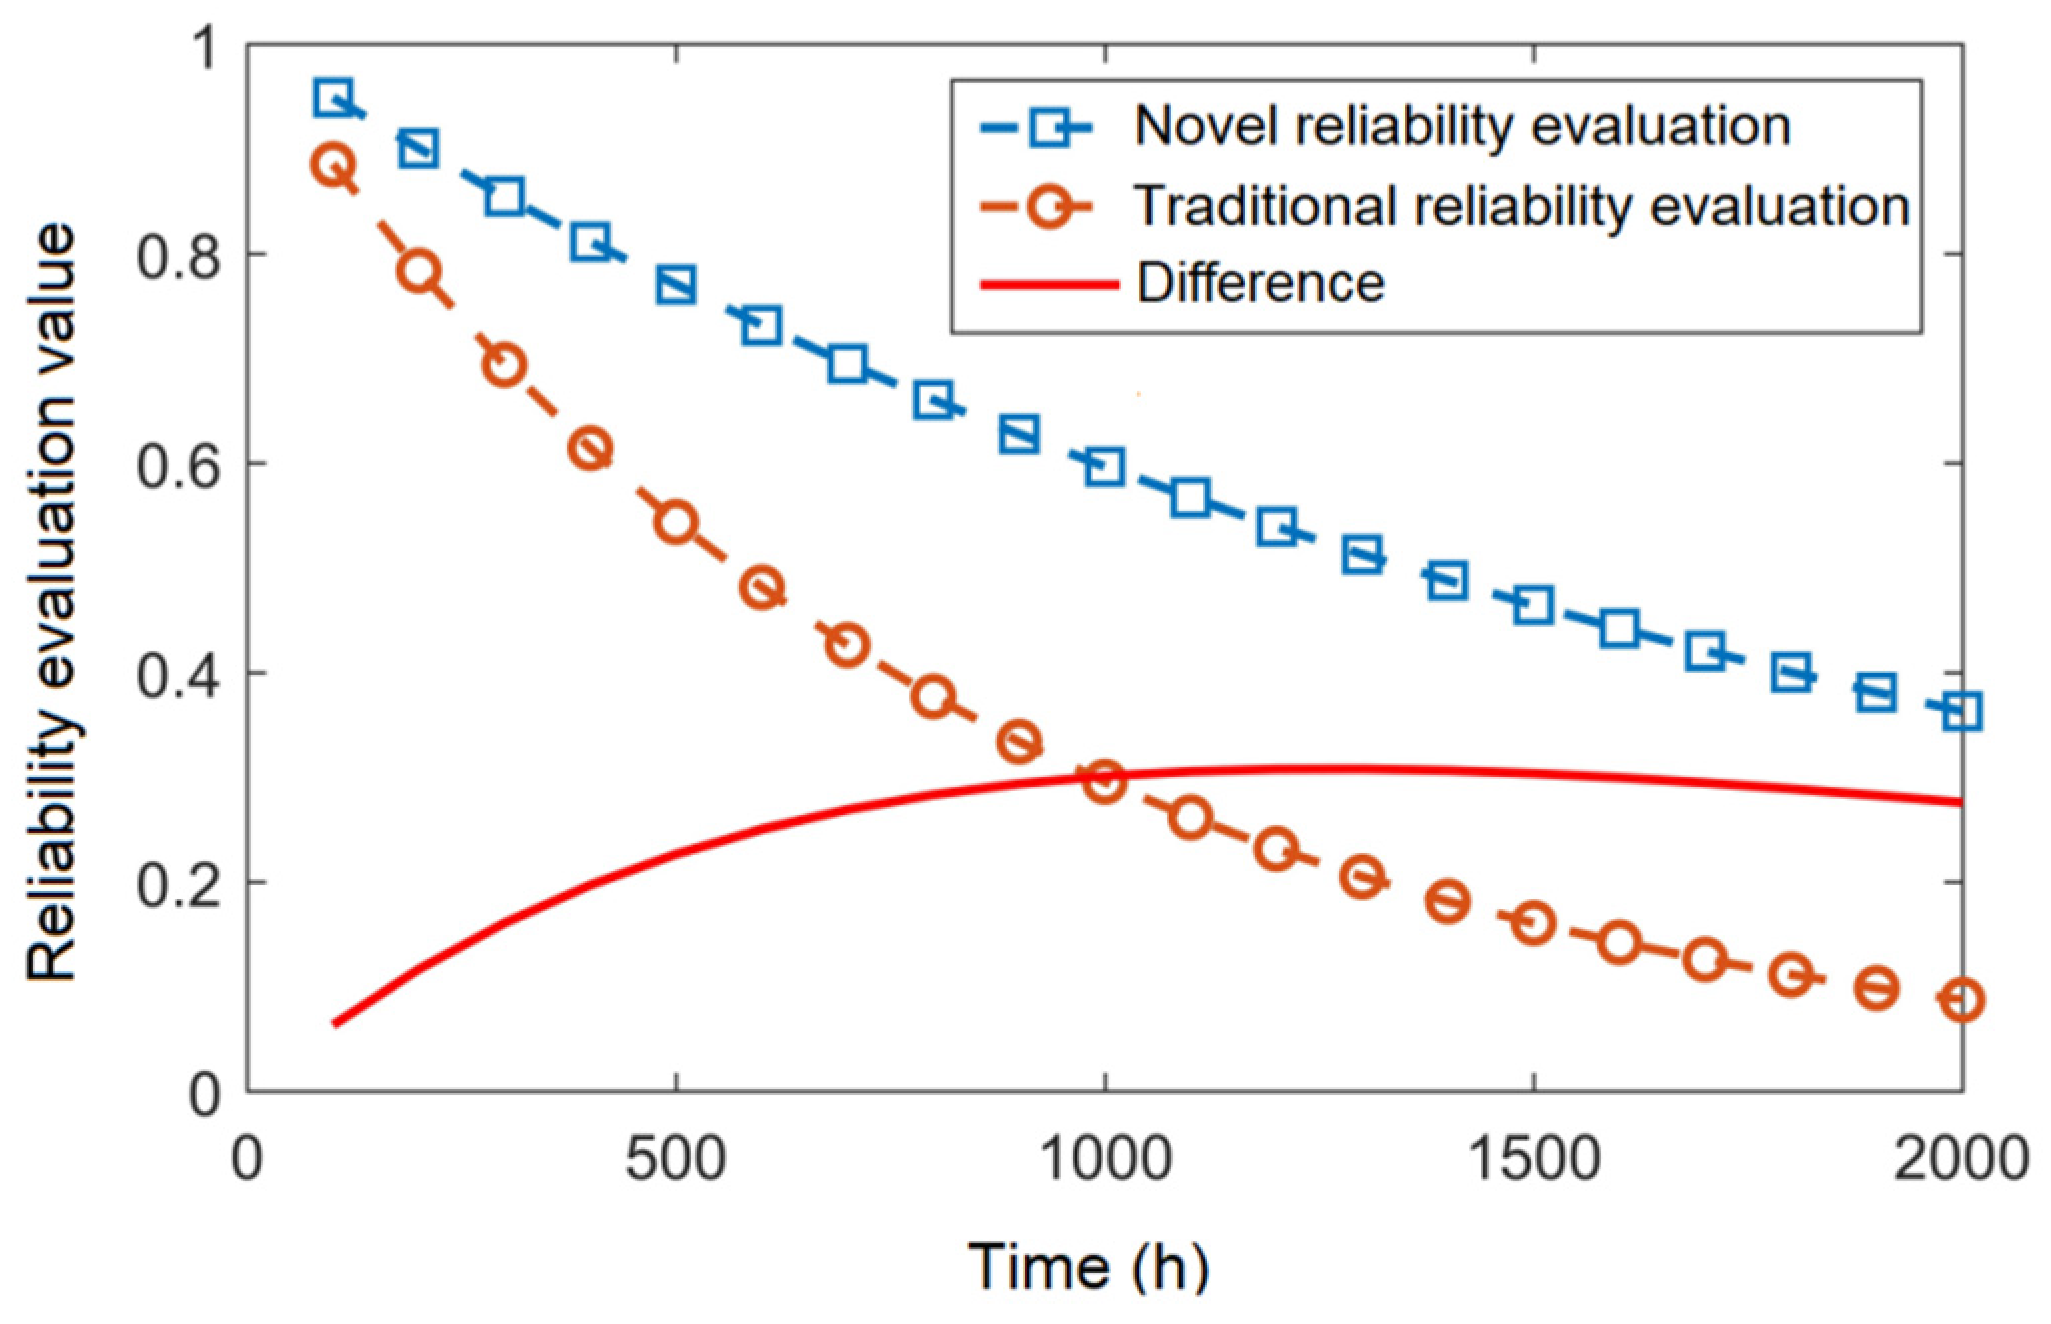
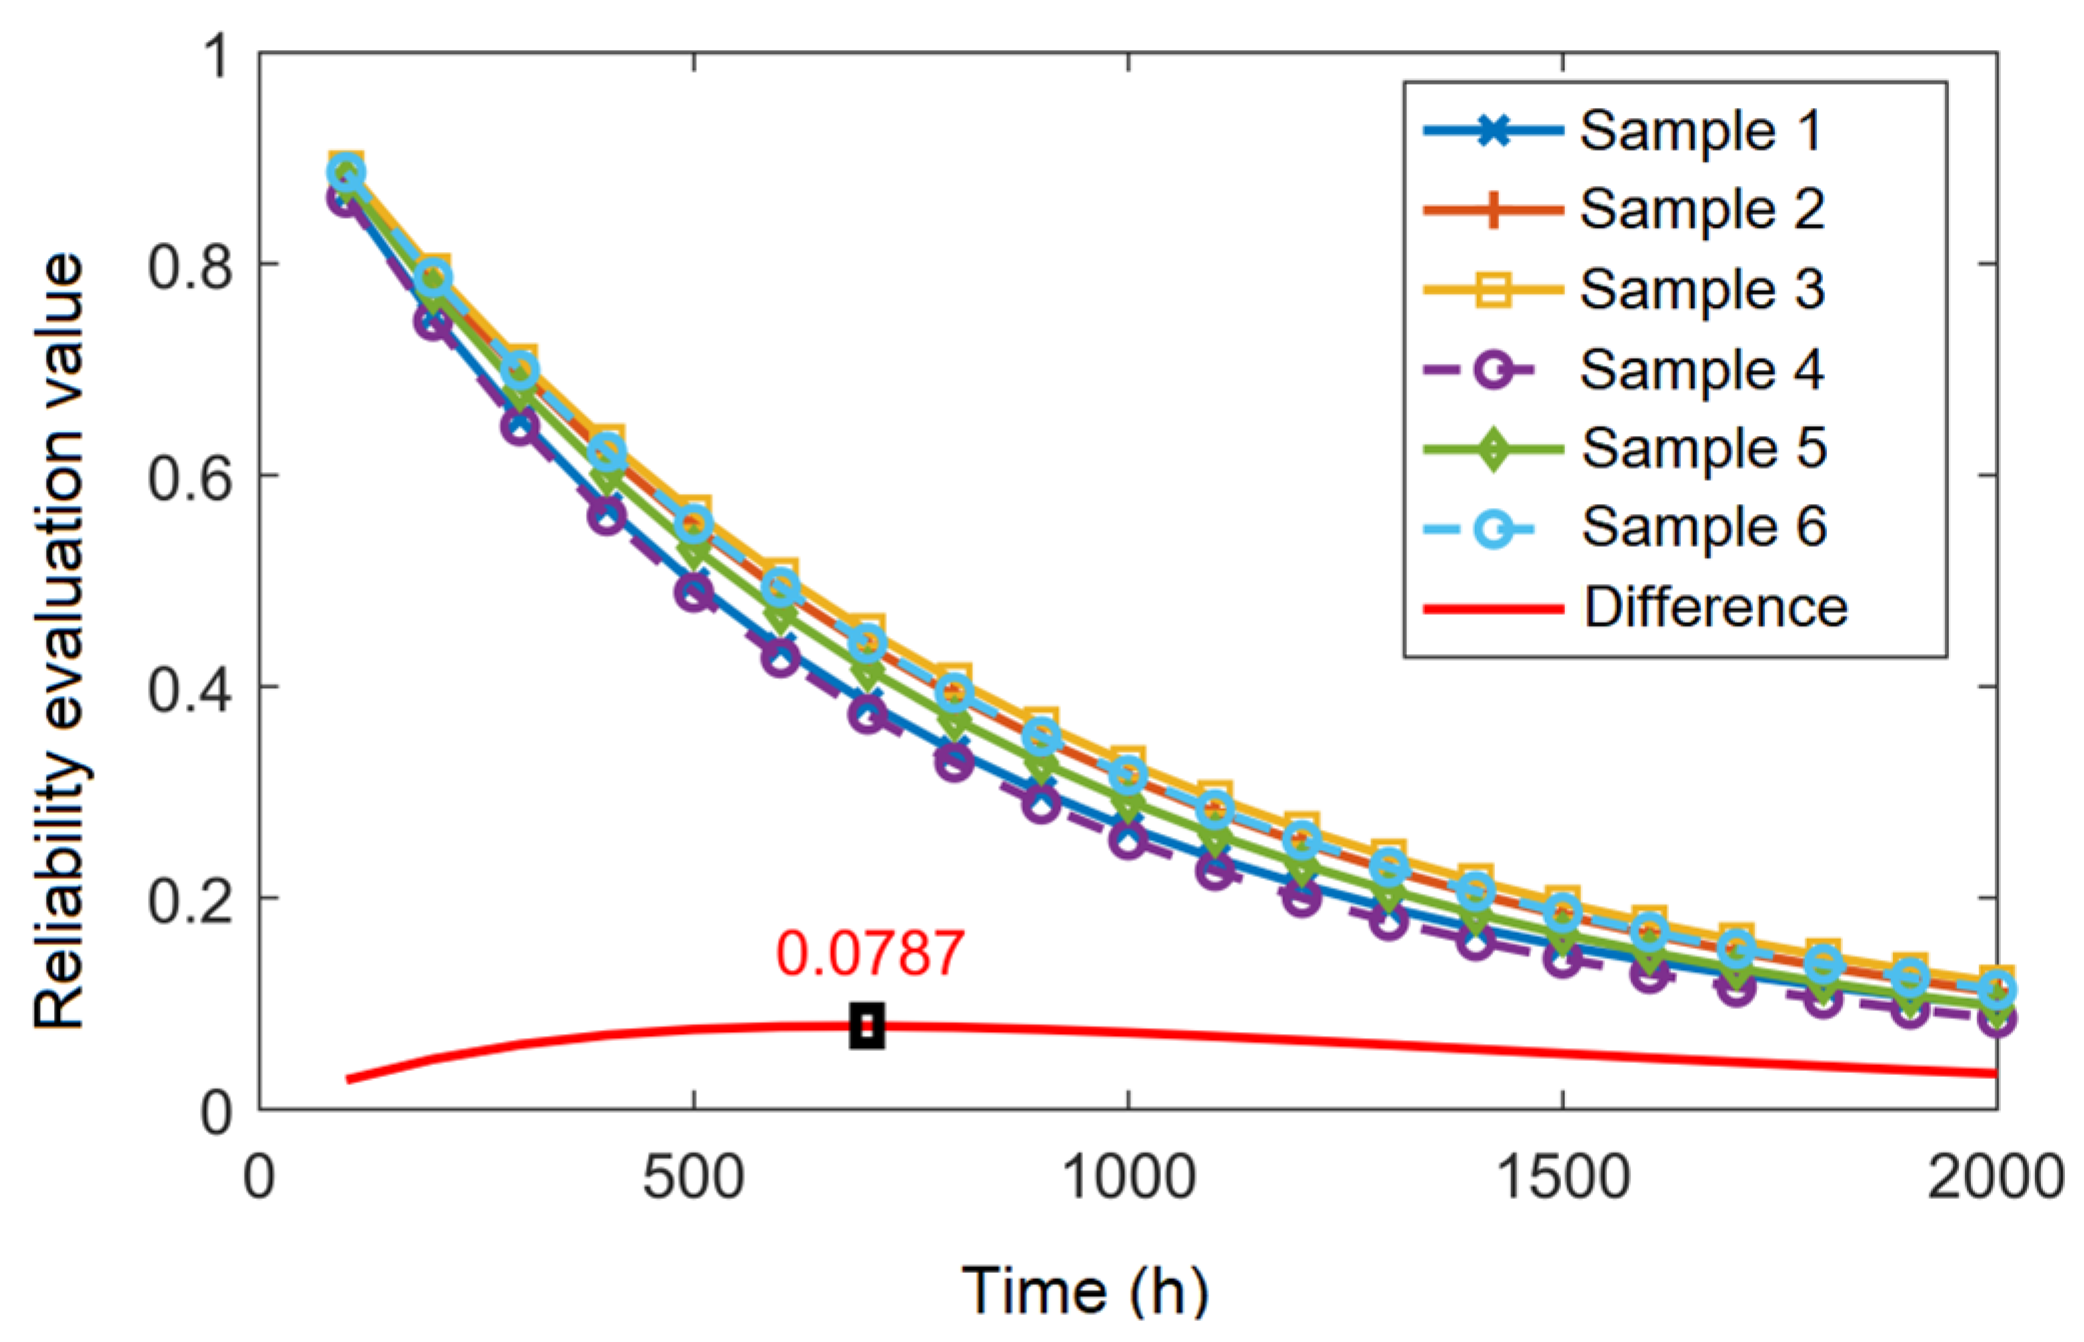
- In the novel reliability-evaluation modeling method, the distribution parameters are estimated by introducing the failure-grade membership degree; then, the equipment-failure distribution function at each grade is established, and the equipment reliability is finally modeled. Based on simulation cases, the novel method can more accurately evaluate the reliability level of equipment based on sufficient failure data after the effective sample expansion, which avoids the problem of the over-evaluation of equipment unreliability caused by ignoring multi-state failures. Moreover, the randomness of the sample-expansion process has a minor impact on the reliability-evaluation result—for example, the maximum fluctuation value of the reliability curves of the machine tool is 0.081 and that of the cooling system is 0.0787, which shows the stability of the proposed reliability-evaluation scheme.
Author Contributions
Funding
Data Availability Statement
Conflicts of Interest
Appendix A. Failure Data Based on Fuzzy Evaluation

| No. | (h) | Failure | Severity | (min) | (RMB) | Failure-Grade Fuzzy Evaluation | |
|---|---|---|---|---|---|---|---|
| 1 | 20 | F1 | 4 | 30 | 0 | 0.4750 | [0,0.625,0.375,0,0] |
| 2 | 29 | F2 | 2 | 150 | 800 | 0.7400 | [0,0,0.3,0.7,0] |
| 3 | 44 | F3 | 3 | 19 | 80 | 0.3715 | [0.1425,0.8575,0,0,0] |
| 4 | 112 | F4 | 3 | 190 | 2000 | 0.9000 | [0,0,0,0.5,0.5] |
| 5 | 176 | F5 | 3 | 15 | 0 | 0.3375 | [0.3125,0.6875,0,0,0] |
| 6 | 259 | F6 | 2 | 60 | 0 | 0.3500 | [0.25,0.75,0,0,0] |
| 7 | 467 | F7 | 4 | 200 | 0 | 0.7000 | [0,0,0.5,0.5,0] |
| 8 | 635 | F8 | 3 | 60 | 0 | 0.4500 | [0,0.75,0.25,0,0] |
| 9 | 949 | F9 | 3 | 30 | 400 | 0.4950 | [0,0.525,0.475,0,0] |
| 10 | 1242 | F10 | 4 | 60 | 1.0 | 0.5503 | [0,0.2485,0.7515,0,0] |
| 11 | 1576 | F11 | 2 | 100 | 100 | 0.4800 | [0,0.6,0.4,0,0,0] |
| 12 | 1924 | F12 | 3 | 60 | 0 | 0.4500 | [0,0.75,0.25,0,0] |
| 13 | --- | F13 | 3 | 200 | 20 | 0.6060 | [0,0,0.97,0.03,0] |
| No. | (h) | Failure | Severity | (min) | (RMB) | Failure-Grade Fuzzy Evaluation | |
|---|---|---|---|---|---|---|---|
| 1 | 5 | FX01 | 4 | 21 | 40 | 0.4645 | [0,0.6775,0.3225,0,0] |
| 2 | 7 | FX02 | 3 | 150 | 2000 | 0.9000 | [0,0,0,0.5,0.5] |
| 3 | 7 | FX03 | 4 | 92 | 0 | 0.6300 | [0,0,0.85,0.15,0] |
| 4 | 8 | FX04 | 4 | 99 | 2000 | 0.9475 | [0,0,0,0.2625,0.7375] |
| 5 | 10 | FX05 | 4 | 92 | 2000 | 0.9300 | [0,0,0,0.35,0.65] |
| 6 | 10 | FX06 | 4 | 63 | 0 | 0.5575 | [0,0.2125,0.7875,0,0] |
| 7 | 11 | FX07 | 4 | 66 | 0 | 0.5650 | [0,0.175,0.825,0,0] |
| 8 | 17 | FX08 | 4 | 65 | 0 | 0.5625 | [0,0.1875,0.8125,0,0] |
| 9 | 27 | FX09 | 2 | 81 | 500 | 0.5525 | [0,0.2375,0.7625,0,0] |
| 10 | 35 | FX10 | 3 | 73 | 10 | 0.4855 | [0,0.5725,0.4275,0,0] |
| 11 | 37 | FX11 | 3 | 215 | 0 | 0.6000 | [0,0,1,0,0] |
| 12 | 47 | FX12 | 3 | 65 | 0 | 0.4625 | [0,0.6875,0.3125,0,0] |
| 13 | 47 | FX13 | 3 | 32 | 10 | 0.3830 | [0.085,0.915,0,0,0] |
| 14 | 48 | FX14 | 3 | 146 | 2000 | 0.9000 | [0,0,0,0.5,0.5] |
| 15 | 49 | FX15 | 4 | 23 | 0 | 0.4575 | [0,0.7125,0.2875,0,0] |
| 16 | 56 | FX16 | 4 | 19 | 200 | 0.5075 | [0,0.4625,0.5375,0,0] |
| 17 | 60 | FX17 | 4 | 311 | 500 | 0.8500 | [0,0,0,0.75,0.25] |
| 18 | 64 | FX18 | 4 | 152 | 2000 | 1.0000 | [0,0,0,0,1] |
| 19 | 70 | FX19 | 4 | 59 | 0 | 0.5475 | [0,0.2625,0.7375,0,0] |
| 20 | 77 | FX20 | 4 | 33 | 0 | 0.4825 | [0,0.5875,0.4125,0,0] |
| 21 | 80 | FX21 | 4 | 58 | 800 | 0.7850 | [0,0,0.075,0.925,0] |
| 22 | 83 | FX22 | 3 | 34 | 1000 | 0.6850 | [0,0,0.575,0.425,0] |
| 23 | 88 | FX23 | 3 | 74 | 10 | 0.4880 | [0,0.56,0.44,0,0] |
| 24 | 88 | FX24 | 4 | 91 | 0 | 0.6275 | [0,0,0.8625,0.1375,0] |
| 25 | 93 | FX25 | 4 | 19 | 0 | 0.4475 | [0,0.7625,0.2375,0,0] |
| 26 | 95 | FX26 | 4 | 28 | 200 | 0.5300 | [0,0.35,0.65,0,0] |
| 27 | 95 | FX27 | 4 | 9 | 0 | 0.4225 | [0,0.8875,0.1125,0,0] |
| 28 | 97 | FX28 | 4 | 63 | 1 | 0.5578 | [0,0.211,0.789,0,0] |
| 29 | 103 | FX29 | 4 | 13 | 0 | 0.4325 | [0,0.8375,0.1625,0,0] |
| 30 | 110 | FX30 | 3 | 22 | 0 | 0.3550 | [0.225,0.775,0,0,0] |
| 31 | 114 | FX31 | 4 | 14 | 0 | 0.4350 | [0,0.825,0.175,0,0] |
| 32 | 114 | FX32 | 4 | 26 | 0 | 0.4650 | [0,0.675,0.325,0,0] |
| 33 | 127 | FX33 | 3 | 135 | 2000 | 0.9000 | [0,0,0,0.5,0.5] |
| 34 | 138 | FX34 | 4 | 116 | 200 | 0.7500 | [0,0,0.25,0.75,0] |
| 35 | 158 | FX35 | 3 | 96 | 0 | 0.5400 | [0,0.3,0.7,0,0] |
| 36 | 161 | FX36 | 3 | 27 | 0 | 0.3675 | [0.1625,0.8375,0,0,0] |
| 37 | 173 | FX37 | 4 | 28 | 500 | 0.6200 | [0,0,0.9,0.1,0] |
| 38 | 202 | FX38 | 3 | 30 | 0 | 0.3750 | [0.125,0.875,0,0,0] |
| 39 | 215 | FX39 | 4 | 66 | 0 | 0.5650 | [0,0.175,0.825,0,0] |
| 40 | 216 | FX40 | 4 | 69 | 0 | 0.5725 | [0,0.1375,0.8625,0,0] |
| 41 | 251 | FX41 | 4 | 38 | 500 | 0.6450 | [0,0,0.775,0.225,0] |
| 42 | 258 | FX42 | 4 | 27 | 40 | 0.4795 | [0,0.6025,0.3975,0,0] |
| 43 | 267 | FX43 | 4 | 26 | 1 | 0.4653 | [0,0.6735,0.3265,0,0] |
| 44 | 270 | FX44 | 3 | 44 | 0 | 0.4100 | [0,0.95,0.05,0,0] |
| 45 | 274 | FX45 | 4 | 65 | 0 | 0.5625 | [0,0.1875,0.8125,0,0] |
| 46 | 302 | FX46 | 4 | 126 | 10 | 0.7030 | [0,0,0.485,0.515,0] |
| 47 | 314 | FX47 | 4 | 66 | 300 | 0.6550 | [0,0,0.725,0.275,0] |
| 48 | 326 | FX48 | 4 | 29 | 200 | 0.5325 | [0,0.3375,0.6625,0,0] |
| 49 | 342 | FX49 | 4 | 59 | 40 | 0.5595 | [0,0.2025,0.7975,0,0] |
| 50 | 350 | FX50 | 4 | 33 | 0 | 0.4825 | [0,0.5875,0.4125,0,0] |
| 51 | 400 | FX51 | 3 | 148 | 2000 | 0.9000 | [0,0,0,0.5,0.5] |
| 52 | 406 | FX52 | 4 | 236 | 800 | 0.9400 | [0,0,0,0.3,0.7] |
| 53 | 458 | FX53 | 3 | 32 | 0 | 0.3800 | [0.1,0.9,0,0,0] |
| 54 | 460 | FX54 | 3 | 45 | 200 | 0.4725 | [0,0.6375,0.3625,0,0] |
| 55 | 544 | FX55 | 4 | 66 | 0 | 0.5650 | [0,0.175,0.825,0,0] |
| 56 | 595 | FX56 | 4 | 69 | 0 | 0.5725 | [0,0.1375,0.8625,0,0] |
| 57 | 599 | FX57 | 4 | 65 | 0 | 0.5625 | [0,0.1875,0.8125,0,0] |
| 58 | 627 | FX58 | 4 | 44 | 0 | 0.5100 | [0,0.45,0.55,0,0] |
| 59 | 726 | FX59 | 4 | 65 | 40 | 0.5745 | [0,0.1275,0.8725,0,0] |
| 60 | 830 | FX60 | 3 | 15 | 40 | 0.3495 | [0.2525,0.7475,0,0,0] |
| 61 | 852 | FX61 | 3 | 7 | 0 | 0.3175 | [0.4125,0.5875,0,0,0] |
| 62 | 1042 | FX62 | 3 | 59 | 500 | 0.5975 | [0,0.0125,0.9875,0,0] |
| 63 | 1062 | FX63 | 4 | 117 | 2000 | 0.9925 | [0,0,0,0.0375,0.9625] |
| 64 | 1346 | FX64 | 4 | 159 | 10 | 0.7030 | [0,0,0.485,0.515,0] |
| 65 | 2354 | FX65 | 4 | 96 | 0 | 0.6400 | [0,0,0.8,0.2,0] |
| 66 | 3325 | FX66 | 4 | 19 | 0 | 0.4475 | [0,0.7625,0.2375,0,0] |
| 67 | -- | FX67 | 4 | 117 | 2000 | 0.9925 | [0,0,0,0.0375,0.9625] |
References
- Luo, C.; Shen, L.; Xu, A. Modelling and estimation of system reliability under dynamic operating environments and lifetime ordering constraints. Reliab. Eng. Syst. Saf. 2022, 218, 108136. [Google Scholar] [CrossRef]
- Chang, P.C. Reliability evaluation and big data analytics architecture for a stochastic flow network with time attribute. Ann. Oper. Res. 2022, 311, 3–18. [Google Scholar] [CrossRef]
- Zaka, A.; Naveed, M.; Jabeen, R. Performance of attribute control charts for monitoring the shape parameter of modified power function distribution in the presence of measurement error. Qual. Reliab. Eng. Int. 2022, 38, 1060–1073. [Google Scholar] [CrossRef]
- Gu, R.X.; Ma, X.B.; Zhao, Y. System-Reliability Evaluation Based on Series Chain Model under Exponential Distribution. Appl. Mech. Mater. 2013, 300–301, 758–764. [Google Scholar] [CrossRef]
- Kohout, J. Four-Parameter Weibull Distribution with Lower and Upper Limits Applicable in Reliability Studies and Materials Testing. Mathematics 2023, 11, 544. [Google Scholar] [CrossRef]
- Govinda, R.M.; Murthy, C.S.N.; Jakkula, B. Reliability analysis and failure rate evaluation of load haul dump machines using Weibull distribution analysis. Math. Model. 2018, 5, 116–122. [Google Scholar]
- Abdulmuttaleb, T.H.; Talib, H.R.; Ahmed, A.H. Estimation of the reliability function of the Rayleigh distribution using some robust and kernel methods. J. Phys. Conf. Ser. 2021, 1963, 012064. [Google Scholar] [CrossRef]
- Liu, H.J.; Zhang, Y.Y.; Zhang, D.S.; Xu, Z.C.; Zhang, B. Statistical Analysis and Optimization of Engine Component Strength Fatigue Test Data. Intern. Combust. Engines 2023, 1, 39–43. [Google Scholar]
- Chen, C.Y.; Xiao, D. Research on the Military Equipment Reliability Evaluation Based on the Extreme Value Distribution. Sci. Technol. Vis. 2016, 14, 175–176. [Google Scholar]
- Li, H.; Deng, Z.M.; Golilarz, N.A.; Soares, C.G. Reliability Analysis of the Main Drive System of a CNC Machine Tool Including Early Failures. Reliab. Eng. Syst. Saf. 2021, 215, 107846. [Google Scholar] [CrossRef]
- Shi, Z.H.; Zhao, X.; Zhang, H.; Sun, H.L.; Zeng, C.; Lei, P.; He, X.X.; Xia, F.Q. Reliability Analysis on Domestic Special CNC Machine Tools Based on Weibull Distribution. J. Phys. Conf. Ser. 2021, 2101, 012024. [Google Scholar] [CrossRef]
- Xu, B.B. Study on Reliability Modeling and Analysis of CNC Machine Tools Based on Maintenance Degree. Ph.D. Thesis, Jilin University, Changchun, China, 2011. [Google Scholar]
- Ma, X.Y.; Zhang, X.D.; Peng, R. Reliability of intelligent management of research infrastructure based on internet of things. Control Decis. 2017, 5, 1116–1120. [Google Scholar]
- Liu, X.H.; Zhou, Q.X. Analysis on bridge performance based on dynamic reliability. Shanxi Archit. 2010, 036, 317–319. [Google Scholar]
- Zhou, J.Y.; Zhu, D.W.; Wang, Z.L. Reliability-based Design Optimization Strategy for Structures by Universal Generating Functions. China Mech. Eng. 2021, 32, 1442–1448. [Google Scholar]
- Zhou, Y.G.; Ye, X.R.; Zhai, G.F. System performance reliability assessment based on performance degradation and Monte-Carlo simulation. Chin. J. Sci. Instrum. 2014, 35, 1185–1191. [Google Scholar]
- Gu, Y.; Jing, L. Multi-State System Reliability: A New and Systematic Review. Procedia Eng. 2012, 29, 531–536. [Google Scholar]
- Wang, L.; Dai, W.; Ai, J.; Duan, W.W.; Zhao, Y. Reliability Evaluation for Manufacturing System Based on Dynamic Adaptive Fuzzy Reasoning Petri Net. IEEE Access 2020, 8, 167276–167287. [Google Scholar] [CrossRef]
- He, Y.H.; Chen, Z.X.; Zhao, Y.X.; Han, X.; Zhou, D. Mission Reliability Evaluation for Fuzzy Multistate Manufacturing System Based on an Extended Stochastic Flow Network. IEEE Trans. Reliab. 2020, 69, 1239–1253. [Google Scholar] [CrossRef]
- Sun, H.H.; Xu, L.P.; Li, C.W.; Chen, H.X.; Jiang, G.J.; Nie, X.B. Research on Reliability Modelling for Heavy CNC Machine Tools under Uncertain Variables Based on Universal Generating Function. Math. Probl. Eng. 2022, 2022, 3756824. [Google Scholar] [CrossRef]
- Wang, W.; Cui, Z.; Chen, R.; Wang, Y.; Zhao, X. Regression analysis of clustered panel count data with additive mean models. Stat. Pap. 2023; early access. [Google Scholar] [CrossRef]
- Xu, A.; Wang, B.; Zhu, D.; Pang, J.; Lian, X. Bayesian reliability assessment of permanent magnet brake under small sample size. IEEE Trans. Reliab. 2024; early access. [Google Scholar] [CrossRef]
- Zhou, S.; Xu, A.; Tang, Y.; Shen, L. Fast Bayesian inference of reparameterized gamma process with random effects. IEEE Trans. Reliab. 2024, 73, 399–412. [Google Scholar] [CrossRef]
- Amalnerkar, E.; Lee, T.H.; Lim, W. Reliability analysis using bootstrap information criterion for small sample size response functions. Struct. Multidiscip. Optim. 2020, 62, 2901–2913. [Google Scholar] [CrossRef]
- Huang, L.P.; Liu, D.S.; Yue, W.H.; Yin, X.Y. Reliability Model Reconstruction and Simulation for Mechanical Equipment Undergoing Reassembly and Maintenance. J. Mech. Eng. 2008, 44, 224–230. [Google Scholar] [CrossRef]
- Kaidis, C.; Uzunoglu, B.; Amoiralis, F. Wind turbine reliability estimation for different assemblies and failure severity categories. IET Renew. Power Gener. 2015, 9, 892–899. [Google Scholar] [CrossRef]
- GJB/Z1391-2006; Guide to Failure Mode, Effects, and Criticality Analysis. Standards Press: Beijing, China, 2006.
- Zhang, Z.Q.; Mo, J.J. FMECA analysis considering the fault mode correlation. Electron. Test 2022, 36, 43–46. [Google Scholar]
- Zhang, H.R.; Hong, R.J.; Chen, F.X.; Zhang, Y.B. Reliability analysis method of CNC machine tools on FMECA and fuzzy evaluation. Manuf. Technol. Mach. Tool 2020, 11, 125–129. [Google Scholar]
- Xu, J.L.; Zhang, Q. Evaluation of the reliability of high-grade CNC machine tool based on Type II censored sample. J. Qiqihar Univ. (Nat. Sci. Ed.) 2022, 38, 91–94. [Google Scholar]
- Sun, Z.J. Assessment Study on Reliability and Maintainability Analysis of Industrial Robots Based on Grey System Theory. Master’s Thesis, Kunming University of Science and Technology, Kunming, China, 2015. [Google Scholar]
- Gao, M.; Lv, X.Q.; Xie, J.L. Reliability Evaluation of Guided Ammunition Control System Based on GO Method and Bayes. Ordnance Ind. Autom. 2021, 40, 60–62. [Google Scholar]
- Gómez, Y.M.; Gallardo, D.I.; Marchant, C.; Sánchez, L.; Bourguignon, M. An In-Depth Review of the Weibull Model with a Focus on Various Parameterizations. Mathematics 2024, 12, 56. [Google Scholar] [CrossRef]
- Zhang, G.B.; Tang, X.J.; Liao, X.B.; Xu, Z. Quantitative modeling and application of CNC machine failure distribution curve. J. Chongqing Univ. 2013, 36, 119–123. [Google Scholar] [CrossRef]
- Gao, R.J. Reliability Analysis and Optimization Design of Control System. Master’s Thesis, Dalian University of Technology, Dalian, China, 2002. [Google Scholar]
- Liu, H.P. Reliability Research and Software Design of CNC Internal Grinding Machine. Master’s Thesis, Beijing University of Technology, Beijing, China, 2022. [Google Scholar]


| 1: | Input and ; |
| 2: | Set ; |
| 3: | for to do |
| 4: | ; |
| 5: | Take , ; |
| 6: | Calculate ; |
| 7: | Update ; |
| 8: | end for |
| Failure Grade | I | II | III | IV | V |
|---|---|---|---|---|---|
| Standard value | 0.2 | 0.4 | 0.6 | 0.8 | 1.0 |
| 1: | Input , and ; |
| 2: | Set and ; |
| 3: | Expansion codes of the time between failures: |
| 4: | while () do |
| 5: | for to do |
| 6: | ; |
| 7: | Take , ; |
| 8: | Calculate ; |
| 9: | Update ; |
| 10: | end for |
| 11: | Calculate ; |
| 12: | End while |
| 13: | Expansion codes of the failure-grade index: |
| 14: | while () do |
| 15: | for to do |
| 16: | ; |
| 17: | Take and ; |
| 18: | Calculate ; |
| 19: | Update ; |
| 20: | end for |
| 21: | Calculate and |
| 22: | Take , ; |
| 23: | Calculate ; |
| 24: | End while |
| Iteration Number | Max. Error | Iteration Number | Max. Error | ||
|---|---|---|---|---|---|
| 25 | 9 | 0.0018 | 100 | 6 | 0.0007 |
| 50 | 8 | 0.0037 | 200 | 3 | 0.0057 |
| 75 | 15 | 0.0078 | 300 | 3 | 0.0094 |
| 100 | 31 | 0.0074 | 400 | 3 | 0.0028 |
| Iteration Number | Corr. Coefficient | Iteration Number | Corr. Coefficient | ||
|---|---|---|---|---|---|
| 25 | 18 | 0.9553 | 100 | 8 | 0.9574 |
| 50 | 23 | 0.9682 | 200 | 10 | 0.9815 |
| 75 | 289 | 0.9508 | 300 | 56 | 0.9535 |
| 100 | 1930 | 0.9877 | 400 | 271 | 0.9721 |
| 50 | 13 | 43 | 43 | 19 | 6 |
| 100 | 18 | 77 | 80 | 35 | 14 |
| 150 | 25 | 107 | 116 | 55 | 21 |
| 200 | 35 | 141 | 150 | 71 | 27 |
| 250 | 45 | 175 | 185 | 87 | 32 |
| Failure Sample | ||||||
|---|---|---|---|---|---|---|
| 200 | Sample 1-0 | 20 | 165 | 197 | 99 | 49 |
| Sample 2-0 | 23 | 170 | 194 | 94 | 49 | |
| Sample 3-0 | 26 | 166 | 196 | 98 | 44 | |
| Sample 4-0 | 24 | 168 | 195 | 96 | 47 | |
| 400 | Sample 1 | 36 | 291 | 342 | 173 | 88 |
| Sample 2 | 42 | 292 | 341 | 172 | 83 | |
| Sample 3 | 43 | 290 | 342 | 174 | 81 | |
| Sample 4 | 39 | 287 | 344 | 177 | 83 | |
| Sample 5 | 37 | 289 | 343 | 175 | 86 | |
| Sample 6 | 40 | 294 | 340 | 170 | 86 |
Disclaimer/Publisher’s Note: The statements, opinions and data contained in all publications are solely those of the individual author(s) and contributor(s) and not of MDPI and/or the editor(s). MDPI and/or the editor(s) disclaim responsibility for any injury to people or property resulting from any ideas, methods, instructions or products referred to in the content. |
© 2024 by the authors. Licensee MDPI, Basel, Switzerland. This article is an open access article distributed under the terms and conditions of the Creative Commons Attribution (CC BY) license (https://creativecommons.org/licenses/by/4.0/).
Share and Cite
Xu, J.; Yan, Q.; Pei, Y.; Liu, Z.; Cheng, Q.; Chu, H.; Zhang, T. A Statistical Evaluation Method Based on Fuzzy Failure Data for Multi-State Equipment Reliability. Mathematics 2024, 12, 1414. https://doi.org/10.3390/math12091414
Xu J, Yan Q, Pei Y, Liu Z, Cheng Q, Chu H, Zhang T. A Statistical Evaluation Method Based on Fuzzy Failure Data for Multi-State Equipment Reliability. Mathematics. 2024; 12(9):1414. https://doi.org/10.3390/math12091414
Chicago/Turabian StyleXu, Jingjing, Qiaobin Yan, Yanhu Pei, Zhifeng Liu, Qiang Cheng, Hongyan Chu, and Tao Zhang. 2024. "A Statistical Evaluation Method Based on Fuzzy Failure Data for Multi-State Equipment Reliability" Mathematics 12, no. 9: 1414. https://doi.org/10.3390/math12091414
APA StyleXu, J., Yan, Q., Pei, Y., Liu, Z., Cheng, Q., Chu, H., & Zhang, T. (2024). A Statistical Evaluation Method Based on Fuzzy Failure Data for Multi-State Equipment Reliability. Mathematics, 12(9), 1414. https://doi.org/10.3390/math12091414