Article

Improved Swarm Intelligence-Based Logistics Distribution Optimizer: Decision Support for Multimodal Transportation of Cross-Border E-Commerce

1
School of International Trade and Economics, Anhui University of Finance and Economics, Bengbu 233030, China
2
Department of Chemical, Materials, and Production Engineering, University of Naples Federico II, 80138 Naples, Italy
3
Faculty of Civil Aviation and Aeronautics, Kunming University of Science and Technology, Kunming 650504, China
*
Author to whom correspondence should be addressed.
Mathematics 2024, 12(5), 763; https://doi.org/10.3390/math12050763
Submission received: 15 January 2024 / Revised: 20 February 2024 / Accepted: 21 February 2024 / Published: 4 March 2024
(This article belongs to the Special Issue Advanced Methods in Intelligent Transportation Systems)

Abstract

:
Cross-border e-commerce logistics activities increasingly use multimodal transportation modes. In this transportation mode, the use of high-performance optimizers to provide decision support for multimodal transportation for cross-border e-commerce needs to be given attention. This study constructs a logistics distribution optimization model for cross-border e-commerce multimodal transportation. The mathematical model aims to minimize distribution costs, minimize carbon emissions during the distribution process, and maximize customer satisfaction as objective functions. It also considers constraints from multiple dimensions, such as cargo aircraft and vehicle load limitations. Meanwhile, corresponding improvement strategies were designed based on the Sand Cat Swarm Optimization (SCSO) algorithm. An improved swarm intelligence algorithm was proposed to develop an optimizer based on the improved swarm intelligence algorithm for model solving. The effectiveness of the proposed mathematical model and improved swarm intelligence algorithm was verified through a real-world case of cross-border e-commerce logistics transportation. The results indicate that using the proposed solution in this study, the cost of delivery and carbon emissions can be reduced, while customer satisfaction can be improved.

1. Introduction

The development of blockchain technology and internet technology has provided a software and hardware foundation for cross-border e-commerce platforms. At the same time, some social issues, such as an aging society, have further promoted the development of cross-border e-commerce platforms [1]. A recent survey found that an important factor affecting the development of cross-border e-commerce is the cost and risk of logistics during cross-border transportation [2]. Therefore, this study focuses on the logistics and transportation issues of cross-border e-commerce. In the process of fulfilling orders on cross-border e-commerce platforms, logistics delivery optimizers need to optimize the delivery routes of orders in a reasonable manner. In the optimization process, it is necessary to consider transportation costs, carbon emissions, and consumer satisfaction, aiming to provide good services to consumers while creating more profits for distribution enterprises, protecting the environment, and helping cross-border e-commerce enterprises achieve sustainable development.
Unlike ordinary logistics distribution processes and last-mile delivery, cross-border e-commerce is increasingly inclined to use multimodal transportation methods in the transportation process [3,4]. There have been some studies that have used the truck-drone collaborative distribution model in the last-mile delivery process [5], but these studies are not applicable to the distribution problem of cross-border e-commerce. This is because cross-border e-commerce delivery has a large geographical span, and the single delivery model based on trucks is no longer applicable. Cross-border e-commerce logistics distribution usually consists of two steps: (1) long-distance transportation based on airplanes and ships, and (2) short-distance transportation based on trucks and other small transportation vehicles (such as drones).
In [6], when conducting logistics distribution for cross-border e-commerce, the focus was on the cost of distribution and customer satisfaction. Path cost usually consists of path length cost or time cost. Customer satisfaction is determined by the expected arrival time of the customer and the actual arrival time of the product. As shown in Figure 1, selecting a product from the United States on the Amazon cross-border e-commerce platform will generate an estimated arrival time when the consumer places an order. If the estimated arrival time generated by the platform meets the customer’s expected arrival time, the customer will choose to place an order. According to work [6], if the customer places an order too early or too late, it can lead to customer dissatisfaction.
Unlike work [6], with the proposal and development of sustainable development goals, some research on logistics distribution issues has introduced carbon emissions during logistics transportation into the objective function [7]. Therefore, the objective function in this study considers three objectives: path cost, carbon emissions, and satisfaction of the distribution process. In addition, it is worth pointing out that most of the research on cross-border e-commerce logistics distribution has focused on only a portion of cross-border e-commerce logistics. For example, in reference [3], long-distance transportation was given special attention, while in work [6], short-distance transportation was given special attention. Specifically, all studies have focused on one or several steps in the process of multimodal transportation, rather than the entire process of cross-border e-commerce multimodal transportation.
At present, in order to develop the potential of related research in commercial applications, some work has integrated several independent works and established corresponding double-layer or multi-objective mathematical models, especially in the fields of robotics and automation [8,9,10]. The above research provides ideas for the establishment of a more comprehensive integrated model for multimodal transportation in cross-border e-commerce logistics distribution. The main contributions of this study are summarized as follows:
  • A target function was established to address the issue of cross-border e-commerce logistics distribution, considering three objectives: path cost, carbon emissions, and satisfaction of the distribution process.
  • This study integrates long-distance transportation based on aviation and the last-mile delivery problem based on vehicles and drones, making it more in line with the actual standards of cross-border e-commerce logistics distribution.
  • In response to the problem of the sand cat swarm optimization (SCSO) algorithm easily falling into local optima, improvement strategies including chaotic initialization, elite retention strategy, and nonlinear weights strategy were designed to enhance the algorithm’s ability to jump out of local optima.
  • Due to the lack of benchmark examples for this issue, similar to work [6], simulation experiments were conducted on real delivery orders from four port cities and compared with several other algorithms. The results proved the effectiveness of the logistics distribution optimizer based on improved swarm intelligence algorithms.
The remaining parts of this study are arranged as follows, and Section 2 reviews the work related to cross-border e-commerce logistics and distribution issues. Section 3 establishes a mathematical model for cross-border e-commerce logistics distribution. Section 4 designs a swarm intelligence optimizer. Section 5 presents the results of the simulation experiment. Finally, Section 6 summarizes the entire text.

2. Literature Review

2.1. Cross-Border E-Commerce Logistics Services

Cross-border e-commerce services are accepted and used more and more by consumers, and in reference [1], some potential benefits of cross-border e-commerce for elderly people in European countries have been proven. The authors of reference [11] studied the cross-border logistics transportation problems in the Shanghai, Venice, and Berlin regions, focusing on selecting carriers for cross-border logistics activities rather than optimizing the transportation routes. Specifically, by using auction algorithms to determine the carrier for cross-border logistics, the shipper’s interests are maximized. Reference [12] discusses the carbon emissions of the main transportation modes in cross-border e-commerce transportation. The two main transportation modes used in cross-border transportation are sea freight and air freight. The carbon emission coefficient of air freight is much higher than that of sea freight. However, air freight can save 63.9–78.7% of transportation time compared to sea freight. On cross-border e-commerce platforms, consumers generally choose transportation modes based on their preferences. In-depth analysis of transportation modes has also been conducted in [13,14], aiming to select the mode with the lowest cost and lowest risk for cross-border e-commerce enterprises based on consumer preferences.
Reference [15] studied inventory optimization and demand forecasting in cross-border e-commerce, integrating the two models and developing a deep learning method with the aim of minimizing inventory costs while meeting consumer needs. The above research focuses on the different stages of cross-border e-commerce logistics services, including the study of cross-border e-commerce logistics distribution. The authors of reference [3] proposed a multimodal transport model for cross-border e-commerce logistics services. This model consists of two parts: domestic market transportation based on trucks and international market transportation based on sea freight. This type of model is suitable for larger volumes and longer transportation times. This study also focused on something other than the complete delivery process of international express delivery. The authors of reference [6] studied the optimization of international express delivery routes for cross-border e-commerce. It is worth noting that it only studied the last-mile delivery problem of international express delivery after entering port cities without considering the optimization of the entire delivery process of international express delivery. The authors of reference [16] also studied the cross-border e-commerce logistics activities of agricultural products, but they only studied a single type of truck transportation mode. When facing transportation cases with large regional spans, this model is also not applicable.

2.2. Logistics Distribution Optimization

Vehicle-drone joint distribution is an emerging research direction in the field of logistics distribution in recent years, which combines the advantages of vehicles and drones to improve distribution efficiency and reduce distribution costs. This delivery mode is suitable for the last-mile of short-distance deliveries. The authors of reference [17] propose a collaborative delivery system using drones and ground vehicles. The system establishes an objective function to minimize costs and achieves efficient distribution by optimizing paths and scheduling schemes. The authors of reference [18] also establish a cost minimization objective function, aiming to minimize the distribution cost of the truck-drone joint distribution network facing the last mile. Meanwhile, a meta-heuristic algorithm was developed, and the results showed that this optimization method can significantly improve delivery efficiency. The authors of reference [19] proposed a hybrid routing method for a drone-assisted package delivery system. After the vehicle stops at the parking point, the drone will use the vehicle as a return platform. This method combines the fast delivery capability of drones with the large capacity advantage of ground vehicles, achieving efficient delivery.
The authors of reference [20] studied the vehicle routing problem of drone delivery. By establishing mathematical models and algorithms and optimizing the parking points of vehicles and the delivery order of drones, we have focused on solving the problem of drone delivery paths and time windows. The authors of reference [21] propose a two-level vehicle drone routing problem to meet the personalized delivery needs of consumers. This study also solved the collaborative delivery problem between drones and vehicles by establishing optimization models and algorithms. The research results indicate that the joint delivery of drones and vehicles can significantly improve delivery efficiency and reduce delivery costs. The above studies all attempt to establish optimization models and design algorithms to achieve efficient and low-cost distribution.
Due to the large scale, numerous parameters, and large variable dimensions of the vehicle drone joint distribution problem, heuristic algorithms are often used in most studies to solve the problem. Specifically, the authors of reference [22] propose an improved variable neighborhood search meta-heuristic algorithm for solving the truck-drone joint distribution problem. In a small-scale instance, the algorithm can obtain the optimal solution, and in a large-scale instance, the quality of the solution solved by the algorithm is better than that of the simulated annealing algorithm. The authors of reference [23] combine the variable neighborhood search algorithm and taboo search algorithm to design an improved heuristic algorithm for solving the last-mile delivery problem of drones and trucks. This algorithm provides ideas for the algorithm improvement strategy in this article. The authors of reference [24] improved the genetic algorithm with the aim of optimizing the vehicle drone collaborative delivery network. The simulation results fully demonstrate the outstanding performance of genetic algorithms in optimizing the distribution process of perishable goods.
The above work studied the vehicle drone joint delivery problem as a variant of the Vehicle Routing Problem (VRP) [25], which is of great significance for the last-mile delivery problem in the cross-border e-commerce logistics distribution process. However, it is worth noting that the above research did not further investigate the flight trajectory planning problem of drones in the real world. Unlike vehicles driven by drivers, drones usually do not have a single drone driver to drive them during the delivery process. Therefore, in order for drones to successfully complete delivery tasks, the trajectory planning problem of drones must be studied as a subproblem of cross-border e-commerce logistics distribution.

2.3. Drone Trajectory Planning

As previously mentioned, this study integrates long-distance transportation based on aviation and the last-mile delivery problem based on vehicle drones. In order to fully consider the entire process of cross-border e-commerce logistics distribution, this paper studies the problem of drone trajectory planning. Drone trajectory planning is one of the key issues in drone logistics distribution, which involves issues such as the flight path, flight time, and energy consumption of drones. The authors of reference [26] proposed a drone trajectory planning model for urban distribution that considers the energy consumption and noise of drones and designs a meta-heuristic algorithm aimed at planning drone trajectories in a three-dimensional environment.
The authors of reference [27] conducted a comprehensive investigation on the path planning of unmanned aerial vehicles, including methods based on graph theory, optimization, and artificial intelligence. The article points out that the path planning of drones needs to consider various factors such as flight environment, drone performance, task requirements, etc. The authors of reference [28] also investigated the 3D path planning of drones, including methods based on graph theory, optimization, and artificial intelligence. The investigation found that 3D path planning is an important research direction for drone path planning. The authors of reference [29] studied the energy-efficient path-planning problem of unmanned aerial vehicles. By establishing an energy consumption model and optimization algorithm, the article proposes a path-planning method that can effectively reduce the energy consumption of unmanned aerial vehicles. The authors of reference [30] aim to solve the path-planning problem of drone delivery in urban areas. By considering factors such as buildings, traffic rules, and wind speed, the article proposes a drone path-planning method suitable for urban areas. The authors of reference [31] studied the multi-objective path-planning problem of drone delivery. By establishing a multi-objective optimization model and algorithm, the article proposes a path-planning method that can simultaneously consider multiple objectives such as delivery time, energy consumption, and safety. Although there are currently many research methods, such as graph theory-based methods, optimization-based methods, and artificial intelligence-based methods, there are still many challenges that need further research, such as how to consider more practical factors and how to handle multi-objective optimization problems.
Recent studies have found that swarm intelligence algorithms perform well in handling multi-objective optimization problems. The authors of reference [32] use a genetic algorithm (GA) for unmanned aerial vehicle path planning. A method that can effectively find the optimal path was proposed by establishing a fitness function and genetic operation. The authors of reference [33] apply Particle Swarm Optimization (PSO) algorithm for UAV path planning. A method was proposed to quickly find the optimal path by adjusting the speed and position of particles. The authors of reference [34] used the ant colony optimization algorithm (ACO) for unmanned aerial vehicle path planning. By simulating the behavior of ants searching for food, the article proposes a method that can effectively avoid local optima. The authors of reference [35] proposed a hybrid meta-heuristic algorithm for unmanned aerial vehicle path planning. This algorithm combines the advantages of the genetic algorithm and the particle swarm optimization algorithm and can effectively find the optimal path. The simulation results validate the proposed path-planning method, which can simultaneously consider multiple objectives such as delivery time, energy consumption, and safety.

3. A Mathematical Model for Cross-Border E-Commerce Logistics Distribution

In this section, the cross-border e-commerce problem is defined, and a mathematical model for cross-border e-commerce logistics distribution is established. Figure 2 shows the complete cross-border e-commerce logistics process after consumers place orders. Firstly, after placing an order on the cross-border e-commerce platform, consumers can declare their port of entry through the cross-border e-commerce platform. After receiving orders from consumer cross-border e-commerce platforms, suppliers declare to the export port and transport the orders from the warehouse to the export port by truck. At this point, cross-border e-commerce logistics transportation enters the next stage, and orders are transported from the exit port to different entry ports through air transportation. Afterwards, the order enters the final mile of delivery and is transported through a combination of trucks and drones. The reason why air freight is chosen for cross-border (international logistics) transportation is because sea freight usually takes more than 15 days, while air freight only takes 3 days [12]. The standard delivery time provided by cross-border e-commerce platforms is 10 days, as shown in Figure 1. In this article, international express delivery departs from Berlin, Germany, and arrives in different port cities, including Hong Kong, Shanghai, Tianjin, and Ningbo.

3.1. Symbol Description

Before the model was established, some symbol explanations used in this study were provided, as shown in Table 1.

3.2. International Transportation Based on Air Freight

In the cross-border transportation process based on air transportation, specific considerations have been made to minimize transportation costs and carbon emissions during the air transportation process.
The transportation cost of air transportation is usually related to the flight distance of the aircraft, as shown in Formula (1).
A 1 = V p P e α v p , p × C a × d x , e ,
The carbon emission cost of air transportation is related to the weight of the cargo loaded and the distance traveled by the aircraft, as shown in Formula (2).
A 2 = V p P e C O a i r × α v p , p × d e , v p × w v p ,

3.3. Last-Mile Delivery

As mentioned earlier, the process of joint last-mile delivery between freight vehicles and drones mainly consists of two parts. The first part is the selection of a vehicle parking sequence, which can serve as a variant of the VRP problem. The second part is the trajectory planning problem for unmanned aerial vehicles. In this study, the transportation costs and carbon emissions of freight vehicles were considered. At the same time, corresponding sub-objective functions were established with the goal of minimizing the flight time of the drone. During drone flights, drones are limited to a course altitude of 125 m when flying in urban areas, according to regulations under Part 135 of the Federal Aviation Administration [26].
The transportation cost of freight vehicles is defined as follows:
L 1 = T v e e , t v × C h × d e , v p , e P e V p ; t v T v ; e v p ,
The cost of carbon emissions from freight vehicles is defined as follows:
L 2 = t v e C O h × e , t v × d e , v p × w v p , e P e V p ; t v T v ; e v p ,
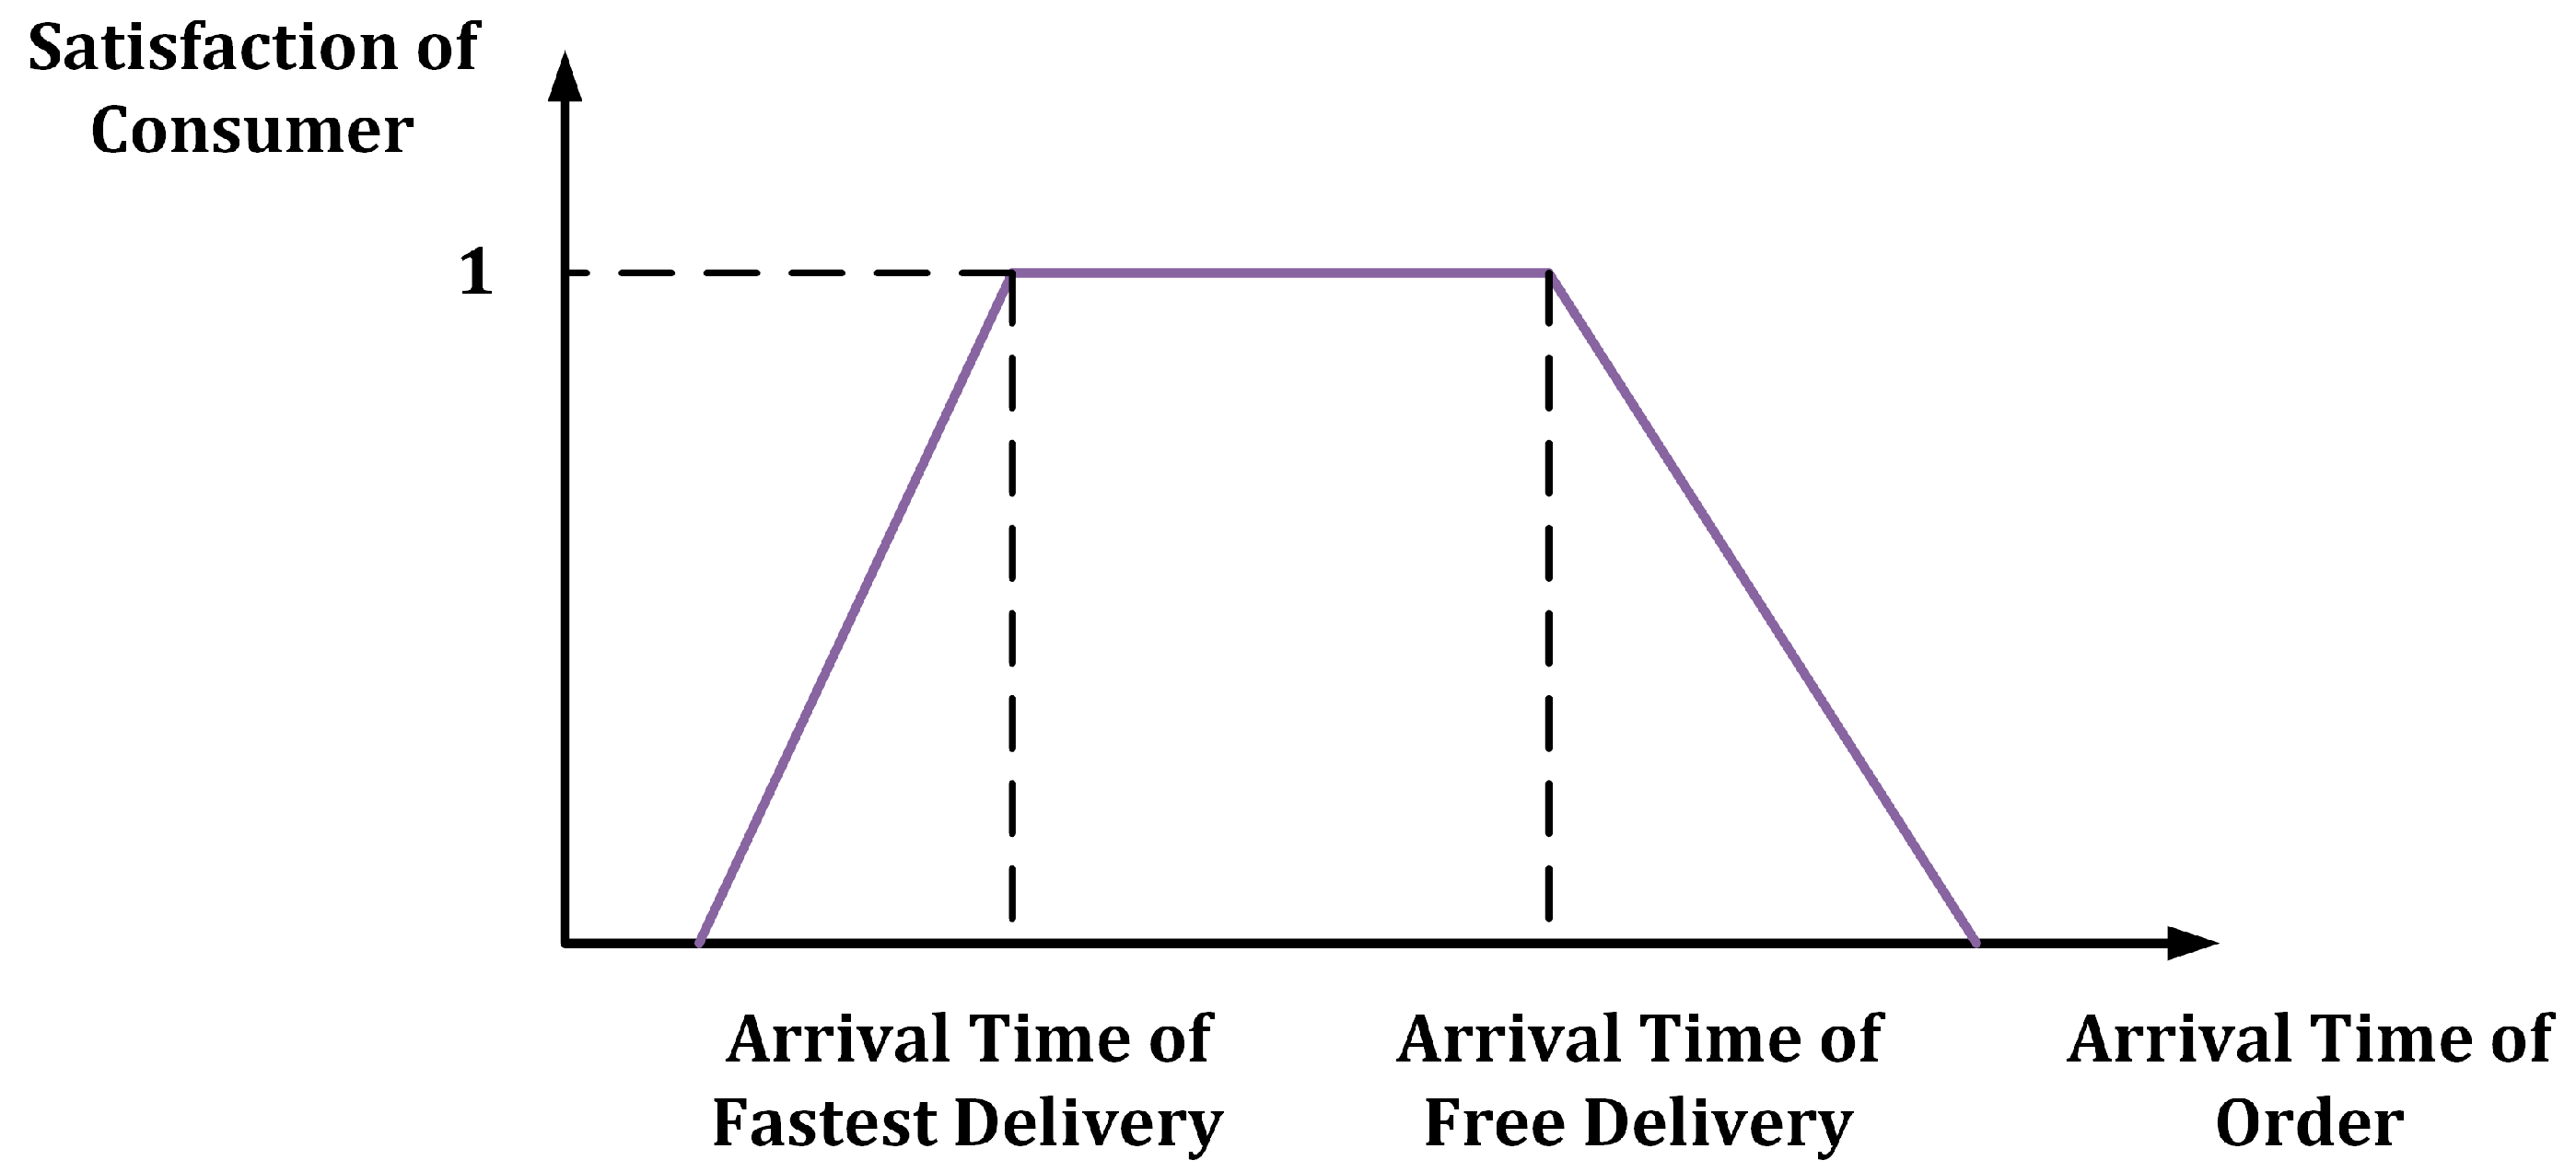
Customer satisfaction during order fulfillment is also related to shipping time. When a customer places an order, the customer’s desired delivery time interval and acceptable delivery time interval are [ T c , exp min , T c , exp max ] , [ T c , a c min , T c , a c max ] respectively. This study is based on fuzzy theory and applies fuzzy processing to the customer’s time window to accurately reflect their satisfaction level. Figure 3 shows the relationship between customer satisfaction and order completion time. In the process of fulfilling an order, if the order is completed within the expected delivery time interval [ T c , exp min , T c , exp max ] of the customer, the customer’s satisfaction level is 1; If the order is not completed within the expected delivery time interval of the customer, but is completed within the acceptable delivery time interval [ T c , a c min , T c , a c max ] of the customer, the customer’s satisfaction is calculated based on the deviation between the completion time of the order and the expected delivery time of the customer; If an order is not delivered within an acceptable time interval [ T c , a c min , T c , a c max ] of the customer, the customer’s satisfaction level is zero.
According to Figure 3, the satisfaction function of consumers is shown below.
S v p = T v p T v p , exp min T v p , a c min T v p , exp min ,    T v p , a c min T v p T v p , exp min 1 ,          T v p , exp min T v p T v p , exp max 1 T v p T v p , exp max T v p , a c max T v p , exp max ,    T v p , exp max T v p T v p , a c max 0 ,              o t h e r s ,
L 3 = V p S v p ,
T v p = α v p , p × T x , e + T s t a + d e , v p × T e , v p + T s t a + f 2 ,
f 2 = T u a v = K l k V u a v ,
T x , e = d x , e v A i r ,
T e , v p = d e , v p V v e h ,
Therefore, the objective function of this study is defined as follows.
min f = w e 1 × A 1 A 1 min A 1 max A 1 min + w e 2 × A 2 A 2 min A 2 max A 2 min + w e 3 × L 1 L 1 min L 1 max L 1 min   + w e 4 × L 2 L 2 min L 2 max L 2 min w e 5 × L 3 L 3 min L 3 max L 3 min + w e 6 × f 2 f 2 min f 2 max f 2 min ,
where w e 1 , w e 2 , w e 3 , w e 4 , w e 5 and w e 6 are the weights of the objective function components, respectively.
The constraint conditions are defined as follows.
α v p , p = V p ,
z k z k 1 b k tan λ max ,
K l k V u a v T u a v ,
l k = x k + 1 x k 2 + y k + 1 y k 2 + z k + 1 z k 2 ,
z k h l e g , k K ,
where, Formula (12) ensures that every consumer is delivered. Formula (13) limits the maximum tilt angle of the drone, b k = x k x k 1 , y k y k 1 . Formula (14) limits the flight time of the drone. Formula (16) limits the maximum altitude that the drone can fly.

4. Algorithm Design

With the escalating frequency of cross-border e-commerce logistics activities, the use of multimodal transportation modes is gaining widespread popularity. Given this trend, it is imperative that optimizers facilitating decision support for multimodal transportation in cross-border e-commerce exhibit efficient performance. In this study, we propose an enhancement strategy grounded in the SCSO algorithm to devise an optimization model for multimodal transportation in cross-border e-commerce logistics.
Before the algorithm was described, some symbol explanations used in this section were provided, as shown in Table 2.

4.1. Basic SCSO Algorithm and Its Improvement

The SCSO algorithm [36] is a meta-heuristic intelligence algorithm devised by Seyyedabbasi et al. in 2023, drawing inspiration from the hunting behavior of sand cats in their natural habitat. Sand cats possess the remarkable ability to detect sound frequencies ranging from 0 to 2 kHz, utilizing this skill to perceive prey movements, track them, and execute attacks. In the algorithmic framework, the problem to be solved is analogized to the location of the prey, while the solution corresponds to the sand cat’s location. The decision-making process of the sand cat, involving the choice between searching for prey or initiating an attack, hinges on a crucial balancing parameter denoted as R . During each iteration, the sand cat dynamically updates its position by deciding whether to search or attack, guided by the value of R .

4.1.1. Initialization of Population Individuals and Algorithm Parameters

Like numerous other intelligent optimization algorithms, the SCSO algorithm commences with population initialization, randomly generating individuals resembling sand cats within a predefined search area, as represented by Equation (17).
x i j = l o w j + r 0 ( u p j l o w j ) ,
Here, x i j represents the value of the variable in the j-th dimension for the i-th sand cat; u p j and l o w j represent the upper and lower bounds of the variable in the j-th dimension, respectively; and r 0 is a random number between 0 and 1. For the complexity of initialization, if there are n individuals in the sand cat population, each individual having m-dimensional variables, the time and space complexity of initialization are both O ( n m ) .
The SCSO algorithm is segmented into an exploration phase and a development phase, with the principal parameter governing the transition between the two being denoted as R . Assuming the sensitivity of the sand cat is represented by r G , the auditory characteristics are captured by S M , and S M typically assumes a value of 2, the formulas for r G and R during successive iterations are as follows:
r G = S M S M × I p I max ,
R = 2 r G r 0 r G ,
where I p is the current iteration number and I max is the maximum iteration number.

4.1.2. Exploration Phase

Within the exploration phase, where R possesses an absolute value greater than 1, sand cats concentrate on locating prey. This search behavior is contingent on their adeptness in detecting low-frequency noise, a crucial auditory trait modeled by the SCSO algorithm. The algorithm leverages this trait by delineating the sensitivity range of each sand cat. Throughout iterations, the sensitivity of sand cats gradually diminishes from 2 to 0 in a linear fashion. This intentional reduction facilitates their gradual approach towards prey, minimizing the risk of oversight or bypassing. In the exploration phase, sand cats update their positions based on the optimal solution, their current location and the sensitivity range, as illustrated in the subsequent update formula:
r = r G r 0 ,
x i ( I p + 1 ) = r ( x g ( I p ) r 0 x i ( I p ) ) ,
where x g ( I p ) represents the most adapted individual in the I p -th generation of the population, and finding it requires a time complexity of O ( n ) . x i ( I p ) denotes the position of the individual i in the I p -th generation, and the parameter r represents the sensitivity range of the sand cat. Within the exploration phase, the position update for each search agent is stochastically determined, enabling the search agent to explore novel regions within the search space. To prevent convergence to local optimal solutions, individual sand cats are endowed with distinct sensitivity ranges. In this phase, the overall time complexity is O ( n m I max ) , and the space complexity is O ( n m ) .

4.1.3. Development Phase

When the absolute value of R is less than or equal to 1, the sand cat initiates an action to attack the prey. During this process, a new random position, denoted as x r n d , is initially generated based on the optimal position x g ( I p ) and the current position x i ( I p ) . Visualizing the auditory sensitivity of sand cats as distributed in a circular pattern, a random angle θ is selected for each sand cat using the roulette method, and then Equation (23) is employed to execute the attack on the prey. The time and space complexity of the roulette method are O ( n ) . The introduction of such a randomized position aids the sand cat in approaching the prey, while the randomized angle serves to prevent the algorithm from prematurely converging to a local optimum solution. In the development phase, the overall time complexity is also O ( n m I max ) , and the space complexity is O ( n m ) .
x r n d = r 0 x g ( I p ) x i ( I p ) ,
x i ( I p + 1 ) = x g ( I p ) r x r n d cos ( θ ) ,

4.1.4. Algorithm Improvement

To furnish the algorithm with a high-quality initial population, accelerate convergence, and enhance solution quality, chaotic mapping is employed to initialize the positions of the search agents. Despite being a deterministic mathematical model, chaotic mapping can generate random, non-repeating sequences. Logistic mapping is the most prevalent chaotic mapping in chaotic initialization, characterized by a simple nonlinear iterative equation. Despite its simplicity, logistic mapping exhibits intricate behavior capable of generating chaotic phenomena under specific conditions. The general form of the logistic mapping is as follows:
z i j   = μ z i j ( 1 z i j ) ,
where z i 0 , 1 , μ 0 , 4 , generally taken as μ = 4 . To initialize the population of individuals using logistic chaos, we commence by randomly generating values for each dimension of the individuals within the range (0, 1). These values are subsequently input into Equation (25) to apply the logistic mapping. Finally, the rewritten Equation (17) is employed to map it back to the problem’s value space, resulting in the following process:
x i j = l o w j + z i j   ( u p j l o w j ) ,
Unlike conventional initialization methods in swarm intelligence, the chaotic initialization strategy introduces a level of randomness based on chaotic dynamics, providing a unique and nonlinear starting point for the optimization process. This would enhance exploration capabilities, allowing the algorithm to escape local optima more effectively. In logistics optimization, where complex and dynamic environments are common, this feature proves advantageous in achieving more robust solutions.
Furthermore, during the optimization process of the algorithm, we incorporate the elite retention strategy and introduce nonlinear weights to fine-tune the search and attack capabilities of the algorithm. In the SCSO algorithm, the searching and attacking abilities are contingent on the parameter R , with its associated parameter r G linearly decreasing as the number of iterations progresses, ranging from 2 to 0. However, this linear decrease alone may not effectively capture the dynamic balance of the SCSO algorithm in the searching and attacking processes. To address this, we introduce a nonlinear adjustment mechanism based on the dynamic factor ω , aiming to better control the search and attack behaviors of the algorithm and ensure an enhanced balance throughout the optimization process. The specific formula is as follows:
ω = I max I p + I max ,
r G = S M S M ω ln 1 5 I p I max ln 2 ,
The specific form of Formula (27) was derived from a thorough review of existing literature on swarm intelligence algorithms, where similar adaptation mechanisms have been successfully employed. Additionally, extensive experimentation and empirical analysis were conducted to fine-tune the parameters of the formula to ensure optimal performance across various optimization scenarios.
Deviating from conventional approaches that utilize linear or static weightings, this strategy introduces a dynamic and nonlinear adjustment mechanism for the weights associated with individual agents and generations, promoting adaptability and nuanced exploration-exploitation trade-offs. This adaptability proves beneficial in navigating the complex and dynamic nature of logistics networks, leading to improved convergence and solution quality.
From the above discussion, it can be derived that the improved SCSO algorithm has a time complexity of O ( n m I max ) and a space complexity of O ( n m ) .

4.2. Air Transportation and UAV Intermodal Transportation Based on an Improved SCSO Algorithm

4.2.1. Population Individual Coding and Algorithm Initialization

Air and road transportation form a mode of vehicular route planning where decision variables typically involve integers. To represent the planning scheme, binary coding is employed. In a specific logistics planning scenario, the task entails transporting goods by air to a designated port of entry and subsequently distributing these goods by road from the port to individual customers. The initial phase of the planning process involves assigning numerical identifiers to the ports of entry, centers, and customers, which are then converted into binary form. Subsequently, the transportation planning scheme for both air and road transport (such as I entry holds the orders from center 4, 9, 19, and 35), along with algorithmic parameters such as the number of populations and rounds of iteration, is initialized and configured.
The number of populations is set at 30. If the population size is too large, it may lead to faster convergence but slower algorithm operation. The number of iterations is set to 60. Based on the previous number of populations, the algorithm can converge after running 60 generations. Logistic chaos mapping parameters μ takes 4 since it is in a completely chaotic state at this time. u p j and l o w j for air and road transport is 1 and 0, respectively; for last-mile delivery, u p j is 4, 4 and 0.3 for x, y and z direction, l o w j is 0, 0 and 0 for x, y and z direction.
The delivery process involves the vehicle transporting goods to the centralized distribution center, followed by the collaborative efforts of a joint drone to deliver the goods from the center to the specified customer locations. Throughout this delivery task, the UAV may encounter diverse obstacles, necessitating careful consideration in its flight path planning. To simulate these obstacles, we employ models of cube and mountain peak-type 3D objects. To ensure the UAV’s ability to navigate around these obstacles, we explore algorithms for optimizing the UAV’s flight path. Typically comprised of a sequence of trajectory points, the UAV’s flight path is represented by 3D coordinates, forming an integral part of the optimization algorithm’s population of individuals.
Given the existence of a topological order between air and road transport, where the air transport scheme influences road transport, and considering the collaborative planning required for multiple port entries in road transport, we treat the transportation scheme—comprising air, road, and UAV transport—as an individual within the population. This integrated approach allows for synergistic optimization of the entire transport scheme.

4.2.2. Transportation Program Update

Upon completion of the coding for the transportation scheme, the population undergoes the exploration phase, updating the transportation scheme based on the introduced nonlinear weighting strategy Formulas (26) and (27) using Equations (20) and (21). Subsequently, the population transitions to the development phase, where the transportation scheme is further updated in accordance with Formulas (22) and (23).
The algorithm flowchart is illustrated in Figure 4.

5. Discussion

To assess the practical applicability of the proposed model and algorithms in this study, we established a real-world transportation scenario. Specifically, a supplier based in Berlin, Germany, engaged in international trade with China, has a shipment of high-value goods destined for four entry ports in China: Hong Kong, Shanghai, Tianjin, and Ningbo. Table 3 provides the latitude and longitude coordinates of these ports, along with information about the maximum carrying capacity for the goods. Upon goods reception, trucks with 4 tons of load capacity are employed to transport the goods by road based on the order quantity of surrounding centers so that their order quantities are also taken into account. Table 4 outlines details for 42 centers with demands for the goods, including latitude/longitude coordinates, order demand, desired delivery time interval [ T v p , exp min , T v p , exp max ] and acceptable delivery time interval [ T v p , a c min , T v p , a c max ] . We conducted extensive simulation studies to evaluate the performance of our proposed algorithm in various scenarios. The data collected involved assumptions and simulated parameters to model real-world international parcel delivery issues, and is referenced on the website: https://neo.lcc.uma.es/vrp/vrp-instances/ (accessed on 27 August 2023).
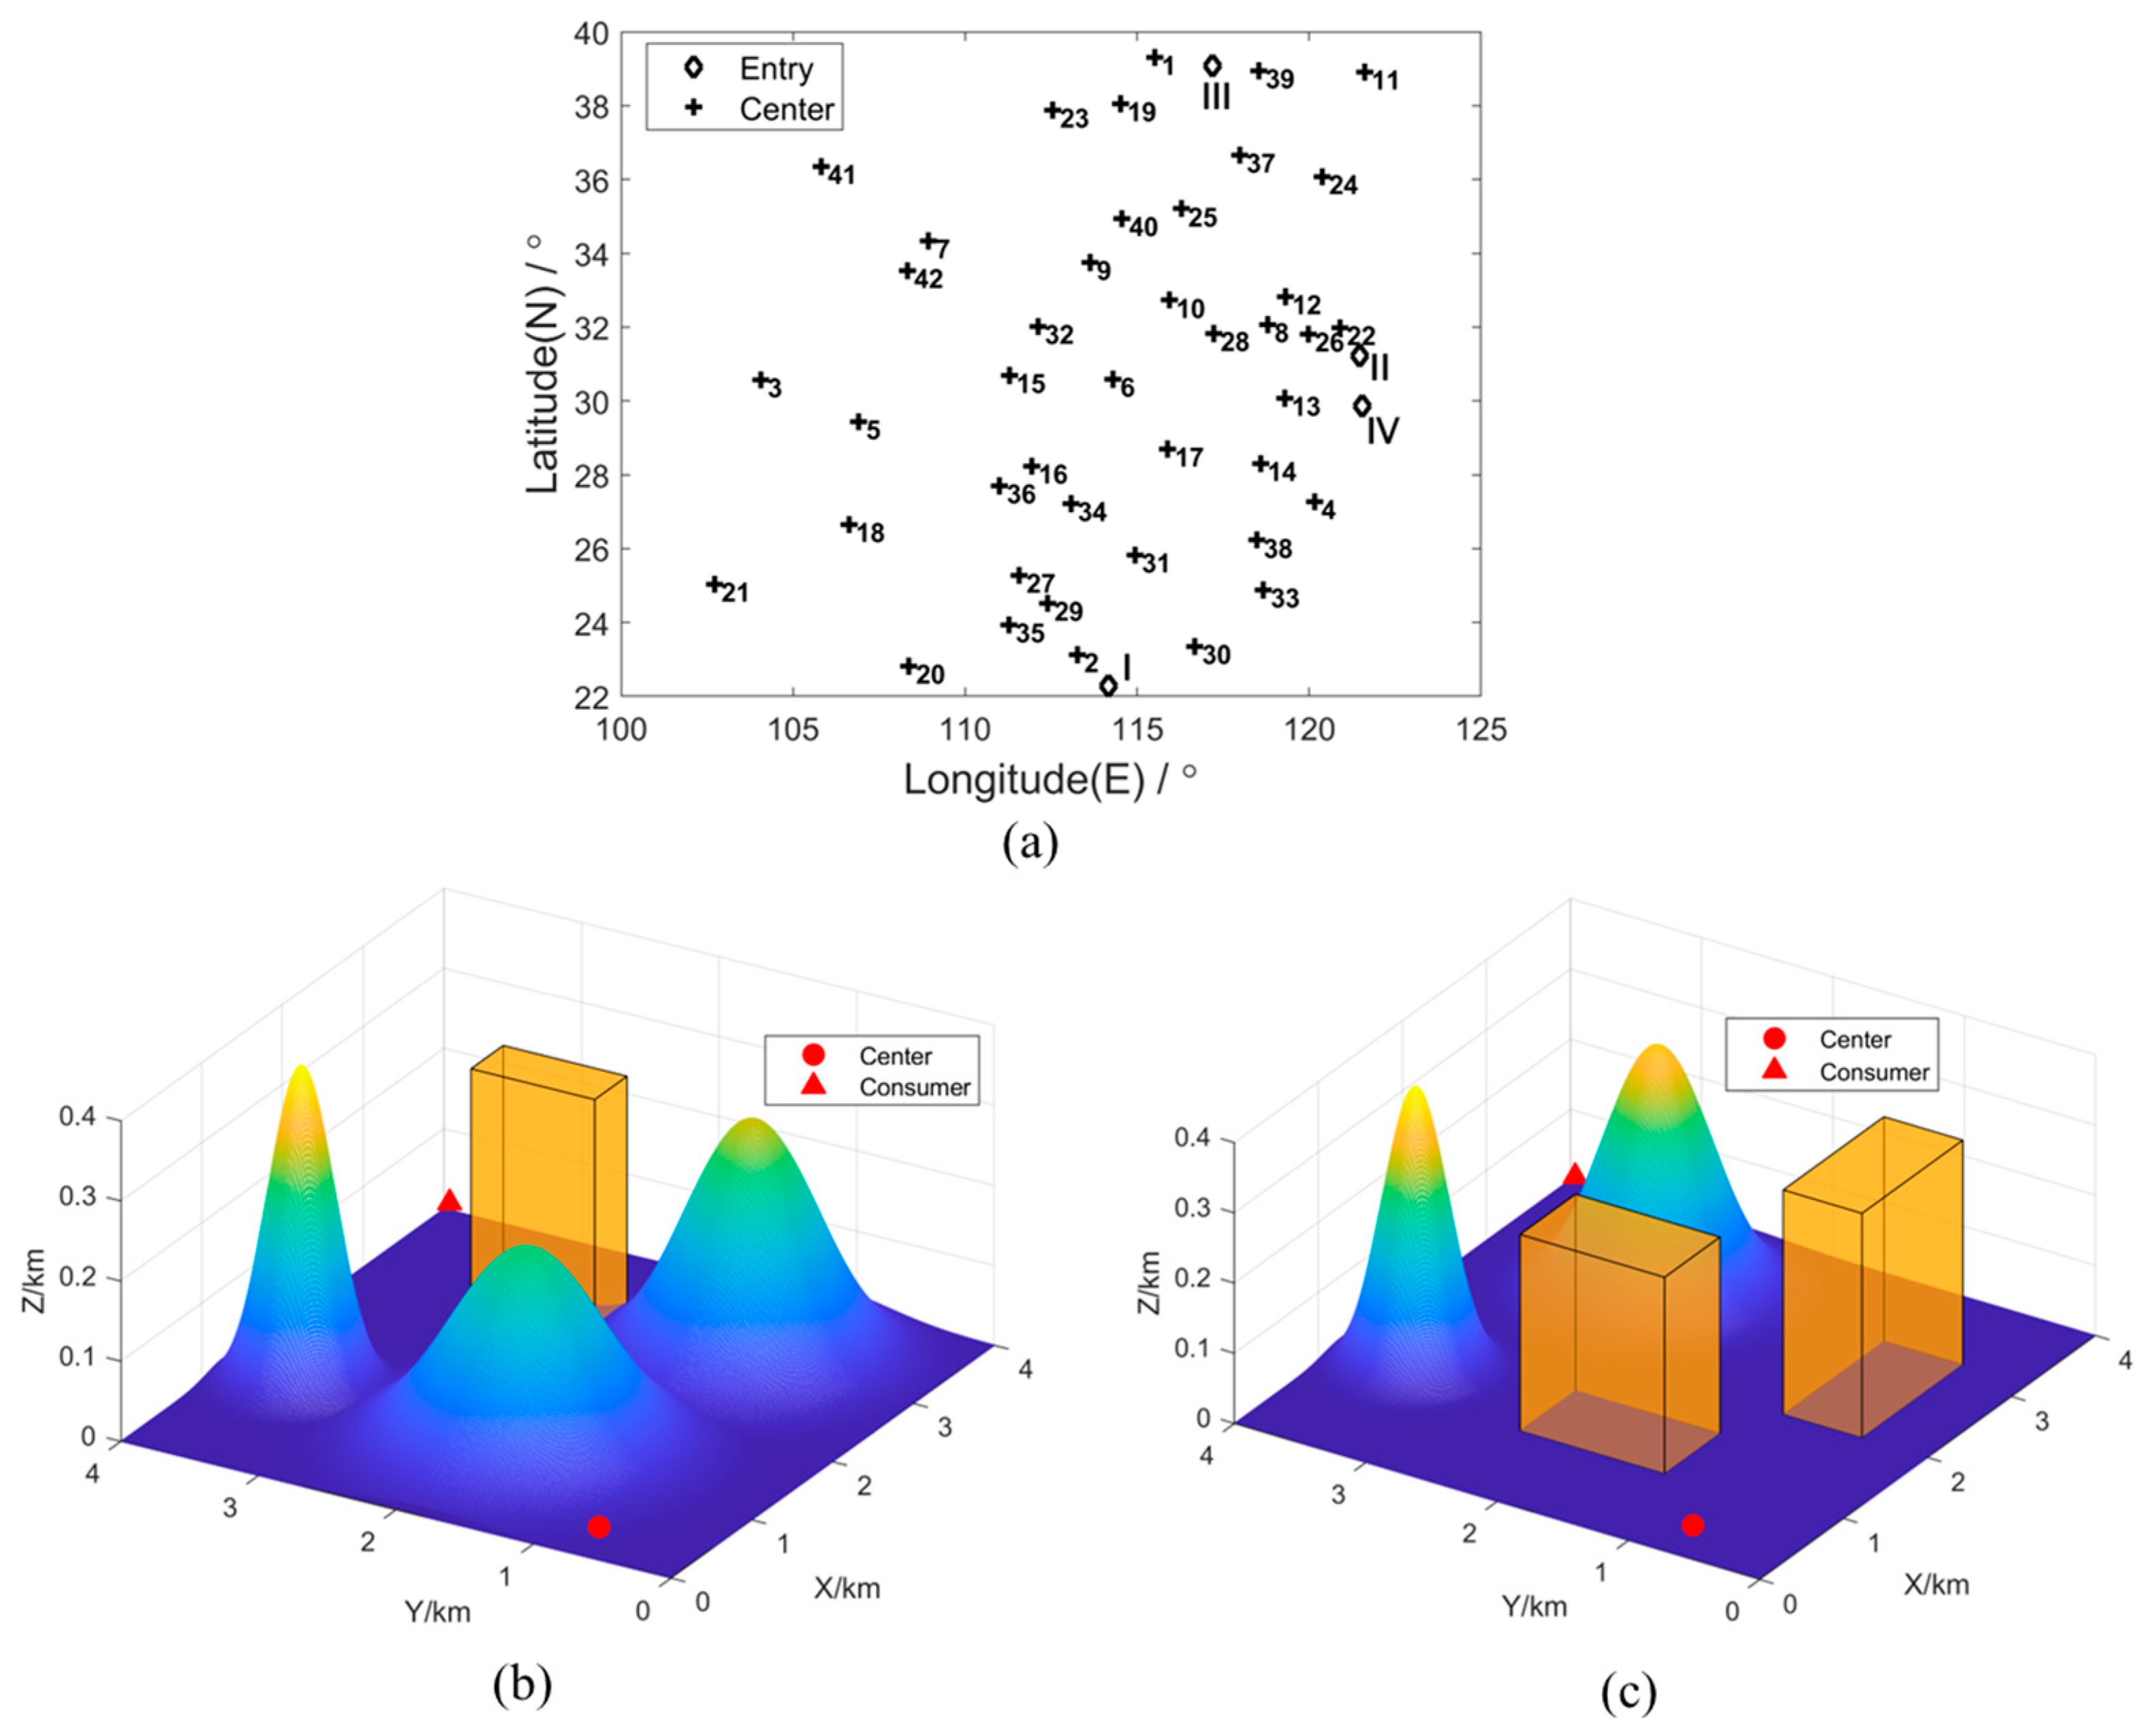
The spatial distribution of the centers and entry ports is illustrated in Figure 5a. Subsequent to goods reaching the centralized distribution center, UAVs are utilized for customer deliveries, and a 3D map depicting the route from the center to the customer is created using MATLAB R2022b, as illustrated in Figure 5b for scenario #1 and Figure 5c for scenario #2. To facilitate comparison with the improved SCSO algorithm employed in this study, we utilized the Bat Algorithm (BA) [37] and Cuckoo Search Algorithm (CSA) [38,39] to optimize the model presented in this paper.
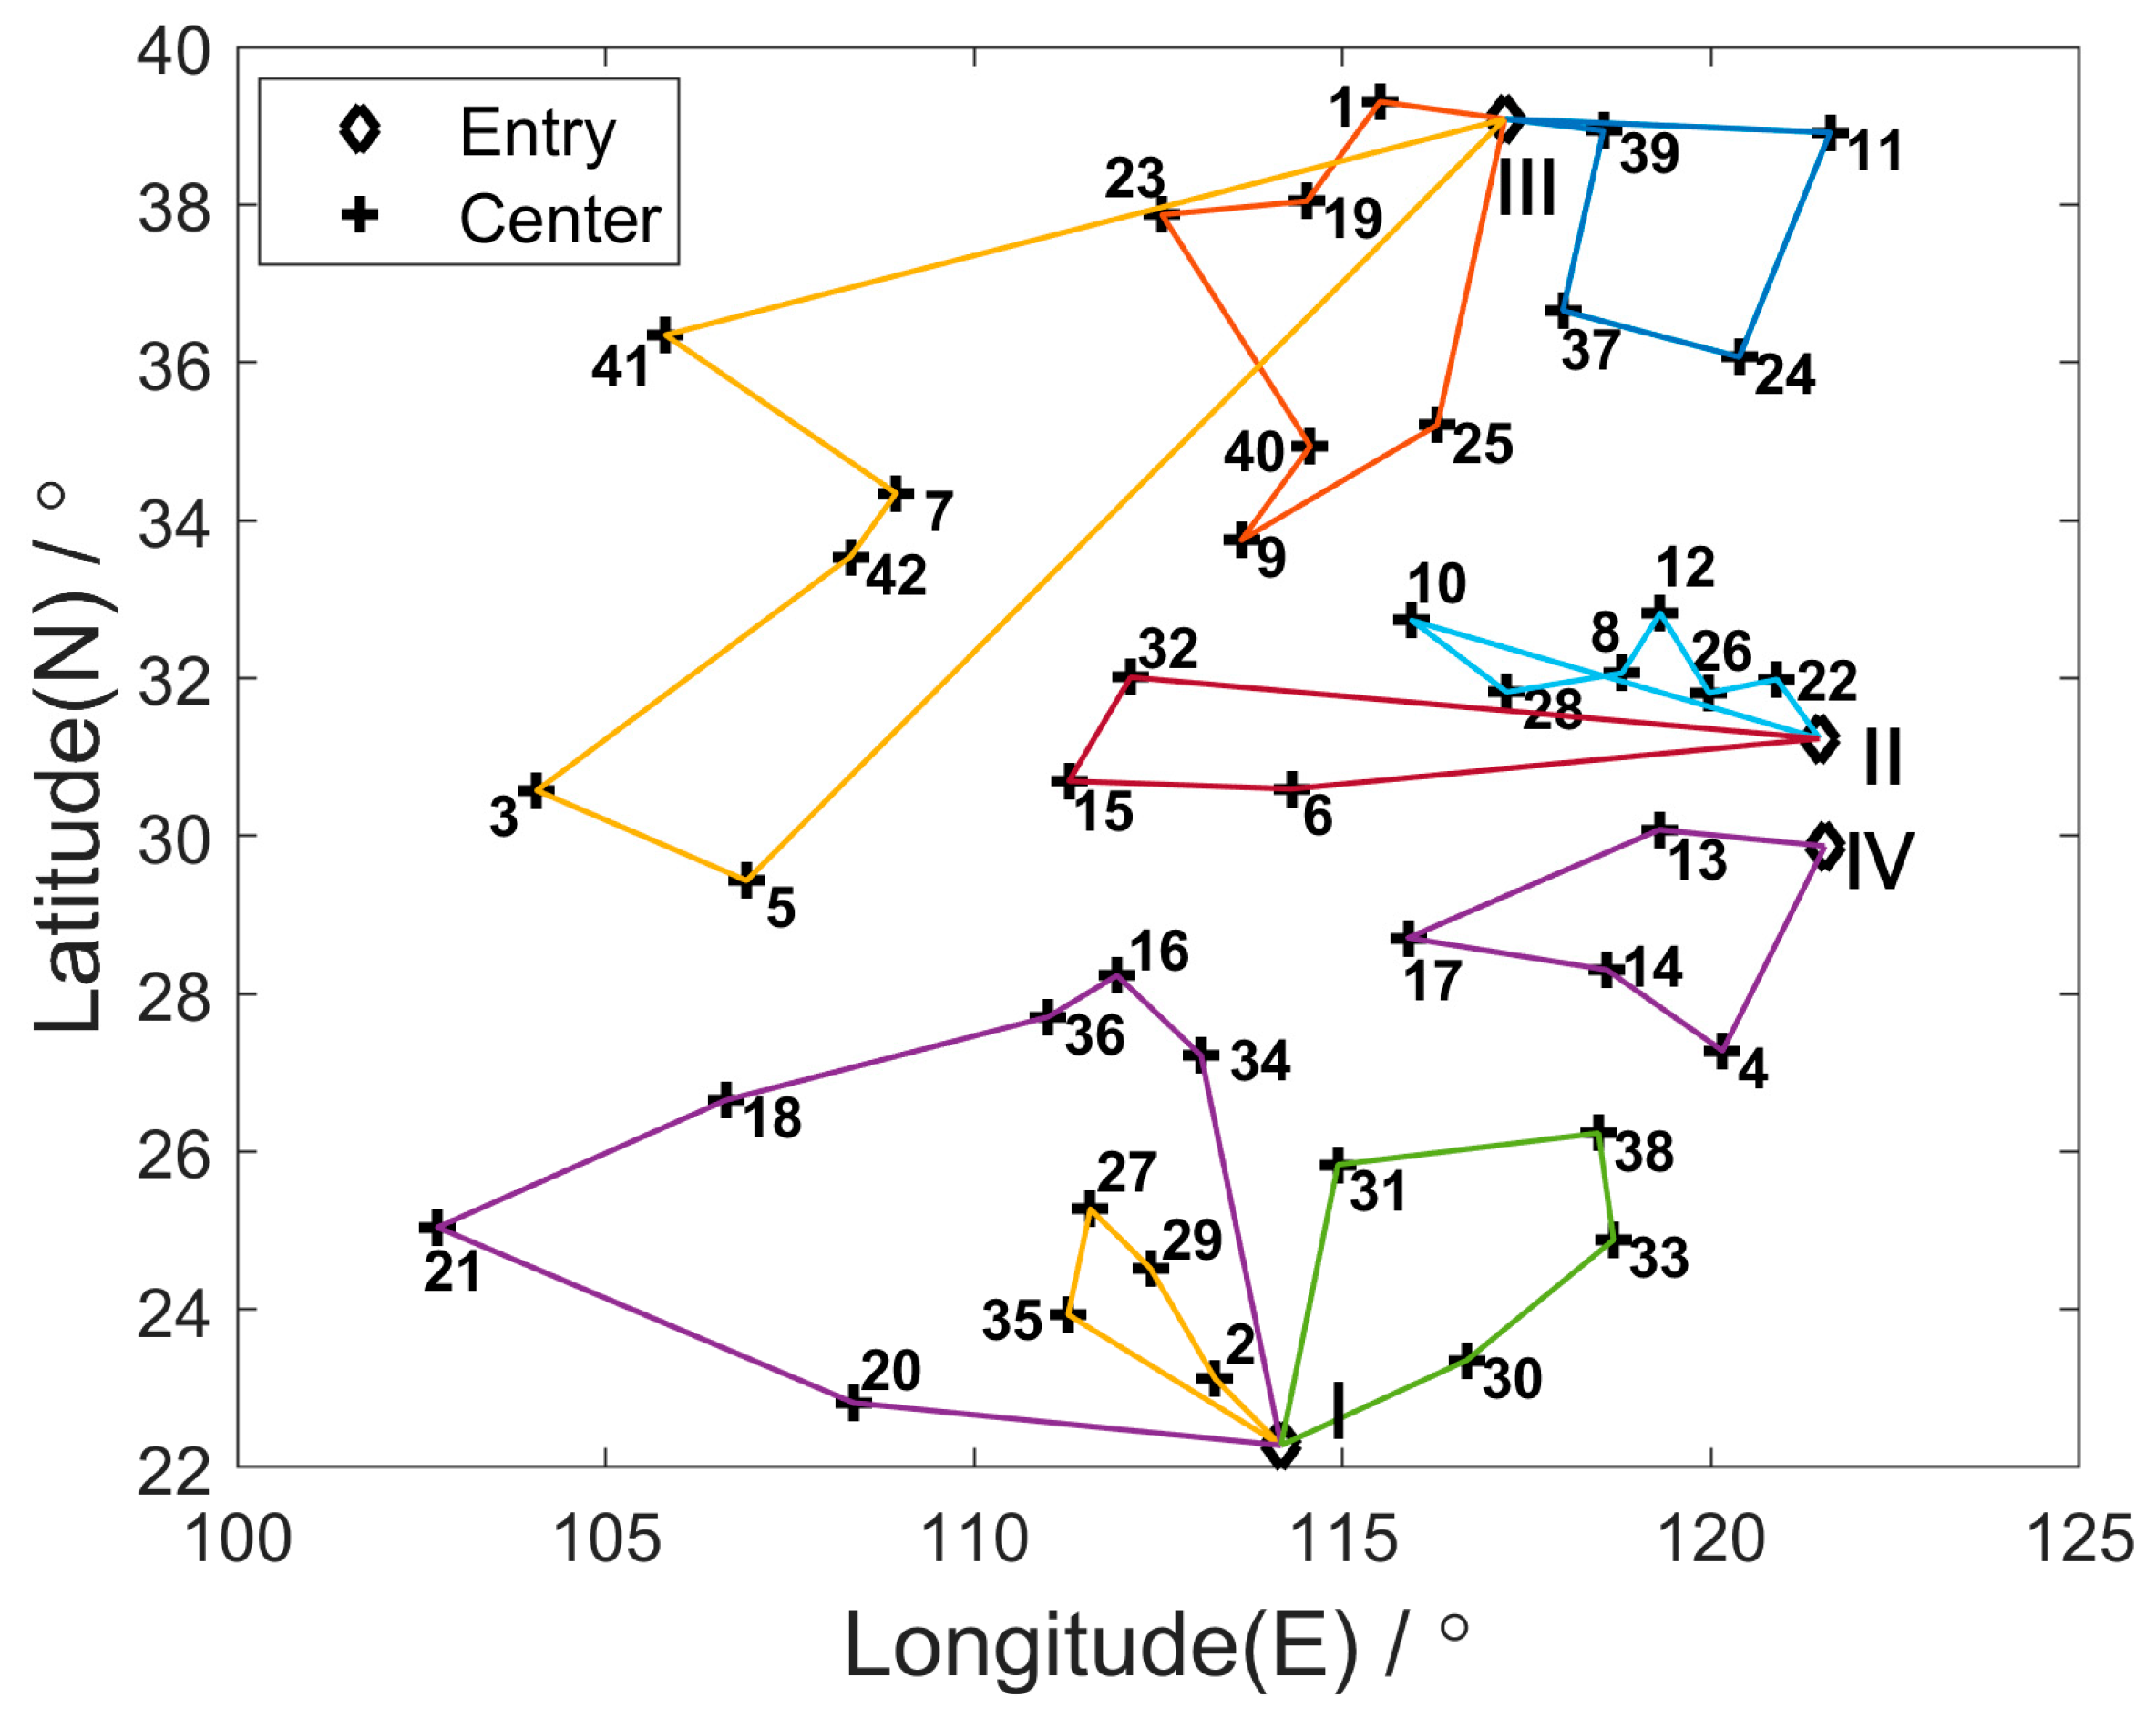
Initially, the improved SCSO algorithm is applied to optimize the road transport scheme, as depicted in Figure 6 and detailed in Table 5. Notably, Table 5 reveals that the Full Load Ratio for each planned transport route exceeds 76%, effectively utilizing the loading capacity of trucks.
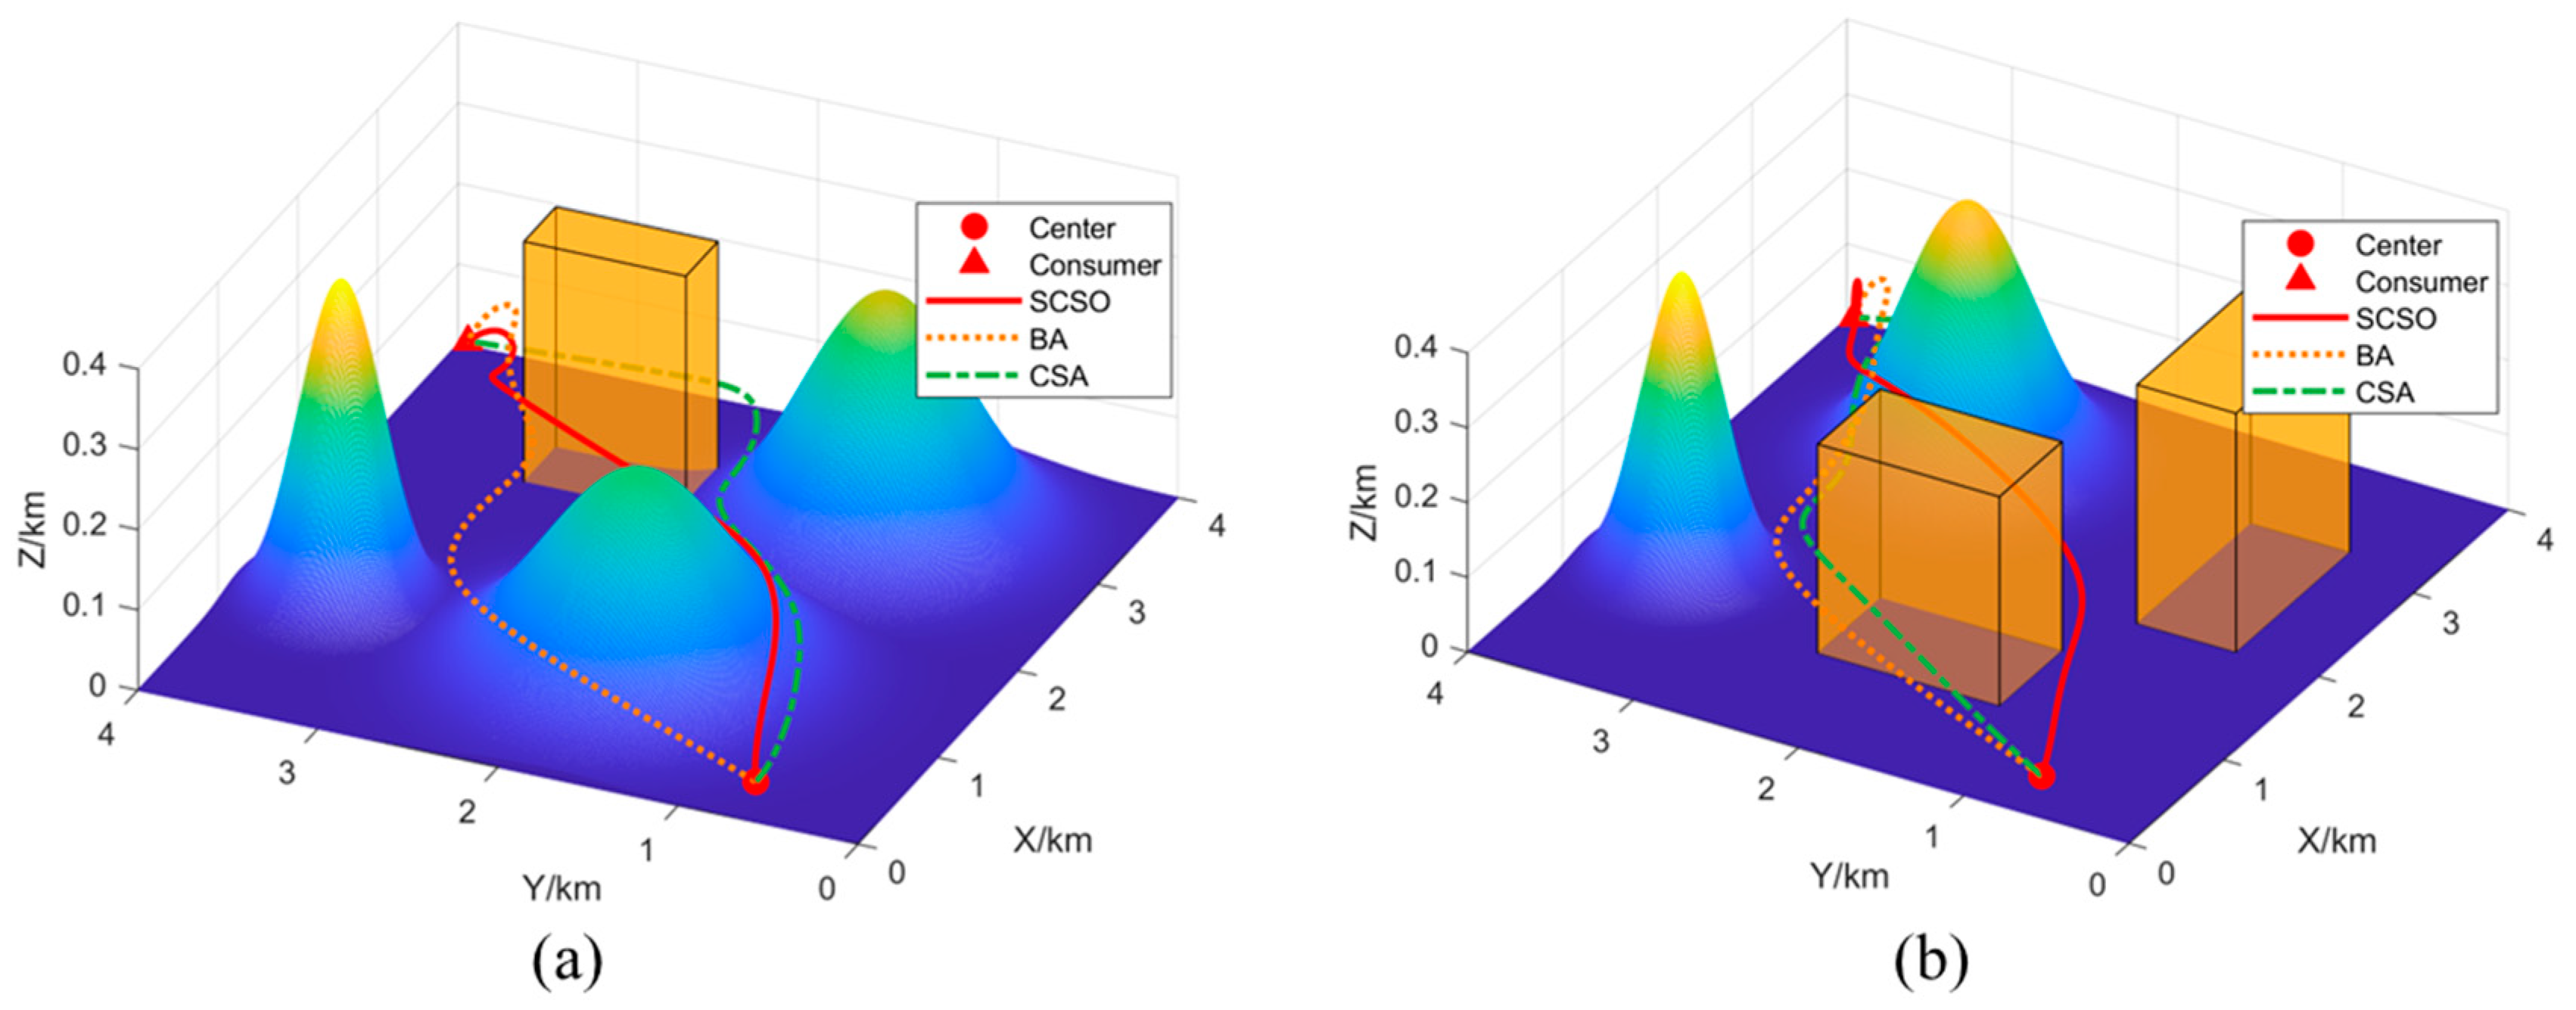
The results of obstacle avoidance route optimization in the 3D scenario from center to customer are presented in Figure 7 and Figure 8. Both the top view in Figure 7 and the 3D view in Figure 8 illustrate that all three algorithms effectively navigate around obstacles. However, the SCSO algorithm achieves a notably shorter route length. To provide a more detailed comparison of the advantages and disadvantages of the three algorithms in UAV route optimization, we calculated the route distance and detour rate, as summarized in Table 6 and Table 7. The detour rate is defined as the ratio of the detour distance to the straight-line distance between two points. In Table 6 for scenario #1, the SCSO, BA, and CSA algorithms optimize routes with distances of 5.62, 6.57, and 7.05 km and detour rates of 16.78%, 36.47%, and 46.41%, respectively. And in Table 7 for scenario #2, the SCSO, BA, and CSA algorithms optimize routes with distances of 5.66, 6.07, and 6.54 km and detour rates of 17.51%, 26.02%, and 35.78%, respectively. It is evident that the SCSO algorithm yields the shortest routes and the lowest detour rates.
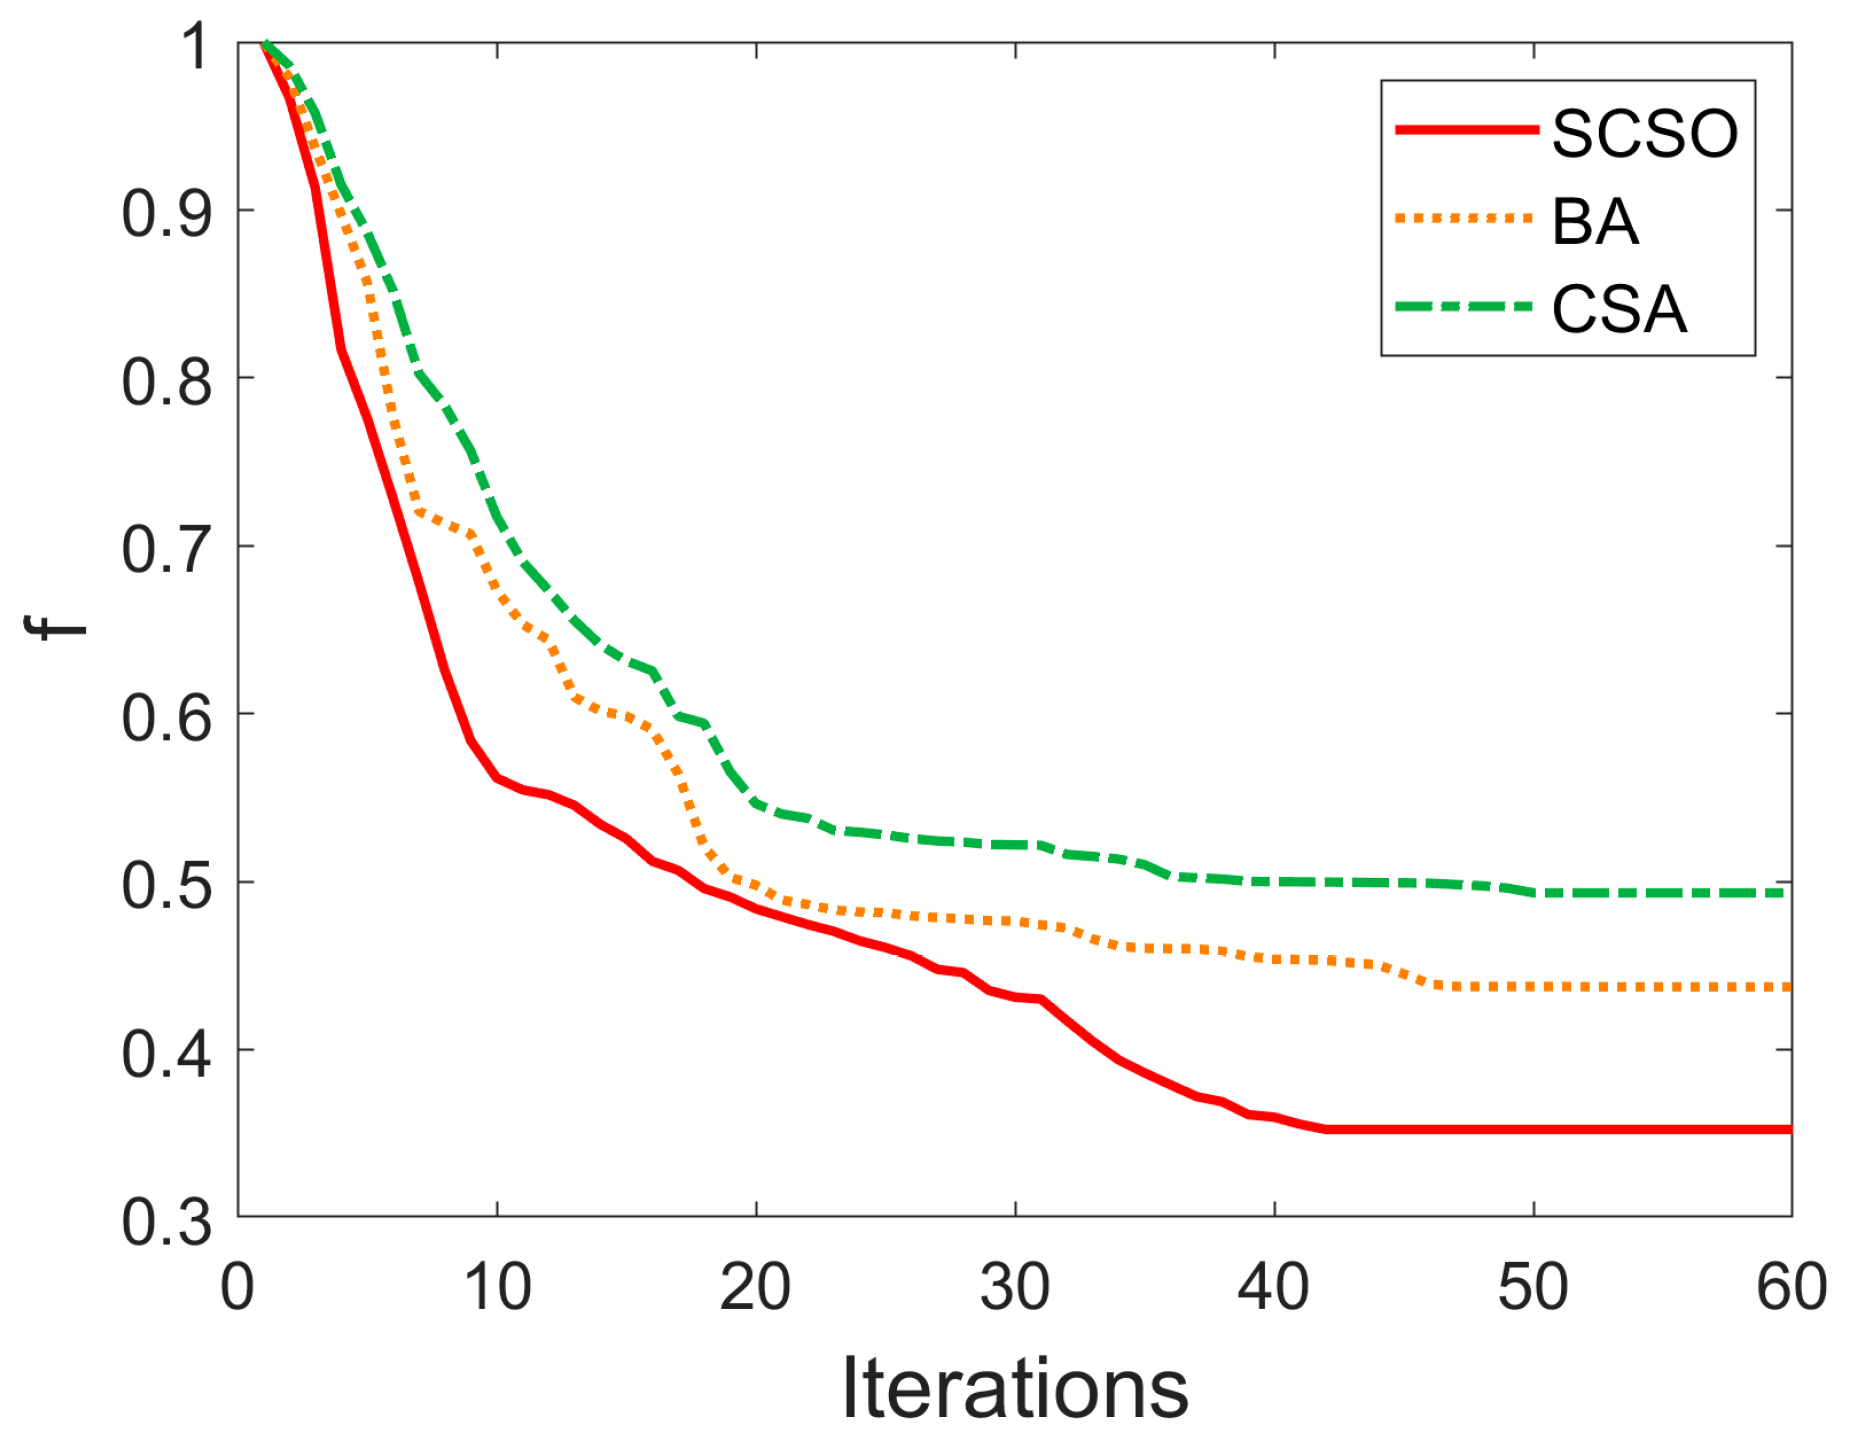
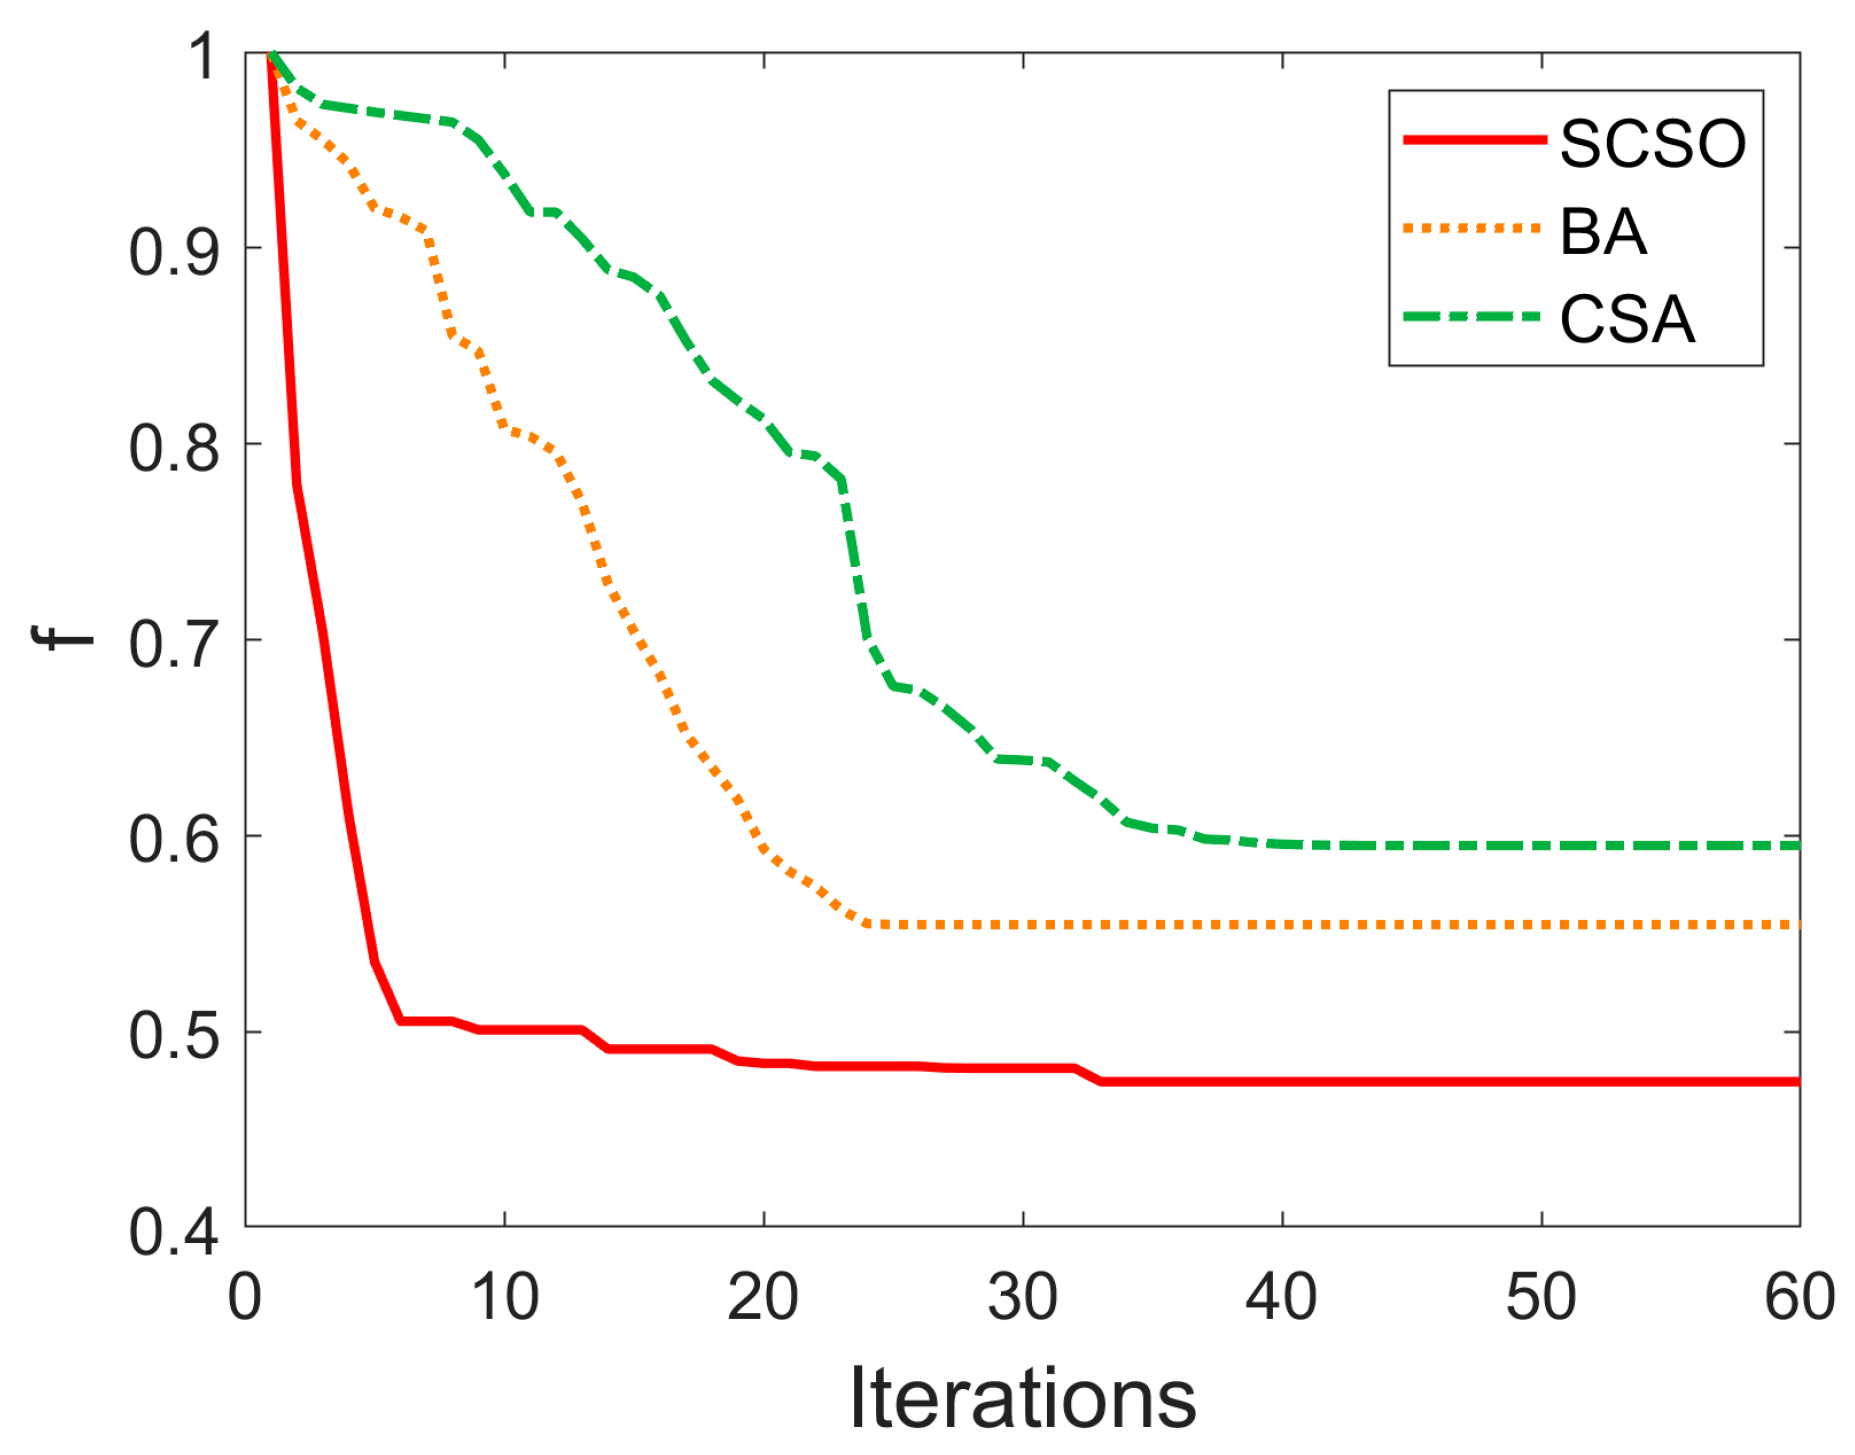
Concerning the final objective function, the normalized iterative profiles of the three algorithms are depicted in Figure 9. Notably, SCSO showcases superior global convergence, consistently yielding the smallest objective function values.
To assess the stability of the algorithms, we conducted 30 runs for each, and the average iteration curves per generation are presented in Figure 10. Once again, the SCSO algorithm demonstrates its ability to converge to lower objective function values, highlighting the robust stability of all algorithms.

6. Conclusions

In conclusion, this study addresses the increasing prominence of multimodal transportation modes in cross-border e-commerce logistics activities by constructing a logistics distribution optimization model. The formulated mathematical model, with its objective functions focused on minimizing distribution costs, reducing carbon emissions, and maximizing customer satisfaction, encapsulates the diverse considerations inherent in this dynamic field. Constraints from various dimensions, including cargo aircraft and vehicle load limitations, were comprehensively integrated into the model. To enhance the optimization process, improvement strategies were devised based on the SCSO algorithm. The resulting improved swarm intelligence algorithm proved effective in solving the proposed model.
The practical applicability of the mathematical model and the improved swarm intelligence algorithm was demonstrated through a real-world case study of cross-border e-commerce logistics transportation. The outcomes underscored the efficacy of the proposed solution. Specifically, the utilization of the proposed solution demonstrated a remarkable full load ratio exceeding 76%, indicating highly efficient utilization of transport routes. Moreover, the detour rates obtained through the SCSO algorithm, BA algorithm, and CSA algorithm revealed that the SCSO algorithm outperformed, yielding the shortest routes and the lowest detour rates. Finally, the aggregated objective function results indicate that the SCSO algorithm is effective in reducing the cost of delivery and carbon emissions, concurrently improving customer satisfaction comprehensively.
These results collectively reinforce the comprehensive benefits of the proposed approach to optimizing multimodal transportation in cross-border e-commerce, offering a robust solution that addresses logistics efficiency, environmental considerations, and customer satisfaction simultaneously.

Author Contributions

Conceptualization, J.X. and M.D.N.; methodology, J.X.; software, J.X.; validation, J.X., M.D.N. and S.Y.; investigation, S.Y.; resources, S.Y.; data curation, J.X.; writing—original draft preparation, J.X.; writing—review and editing, M.D.N. and S.Y.; visualization, J.X.; supervision, S.Y.; project administration, S.Y.; funding acquisition, S.Y. All authors have read and agreed to the published version of the manuscript.

Funding

This work is supported by Yunnan Fundamental Research Projects, grant number No. 202101AU070041.

Data Availability Statement

No new data were created or analyzed in this study. Data sharing is not applicable to this article.

Conflicts of Interest

The authors declare no conflicts of interest.

References

  1. Weck, M.; Jackson, E.B.; Sihvonen, M.; Pappel, I. Building smart living environments for ageing societies: Decision support for cross-border e-services between Estonia and Finland. Technol. Soc. 2022, 71, 102066. [Google Scholar] [CrossRef]
  2. Liu, A.; Osewe, M.; Shi, Y.; Zhen, X.; Wu, Y. Cross-Border E-Commerce Development and Challenges in China: A Systematic Literature Review. J. Theor. Appl. Electron. Commer. Res. 2022, 17, 69–88. [Google Scholar] [CrossRef]
  3. Fan, T.; Pan, Q.; Pan, F.; Zhou, W.; Chen, J. Intelligent logistics integration of internal and external transportation with separation mode. Transp. Res. Part E Logist. Transp. Rev. 2020, 133, 101806. [Google Scholar] [CrossRef]
  4. Chen, D.; Peng, S.; Lian, F.; Yang, Z. Optimization of a Japan-Europe multimodal transportation corridor. Transp. Res. Part A Policy Pract. 2023, 175, 103782. [Google Scholar] [CrossRef]
  5. Zandieh, F.; Farid Ghannadpour, S.; Mahdavi Mazdeh, M. Integrated ground vehicle and drone routing with simultaneous surveillance coverage for evading intentional disruption. Transp. Res. Part E Logist. Transp. Rev. 2023, 178, 103266. [Google Scholar] [CrossRef]
  6. Zheng, K.; Huo, X.; Jasimuddin, S.; Zhang, J.Z.; Battaïa, O. Logistics distribution optimization: Fuzzy clustering analysis of e-commerce customers’ demands. Comput. Ind. 2023, 151, 103960. [Google Scholar] [CrossRef]
  7. Zhang, C.; Tang, L.; Zhang, J.; Gou, L. Optimizing Distribution Routes for Chain Supermarket Considering Carbon Emission Cost. Mathematics 2023, 11, 2734. [Google Scholar] [CrossRef]
  8. Beck, Y.; Ljubić, I.; Schmidt, M. A survey on bilevel optimization under uncertainty. Eur. J. Oper. Res. 2023, 311, 401–426. [Google Scholar] [CrossRef]
  9. Yuen, M.; Ng, S.; Leung, M. A Competitive Mechanism Multi-Objective Particle Swarm Optimization Algorithm and Its Application to Signalized Traffic Problem. Cybern. Syst. 2021, 52, 73–104. [Google Scholar] [CrossRef]
  10. Wang, Z.; Li, Q.; Li, G.; Zhang, Q. Multi-objective decomposition evolutionary algorithm with objective modification-based dominance and external archive. Appl. Soft Comput. 2024, 149, 111006. [Google Scholar] [CrossRef]
  11. Sun, J.; Li, G.; Xu, S.X.; Dai, W. Intermodal transportation service procurement with transaction costs under belt and road initiative. Transp. Res. Part E Logist. Transp. Rev. 2019, 127, 31–48. [Google Scholar] [CrossRef]
  12. Cheah, L.; Huang, Q. Comparative Carbon Footprint Assessment of Cross-Border E-Commerce Shipping Options. Transp. Res. Rec. 2021, 2676, 584–595. [Google Scholar] [CrossRef]
  13. Giuffrida, M.; Mangiaracina, R.; Perego, A.; Tumino, A. Cross-border B2C e-commerce to China. Int. J. Phys. Distrib. Logist. Manag. 2020, 50, 355–378. [Google Scholar] [CrossRef]
  14. Yang, Y. Selection Method of Cross-Border e-Commerce Export Logistics Mode Based on Collaborative Filtering Algorithm. J. Math. 2022, 2022, 6885432. [Google Scholar] [CrossRef]
  15. Ren, S.; Choi, T.-M.; Lee, K.-M.; Lin, L. Intelligent service capacity allocation for cross-border-E-commerce related third-party-forwarding logistics operations: A deep learning approach. Transp. Res. Part E Logist. Transp. Rev. 2020, 134, 101834. [Google Scholar] [CrossRef]
  16. Teng, S. Route planning method for cross-border e-commerce logistics of agricultural products based on recurrent neural network. Soft Comput. 2021, 25, 12107–12116. [Google Scholar] [CrossRef]
  17. Dorling, K.; Heinrichs, J.; Messier, G.G.; Magierowski, S. Vehicle Routing Problems for Drone Delivery. IEEE Trans. Syst. Man Cybern. Syst. 2017, 47, 70–85. [Google Scholar] [CrossRef]
  18. Cho, Y.H.; Baek, D.; Chen, Y.; Jung, M.J.; Vinco, S.; Macii, E.; Poncino, M. Multi-Criteria Coordinated Electric Vehicle-Drone Hybrid Delivery Service Planning. IEEE Trans. Veh. Technol. 2023, 72, 5892–5905. [Google Scholar] [CrossRef]
  19. Goodchild, A.; Toy, J. Delivery by drone: An evaluation of unmanned aerial vehicle technology in reducing CO2 emissions in the delivery service industry. Transp. Res. Part D Transp. Environ. 2018, 61, 58–67. [Google Scholar] [CrossRef]
  20. Zhang, S.; Liu, S.; Xu, W.; Wang, W. A novel multi-objective optimization model for the vehicle routing problem with drone delivery and dynamic flight endurance. Comput. Ind. Eng. 2022, 173, 108679. [Google Scholar] [CrossRef]
  21. Karak, A.; Abdelghany, K. The hybrid vehicle-drone routing problem for pick-up and delivery services. Transp. Res. Part C Emerg. Technol. 2019, 102, 427–449. [Google Scholar] [CrossRef]
  22. Morim, A.; Campuzano, G.; Amorim, P.; Mes, M.; Lalla-Ruiz, E. The drone-assisted vehicle routing problem with robot stations. Expert Syst. Appl. 2024, 238, 121741. [Google Scholar] [CrossRef]
  23. Schermer, D.; Moeini, M.; Wendt, O. A hybrid VNS/Tabu search algorithm for solving the vehicle routing problem with drones and en route operations. Comput. Oper. Res. 2019, 109, 134–158. [Google Scholar] [CrossRef]
  24. Zhang, J.; Li, Y. Collaborative vehicle-drone distribution network optimization for perishable products in the epidemic situation. Comput. Oper. Res. 2023, 149, 106039. [Google Scholar] [CrossRef]
  25. Ma, S.; Liu, H.; Pan, N.; Wang, S. Study on an autonomous distribution system for smart parks based on parallel system theory against the background of Industry 5.0. J. King Saud Univ. Comput. Inf. Sci. 2023, 35, 101608. [Google Scholar] [CrossRef]
  26. Liu, H.; Tsang, Y.P.; Lee, C.K.M. A cyber-physical social system for autonomous drone trajectory planning in last-mile superchilling delivery. Transp. Res. Part C Emerg. Technol. 2024, 158, 104448. [Google Scholar] [CrossRef]
  27. Quan, L.; Han, L.; Zhou, B.; Shen, S.; Gao, F. Survey of UAV motion planning. IET Cyber-Syst. Robot. 2020, 2, 14–21. [Google Scholar] [CrossRef]
  28. Zhao, Y.; Zheng, Z.; Liu, Y. Survey on computational-intelligence-based UAV path planning. Knowl.-Based Syst. 2018, 158, 54–64. [Google Scholar] [CrossRef]
  29. Zhu, B.; Bedeer, E.; Nguyen, H.H.; Barton, R.; Gao, Z. UAV Trajectory Planning for AoI-Minimal Data Collection in UAV-Aided IoT Networks by Transformer. IEEE Trans. Wirel. Commun. 2023, 22, 1343–1358. [Google Scholar] [CrossRef]
  30. Liu, K.; Zheng, J. UAV Trajectory Planning with Interference Awareness in UAV-Enabled Time-Constrained Data Collection Systems. IEEE Trans. Veh. Technol. 2023, 73, 2799–2815. [Google Scholar] [CrossRef]
  31. Sonny, A.; Yeduri, S.R.; Cenkeramaddi, L.R. Autonomous UAV Path Planning Using Modified PSO for UAV-Assisted Wireless Networks. IEEE Access 2023, 11, 70353–70367. [Google Scholar] [CrossRef]
  32. Liu, H.; Sun, Y.; Cao, J.; Chen, S.; Pan, N.; Dai, Y.; Pan, D. Study on UAV Parallel Planning System for Transmission Line Project Acceptance Under the Background of Industry 5.0. IEEE Trans. Ind. Inform. 2022, 18, 5537–5546. [Google Scholar] [CrossRef]
  33. Wang, C.; Zhang, L.; Gao, Y.; Zheng, X.; Wang, Q. A Cooperative Game Hybrid Optimization Algorithm Applied to UAV Inspection Path Planning in Urban Pipe Corridors. Mathematics 2023, 11, 3620. [Google Scholar] [CrossRef]
  34. Aljalaud, F.; Kurdi, H.; Youcef-Toumi, K. Autonomous Multi-UAV Path Planning in Pipe Inspection Missions Based on Booby Behavior. Mathematics 2023, 11, 2092. [Google Scholar] [CrossRef]
  35. Kong, F.; Wang, Q.; Gao, S.; Yu, H. B-APFDQN: A UAV Path Planning Algorithm Based on Deep Q-Network and Artificial Potential Field. IEEE Access 2023, 11, 44051–44064. [Google Scholar] [CrossRef]
  36. Seyyedabbasi, A.; Kiani, F. Sand Cat swarm optimization: A nature-inspired algorithm to solve global optimization problems. Eng. Comput. 2023, 39, 2627–2651. [Google Scholar] [CrossRef]
  37. Yang, X.S. A New Metaheuristic Bat-Inspired Algorithm. Stud. Comput. Intell. 2010, 284, 65–74. [Google Scholar] [CrossRef]
  38. Caselli, N.; Soto, R.; Crawford, B.; Valdivia, S.; Olivares, R. A Self-Adaptive Cuckoo Search Algorithm Using a Machine Learning Technique. Mathematics 2021, 9, 1840. [Google Scholar] [CrossRef]
  39. Liu, H.; Sun, Y.; Pan, N.; Chen, Q.; Guo, X.; Pan, N. Multi-UAV Cooperative Task Planning for Border Patrol based on Hierarchical Optimization. J. Imaging Sci. Technol. 2021, 65, jist1082. [Google Scholar] [CrossRef]
Figure 1. Order page from a cross-border e-commerce platform (Amazon).
Mathematics 12 00763 g001
Figure 2. The process of fulfilling orders on cross-border e-commerce platforms.
Mathematics 12 00763 g002
Figure 3. Consumer satisfaction curve.
Mathematics 12 00763 g003
Figure 4. Algorithm flow chart.
Mathematics 12 00763 g004
Figure 5. Scene diagram for simulation: (a) Distribution map of 4 entries and 42 centers; (b) Scenario #1 of 3D map from center to customer; (c) Scenario #2 of 3D map from center to customer.
Mathematics 12 00763 g005
Figure 6. Delivery route map from 4 entries to 42 centers.
Mathematics 12 00763 g006
Figure 7. Top view of a UAV flight route optimized using SCSO, BA, and CSA algorithms for (a) scenario #1 and (b) scenario #2.
Mathematics 12 00763 g007
Figure 8. A three-dimensional view of the UAV flight route optimized using SCSO, BA, and CSA algorithms for (a) scenario #1 and (b) scenario #2.
Mathematics 12 00763 g008
Figure 9. Iterative curve of the total objective function value optimized using SCSO, BA, and CSA algorithms.
Mathematics 12 00763 g009
Figure 10. Iterative curve of the average total objective function value optimized using SCSO, BA, and CSA algorithms in 100 repeated runs.
Mathematics 12 00763 g010
Table 1. Symbol description.
SymbolDescription
P e The set of ports of entry, P e = 1 , 2 , , P e
V p The set of vehicle parking points, V p = 1 , 2 , , V p
P x The port of exit
C a The transportation cost coefficient of air transportation (CNY/km)
C h The transportation cost coefficient of highway transportation (CNY/km)
T x , e The time between the exit port and the entry port (h)
d x , e Flight distance between the exit port and the entry port (km)
v A i r The average flight speed of cargo aircraft (km/h)
T e , v p The time between the port of entry (vehicle stop) and the vehicle stop (h)
d e , v p The distance traveled by vehicles between the port of entry (or vehicle stop) and the vehicle stop (km)
V v e h The average speed of a vehicle (km/h)
T v The set of freight vehicles, T v = 1 , 2 , , T v
η i Utilization rate of freight vehicle i T v
w max The maximum loading weight of a freight vehicle (t)
T s t a Unloading time (h)
w v p The weight of the order required for the vehicle parking point v p V p
α v p , p The orders required for the vehicle parking point v p V p is transported by the supplier to the port of entry p P e , α v p , p 0 , 1
v p , t v The orders required for the vehicle parking point v p V p is transported by the freight vehicle i T v , v p , t v 0 , 1
λ max The maximum tilt angle of the drone (deg)
T u a v The maximum flight time of a drone (s)
V u a v The flying speed of drones (m/s)
C O a i r The greenhouse gas emissions of a cargo plane carrying one ton of cargo and flying one kilometer, with a specific value of 531 gCO 2 e / t km .
C o h The greenhouse gas emissions of a cargo plane carrying one ton of cargo and driving one kilometer, C o h = 106 gCO 2 e / t km .
K The set of trajectory points of the UAV, K = 1 , 2 , , K .
x k , y k , z k The coordinates of the drone’s trajectory point k , k K .
h l e g The maximum flying altitude of the drone (m).
[ T v p , exp min , T v p , exp max ] The expected time interval for order arrival at the vehicle parking point v p V p
[ T v p , a c min , T v p , a c max ] The time interval for the arrival of orders accepted by the vehicle parking point v p V p
Table 2. Symbol description for algorithm.
SymbolDescription
R Balancing parameter for SCSO
x i j The value of the variable in the j-th dimension for the i-th sand cat
u p j Upper bounds of the variable in the j-th dimension
l o w j Lower bounds of the variable in the j-th dimension
r 0 A random number between 0 and 1
n Number of the sand cat
m Number of dimensions of individual variables
r G The sensitivity of the sand cat
S M The auditory characteristics of the sand cat
I p The current iteration number
I max The maximum iteration number
x g ( I p ) The most adapted individual in the I p -th generation of the population
x i ( I p ) The position of the individual i in the I p -th generation
μ Logistic chaos mapping parameters
Table 3. The details of entry ports in the simulations.
Entry IDEntry NameLongitude (E)/°Latitude (N)/°Maximum Carrying Capacity/t
IHong Kong114.1722.2812
IIShanghai121.4731.2310
IIITianjin117.2039.0812
IVNingbo121.5429.879
Table 4. The details of Amazon operations centers in the simulations.
Center IDDemand/t T v p , a c min /h T v p , a c max /h T v p , exp min /h T v p , exp max Longitude (E)/°Latitude (N)/°
10.39 12.05 34.53 15.57 29.56 115.51 39.30
21.19 10.56 33.92 13.39 22.87 113.26 23.13
30.62 25.66 61.13 31.98 53.60 104.07 30.57
40.72 20.77 72.33 23.01 48.12 120.16 27.27
50.67 27.09 73.17 34.41 51.85 106.91 29.43
61.13 24.98 52.58 33.04 47.61 114.31 30.59
70.76 25.96 73.04 32.79 53.90 108.94 34.34
80.52 23.16 71.83 27.03 36.49 118.79 32.06
91.28 24.74 71.94 31.54 47.49 113.63 33.75
100.53 28.42 72.13 33.23 49.50 115.94 32.73
110.48 17.17 70.82 35.37 46.86 121.61 38.91
120.88 19.10 64.13 23.14 38.99 119.31 32.82
131.20 15.25 42.01 19.59 32.98 119.30 30.07
140.59 22.04 73.03 32.87 50.15 118.59 28.30
151.13 23.11 70.72 31.82 49.55 111.29 30.69
160.37 19.51 50.39 31.51 43.48 111.94 28.23
170.53 21.29 71.86 31.56 46.87 115.89 28.70
180.20 22.79 71.62 30.24 49.80 106.63 26.65
190.46 21.82 73.79 31.36 48.79 114.51 38.04
200.95 21.40 72.91 30.43 48.01 108.37 22.82
210.78 22.73 72.81 31.27 50.87 102.72 25.04
220.53 18.17 39.83 22.23 36.26 120.89 31.98
230.69 28.03 70.55 32.35 48.31 112.55 37.87
240.85 21.03 72.30 31.57 46.48 120.38 36.07
250.32 29.45 71.48 31.69 47.64 116.28 35.20
260.85 12.88 33.94 19.07 27.58 119.97 31.81
270.82 19.64 74.01 32.92 49.79 111.58 25.27
280.51 22.14 71.13 34.56 48.82 117.23 31.82
290.80 16.80 43.31 19.24 36.10 112.39 24.52
301.25 17.17 54.09 21.43 48.30 116.68 23.35
310.59 24.48 52.48 33.20 37.28 114.94 25.83
321.16 24.86 74.44 31.51 48.12 112.12 32.01
330.67 25.90 73.59 28.44 48.43 118.68 24.88
341.07 19.62 72.32 27.31 45.20 113.08 27.21
350.50 22.25 73.32 28.57 48.36 111.28 23.93
360.48 18.51 72.29 31.53 49.86 111.00 27.70
370.93 22.65 71.38 30.76 47.78 117.99 36.65
380.75 26.85 72.54 30.56 51.14 118.47 26.23
390.98 26.15 72.05 32.08 49.12 118.54 38.94
400.59 27.86 71.45 30.68 47.16 114.56 34.94
410.75 24.50 74.66 30.74 57.69 105.81 36.35
421.14 17.53 72.33 33.22 58.45 108.32 33.54
Table 5. Delivery details from 4 entries to 42 centers.
Entry IDPathLoad/tFull Load Ratio/%
I2→29→27→353.3182.75
20→21→18→36→16→343.8596.25
30→33→38→313.2681.50
II22→26→12→8→28→103.8295.50
6→15→323.4285.50
III39→37→24→113.2481.00
1→19→23→40→9→253.7393.25
41→7→42→3→53.9498.50
IV13→17→14→43.0476.00
Table 6. The optimized flight distance and detour rate of the UAV using SCSO, BA, and CSA algorithms for scenario #1.
AlgorithmDistance/kmDetour Rate/%
SCSO5.62 16.78
BA6.57 36.47
CSA7.05 46.41
Table 7. The optimized flight distance and detour rate of the UAV using SCSO, BA, and CSA algorithms for scenario #2.
AlgorithmDistance/kmDetour Rate/%
SCSO5.66 17.51
BA6.07 26.02
CSA6.54 35.78
Disclaimer/Publisher’s Note: The statements, opinions and data contained in all publications are solely those of the individual author(s) and contributor(s) and not of MDPI and/or the editor(s). MDPI and/or the editor(s) disclaim responsibility for any injury to people or property resulting from any ideas, methods, instructions or products referred to in the content.

