Abstract
The reliability growth of electromechanical products is a continuous process of addressing reliability defects, which is very important for manufacturing enterprises. At present, research on the reliability growth of electromechanical products mostly focuses on the reliability defects of the products themselves, ignoring the fact that manufacturing enterprises are the executors of product reliability related work. Improving the organizational reliability capability of manufacturing enterprises can enhance the reliability of electromechanical products. In order to understand the current situation of organizational reliability capability (ORC) in electromechanical product manufacturing enterprises and make improvements, this paper establishes an ORC evaluation indicator framework for electromechanical product manufacturing enterprises and evaluates it using the grey evaluation method. Firstly, an evaluation indicator framework for ORC is established based on enterprise research. Secondly, the ORC of electromechanical product manufacturing enterprises is evaluated by combining the three-parameter interval grey number and projection index function. Then, the evaluation results are analyzed from multiple perspectives to understand the current situation and shortcomings of ORC and guide its improvement. Finally, the evaluation indicator framework and method are explained through practical application in CNC machine tool manufacturing enterprises, and the effectiveness of the framework and method is demonstrated through the MTBF growth of CNC machine tools.
Keywords:
organizational reliability capability; evaluation indicators system; three-parameter interval grey number; fuzzy evaluation; projection index function MSC:
28E10
1. Introduction
The quality of electromechanical products is directly related to the national economy and people’s livelihood, and product quality issues cause huge direct and indirect economic losses to the world every year. Reliability is a key quality characteristic of a product, and the growth of product reliability is crucial for enhancing enterprises’ market competitiveness, and reducing product maintenance time and economic costs. Generally, the reliability of a product depends on the combined effects of its design, manufacturing, testing, and other processes. At present, many scholars are conducting research on the reliability growth of products. In existing studies, scholars focus on reliability analysis, reliability optimization and other aspects of product reliability growth research. These studies mostly focus on the reliability of the product itself or a certain link in its lifecycle, and few studies study the reliability growth of products from the perspective of enterprises.
In IEEE Standard 1624-2008 [1], the organizational reliability capability (ORC) of enterprises is proposed and defined as the ability to organize reliability assurance work in order to ensure that product reliability meets or exceeds customer requirements. The ultimate effect of product design, manufacturing, and other processes is determined by the ORC of the enterprise. Therefore, improving the ORC can achieve the growth of product reliability.
Improving ORC has a positive impact on product reliability growth, and identifying weak links in ORC is the basis for ORC improvement decisions. To find out the weak links of the ORC, this paper tries to establish an ORC’s evaluation indicators framework and evaluate the ORC on the basis of the evaluation indicators. However, the ORC evaluation index system mentioned in IEEE Standard 1624-2008 [1] is quite complex, making it difficult for manufacturing enterprises to use. Therefore, to establish an ORC evaluation framework suitable for local electromechanical product manufacturing enterprises (hereinafter referred to as manufacturing enterprises), a local enterprise investigation is carried out, and the ORC composition is determined on the basis of the investigation and “8341” reliability methodology [2] which divided the reliability assurance capability into four aspects: design analysis, control, test improvement, and management assurance. Then, a general framework of ORC’s characteristic indicators is established as its evaluation indicators system based on the composition of ORC. At last, the grey evaluation method is used to evaluate the ORC on the basis of an evaluation indicators system. The main contribution of this paper is to study the product reliability growth method from the perspective of enterprise capabilities, establish an ORC evaluation framework suitable for local manufacturing enterprises, and provide methodological references for the evaluation and improvement of the decision-making of ORC in manufacturing enterprises.
In this paper, Section 3 clarifies the composition of the ORC. Section 4 establishes the evaluation indicators framework according to the enterprise investigation and “8341” reliability methodology. Section 5 evaluates ORC by combining the three-parameter interval grey number and projection index function, and analyzes the evaluation results. Section 6 illustrates the evaluation and analysis method of ORC with a practical application. Section 7 draws the conclusions.
2. Literature Review
We review the current literature focusing on reliability research on electromechanical products or systems and the management systems of the enterprises.
Reliability research involves the entire lifecycle of electromechanical products, mainly divided into design reliability, manufacturing reliability, and operational reliability. Design reliability refers to the prediction and allocation of reliability during the product design and development phase [3]. Research in this area primarily focuses on the division of product functional structure [4] and allocation strategies [5]. Zhang et al. [6] proposed an automated calculation method based on a functionality multi-graph to identify the structure of mechanical systems, and calculated system reliability based on the factoring theorem-based algorithm. Wang et al. [7] used the Analytic Hierarchy Process (AHP) method to quantitatively allocate the reliability of the mechanical system during the conceptual design phase. Operation reliability assessment is the study of the degradation of product reliability during use [8]. Common evaluation indicators for functional reliability include MTBF, MTTR, MTTFF [9], etc. For performance reliability, performance indicators such as kinematic accuracy [10] are often selected. Adrian Gill et al. [11] used the Failure Mode, Effects and Criticality Analysis (FMECA) method to study the failure modes of the engine, which is also one of the most commonly used analysis methods in operation reliability. Jiang et al. [12] selected the Wiener process model to describe the degradation process caused by wear in mechanical systems, and carried out the reliability analysis and the whole lifetime calculations.
The inherent reliability of a product is formed during the manufacturing phase, and the manufacturing process capability determines the initial value of product reliability. Therefore, it is necessary to study the manufacturing process reliability. Enterprises have various management systems to ensure their manufacturing capabilities. From the literature, there are many kinds of management systems in enterprises, such as the quality management system (QMS), risk management system, etc. Hong Jin Jeong et al. [13] established a hybrid QMS by combining the advantages of the packaged system and customized system to increase the system’s recyclability, decrease the required system building time and improve the suitability of the enterprise’s work process. Jesús Álvarez-Santos et al. [14] investigated the relationship between the TQM and the safety management system (SMS), and results of the research indicate that there is a positive and significant relationship between TQM and SMS: companies operating in TQM environments tend to develop the SMSs. Parvaneh Saeidi et al. [15] attempted to examine the influence of Enterprise Risk Management (ERM) on Competitive Advantage (CA) by the moderating role of information technology dimensions including Information Technology (IT) strategy and Information Technology (IT) structure by using the Partial Least Squares Structural Equation Modelling (PLS-SEM) approach to analyze the data from the questionnaires. Camila Fabrício Poltronieri et al. [16] investigated the relationship between the maturity of the integrated management system and sustainable performance, and the results demonstrate that management system integration is one way to achieve sustainability, and that the management systems’ maturity level of integration would lead to a higher level of performance in the sustainability. Alfonso Hernandez-Vivanco et al. [17] investigate the relationship between the integration of management systems (IMSs) and sustainable innovation, and this is one of the first articles to relate IMSs, the adoption of cleaner production technologies, and sustainable product innovation, studying a sample of companies in countries of diverse economic backgrounds. For more research about management systems in enterprises, we review the literature of Łukasz Grudzień et al. [18], María Luisa Cantonnet et al. [19], and Lisha Zhu et al. [20].
However, the capability evaluation of those manufacturing management systems is mostly qualitative, with a few quantitative indicators related to the machining quality of parts, such as the Process Capability Index [21], Defect Rate [22], Sigma Level [23], etc. Albassam et al. [24] considered the uncertainty of the manufacturing process when calculating the process capability index and proposed a new neutrosophic process capability index (NPCI). Psarommatis et al. [25] proposed a zero-defect manufacturing (ZDM) framework that mostly focuses on qualitative manufacturing improvements, without introducing new quantitative indicators other than failure rates. Shokri et al. [26] studied the combination of green manufacturing and Lean Six Sigma (LSS), and introduced a new perspective of Green LSS integration theory.
The current research on the reliability evaluation of manufacturing systems is still based on the processing quality of products. Liao et al. [27] provided the principles for selecting the product key reliability characteristic (KRC), and evaluated the reliability capability of the manufacturing system based on the product processing results. Zheng et al. [28] proposed monitoring the key dimensional parameters that affect product reliability, and utilized these monitoring data as indicators to measure the manufacturing process. Friederich et al. pointed out in the overview article [29] that, due to the complexity of the manufacturing system, it is necessary to propose a method for comprehensively evaluating various influencing factors in the manufacturing system. In view of this, this paper reflects the reliability assurance process of manufacturing systems through the manufacturing enterprises’ ORC, and comprehensively estimates the manufacturing systems’ reliability assurance capability by evaluating the ORC of manufacturing enterprises.
The research on product reliability growth mentioned above is summarized, and the key points are tabulated in Table 1.

Table 1.
Key points of research on product reliability growth.
According to Table 1, existing research on product reliability growth is mostly conducted from the perspective of products, subsystems, or a certain link in the product lifecycle, using methods such as fault analysis and manufacturing process capability evaluation to achieve reliability growth. There are few studies on the reliability growth of products from the perspective of enterprise capability assessment and decision-making.
Grey relational analysis theory offers significant advantages in evaluating complex systems with multiple factors, as it can handle both subjective and objective weights simultaneously [30]. Although there are still many new evaluation methods available, simpler and more feasible methods are more practical for enterprises. Zhang et al. [31] employed the fuzzy hierarchical analysis and grey relational degree method to evaluate the ecological environment management system, and verified the effectiveness and feasibility of this method. Xiang et al. [32] conducted a hierarchical and quantitative evaluation for the distribution system using the grey relational analysis method, and validated its rationality through comparison with multiple other methods. Ulutaş et al. [33] established an integrated grey Multiple Criteria Decision-Making framework which was applied in the supply chain management system, and the case results validated the accuracy and reliability of the method. Therefore, we proposed a quantitative evaluation framework for the organizational reliability capability of manufacturing enterprises based on grey relational analysis theory.
3. Organizational Reliability Capability (ORC)
3.1. Composition of the ORC
Reliability assurance work runs through the whole life cycle of products, and therefore, ORC can be regarded as a kind of process capability.
To evaluate the process capability, it is necessary to clarify the composition of the process. According to “8341” reliability methodology (this provides four types of assurance capabilities for the reliability assurance process, and its main system architecture is shown in Figure 1) and the enterprise investigation, the reliability assurance work process can be roughly decomposed into the design analysis process (DA), manufacturing control process (MC), testing improvement process (TI), and after-sale maintenance process (AM); all of the processes are managed by the management assurance work process (MA). Therefore, the composition of the reliability assurance work process is shown as Figure 2.
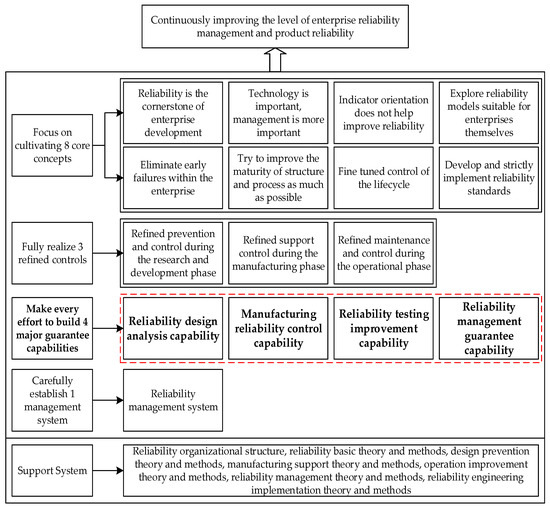
Figure 1.
The architecture of the “8341” reliability methodology.
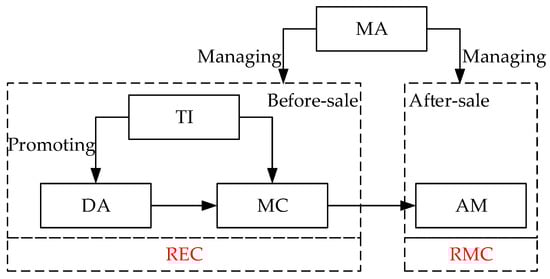
Figure 2.
Composition of reliability assurance work process.
Process capability is restricted by two factors. The first factor is the normalization of the processes established through the management work. The second factor is the executive capability of the process limited by the actual situation of the enterprise. Hence, ORC can be decomposed into reliability management capability (RMC) and reliability executive capability (REC).
3.2. Reliability Management Capability (RMC)
RMC is the capability to standardize and supervise the reliability assurance work in the whole work process. Various reliability management work supervises the whole life cycle of the product, so as to ensure the standardization of each work process. Therefore, RMC is reflected by the implementation effect of each reliability management work, which is determined by the capabilities of various reliability management work. The capability composition of the management work is shown as Figure 3.
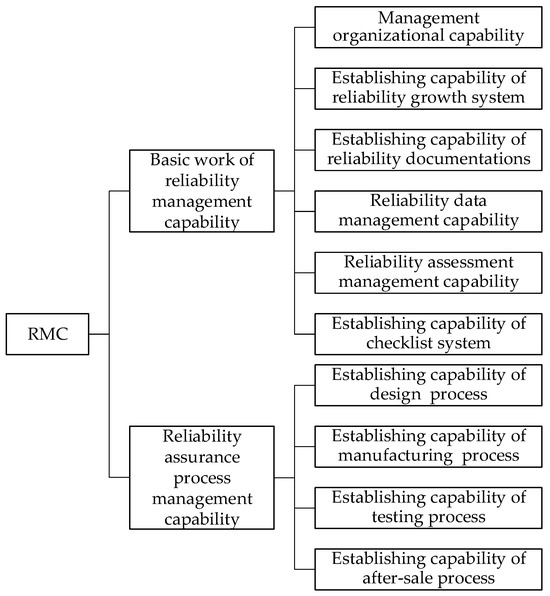
Figure 3.
Composition of reliability assurance work process.
Management organizational capability is the capability to establish the reliability management organization structure. Therefore, the rationality of the organization structure is the evaluation standard of management organizational capability.
The reliability growth system is the foundation of product reliability growth, it contains a large amount of reliability work. A reasonable configuration of the reliability work is the guarantee of reliability growth’s effect. Hence, the evaluation of the capability of the reliability growth system can proceed from the rationality of the growth system.
Reliability documentation and reliability data provide the basis for the reliability assurance work. Reliability documentation consists of standards, specifications, various process files, etc. The capability in the reliability documentation is mainly reflected in the comprehensiveness and rationality of documentations. However, reliability data mainly include the fault data, production process inspection data, and so on. Thus, the management capability of reliability data is mainly reflected in the comprehensiveness and accuracy of the data, as well as in the rationality of the data processing method.
Reliability assessment work is aimed at assessing the reliability of the product and judging whether it meets the standards or not. Reliability assessment work is seriously affected by executors, methods, and objects. Thus, the reliability assessment capability can be evaluated from these three factors.
The checklist is the most common, simple, and effective reliability assurance method and aims at prompting staff to carry out reliability assurance work in accordance with the standard process and to prevent omissions. A reasonable checklist system is the main purpose of checklist establishment work.
The management work of the reliability assurance work process aims to establish the reliability assurance work process of products. The rationality of the reliability assurance work process is the main factor that affects its execution.
3.3. Reliability Executive Capability (REC)
Reliability executive capability refers to the ability of manufacturing enterprises to perform reliability related assurance work processes such as reliability design and manufacturing throughout the entire product lifecycle.
According to Section 3.1, the reliability assurance work process is decomposed into DA, MC, TI, and AM. Therefore, the reliability executive capability is determined by the executive capability of the four processes.
3.3.1. Design Analysis Process
The design analysis process contains a large amount of design and analysis work, and it can be roughly decomposed into six stages: technical decision-making, preliminary design, technical design, working drawing design, prototype trial production, and small batch trial production.
Every stage has its corresponding output, as shown in Figure 4. Firstly, in the technical decision-making stage, enterprises investigate the reliability requirements of the products and determine the reliability design plan. Then, in the preliminary design, the establishment of the reliability task report and FRACAS system are completed, as well as the selection of outsourced parts. In the technical design stage, the system-level reliability block diagram and mathematical model are established. Furthermore, FTA and FMEA are also carried out in this stage. In the working drawing design stage, the part-level reliability block diagram and mathematical model are established. In addition, the reliability prediction analysis of the products is carried out. Finally, in the prototype trial production and small batch trial production stages, enterprises use the reliability test to verify and improve the design results.
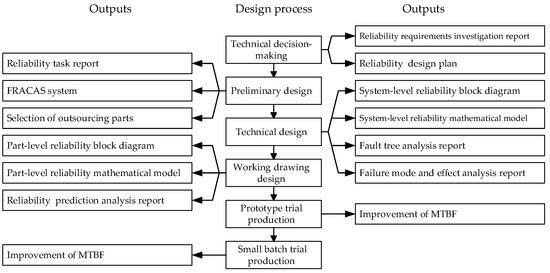
Figure 4.
Output relationship of design analysis process.
To summarize, each stage of the reliability design analysis process has its own output. The effect of the outputs can reflect the executive capability of the design analysis process.
3.3.2. Manufacturing Control Process
The manufacturing process of the product is restricted by the factors of 5M1E (man, machine, material, method, environment, and measurement). In the manufacturing process, the reliability knowledge of the staff determines the preciseness of their operation, and the operation capability determines their execution capability in the manufacturing process; the processing capability of manufacturing equipment determines the upper limit of the product’s theoretical accuracy; the material performance determines the processing method and final performance of products; the manufacturing method determines the difficulty of the manufacturing process and the proximity degree between product precision and ideal value; the environment affects the operation process of the staff and the accuracy of the processing equipment; and the measurement work determines the accuracy of the inspection process.
A fishbone diagram is used to extract the influencing factors in the manufacturing control process, as shown in Figure 5.
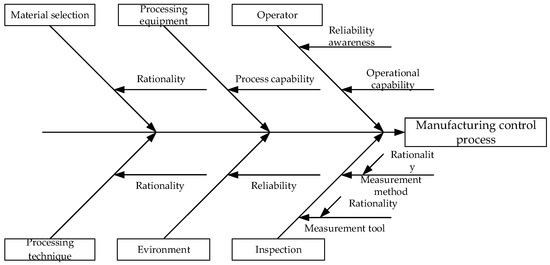
Figure 5.
Analysis of influencing factors in the manufacturing control process.
3.3.3. Testing Improvement Process
The reliability test is an important component distributed in the design and manufacturing process. Most of the reliability tests are carried out on test benches by relevant testers. Therefore, the execution capability of the test process is determined by the test benches and testers. The rationality of the test benches and the capability of the testers are the main factors affecting the execution capability of the reliability testing improvement process.
3.3.4. After-Sale Maintenance Process
For the enterprises, maintenance is an effective mean to ensure products’ operational reliability and to enhance users’ perception reliability (i.e., the products’ reliability perceived by users). The maintenance process includes fault feedback, maintenance task allocation, maintenance operation and spare parts, and other processes. Execution efficiency and effectiveness are the most important reflection of maintenance process execution capability. Therefore, the executive capability of the after-sale maintenance process can be evaluated in these two aspects.
4. Indicator Framework for ORC
According to Section 3, the specific evaluation indicators for ORC are proposed and shown in Table 2.
Table 2.
Evaluation indicator framework for organizational reliability capability.
The indicator system consists of both qualitative and quantitative indicators. The qualitative indicators are evaluated by the experts, and the quantitative indicators are evaluated by specific numerical value. This paper introduced two quantitative indicators of integrity and recurrence probability, in addition to the four traditional quantitative indicators of customer satisfaction, growth rate, process capability index (Cpk), and mean time to repair (MTTR). The calculation methods are shown in Table 3.
Table 3.
Calculation methods for the quantitative index.
5. Evaluation of Enterprises’ ORC
The reliability forming process of products is complex; every link can affect the final reliability of the products. In this paper, we assume the relationships among production links and the product’s reliability as a grey system, and it is feasible and appropriate to use the grey evaluation method to evaluate ORC.
In this paper, a three-parameter interval grey number is first used to represent the fuzzy information of each qualitative and quantitative indicator of ORC. Then, we evaluate the relative importance of each ORC indicator, establish a complementary matrix, and calculate the weights of each indicator. Finally, the projection index function is used to project the evaluation values of the ORC high-dimensional indicators along the weight vector direction into a low dimensional space for synthesis, obtaining the final evaluation result of the enterprise ORC. The flowchart of the evaluation method is shown in Figure 6.
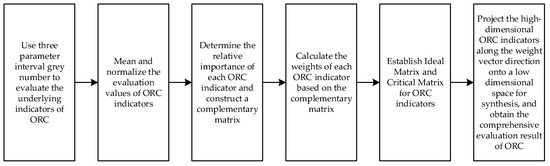
Figure 6.
Flowchart of the evaluation method.
5.1. Evaluation Matrix of the ORC
In cybernetics, the depth of color is usually used to indicate the clarity degree of the information. The system with partially known information and partially unknown information is called a “grey system” [34]. A grey number is a number for which the range is known but the value is unknown. The three-parameter interval grey number is the interval grey number for which the value with the greatest selection possibility is known, as shown below.
where is the value of with greatest selection possibility, is the lower limit of , and is the upper limit.
This paper uses three-parameter interval grey numbers to represent the evaluation values of various ORC evaluation indicators in manufacturing enterprises, in order to provide a fuzzy representation of the level of ORC evaluation indicators.
For the qualitative indicators, their evaluation values are represented by the degree of membership to an ideal situation. Evaluation values are scored by experts in the form of a three-parameter interval grey number according to enterprises’ actual situation.
The evaluation value of the ith qualitative indicator scored by the jth expert is as shown below.
Mean values of each qualitative indicator are used to represent the final evaluation values, shown as Equation (3).
The row matrix is used to express the qualitative indicators, so the evaluation matrix of the qualitative indicators is as shown below according to Table 2.
For the quantitative indicators, their evaluation values are calculated according to enterprises’ actual situations. Before establishing the evaluation matrix, the calculation values need to be normalized by Equations (5) and (6), and the normalized values are used to represent the evaluation values of quantitative indicators.
The benefit-oriented evaluation indicators are as follows:
The cost-based evaluation indicators are as follows:
where is the evaluation value of the quantitative indicator, is the lower limit of the quantitative indicator, and is the upper limit of the quantitative indicator.
In this paper, the mean time to repair (MTTR) and recurrence probability are the cost-based indicators, and the other indicators are the benefit-oriented indicators.
The three-parameter interval grey number represents a specific number, when its upper limit and lower limit are equal to the value with the greatest selection possibility. Therefore, the quantitative indicators of ORC can be converted into a three-parameter interval grey number, as shown below.
Similarly, the row matrix is used to represent the quantitative indicators, and the valuation matrix of quantitative indicators is as shown below.
Integrating and , the evaluation matrix of ORC is obtained as below.
5.2. Weight Vector of the Indicators
The weight vector of each indicator is established based on expert evaluation.
The relative importance of each indicator is evaluated by experts according to Table 4, and then the mean values of corresponding evaluation values are converted into the matrix, so the two complementary matrices and are obtained as below, representing the complementary matrices of RMC and REC, respectively.
where is the indicator number of RMC or REC.
Table 4.
Fuzzy judgment scale.
The weight vector is calculated by Equation (11) according to the complementary matrix as follows:
where is the resolution parameter for the weight allocation and represents the experts’ resolution capability, is the weight vector of RMC or REC, means the kth indicator’s weight of the RMC or REC, and the range of and is .
5.3. Ideal Evaluation Matrix and Critical Evaluation Matrix
After obtaining the ORC indicator evaluation value and weight vector, it is necessary to use the projection index function to project the multidimensional ORC indicator into a low dimensional space, and use the projection result to represent the degree of closeness between the evaluation indicator and its ideal and critical values. Therefore, it is necessary to first establish an ideal and critical indicator evaluation matrix.
According to the evaluation of the qualitative indicators, their ideal value should be one, which means that the indicators are absolutely ideal; on the contrary, their critical value should be zero. Therefore, the ideal and critical evaluation matrices for qualitative indicators are shown in Equations (12) and (13).
Since the range of quantitative indicators are (0,1), for the benefit-oriented indicators, their ideal values should be one and the critical values should be zero, while the cost-oriented indicators are the opposite. The ideal and critical evaluation matrix of quantitative indicators are shown in Equations (14) and (15).
Integrating the corresponding matrix of quantitative and qualitative indicators, the ideal evaluation matrix and critical evaluation matrix of the evaluation indicators can be obtained as below.
5.4. Comprehensive Evaluation
According to the projection pursuit theory, the best projection vector of evaluation indicators is their weight vector. Regarding the weight vector as the projection direction, RMC and REC can be evaluated separately by Equation (18).
where is the preference coefficient of the decision-maker, and . When the decision-makers are radical, ; when the decision-makers have a moderate mentality, ; and when the decision-makers are cautious, .
where is the RMC’s or REC’s weight of the kth indicator, is the RMC’s or REC’s ideal evaluation vector of the kth indicator, is the critical evaluation vector, and is the evaluation vector with the greatest selection possibility.
shows the relative approaching degree between the evaluation vectors and their ideal evaluation vectors. The closer is to one means the closer the evaluation vector is to the ideal evaluation vector, and the better the capability is.
This paper considers RMC and REC as equally important, so the evaluation result of ORC is expressed by the arithmetic average of RMC and REC as below:
5.5. Result Analysis and Weak Links Screening
In this paper, the evaluation results are analyzed from three aspects: ORC, process area classes (i.e., RMC and REC), and specific practices.
The comprehensive evaluation results of ORC indicate the approaching degree between the evaluation vector and ideal evaluation vector. When is greater than 0.5, ORC is closer to the ideal situation, and on the contrary, ORC is closer to the critical situation. Following the form of Table 4, the criteria for evaluating the results are established, as shown in Table 5.
Table 5.
Judging criteria for the result of ORC.
Referring to Table 5, the evaluation results can be analyzed, and the issue of whether the capabilities are good or bad can be judged.
To analyze the specific practice indicators, it is necessary to set up additional evaluation criteria. For each qualitative indicators, 0.5 is used as the evaluation criterion to represent the critical line between the ideal and not ideal state of the indicator, and the evaluation values with greatest selection possibility of qualitative indicators are used as their evaluation values. For the quantitative indicators, their evaluation criteria should be evaluated by experts according to the actual situation and reliability objectives of enterprises.
According to the evaluation value of specific practice indicators, their relative difference from the corresponding criteria are calculated by Equation (20). Finally, the relative differences are sorted and the weak links are extracted according to the Pareto principle.
where means the evaluation value with greatest selection possibility, means the criteria of indicators, and means the ideal values.
6. Practical Application
6.1. ORC Comprehensive Evaluation of the CNC Machine Tool Manufacturing Enterprise
The CNC machine tool is the typical electromechanical product. So, this paper takes the ORC evaluation of a CNC machine tool manufacturing enterprise as an example to illustrate the evaluation and analysis method. The calculation process is illustrated by the calculation of RMC.
Firstly, the value of each quantitative indicator is calculated according to the actual situation of the enterprise, as shown below:
Each qualitative indicator is evaluated by five experts in the form of a three-parameter interval grey number, shown as follows:
So, the evaluation matrix of RMC can be obtained as follows by integrating the qualitative and quantitative evaluation indicators.
Then, the complementary matrix can be established by the experts according to the fuzzy scale in Table 3. Setting , the weight vector of the indicators can be calculated by Equation (11).
The ideal and critical evaluation matrix is established, as shown below.
Finally, setting , the evaluation result of RMC is calculated by Equation (18).
Similarly, the evaluation result of the REC can be calculated, as shown below.
According to the evaluation results of RMC and REC, the evaluation value of ORC is calculated as follows.
6.2. Results Analysis
According to the evaluation results, is in the range of (0.7, 0.8), and indicates that the ORC is very close to the ideal situation. and are in the ranges of (0.8, 0.9) and (0.7, 0.8), respectively, and indicate that RMC is extremely close to the ideal situation and REC is very close to the ideal situation.
Taking as the evaluation criterion of qualitative indicators, the evaluation criteria of RMC’s each quantitative indicator can be determined by the experts, as shown below.
The relative difference of each indicator according to the evaluation criteria is calculated as shown in Table 6.
Table 6.
Relative difference for each indicator.
Then, the weak links of ORC are screened by using the Pareto principle, as shown in Figure 7.
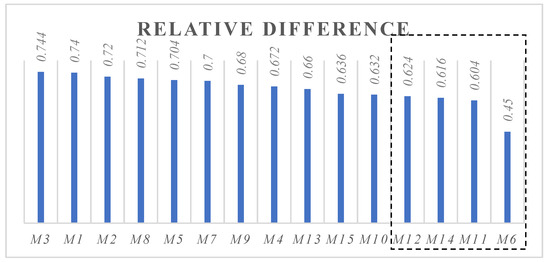
Figure 7.
Relative difference for each indicator.
From the dashed box in Figure 7, the weak links of RMC in the machine tool enterprises are the comprehensiveness of data category, rationality of the checklist system, rationality of the reliability growth system and rationality of the assessment panel composition. Therefore, the improvement of RMC can start with these four aspects.
Based on the evaluation decision results, corresponding correction methods have been provided for the machine tool manufacturing enterprise through analysis. These methods include data type adjustment for collection and recording, file archiving strategy revision and the digitization of important data, etc. After taking relevant measures, the reliability of CNC machine tools has significantly increased, and the MTBF of key products can exceed 2000 h. Specifically, although the reliability growth of CNC machine tools is the result of multiple intervention measures, the results of its reliability growth still demonstrate the effectiveness of the aforementioned enterprise ORC evaluation indicator framework and evaluation method.
6.3. Method Comparison
At present, commonly used fuzzy evaluation methods include cloud models [35], interval intuitionistic trapezoidal fuzzy numbers [36], multi-criteria decision-making methods (MCDM) [37], etc. Compared with the fuzzy evaluation method based on three-parameter interval grey numbers used in this paper, the above method may be able to obtain more accurate results. However, for the application of evaluation methods in manufacturing enterprises, the calculation process in this paper is simpler and more efficient, and can quickly and efficiently perform the evaluation of and correction decision-making for the enterprise’s ORC. According to the actual application results, the effectiveness of the ORC evaluation indicator framework and evaluation method has been verified. Therefore, the evaluation method based on the three-parameter interval grey number used in this paper is more suitable for enterprises to evaluate and make corrective decisions on the ORC, which can reduce the time cost of enterprise capability evaluation and self-correction, and improve efficiency.
In addition, existing research on product reliability growth is mostly conducted from the perspective of products, subsystems, or a certain link in the product lifecycle, using methods such as fault analysis and manufacturing process capability evaluation to achieve reliability growth. There are few studies on the reliability growth of products from the perspective of enterprise capability assessment and decision-making. Therefore, this paper is innovative in studying product reliability growth from the perspective of enterprise ORC evaluation and improvement decision-making.
Comparing with IEEE standards, there are over 130 evaluation indicators in IEEE standard 1624-2008 [1], which are mainly aimed at organizations of electrical/electronic components or products. The indicator content is not entirely suitable for local manufacturing enterprises. In addition, for enterprises, the evaluation of 130 indicators is relatively complex and requires time and effort. Therefore, the indicator framework in IEEE standard 1624-2008 [1] is not suitable for local manufacturing enterprises to use. The ORC evaluation indicator framework proposed in this paper is based on the research results of local electromechanical product enterprises, with a total of 39 indicators. Therefore, the ORC evaluation indicator framework proposed in this paper is more suitable for local manufacturing enterprises.
7. Conclusions
This paper establishes the evaluation indicator framework for ORC first on the basis of the enterprise investigation and “8341” reliability methodology. Then, the ORC is evaluated and projected by combining the three-parameter interval grey number and projection index function together. Finally, the ORC evaluation indicator framework and evaluation method were explained through practical application, the weak links of ORC were extracted according to the evaluation results, and the effectiveness was verified by the growth of CNC machine tools’ MTBF.
Practical application has proven that a comprehensive evaluation of ORC can help enterprises understand the current situation of their ORC, sort the weaknesses, and make decisions on the improvement of the ORC. Compared with existing fuzzy evaluation methods, the comprehensive evaluation method adopted in this paper requires less time and complexity compared to other methods. For enterprises, the method proposed in this paper is more suitable for the characteristics of simplicity, directness, and efficiency that enterprises need. In summary, the comprehensive evaluation of ORC proposed in this paper is an effective measure to guide the reliability growth of products.
Practical application has proven that the evaluation indicator framework and evaluation method proposed in this paper can help enterprises understand the current situation and shortcomings of their ORC, and make decisions on improving ORC. Compared with IEEE’s evaluation indicator framework and existing evaluation methods, the framework and method proposed in this paper are simpler, more direct, and more suitable for manufacturing enterprises to conduct a self-assessment and self-determination of ORC. In summary, the framework and methods proposed in this paper are effective measures to guide the reliability growth of electromechanical products.
Meanwhile, further research can also make some detailed improvements to the evaluation indicator framework and evaluation methods of ORC. Firstly, the evaluation indicator framework can be fine-tuned according to the current situation of the enterprise, making it more universal and not only applicable to manufacturing enterprises. Secondly, enterprises can choose appropriate evaluation methods based on their own situation and combine them with the indicator framework of this paper for evaluation, which makes the evaluation indicator framework more suitable for enterprises. The detailed adjustments to the framework and methods will not affect the implementation process of the method.
Author Contributions
H.W. and J.L. (Jinyuan Li) were in charge of the evaluation data statistics, Z.M. and G.Z. compiled the manuscript, and an engineering example was studied by J.L. (Jian Li) and X.Z. All authors have read and agreed to the published version of the manuscript.
Funding
This work is supported by Special Funding for Postdoctoral Research Projects in Chongqing (Chongqing Municipal Human Resources and Social Security Bureau, 2023CQBSHTB3153); The Science and Technology Research Project of Chongqing Education Commission (Chongqing Municipal Education Commission, KJQN202301326); Chongqing City Vocational College Industrial Robot Operation and Maintenance Open Fund Project of Chongqing University Engineering Center (Chongqing City Vocational College, YWZX20220007); and the Chongqing University of Arts and Sciences sponsors of research projects (Chongqing University of Arts and Sciences, R2022ZZ02).
Data Availability Statement
The original contributions presented in the study are included in the article, further inquiries can be directed to the corresponding author.
Acknowledgments
We wish to acknowledge the reviewers for the valuable suggestions that helped to significantly improve the quality of our revised manuscript.
Conflicts of Interest
The authors declare no conflicts of interest.
References
- IEEE Reliability Standards Committee. IEEE Standard for Organizational Reliability Capability; The Institute of Electrical and Electronics Engineers: New York, NY, USA, 2008; pp. 1–34. [Google Scholar]
- Zhang, B.; Li, D. 8341 engineering for NC machine tools reliability methodology. Manuf. Technol. Mach. Tool 2014, 4, 54–59. [Google Scholar]
- Axita; Yang, Z.; Chen, C.; Guo, J.; Yang, S. Reliability allocation method based on minimizing implementation risk. Expert Syst. Appl. 2024, 255, 124746. [Google Scholar] [CrossRef]
- Zhang, W.; Du, Y.; Zhu, Q. A hybrid approach for reliability allocation of NC machine tool based on meta-action. Int. J. Adv. Manuf. Technol. 2023, 127, 4067–4079. [Google Scholar] [CrossRef]
- Wang, Y.; Wang, X.; Zhang, L.; Wu, X.; Li, R. An allocation method of reliability goal for a compact fusion device. Fusion Eng. Des. 2023, 191, 113593. [Google Scholar] [CrossRef]
- Nath, R.; Muhuri, P.K. A novel evolutionary solution approach for many-objective reliability-redundancy allocation problem based on objective prioritization and constraint optimization. Reliab. Eng. Syst. Safe 2024, 244, 109835. [Google Scholar] [CrossRef]
- Zhang, Z.; Yang, L.; Xu, Y.; Zhu, R.; Cao, Y. A novel reliability redundancy allocation problem formulation for complex systems. Reliab. Eng. Syst. Safe 2023, 239, 109471. [Google Scholar] [CrossRef]
- Cao, S.; Wang, Z.; Liu, C.; Wu, Q.; Ouyang, X. Reliability analysis for degradation process with abrupt jumps caused by operation state transition. Appl. Math. Model. 2024, 134, 776–796. [Google Scholar] [CrossRef]
- Mehdi, I.; Boudi, E.M.; Mehdi, M.A. Reliability, Availability, and Maintainability Assessment of a Mechatronic System Based on Timed Colored Petri Nets. Appl. Sci. 2024, 14, 4852. [Google Scholar] [CrossRef]
- Zhuang, X.; Yu, T.; Liu, J.; Song, B. Kinematic reliability evaluation of high-precision planar mechanisms experiencing non-uniform wear in revolute joints. Mech. Syst. Signal Process. 2022, 169, 108748. [Google Scholar] [CrossRef]
- Gill, A.; Pielecha, I.; Szwajca, F. A New Method of Failure Mode and Severity Effects Analysis for Hydrogen-Fueled Combustion Systems. Energies 2024, 17, 4802. [Google Scholar] [CrossRef]
- Jiang, D.; Han, Y.; Wang, K.; Jiang, S.; Cui, W.; Song, B. Functional degradation reliability analysis for non-uniform wear of multi-rotating joints of mechanical structures. Eng. Fail Anal. 2024, 157, 107934. [Google Scholar] [CrossRef]
- Jeong, H.J.; Kim, B.H.; Jung, S.Y. Development of Hybrid Quality Management System for Construction Equipment Part Industry. Procedia Manuf. 2017, 11, 2139–2146. [Google Scholar] [CrossRef]
- Álvarez-Santos, J.; Miguel-Dávila, J.Á.; Herrera, L.; Nieto, M. Safety management system in tqm environments. Safety Sci. 2018, 101, 135–143. [Google Scholar] [CrossRef]
- Saeidi, P.; Saeidi, S.P.; Sofian, S.; Saeidi, S.P.; Nilashi, M.; Mardani, A. The impact of enterprise risk management on competitive advantage by moderating role of information technology. Comput. Stand. Interfaces 2019, 63, 67–82. [Google Scholar] [CrossRef]
- Poltronieri, C.F.; Ganga, G.M.D.; Gerolamo, M.C. Maturity in management system integration and its relationship with sustainable performance. J. Clean. Prod. 2018, 207, 236–247. [Google Scholar] [CrossRef]
- Hernandez-Vivanco, A.; Bernardo, M.; Cruz-Cázares, C. Sustainable innovation through management systems integration. J. Clean. Prod. 2018, 196, 1176–1187. [Google Scholar] [CrossRef]
- Grudzień, Ł.; Hamrol, A. Information quality in design process documentation of quality management systems. Int. J. Inform. Manag. 2016, 36, 599–606. [Google Scholar] [CrossRef]
- Cantonnet, M.L.; Aldasoro, J.C.; Iradi, J. New and emerging risks management in small and medium-sized Spanish enter-prises. Safety Sci. 2019, 113, 257–263. [Google Scholar] [CrossRef]
- Zhu, L.; Chen, L.; Wu, X.; Ding, X. Developing a greenhouse gas management evaluation system for chinese textile enterprises. Ecol. Indic. 2018, 91, 470–477. [Google Scholar] [CrossRef]
- Ouyang, L.; Dey, S.; Park, C. Development of robust confidence intervals for the cost-based process capability index. Comput. Ind. Eng. 2024, 190, 110048. [Google Scholar] [CrossRef]
- Miedema, E.; Kortman, H.; Emmanouilidis, C. Predicting Defect Rates of Printed Circuit Board Assemblies: Towards Zero Defect Manufacturing and Zero-Maintenance Strategies. IFAC Pap. 2024, 58, 91–96. [Google Scholar] [CrossRef]
- Hariyani, D.; Mishra, S. Drivers for the adoption of integrated sustainable green lean six sigma agile manufacturing system (ISGLSAMS) and research directions. Clean. Eng. Technol. 2022, 7, 100449. [Google Scholar] [CrossRef]
- Albassam, M.; Aslam, M. Product evaluation using uncertainty-based process capability index. Ain Shams Eng. J. 2023, 14, 101947. [Google Scholar] [CrossRef]
- Psarommatis, F.; Azamfirei, V. Zero Defect Manufacturing: A complete guide for advanced and sustainable quality management. J. Manuf. Syst. 2024, 77, 764–779. [Google Scholar] [CrossRef]
- Shokri, A.; Antony, J.; Garza-Reyes, J.A. A new way of environmentally sustainable manufacturing with assessing transformation through the green deployment of Lean Six Sigma projects. J. Clean. Prod. 2022, 351, 131510. [Google Scholar] [CrossRef]
- Liao, R.; He, Y.; Zhang, J.; Zheng, X.; Zhang, A.; Zhang, W. Reliability proactive control approach based on product key reliability characteristics in manufacturing process. Reliab. Eng. Syst. Safe 2023, 237, 109374. [Google Scholar] [CrossRef]
- Zheng, X.; He, Y.; Liao, R.; Yu, S. Reliability oriented key quality characteristics driven integrated built-in reliability activity chain and approach for manufacturing process. Comput. Ind. Eng. 2024, 191, 110166. [Google Scholar] [CrossRef]
- Friederich, J.; Lazarova-Molnar, S. Reliability assessment of manufacturing systems: A comprehensive overview, challenges and opportunities. J. Manuf. Syst. 2024, 72, 38–58. [Google Scholar] [CrossRef]
- Wang, X.; Liu, Z.; Kong, H.; Peng, G. Research on the evaluation of green suppliers of high energy-consuming enterprises—Based on rough number-grey correlation TOPSIS method. Heliyon 2024, 10, e21700. [Google Scholar] [CrossRef]
- Zhang, Y.; Shang, K. Evaluation of mine ecological environment based on fuzzy hierarchical analysis and grey relational degree. Environ. Res. 2024, 257, 119370. [Google Scholar] [CrossRef]
- Xiang, Y.; Lin, Y.; Zhang, Y.; Lan, J.; Hao, M.; Wang, L.; Wang, J.; Qin, L. A Grid-Wide Comprehensive Evaluation Method of Power Quality Based on Complex Network Theory. Energies 2024, 17, 3193. [Google Scholar] [CrossRef]
- Ulutaş, A.; Topal, A.; Görçün, Ö.F.; Ecer, F. Evaluation of third-party logistics service providers for car manufacturing firms using a novel integrated grey LOPCOW-PSI-MACONT model. Expert. Syst. Appl. 2024, 241, 122680. [Google Scholar] [CrossRef]
- Lin, Y.; Liu, S. A historical introduction to grey systems theory. In Proceedings of the 2004 IEEE International Conference on Systems, Man and Cybernetics, The Hague, The Netherlands, 10–13 October 2004. [Google Scholar]
- Li, P.; Hu, T.; Chen, T.; Liu, H. Evaluation of the support capability of the launch power system propellant based on G1-EW two-dimensional cloud model. Int. J. Model. Simul. Sci. Comput. 2024, 15, 1–27. [Google Scholar] [CrossRef]
- Liu, Y.; Wang, M.; Wang, Y. Location Decision of Emergency Medical Supply Distribution Centers Under Uncertain Environment. Int. J. Fuzzy Syst. 2024, 26, 1567–1603. [Google Scholar] [CrossRef]
- Alamoodi, A.H.; Zughoul, O.; David, D.; Garfan, S.; Pamucar, D.; Albahri, O.S.; Albahri, A.S.; Yussof, S.; Sharaf, I.M. A Novel Evaluation Framework for Medical LLMs: Combining Fuzzy Logic and MCDM for Medical Relation and Clinical Concept Extraction. J. Med. Syst. 2024, 48, 81. [Google Scholar] [CrossRef]
Disclaimer/Publisher’s Note: The statements, opinions and data contained in all publications are solely those of the individual author(s) and contributor(s) and not of MDPI and/or the editor(s). MDPI and/or the editor(s) disclaim responsibility for any injury to people or property resulting from any ideas, methods, instructions or products referred to in the content. |
© 2024 by the authors. Licensee MDPI, Basel, Switzerland. This article is an open access article distributed under the terms and conditions of the Creative Commons Attribution (CC BY) license (https://creativecommons.org/licenses/by/4.0/).