Article

Application of Structural Equation Modelling to Cybersecurity Risk Analysis in the Era of Industry 4.0

1
Department of Management, Faculty of Management and Business, University of Prešov, 080 01 Prešov, Slovakia
2
Department of Natural Sciences and Humanities, Faculty of Manufacturing Technologies with a Seat in Prešov, Technical University of Košice, 080 01 Prešov, Slovakia
3
Department of Information Science and Management, Academy of the Police Force in Bratislava, 835 17 Bratislava, Slovakia
4
Department of Mathematics and Physics, Faculty of Military Technology, University of Defence, 662 10 Brno, Czech Republic
*
Author to whom correspondence should be addressed.
Mathematics 2024, 12(2), 343; https://doi.org/10.3390/math12020343
Submission received: 6 December 2023 / Revised: 14 January 2024 / Accepted: 17 January 2024 / Published: 20 January 2024
(This article belongs to the Special Issue Recent Advances of Mathematics in Industrial Engineering)

Abstract

:
In the current digital transformation to Industry 4.0, the demands on the ability of countries to react responsibly and effectively to threats in the field of cyber security (CS) are increasing. Cyber safety is one of the pillars and concepts of Industry 4.0, as digitization brings convergence and integration of information technologies (IT) and operational technologies (OT), IT/OT systems, and data. Collecting and connecting a large amount of data in smart factories and cities poses risks, in a broader context for the entire state. The authors focus attention on the issue of CS, where, despite all digitization, the human factor plays a key role—an actor of risk as well as strengthening the sustainability and resilience of CS. It is obvious that in accordance with how the individuals (decision-makers) perceive the risk, thus they subsequently evaluate the situation and countermeasures. Perceiving cyber threats/risks in their complexity as a part of hybrid threats (HT) helps decision-makers prevent and manage them. Due to the growing trend of HT, the need for research focused on the perception of threats by individuals and companies is increasing. Moreover, the literature review points out a lack of methodology and evaluation strategy. This study presents the results of the research aimed at the mathematical modelling of risk perception of threats to the state and industry through the disruption of CS. The authors provide the developed factor model of cyber security (FMCS), i.e., the model of CS threat risk perception. When creating the FMCS, the researchers applied SEM (structural equation modelling) and confirmatory factor analysis to the data obtained by the implementation of the research tool (a questionnaire designed by the authors). The pillars and sub-pillars of CS defined within the questionnaire enable quantification in the perception of the level of risk of CS as well as differentiation and comparison between the analyzed groups of respondents (students of considered universities in SK and CZ). The convergent and discriminant validity of the research instrument is verified, and its reliability is confirmed (Cronbach’s alpha = 0.95047). The influence of the individual pillars is demonstrated as significant at the significance level of α = 5%. For the entire research set N = 964, the highest share of risk perception of CS threats is achieved by the DISRIT pillar (disruption or reduction of the resistance of IT infrastructure).

1. Introduction

The dynamics of development and implementation of information technology (IT) and operations technologies (OT) in the Industry 4.0 era are quite aggressive. Developments in the field of industrial engineering are influenced and driven by, among others, the development of digitalization [1], the Internet of Things (IoT) [2], the Internet of Services (IoS) [3], cloud computing [4], robotics, cybernetics [5], artificial intelligence [6], machine learning [7] and other new technologies [4]. The implementation of Industry 4.0 concepts and technologies is almost unlimited [8] and finds application in various branches of industry, which in a revolutionary way changes both the production itself and the distribution of finished products or services in terms of increasing productivity, efficiency, and quality [9]. This subsequently affects the quality of the functioning of the entire society and state. Convergence and integration of IT and OT (systems and data) is the cornerstone for realizing these revolutionary changes; the digital ecosystem is being transformed, a hybrid multi-cloud IT architecture is being created, and smart factories and cities are being established. It is clear that advanced mathematical methods of data collection and analysis play a very important role in this progress.
However, this revolutionary progress significantly changes and shifts the risks associated with the use of modern technologies and Industry 4.0 concepts [10]. The large interconnection and collection of data creates space for malicious cyber-attacks, and we are witnessing pressure in the field of IoS, IoT [10], etc. Cyber-attacks make it possible to hit critical infrastructure (e.g., electricity supplies) and thus threaten the operation of manufacturing companies, the functioning of the public sector, the financial sector, as well as the functioning of the state. In the current digital transformation to Industry 4.0, the demands on the ability of countries to respond responsibly and effectively to cyber security threats are increasing [11]. Cyber protection is one of the pillars of Industry 4.0 [12]. The cyber security sustainability and privacy protection in digital ecosystems is a prerequisite for ensuring the sustainability of production and industry, for economic, social, environmental, and cultural sustainability since modern IT technologies have penetrated every substructure of the globally connected world [13].
Cyber security is also an integral part of the state’s resistance to hybrid threats Treverton [14], which have become a significant challenge for the sustainability of global security in the 21st century [14]. Many research studies and professional articles highlight the vulnerability of sustainability of modern societies, intelligent factories, and cities to hybrid threats (HT) and tactics, by which it is possible to achieve objectives with minimal force and destroy preventive defensive actions [15]. As is discussed in many manuscripts and reviews, HT has a multidimensional character. Within the last decade, it has been intensified by globalization [16], the sharp increase in the use of modern digital technologies in many areas of professional/personal life [17,18,19], demography [20], geopolitics [21], and interstate confrontations. The requirements and demands for increasing the state’s sustainable stability and resistance to HT are currently on the rise, both worldwide [16] and within the individual countries of the European Union [22], as hybrid threats have the potential to cause devastating consequences in various areas of the state’s functioning. The EU is taking important steps to improve its ability to face hybrid threats and is taking measures to strengthen resilience, including in the field of cyber security—as the authors report in [22], focusing mainly on the V4 countries. This topic focused on hybrid warfare/threats/campaigns receives a lot of attention in professional literature, as it is a highly relevant problem [8] and rich discussions are held between the actors involved.
Cybersecurity [23] is often discussed, as it is one of the pillars on which the country’s resistance to hybrid threats and attacks is currently being built. The development and adoption of network technologies are reshaping the daily life of both the individual and the state, which consequently increases the risk of cyber threats and attacks. Currently, new strategies for the detection of cyber security threats are actively being developed [24], and attention is paid to this issue from several points of view [25]. The Authors Tsaruk et al. [26] deal with information and cyber security from the point of view of the hybrid nature of such threats and focus on attacks in cyberspace linked to conventional techniques. Bachmann et al. [27] focus on cyber terrorism and war as hybrid threats, emphasizing the need for a comprehensive approach that combines law enforcement, counter-cyber strategies, and kinetic responses. Galinec et al. [28] discuss the role of cyber security and cyber defence within the context of hybrid threats, proposing the development and operation of EU Cyber Rapid Response Teams and Mutual Assistance in Cyber Security. In summary, these papers highlight the recognition of cyber security as an integral component of hybrid threats and the importance of comprehensive approaches and collaborative efforts to counter these threats.
The identification of cyber threats/attacks and the implementation of measures (adequate response to identified threats) aimed at maintaining cyber security took place in the past in a relatively stable digital environment. In today’s global, even aggressively dynamic environment, the nature of cyber threats has gradually evolved into a complex combination of traditional and non-traditional elements. So, to ensure a sustainable cyber ecosystem, it is necessary to identify, characterize, and classify such threats in accordance with emerging trends (Internet of Things, smart cities, etc.) and solve them with new emerging techniques [29,30]. Based on the above mentioned, a very difficult challenge was declared for the reaction of individuals, organizations, and nations—to first and foremost ensure the forward-looking sustainability of cybersecurity. To provide a sustainable and safe society to online users in cyberspace [31].
The ability to maintain effective cybersecurity measures and ensure cyber resilience over time depends not only on technological advances but also on the complexity of risk perception from the level of the human factor, as is emphasized in [32]. Nam [32] provides insights into the perception of the risk of threats to cyber security and investigates the relationships of various theoretical determinants of perceived threat and preparedness. The sustainability of cybersecurity and cyber resilience clearly depends on the reactions of many societal actors [25], i.e., how individuals, factories, organisations, governments, citizens, clients of banks, students, etc., perceive the risks posed by hybrid threats [32]. The awareness of risks, and their perception of them, is a principle prerequisite for preparing and creating effective cybersecurity strategies that respond to the development of hybrid threats. Perception of the risk of threats to cyber security is a necessary condition for forming the correct attitudes of actors entering cyberspace, especially individuals as Internet users.
The attitudes of Internet users therefore depend on individual cognition and perception of cyber threats; moreover, not only cognitive assessment/evaluation of facts but also psychological factors play a key role in their formation. An individual’s psychological reactions or fears (arising from uncertainty) determine the ability to assess risks and prevent future attacks. Larsen et al. in [33] highlight that cyber incidents are often caused by complex relationships between humans and technology; humans can represent both a risk of cybersecurity threat and an important resource in strengthening cybersecurity. In general, the behaviour of the decision-makers plays a key role in preventing and handling cyber risks [34].

The Problem Statement and Research Questions

Considering the definition of Industry 4.0 and its entire concept [35] it is clear that in connection with the implementation of Industry 4.0 and the ever-expanding IoT (associated with the digitization of industry as well as public and state administration), the risk of misuse of sensitive protected information of organizations and the state by third parties is growing. Either as part of a competitive struggle or in connection with the abuse of critical infrastructure (or its part exposure in cyberspace—critical information infrastructure and important information systems at the company/state level) as part of a hybrid war. The key factor in this problem is the human factor, the individuals. Failure of individuals or underestimation of the security threat on their part can lead to the aforementioned negative consequences. That is why it is important to know people’s opinions on the risks associated with cyber security. Only in this way is it possible to identify “weak spots” that can be strengthened by education in the areas of cyber security identified in this way. So, it is precisely the identification of problem areas within cyber security that is the goal of the present contribution.
Despite the growing trend of cybersecurity issues [36], little research has been conducted on individual threat perception and cybersecurity preparedness and resilience, especially in countries neighbouring the state involved in the war conflict (Ukraine). Specifically, relevant research is scarce in the Slovak Republic and the Czech Republic, as is also emphasized in the project solved within the EU with the participation of the Ministry of the Interior of the Slovak Republic [37]. These facts established the requirement and need to approach the issue of threats to cyber security (state, factories, organization, etc.) from the point of view of the individual, specifically through the lens (perception) of the respondents involved in the research. Later, based on the obtained results, it will be possible to direct the education and shaping of the attitudes of future actors entering cyberspace. Specifically, in this case, it concerns students from various universities/faculties in the Slovak Republic (SK) and the Czech Republic (CZ), taking into account the common past of these two countries and the fact that this group of respondents will represent the first line of the fight against hybrid threats in the future.
The aim of the authors of this article and the research carried out through a research tool of their own construction (questionnaire) was first to create/develop a basic theoretical model of factors (determinants) influencing cyber security (factor model of cyber security—FMCS). Within the framework of the study, the authors seek answers to these research questions:
(i)
What is the relationship between the basic defined pillars of cybersecurity and the basic demographic indicators of the research sample (from SK and CZ)? In other words: Which defined pillars (determinants) of cyber security are perceived as important and significant from the point of view of risk?
(ii)
Are there differences between the analyzed groups of respondents in the perception of the seriousness of the threat to the state (cyber security)?
(iii)
Are there differences in risk perception between respondents from Slovakia and the Czech Republic?
The research questions deal with relationships that have not yet been considered in the relevant literature [37] and the FMCS created by the authors represents a contribution to the subject research issue. To resolve these questions, the study uses data obtained from the questionnaire (more detailed in Section 2.2) addressed to respondents in the Slovak Republic and Czech Republic during 2023. Within this questionnaire, the basic pillars of CS threats and their sub-pillars were defined based on a brainstorming session of 15 specialists (more detailed in Section 2.2). The evaluation and analysis of the obtained data are based on the application of the structural equation modelling method (SEM) and confirmatory factor analysis [38,39,40,41,42,43,44,45,46,47]. Mathematical modelling using structural equations finds its application first in psychological research (in psychometrics), gradually the range of SEM applications expands marketing, strategic management, organizational research, management information systems, and operational management [38,39,40]. Currently, the SEM is successfully used in logistics controlling [39,40], operational management [38,40], economics and finance [41], and many others [42,43]. One of the disadvantages of SEM is that it cannot test the direction of the relationships between variables [44]; however, this was not necessary in the research described.
This article is further structured into five sections, including the above introduction. Section 2 presents the research sample (description of the research set), the research tool, the applied methods, and the developed factor model. Section 3 discusses the achieved results and presents the results of statistical data analysis. Section 4 analyzes and discusses the comparison of results in the Slovak Republic and the Czech Republic and brings some suggestions. Finally, Section 5 concludes this study by summarizing the most relevant findings, outlining the limitations of the paper, and providing future research direction.

2. Research Data, Research Tool, and Methodology

2.1. The Research Sample

Research focused on the perception of the risk of cybersecurity threat was carried out from February 2023 to July 2023 using the research instrument, i.e., the questionnaire constructed by authors. The purpose of the research was to determine the subjective level of perception of the importance and risk of cybersecurity threats in relation to the threat in the Slovak Republic and the Czech Republic. A technique developed for measuring attitudes in questionnaires by American psychologist Rensis Likert was used for the evaluation. The research instrument was distributed to the respondents—university students—in electronic form and was implemented based on availability. The research group consists of a total of N = 964 respondents and in terms of structure was comprised of 521 (54.046%) men and 443 (45.954%) women from two countries. A total of 580 (60.166%) respondents were from Slovakia, and 384 (39.834%) were from the Czech Republic. The average age of the respondents was 26.03 ± 0.51 years, with a standard deviation of 8.145 years. The minimum age of the respondents was 19 years, and the maximum age was 63 years. The age of the respondents was also analysed as an ordinal variable, and a total of 669 (69.398%) respondents were under the age of 25, 156 (16.183%) were 26–35 years old, 95 (9.855%) were aged 36–45, 41 were of age 46–55 years (4.253%), and 3 were older than 55 (0.311%). Out of the 964 respondents, 321 (33.299%) are studying at the bachelor’s degree level, 591 (61.307%) at the master’s degree level and 52 (5.394%) at the doctoral degree level, while 592 (61.411%) were full-time and 372 were part-time (38.589%) students. A more detailed breakdown of the research sample by country, gender, and age categories is provided in Table 1.

2.2. The Research Tool

The questionnaire, consisting of 39 items, was constructed based on brainstorming session of 15 specialists concerning on mathematical modeling, hybrid threats, and psychology (researchers from the Academy of the Police Force in Bratislava, the University of Prešov, the University of Defense in Brno and the Technical University of Košice). The questionnaire was addressed to the respondents in electronic form (Google form) as a part of the research conducted on the perception of cybersecurity risk as one of the pillars of hybrid threats. Before starting to fill in, the students were familiarized with the purpose and content of the research, as well as with how the obtained data would be handled. By starting to fill in, the respondents confirmed their consent to the anonymous use of their responses for research purposes. The research itself was conducted as a part of the solution to the project “Increasing Slovakia’s resistancece to hybrid threats by strengthening public administration capacities” [37]. The measurement was based on the subjective perception of the level of risk of individual items, while respondents chose answers on a 5-point Likert scale: 1—stands for “no risk”, 2—is used for “low risk”, 3—denotes “medium risk”, 4—“high risk” and 5—represents “critical risk”. The research instrument itself was divided into five basic areas of cybersecurity, so the 5 basic pillars of CS threats and their sub-pillars (39) were defined:
  • Cyber spying (CYBSPY)—9 items (sub-pillars);
  • Disrupting or reducing IT infrastructure resilience (DISRIT)—12 items;
  • Enemy campaigns (ENECAM)—5 items;
  • Disrupting or reducing eGovernment security (DISREG)—6 items;
  • Cyberterrorism (CYBTER)—7 items.
Each of the five defined areas of cybersecurity was assigned statements with which the respondents expressed their subjective perception of the degree of risk. Given the relatively extensive nature of these items, we will mention them only during the actual analysis of the obtained data.
The reliability of the entire research instrument, defined by Cronbach’s alpha, achieved a value of 0.95047. This fact shows that the error component of the measurement variance is relatively low, and the sub-items of the research instrument are internally consistent; that is, there is a high degree of agreement between the items of the research instrument in the sense that they reflect equally well a certain phenomenon, in our case cybersecurity. When analysing the individual-defined areas of cybersecurity from the point of view of reliability, the value of Cronbach’s alpha reaches 0.817930 for the area of cyber spying (CYBSPY). Then Cronbach’s alpha reaches the value of 0.882338 for the area of disrupting or reducing IT infrastructure resilience (DISRIT), 0.743745 for the area of Enemy campaigns (ENECAM), 0.839804 for the field disrupting or reducing eGovernment security (DISREG), and 0.846028 for the field cyberterrorism (CYBTER). Based on the presented values, it can be concluded that even the individual-defined areas show a high degree of internal consistency; therefore, it is possible to proceed with further analysis of the research instrument.
To analyse the research instrument itself, confirmatory factor analysis was selected as one of the structural equation modelling (SEM) tools. The reason for choosing this method was a predefined hypothetical structure in the form of a factor model. The foundations of factor analysis (FA) date back to the beginning of the 20th century [34], when efforts to test theories concerning the nature of intelligence led to the construction of FA logic and mathematics. FA belongs to the oldest statistical methods used to discover and describe latent variables (originally given only by the sample covariance between a set of indicators) [45]. It finds its wide application even today [39,40,41,42,43], it is especially appreciated by researchers conducting studies related to measurement [41,42,43] and developing models of interdependencies between explanatory entities (factors) and variables that need to be explained (indicators) [46]. Based on the common variance, which is shared among the set of indicators, the covariances that significantly differed from zero are observed between them. As known, general assumptions in FA are used: (i) common variance is caused by the factors and (ii) the number of factors of substantial interest is less than number of indicators. Based on these assumptions, it is not possible to estimate more factors than indicators, but in the interest of reduction, it makes no sense to maintain a model with the same number of factors and indicators [46].
Exploratory factor analysis (EFA) and confirmatory factor analysis (CFA) are two main categories of FA. There are some differences between them, but it is worth mentioning some of them: (1) The specification of the number of factors is not required in EFA. All potential solutions can theoretically be generated by the EFA computer process even without an exact determination of the number of factors. On the contrary, in CFA, the number of factors needs to be precisely defined. (2) The indicators can (theoretically) depend on all considered factors because there is no possibility to specify the exact correspondence between indicators and factors in EFA. However, in CFA, each indicator can depend only on the factor (factors) which is specified by the researchers in the defined theoretical model, i.e., in confirmatory analysis constrained measurement models are analysed. (3) In CFA, there is only one unique set of parameter estimates, as CFA models must be identified before they are analyzed. Therefore, CFA does not have a factor rotation phase. In contrast to this, in EFA, there is no unique set of statistical parameter estimates for a particular multifactor EFA model. This is related to the factor rotation phase in EFA. (4) The CFA procedure makes it possible to estimate, depending on the model, whether the specific variance of an indicator is shared between certain pairs of indicators (i.e., error correlations). In general, in EFA it is assumed that the specific variance of each indicator is not shared with any other indicator.

2.3. Methodology

When shaping the approach to solving CS issues at the organization/state level, it is important to support a culture of cybersecurity awareness among employees and stakeholders, which is related to the ability of individuals to proactively recognize and address cybersecurity risks [40]. Based on this, it is subsequently possible to formulate and enforce security measures in accordance with cyber safety—the important concept of Industry 4.0 [35]. Regarding the above-established research questions and goals mentioned above in sub-chapter 1.1, this research is structured into three distinct methodology phases: instrument development, data collection/analysis, and factor model development. The study is divided by the research methodology expressed in subsequent trajectory steps: (1) identifying constructs of interest, (2) developing a questionnaire, (3) pilot testing, (4) data collection and statistical analysis, (5) the factor model of cybersecurity (FMSC) developing, (6) confirmatory factor analysis and structural equation modelling (SEM).
A set of items or scales that are likely to measure a smaller set of abilities, traits, or constructs are analyzed using EFA. Thus, the decisions related to the selection of EFA concern the implementation of factor extraction techniques, the applied methods for setting the number of considered (retained) factors, and the use of the factor rotation method. Given these choices and data, the results of the analysis will indicate that the items measure a smaller number of factors. The researcher then decides on factor names based on the constructs, this decision is based on the factor loadings of the variables, relevant theory, and previous research. In CFA, deciding “What factors or constructs will underlie the model?” is based on previous research and relevant theories. As in the path analysis (PA), such a model is proposed, the basis of which are those variables that are at the centre of the researcher’s interest. The “fit” statistics then provide feedback regarding the adequacy of the model in explaining the data.
Figure 1 shows the limited measurement model in CFA for six indicators and two analyzed factors. The CFA model depicted in Figure 1 represents the hypothesis that factors A and B (which are assumed to be covariant) are measured by considered indicators X1X3, X4X6. The characteristics of such a standard theoretical CFA model (Figure 1) are as follows:
  • Each indicator is related to two causes and only one single factor. The error component (e) represents all unique effect sources;
  • The error components are independent of each other and at the same time independent of the factors;
  • All associations are linear, and factors are covariant.
In standard CFA models with two or more factors, some coefficients are zero. As can be seen in Figure 1, this happens if there is no direct path/trajectory from factor B to indicator X1. In such a case of specification, the corresponding parameter reaches a zero value, and thus CFA cannot calculate it. However, the null value of the direct causality influence does not mean that B and X1 are uncorrelated. An undirected relationship between B and X1 can exist, which can be expressed as follows:
X1AB
The analyzed path (relationship) may express statistical association, but not necessarily causality. Despite the zero value of the parameter for the pair B, X1, the structure coefficient can acquire a non-zero value for the same pair. The Pearson correlation between factor and indicator is estimated by structure parameter (any causal or non-causal association is reflected by it). The causes of errors in both methods (EFA, CFA) are precisely the inability to correctly distinguish between pattern and structural coefficients. [47].
The parameters/numbers (e.g., number “1”) listed next to the paths in Figure 1 (e.g., from factor A to the indicator X1) and in Equation (2) are scaling constants also denoted as unit limitation identification (ULI):
AX1 = 1.0 and BX4 = 1.0
These specifications scale factors in a metric related to the explained (normal) variance of the corresponding indicator metric or by reference/marker variable. If the assumption is met that the indicators of the same factor have the same reliable score, then any of the indicators is chosen as the reference value. The reference variable method is used by many software packages designed for SEM (with automatically scaled factors).
Other scaling constants presented in Figure 1, e.g., such as the one listed next to the path form e1 to X1 and expressed by Equation (3)
e1X1 = 1.0,
are ULIs, which assign to the sources of errors a metric related to the metric of unexplained variances in the respective indicator. Because measurement-restricted models are identified through their specification, there is no rotation phase in CFA.
Based on the facts mentioned above, confirmatory factor analysis, as one of the structural equation modelling tools, was chosen as the most suitable method for the analysis of the acquired data and the assumptions that were made within the framework of the theoretical factor model development.
In order to apply SEM to analyse covariance and mean structures, certain important assumptions about the data must be met. Data are required to be continuous and have a multivariate normal distribution. Based on the research conclusion of Rhemtulla [48] and Xia [49], where the application of classic cut-off estimators through the maximum likelihood (ML) method is also accepted, the requirement of continuity is also met for ordinal variables. Specifically, ordinal variables that have at least 5 response categories, can be considered as interval variables. These fundamental assumptions are linked to the theory of large samples (SEM is included among them) and are based on what approach is implemented to estimate coefficients through SEM. Whether it is the usually used ML method or a method based on the theory of generalised least squares (GLS) estimation.

The Model of Cybersecurity

The developed fundamental theoretical/hypothetical model of cybersecurity (FMCS), as one of the pillars of hybrid threats, is shown in Figure 2. The factor model itself is comprised of 39 endogenous variables which represent the items of the research instrument, where the respondents assigned the level of risk for individual items on a Likert scale ranging from 1 (no risk) to 5 (critical risk). The second component of the factor model is unobserved; these are exogenous variables that represent the partial pillars of Cybersecurity listed in sub-Section 2.2 (CYBSPY, DISRIT, ENECAM, DISREG, CYBTER).
Certain assumptions defined by basic statistical indicators are made about factor models analysed using CFA. In the first phase, in accordance with the theoretical model construct (Figure 2), a hypothetical data structure (factors, indicators, and relationships between them) was defined. In order to test the appropriateness of the verified model, selected indices and procedures were applied. Namely, the chi-square statistics as well as the overall indices of agreement with optimal values: (χ2/df < 2, RMSEA < 0.08, comparative index TLI > 0.90, CFI > 0.90, SRMR < 0.08); and sub-indexes (statistical significance of the coefficients of the model). The CFI and TLI index values range from 0 to 1; the appropriateness of the used model is indicated by values higher than 0.90. The following applies to the RMSEA index (root mean square error of approximation): good models have an RMSEA lower than 0.08, and the model is rejected if this index is higher than 0.1. In the chi-square test, the ratio chi-square/number of degrees of freedom is considered. In the chi-square test, the ratio “chi-square/number of degrees of freedom” is considered. If several models are available, the one with the lowest chi-square value is chosen as more suitable. Even if the chi-square is statistically insignificant in good models, this criterion is also considered for larger samples and is considered rather a strict criterion.
Table 2 provides an overview of the recommended values for the basic evaluation indices according to the bibliographic source [50] and is supplemented with the resulting values of the CFA analysis for the 5-factor FMSC model developed by the authors.
Based on the results shown in Table 2, it can be concluded that all the applied evaluation criteria for the suitability of the theoretical factor model (Figure 2) are within the required intervals. It can, therefore, be concluded that the created hypothetical model confirms the fact that it is applicable in this form, as it shows a good degree of agreement with real data. This statement is confirmed also by values of other indicators: χ2 = 507.962, df = 468, p = 0.098, and it is in accordance with the theory presented in [40,43,47,60,61].

3. The Results of Statistical Analysis

3.1. The Results of Statistical Analysis

The analysis of the 5-factor model of cybersecurity (Figure 2) for the entire research set (N = 964) itself is provided in individual tables (Table 3, Table 4, Table 5, Table 6 and Table 7). The first conclusion of the analysis presented in Table 3, Table 4, Table 5, Table 6 and Table 7 is the fact that all items of the research instrument significantly influence the individual-defined pillars of cybersecurity at the significance level of α = 0.05. In the next stage, the analysis of the individual pillars of cybersecurity separately is performed.

3.1.1. Cyber Spying (CYBSPY)

The first defined pillar is the exogenous variable CYBSPY (cyber spying). Cyber spying comprises a total of 9 items (CSPYQ1 to CSPYQ9) of the research instrument (listed in Table 3), which are defined further in the text and under Table 3. Respondents were assigned the lowest level of risk (low risk) in comparison with the other items to the item CSPYQ3, with a value of the standardised regression weight at the level of 0.295 (p < 0.001). The respondents therefore do not consider the resolution of cybersecurity through outsourcing to be a significant risk in the field of cyber spying.
Table 3. Estimates of the parameters of the cyber spying pillar for the entire research set (N = 964).
RelationshipEstimateStd. EstimateStd. Errort-Statisticp-Value
CSPYQ1<---CYBSPY1.0000.6200.06215.214<0.001 *
CSPYQ2<---CYBSPY0.8650.5410.06513.377<0.001 *
CSPYQ3<---CYBSPY0.4300.2950.0518.448<0.001 *
CSPYQ4<---CYBSPY1.1120.6350.07015.954<0.001 *
CSPYQ5<---CYBSPY1.1350.6580.07415.289<0.001 *
CSPYQ6<---CYBSPY1.1080.6080.07714.448<0.001 *
CSPYQ7<---CYBSPY1.1420.6430.07914.471<0.001 *
CSPYQ8<---CYBSPY1.1540.6500.07615.210<0.001 *
CSPYQ9<––CYBSPY1.0170.5640.07513.560<0.001 *
*—significant at the level of significance α = 0.05, Estimate—regression weight, Std. Estimate—standardised regression weight, Std. error—standard error, tt-statistic, p—probability level, CYBSPY–Cyber spying as the first pillar of the questionnaire, CSPYQ1CSPYQ9—the 9 items of the pillar CYBSPY. (CSPYQ1—insufficient allocation of cybersecurity funds, CSPYQ2—some ICT manufacturers and suppliers have ties to governments and security forces of other countries, CSPYQ3—cybersecurity is carried out by means of outsourcing, CSPYQ4—cybersecurity is not solved systemically, only operatively, CSPYQ5—cybersecurity policies are poorly set and applied, CSPYQ6—employees are examined insufficiently, CSPYQ7—insufficient education and training of employees in the field of cybersecurity, CSPYQ8—purchase of ICT through insufficiently verified third-party agents without knowing the product chain, CSPYQ9—sensitive information at risk of being leaked due to unauthorised use or due to the fact that the staff works using devices in their personal ownership (PCs, telephones, tablets).
In contrast, the most significant item of the research instrument in terms of the risk of cyber spying is item CSPYQ5 (inappropriately set and applied cybersecurity policies) with a standardised regression weight value of 0.658 (p < 0.001). It is followed by item CSPYQ8 (purchase of ICT through insufficiently verified intermediaries and without knowledge of the product chain) with a value of the standardised regression weight of 0.650 (p < 0.001). The third most significant item of the research instrument that affects cyber spying is the item CSPYQ7 (0.643, p < 0.001), which relates to insufficient training of employees in the field of cybersecurity. Other items of the research instrument that makeup cybersecurity and to which the respondents assigned a high level of risk (Std. Estimate > 0.600) are the next items. Item CSPYQ4 (0.635, p < 0.001), states that cybersecurity is not solved comprehensively, but only operationally; item CSPYQ1 (0.620, p < 0.001), which relates to the issue of insufficient allocation of finances to the issue of cybersecurity; and item CSPYQ6 (0.608, p < 0.001), which is devoted to the issue of insufficient screening of employees.
Respondents assigned a medium level of risk to the fact that sensitive information is exposed to the risk of unauthorised use due to the use of private resources (PC, phone, tablet) for work purposes, represented by item CSPYQ9 (0.564, p < 0.001). Medium level of risk was also assigned to the fact that some ICT manufacturers and suppliers have ties to the governments and security forces of other states. This fact is represented in the research instrument by an item labelled CSPYQ2, with a standardised regression weight of 0.541 (p < 0.001).

3.1.2. Disrupting or Reducing IT Infrastructure Resilience (DISRIT)

The second pillar of cybersecurity per the factor model (Figure 2) is the pillar called disrupting or reducing IT infrastructure resilience (DISRIT), the basic analysis of which is presented in Table 4. The DISRIT pillar itself is made up of 12 items (DRITQ1–DRITQ12 are defined further in the text and under Table 4) of the research instrument, and as many as 9 of them were assigned a high level of risk by the respondents (Std. Estimate > 0.600).
Table 4. Estimates of parameters of the pillar disrupting or reducing IT infrastructure resilience for the entire research set (N = 964).
RelationshipEstimateStd. EstimateStd. Errort-Statisticp-Value
DRITQ1<---DISRIT1.0000.6690.07216.216<0.001 *
DRITQ2<---DISRIT0.9510.6610.05118.490<0.001 *
DRITQ3<---DISRIT0.8920.6270.05017.839<0.001 *
DRITQ4<---DISRIT0.9310.5820.05915.697<0.001 *
DRITQ5<---DISRIT0.9220.6450.05616.556<0.001 *
DRITQ6<---DISRIT0.7410.5170.05014.898<0.001 *
DRITQ7<---DISRIT0.9230.6180.05716.066<0.001 *
DRITQ8<---DISRIT0.9370.6130.05417.313<0.001 *
DRITQ9<---DISRIT0.9310.5830.05616.556<0.001 *
DRITQ10<---DISRIT1.0480.6790.05519.136<0.001 *
DRITQ11<---DISRIT0.9560.6560.05517.224<0.001 *
DRITQ12<---DISRIT0.9280.6220.05317.420<0.001 *
*—significant at the level of significance α = 0.05, Estimate—regression weight, Std. Estimate—standardised regression weight, Std. Error—standard error, tt-statistic, p—probability level, DISRIT—disrupting or reducing IT infrastructure resilience, the second pillar of the research instrument. DRITQ1DRITQ12—the 12 items of the pillar DISRIT. (DRITQ1—Risk of attacking critical information infrastructure by cyber-attacks through cyber spying, criminal organisations, hackers, etc., DRITQ2—lack of funds to ensure the necessary technical courses and hire workers with verified expertise in ICT and cybersecurity, DRITQ3—strategic industries are not included in the critical infrastructure and their selected information systems cannot be included in the critical information infrastructure, DRITQ4—state/public administration employees are not sufficiently aware of cybersecurity, DRITQ5—security testing not being systematically carried out, DRITQ6—attacks on information infrastructure by means of production, supply and subcontracting chains, DRITQ7—incorrect prioritising of some governmental bodies and institutions in planning their investment in security technologies and other ICT, DRITQ8—insufficient amendment of cybercrime legislation, DRITQ9—use of obsolete information infrastructure systems, DRITQ10—fragmentation of systems of communication in state/public administration not allowing their adequately efficient use, maintenance and check-up in real time, DRITQ11—absence of central methodologies for the use of computing means, especially mobile devices, DRITQ12—absence of the mandatory securing of e-mails (commercial encryption) and other electronic communication in use of international as well as national institutions).
The most significant item (with a high level of risk) is item DRITQ10, which relates to the issue of the fragmentation of systems of communication resources in state/public administration, which does not enable adequate effective use of maintenance, security, and control in real time, with a value of the standardised regression weight of 0.679 (p < 0.001). In order from the highest risk, the next item is DRITQ1, which relates to the risk of critical information infrastructure being attacked by cyber-attacks (0.669, p < 0.001) with an equally high level of risk. According to the importance of research instrument items represented by the standardised regression weight, the third risk according to the respondents is item DRITQ2, which is devoted to insufficient funds for providing the necessary technical courses and hiring security-vetted experts in ICT and cybersecurity, with a standardised regression weight value of 0.661 (p < 0.001). The high level of risk was assigned by the respondents to the following items: DRITQ11 (lack of central methodologies for using computing equipment, especially mobile devices), DRITQ5 (non-systematically implemented security testing); DRITQ3 (strategic industrial branches are not included in critical infrastructure, and their selected information systems, therefore, cannot be included in critical information infrastructure); DRITQ12 (absence of an obligation for secured (commercially encrypted) email and other electronic communication by interstate/public institutions and state/public administration workers); DRITQ7 (incorrect prioritising of some departments and institution when planning investment in security technologies and other ICT) and DRITQ8 (insufficient legislative regulation of cybercrime). From the point of view of a high level of risk, the priority issue for the analysed cybersecurity pillar is above all technical security and the method of its provision. In the respondents’ opinion, the insufficient allocation of resources to this area as well as the absence of legislation in the field of cybersecurity are of no small importance. Respondents assigned a medium level of risk to research instrument item DRITQ9 of the analysed cybersecurity pillar, which relates to the use of outdated information infrastructure systems, and the standardised regression weight was at 0.583 (p < 0.001), followed by item DRITQ4 (rmployees of the state/public administration do not have sufficient cybersecurity awareness) with a standardised regression weight value of 0.582 (p < 0.001) and item DRITQ6, which gives priority to the possibilities of attacks on information infrastructure through the production, supply, and subcontractor chain (0.517, p < 0.001).

3.1.3. Enemy Campaigns (ENECAM)

The third pillar of cybersecurity according to the FMCS (Figure 2), defined as enemy campaigns (ENECAM), is analysed in Table 5 and comprises a total of 5 items labelled ECQ1 to ECQ2 (they are defined further in the text and under Table 5). Based on the CFA results, it can be stated that the respondents (N = 964) assigned the highest level of risk (at the level of high risk) to research instrument item ECQ3, with the value of the standardised regression weight of 0.677 (p < 0.001). This item relates to the ownership structure of individual Internet media, which may follow various private interests or the interests of other states in their behaviour. The second most significant item with a high level of risk is item ECQ4, which looks at insufficient vetting of state/public administration employees who may work for third parties. The standardised regression weight of item ECQ4 is 0.641 (p < 0.001). The last research instrument item from the enemy campaigns pillar to which respondents assigned a high level of risk, is item ECQ1, which relates to the issue of possible social unrest caused by hostile campaigns (0.622, p < 0.001). A medium level of risk was assigned by respondents to the item ECQ5 (current legislation on free access to information, which may threaten cybersecurity or can be misused within information campaigns), with the standardised regression weight of 0.553 (p < 0.001). Also, to the item ECQ2 (wide use of the social network environment due to their international aspect and different approach to freedom of speech, which makes it possible to use them to a greater extent to spread hate and disinformation campaigns), with the standardised regression weight at 0.531 (p < 0.001). Here it can be noticed that a relatively dangerous tendency exists towards the possibility of limiting freedom of speech given the possibility of spreading enemy campaigns in order to minimise their risk.
Table 5. Estimates of the parameters of the Enemy campaigns pillar for the entire research set (N = 964).
RelationshipEstimateStd. EstimateStd. Errort-Statisticp-Value
ECQ1<---ENECAM1.0000.6220.06115.834<0.001 *
ECQ2<---ENECAM0.8270.5310.05216.050<0.001 *
ECQ3<---ENECAM1.0120.6770.06316.021<0.001 *
ECQ4<---ENECAM0.9910.6410.06315.690<0.001 *
ECQ5<---ENECAM0.8500.5530.06313.445<0.001 *
*—significant at the level of significance α = 0.05, Estimate—regression weight, Std. Estimate—standardised regression weight, Std. Error—standard error, tt-statistic, p—probability level, ENECAM—Enemy campaigns, ECQ1ECQ5—the 5 items of the ENECAM pillar. (ECQ1—online influencing and disinformation campaigns may have a major impact on evoking the mood in the population (provoking social unrest), ECQ2—wide use of social networks, their international aspect and ambiguous approach to freedom of speech, enables the spreading of hate and disinformation campaigns, ECQ3—structure of ownership of individual online media enabling them to pursue various private interests or interests of other countries in their news reports, ECQ4—insufficient review of state/public administration employees who may work in favour of third parties, ECQ5—current legislation on free access to information may endanger cybersecurity or can be abused in information campaigns).

3.1.4. Disrupting or Reducing eGovernment Security (DISREG)

The results of statistical analysis of the fourth pillar of cyber threats according to the model defined in Figure 2, i.e., the pillar labelled disrupting or reducing eGovernment security (DISREG), are shown in Table 6. This pillar DISREG comprises 6 items GREGQ1GREGQ6, which are defined in the text and under Table 6.
Table 6. Estimates of parameters of the pillar Disrupting or reducing eGovernment security for the entire research set (N = 964).
RelationshipEstimateStd. EstimateStd. Errort-Statisticp-Value
GREGQ1<---DISREG1.0000.6660.05619.662<0.001 *
GREGQ2<---DISREG1.0590.7070.05220.282<0.001 *
GREGQ3<---DISREG1.1210.7410.05619.839<0.001 *
GREGQ4<---DISREG0.9960.7210.05119.397<0.001 *
GREGQ5<---DISREG1.0600.7160.05519.415<0.001 *
GREGQ6<---DISREG0.9390.6240.06314.890<0.001 *
*—significant at the level of significance α = 0.05, Estimate—regression weight, Std. Estimate—standardised regression weight, Std. Error—standard error, tt-statistic, p—probability level, DISREG—Disrupting or reducing e-government security, GREGCQ1GREGCQ6—the 6 items of the DISREG pillar. (GREGQ1—insufficient financing of cybersecurity and insufficient financial evaluation of cybersecurity workers, GERGQ2—underestimating cyber threats in state/public administration, GERGQ3—insufficient investment in information and cyber systems of state/public administration serving as means of communication between citizens and the state, GERGQ4—the poor setting of cybersecurity policy from the state level, GREGQ5—insufficient education of state/public administration employees regarding cybersecurity, GERGQ6—low level of awareness and education of the population on cybersecurity).
Compared to the other defined pillars, the value of the standardised regression weight is greater than 0.700 for the majority of the research instrument items that make up this pillar (Figure 2), which is still a high risk in terms of the risk level. The most significant research instrument item of the DISREG pillar is item GREGQ3, which relates to the issue of Insufficient security of information and cyber systems of state/public administration, which serve to communicate between citizens and the state, with a standardised regression weight of 0.741 (p < 0.001). The second largest problem according to the respondents is item GREGQ4 with a standardised regression weight of 0.721 (p < 0.001). This item is devoted to the issue of Poor setting of the cybersecurity policy at the state level, followed by item GREGQ5 Insufficient education of state/public administration employees regarding cybersecurity (0.716, p < 0.001) and item GREGQ2 (underestimating cyber threats in state/public administration) (0.707, p < 0.001). From the viewpoint of this first group of threats within the DISREG pillar, the most significant according to the respondents is the insufficient security of the information systems, the poor setting of the security policy, the insufficient training of employees and the underestimating of cyber threats. The common denominator of these risks is the policy of the state itself in this critical area, which, from the respondents’ point of view is insufficient and is not given adequate attention. The second group of risks which still represent a high risk are GREGQ1 (insufficient financing of cybersecurity and insufficient financial assessment of workers in the field of cybersecurity) with a standardised regression weight of 0.666 (p < 0.001) and GREGQ6 (low level of awareness and education of the population on cybersecurity), where the value of the standardised regression weight is 0.624 (p < 0.001). In this group of risks, the dominant problem, of course, is the financing of the issue of cybersecurity and the very awareness of low level of awareness about cybersecurity. This research instrument item (GREGQ6) is in a way complementary to the item GREGQ5. On the one hand, there is an assumption that employees do not have sufficient awareness and education about the issue of cybersecurity; on the other hand, however, our respondents think adequate education in this area is not provided by the state. Therefore, here space is created for the removal of these combined risks by the state.

3.1.5. Cyberterrorism (CYBTER)

The analysis results of the last (the fifth) pillar of cyber threats (Figure 2), namely cyberterrorism (CYBTER) are presented in Table 7. The CYBTER consists of 7 items labelled CTQ1 to CTQ7, which are defined further in the text and under Table 7. The respondents identified item CTQ6 of the research instrument, which relates to the possibility of managing sympathisers by third parties primarily by inducing their activity against possible targets, planning terrorist operations, providing feedback, etc., as the most significant high-level risk. The value of the standardised regression weight of this item is 0.730 (p < 0.001). The second most significant issue according to the research sample is item CTQ4, with a standardised regression weight value of 0.705 (p < 0.001), which concerns the possibility of obtaining sensitive information of an intelligent nature for the purpose of using it in a kinetic terrorist attack (selection of specific targets, etc.). This first group of risks, which is, however, the most significant according to the respondents, primarily concerns risks associated with information as such and its potential misuse. The second group of threats that the respondents assigned a high level of risk to are research instrument item CTQ5 (spreading propaganda and materials to support followers of radicalisation and their recruitment) with a value of the standardised regression weight of 0.677 (p < 0.001) and item CTQ7 (low preparedness of the security forces for the specific digital environment and action in it) with a regression weight value of 0.619 (p < 0.001). The respondents assigned a medium level of risk to items CTQ3 (energy blackout), CTQ1 (blackmail of state authorities, business corporations or intimidation of the company) and CTQ2 (destruction of specific technology (information, production, operation)), which already have the character of a specific terrorist activity using cyber and computer systems. Of genuine interest is that the respondents attach a lower measure of risk to a specific possible consequence of cyberterrorism, such as the shutdown of electricity distribution than to the misuse of information for management and terrorist purposes.
Table 7. Estimates of the parameters of the pillar cyberterrorism for the entire research set (N = 964).
RelationshipEstimateStd. EstimateStd. Errort-Statisticp-Value
CTQ1<---CYBTER1.0000.5840.05716.453<0.001 *
CTQ2<---CYBTER0.9920.5700.05817.054<0.001 *
CTQ3<---CYBTER1.1040.5990.06816.120<0.001 *
CTQ4<---CYBTER1.1960.7050.07216.542<0.001 *
CTQ5<---CYBTER1.2230.6770.07815.660<0.001 *
CTQ6<---CYBTER1.2960.7300.07616.990<0.001 *
CTQ7<---CYBTER1.0990.6190.07115.410<0.001 *
*—significant at the level of significance α = 0.05, Estimate—regression weight, Std. Estimate—standardised regression weight, Std. Error—standard error, tt-statistic, p—probability level, CYBTER—Cyberterrorism, CTQ1CTQ7—the 7 items of the CYBTER pillar. (CTQ1—Blackmail of state authorities, commercial corporations or intimidation of society, CTQ2—the destruction of a specific technology (information, manufacturing, operating), CTQ3—energy distribution (energy blackout), CTQ4—acquisition of sensitive intelligence information for their use in a kinetic terrorist attack (selection of specific goals, etc.), CTQ5—spread of propaganda and materials aimed at the radicalisation of supporters and their recruitment, CTQ6—management of sympathisers by using third parties, in particular, to evoke activities against possible goals, planning of terrorist operations, providing feedback, etc., CTQ7—low readiness of security forces to operate within the specific digital environment).
It is undoubtedly necessary, however, to pay attention to the mutual links between the individual-defined pillars of cybersecurity (Figure 2). A basic analysis of these links in terms of the model shown in Figure 2 is provided in Table 8.
In terms of the statistical significance of mutual links between the individual-defined pillars of cybersecurity according to the theoretical factor model (Figure 2), all the links are significant at the chosen level of significance α = 5%. However, the highest value of the correlation coefficient between the CYBSPY pillar and the DISRIT pillar (0.909, p < 0.001) was observed. Therefore, it is clear that the respondents consider the problem of cyber spying and disrupting or reducing the resilience of IT infrastructure to be the most significant complementary relationship. At the same time, it can be proclaimed that by increasing the risk of the CYBSPY pillar, the risk of the DISRIT cybersecurity pillar will also conditionally increase. The second most significant relationship in the view of the respondents is the link between the DISRIT and DISREG pillars (0.837, p < 0.001), followed by the relationship between the CYBTER and ENECAM pillars, with a correlation coefficient value of 0.815 (p < 0.001).
Table 8. Analysis of the relationships between the pillars of cybersecurity for the entire research set (N = 964).
RelationshipCovarianceCorrelation
EstimateStd. Errort-Staticp-ValueEstimate
CYBSPY<-->CYBTER0.2250.02110.583<0.000 *0.708
DISRIT<-->DISREG0.3490.02613.461<0.000 *0.837
DISRIT<-->ENECAM0.2950.02511.847<0.000 *0.732
CYBSPY<-->DISREG0.2790.02311.881<0.000 *0.769
DISRIT<-->CYBTER0.2810.02411.794<0.000 *0.769
CYBSPY<-->ENECAM0.2510.02211.337<0.000 *0.715
CYBSPY<-->DISRIT0.3170.02512.913<0.000 *0.909
DISREG<-->ENECAM0.3280.02712.346<0.000 *0.783
CYBTER<-->ENECAM0.2990.02611.669<0.000 *0.815
CYBTER<-->DISREG0.2920.02412.085<0.000 *0.771
*—significant at the level of significance α = 0.05, Estimate—regression weight, Std. Estimate—standardised regression weight, Std. Error—standard error, tt-statistic, p—probability level, CYBSY—cyber spying, CYBTER—cyberterrorism, DISRIT—disrupting or reducing IT infrastructure resilience, ENECAM—enemy campaigns, DISREG—disrupting or reducing e-government security.
In contrast, respondents assigned the lowest level of importance, even though statistically significant in the sense of Cohen’s scale, to the connection between CYBSY and CYBTER with the value of the correlation coefficient of 0.708 (p < 0.001). At the same time, when analysing the importance of the individual pillars of cyber threats, the respondents view the DISRIT pillar as the most important, with a share of 22.284%, followed by the DISREG pillar with a share of 21.842%. The ENECAM pillar achieves a 19.532% share, the CYBTER pillar an 18.381% share, and the last defined of the cyber threats pillar, CYBSY, reaches a 17.961% share. These relatively balanced values of the shares of the individual pillars on the hybrid cybersecurity threat indicate that the respondents perceive their risk in a relatively balanced way, and all pillars are at the same time statistically significant at the chosen level of significance.

4. Results and Discussion

The performed analysis of the factor theoretical model of the hybrid threat cybersecurity for the entire research group (N = 964) within the study is followed by the detection of differences in the perception of individual defined pillars of this hybrid threat between respondents from the Slovak and Czech Republics. It would certainly be interesting to observe such differences between other groups, too (gender, age, degree, and form of study), but analysing these groups would make the study too extensive. The authors will focus on the analysis of these other groups and the differences in the perception of the individual-defined pillars of hybrid threat cybersecurity in further planned studies.

Analysis of Differences in Perception of the Pillars of Cybersecurity between Students of the Slovakia and Czech Republic

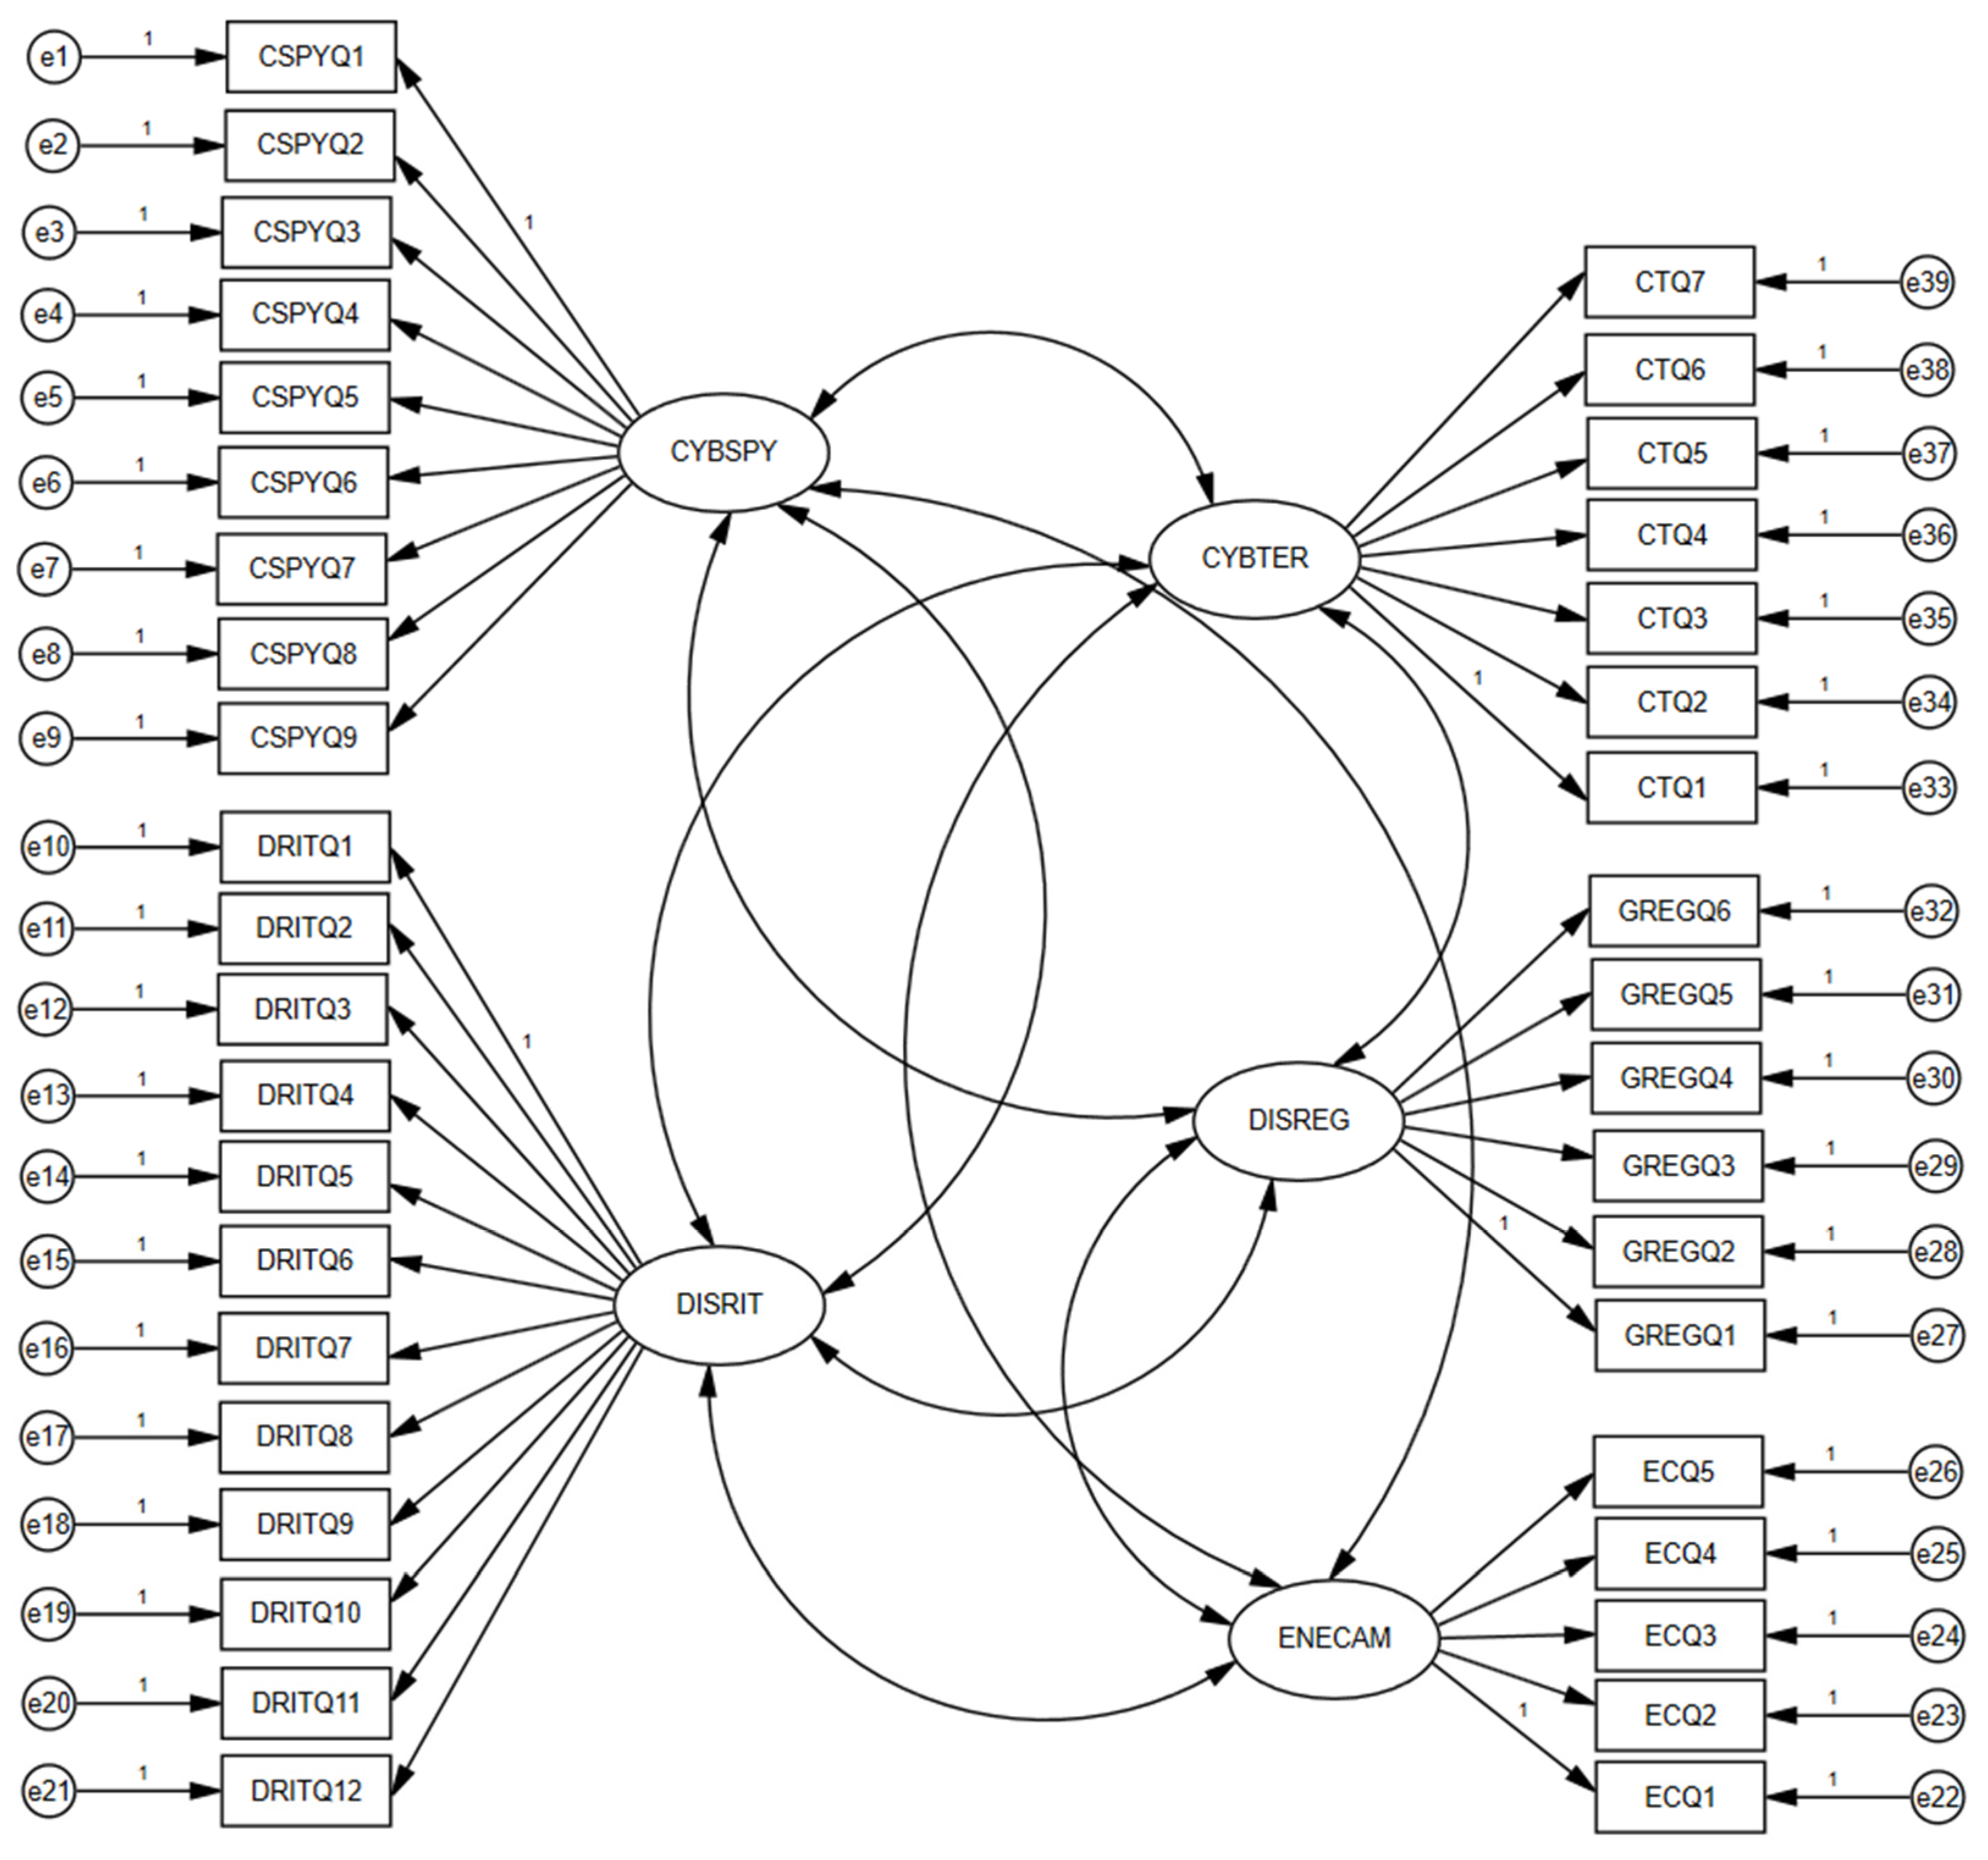
Based on the theoretical factor model (Figure 2), the researchers in the next round created partial models, especially for respondents from Slovakia (N = 580) and especially for respondents from the Czech Republic (N = 384). Based on Table 9, it can be stated that both partial models of cybersecurity in the sense of the defined criteria show high agreement with the data obtained using the author’s research instrument and are therefore applicable for drawing correct conclusions.
The differences themselves in the perception of the individual-defined pillars of Cybersecurity in terms of the theoretical factor model (Figure 2) between Slovak (SK) and Czech (CZ) respondents can be observed from two points of view. The first is the assigning of importance to the individual items of the research instrument; the second is the assigning of the degree of risk of the individual items of the research instrument. More detailed differences in perception within the individual pillars of cybersecurity are shown in Table 10, Table 11, Table 12, Table 13 and Table 14, and in the analysis, we focus only on the most important ones.
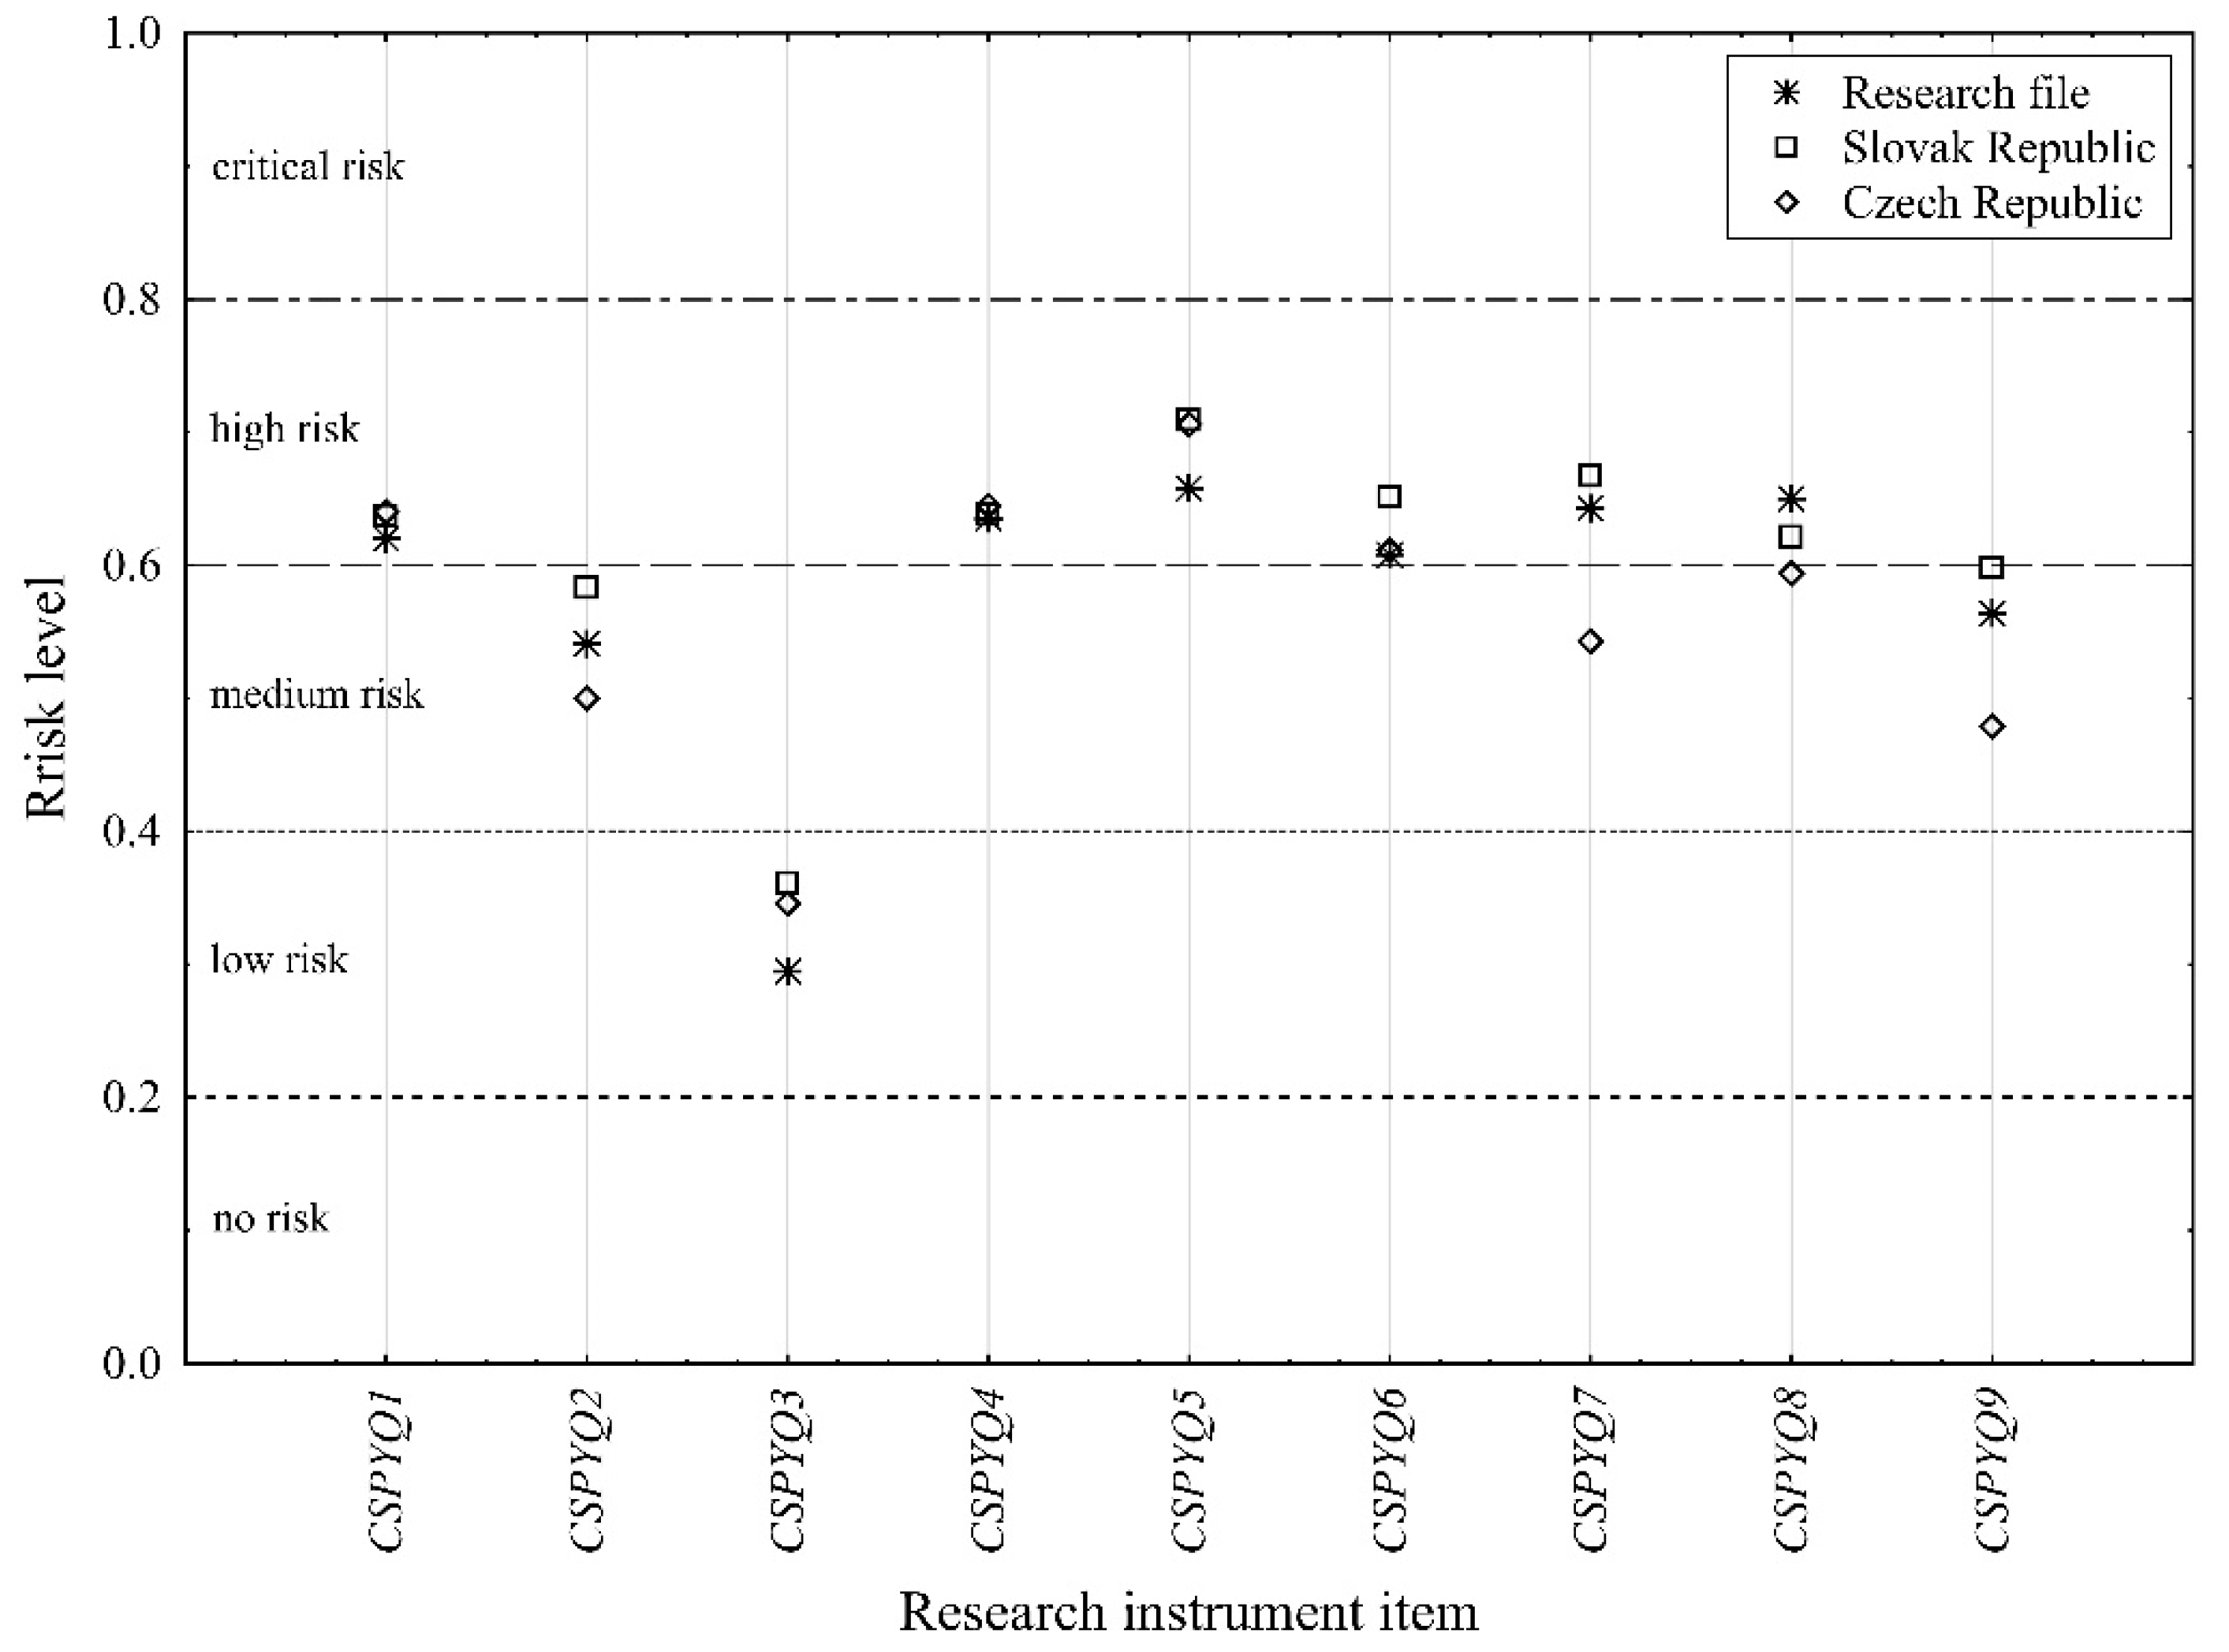
Table 10 presents the results of the statistical analysis of data obtained from the Slovak and Czech Republics in the sense of the partial models of the first defined pillar CYBSPY (Figure 2). The first conclusion is that both SK and CZ respondents consider inappropriate cybersecurity policies (CSPYQ5) as the most significant problem with a high degree of risk assigned (0.709 for SK, 0.701 for CZ). At the same time, both groups of respondents assigned a low degree of risk (0.361 for SK, 0.346 for CZ) to the problem that the cybersecurity solution is solved through outsourcing (CSPYQ3). For respondents from Slovakia, the second most important problem in the field of Cyber spying is that of the insufficient training of employees in the field of cybersecurity (CSPYQ7), and they assigned it a high degree of risk (0.667, p < 0.000), while for respondents from the Czech Republic, this issue is ranked in sixth place of importance with a medium level of risk (0.543, p < 0.000). For the respondents of the CZ group, the second most important problem is the question of a comprehensive and systemic solution to cybersecurity (CSPYQ4), with a high degree of risk (0.645, p < 0.000), while for the respondents of the SK group, this problem is fourth in order but with an equally high degree of risk (0.638, p < 0.000). Third place in order of importance for SK respondents is the problem of insufficient screening of employees (CSPYQ6), with a high degree of risk, while for CZ respondents this same place of importance belongs to the problem of insufficient allocation of funds to the issue of cybersecurity (CSPYQ1), with a high degree of risk (0.640, p< 0.000). A graphic depiction of the differences in the perception of the risk of individual items of the cyber spying (CYBSPY) pillar of the hybrid cybersecurity threat between the SK and CZ respondents, including the entire research file, is shown in Figure 3.
An analysis of the differences of the second defined pillar of the hybrid threat cybersecurity in terms of the theoretical model (Figure 2), namely the pillar disrupting or reducing IT infrastructure resilience (DISRIT), between SK respondents and CZ respondents is presented in Table 11. In this case, too, we focus only on the most significant differences between the assessed groups, either from the point of view of the level of risk or the order of importance of the individual items of the research instrument.
Table 11. Estimates of the parameters of the pillar disrupting or reducing IT infrastructure resilience for respondents from the Slovak and Czech Republics.
RelationshipSlovak RepublicCzech Republic
Est.Std. Est.tpEst.Std. Est.tp
DRITQ1<---DISRIT1.0000.78616.237<0.000 *1.0000.59610.264<0.000 *
DRITQ2<---DISRIT0.7870.69416.035<0.000 *1.1960.62710.508<0.000 *
DRITQ3<---DISRIT0.6880.61914.263<0.000 *1.3350.68311.355<0.000 *
DRITQ4<---DISRIT0.7510.57712.812<0.000 *1.0270.5189.065<0.000 *
DRITQ5<---DISRIT0.7490.67314.234<0.000 *1.3280.70111.433<0.000 *
DRITQ6<---DISRIT0.6540.58413.498<0.000 *0.9240.4738.536<0.000 *
DRITQ7<---DISRIT0.8220.68615.870<0.000 *1.0000.5257.960<0.000 *
DRITQ8<---DISRIT0.7450.63914.817<0.000 *1.1720.55910.060<0.000 *
DRITQ9<---DISRIT0.8930.70316.153<0.000 *0.9810.4828.244<0.000 *
DRITQ10<---DISRIT0.9080.73316.949<0.000 *1.0640.5319.274<0.000 *
DRITQ11<---DISRIT0.7920.67015.506<0.000 *0.9200.5098.460<0.000 *
DRITQ12<---DISRIT0.8560.69816.054<0.000 *0.8050.4387.880<0.000 *
*—significant at the level of significance α = 0.05, Est.—regression weight, Std. Est.—standardised regression weight, tt-statistic, p—probability level, DISRIT—disrupting or reducing IT infrastructure resilience.
For respondents from the SK group, the most significant problem of the pillar DISRIT with a high degree of risk is the one that relates to the risk of critical information infrastructure being attacked by cyber-attacks (DRITQ1), with a standardised regression weight value of 0.786 (p < 0.000). This same issue is in fourth place in terms of importance for the CZ respondents, and they assigned it a medium level of risk (0.596, p < 0.000). In contrast, for CZ respondents, the most important security issue is related to unsystematically implemented security testing, with a high degree of risk (0.701, p < 0.000), while for the SK respondents, this issue is only in seventh place, though it is assigned an equally high degree of risk (0.673, p < 0.000). The second most significant threat of the DISRIT pillar for respondents from the SK group is that of fragmentation of the systems of communication means of public administration (DRITQ10), with an assigned high level of risk (0.732, p < 0.000), while the CZ respondents assigned this issue a medium level of risk (0.531, p < 0.000) and ranked it sixth in the order of importance. The second most important problem for the group of CZ respondents is the issue of not including strategic industries in critical infrastructure, with a high degree of risk (0.683, p < 0.000), while this problem is also perceived by SK respondents with an equally high degree of risk (0.619, p < 0.000), though it is in tenth place in terms of order. The third most important issue of the DISRIT pillar for SK respondents is that of using outdated information infrastructure systems (DRITQ9), with a high degree of risk (0.703, p < 0.000). The CZ respondents put this issue in eleventh place in terms of importance, with a medium level of risk (0.482, p < 0.000). In order of importance, the CZ respondents put the issue of a lack of funds for selected areas of cybersecurity (DRITQ2) in third place, with a high degree of risk assigned (0.627, 
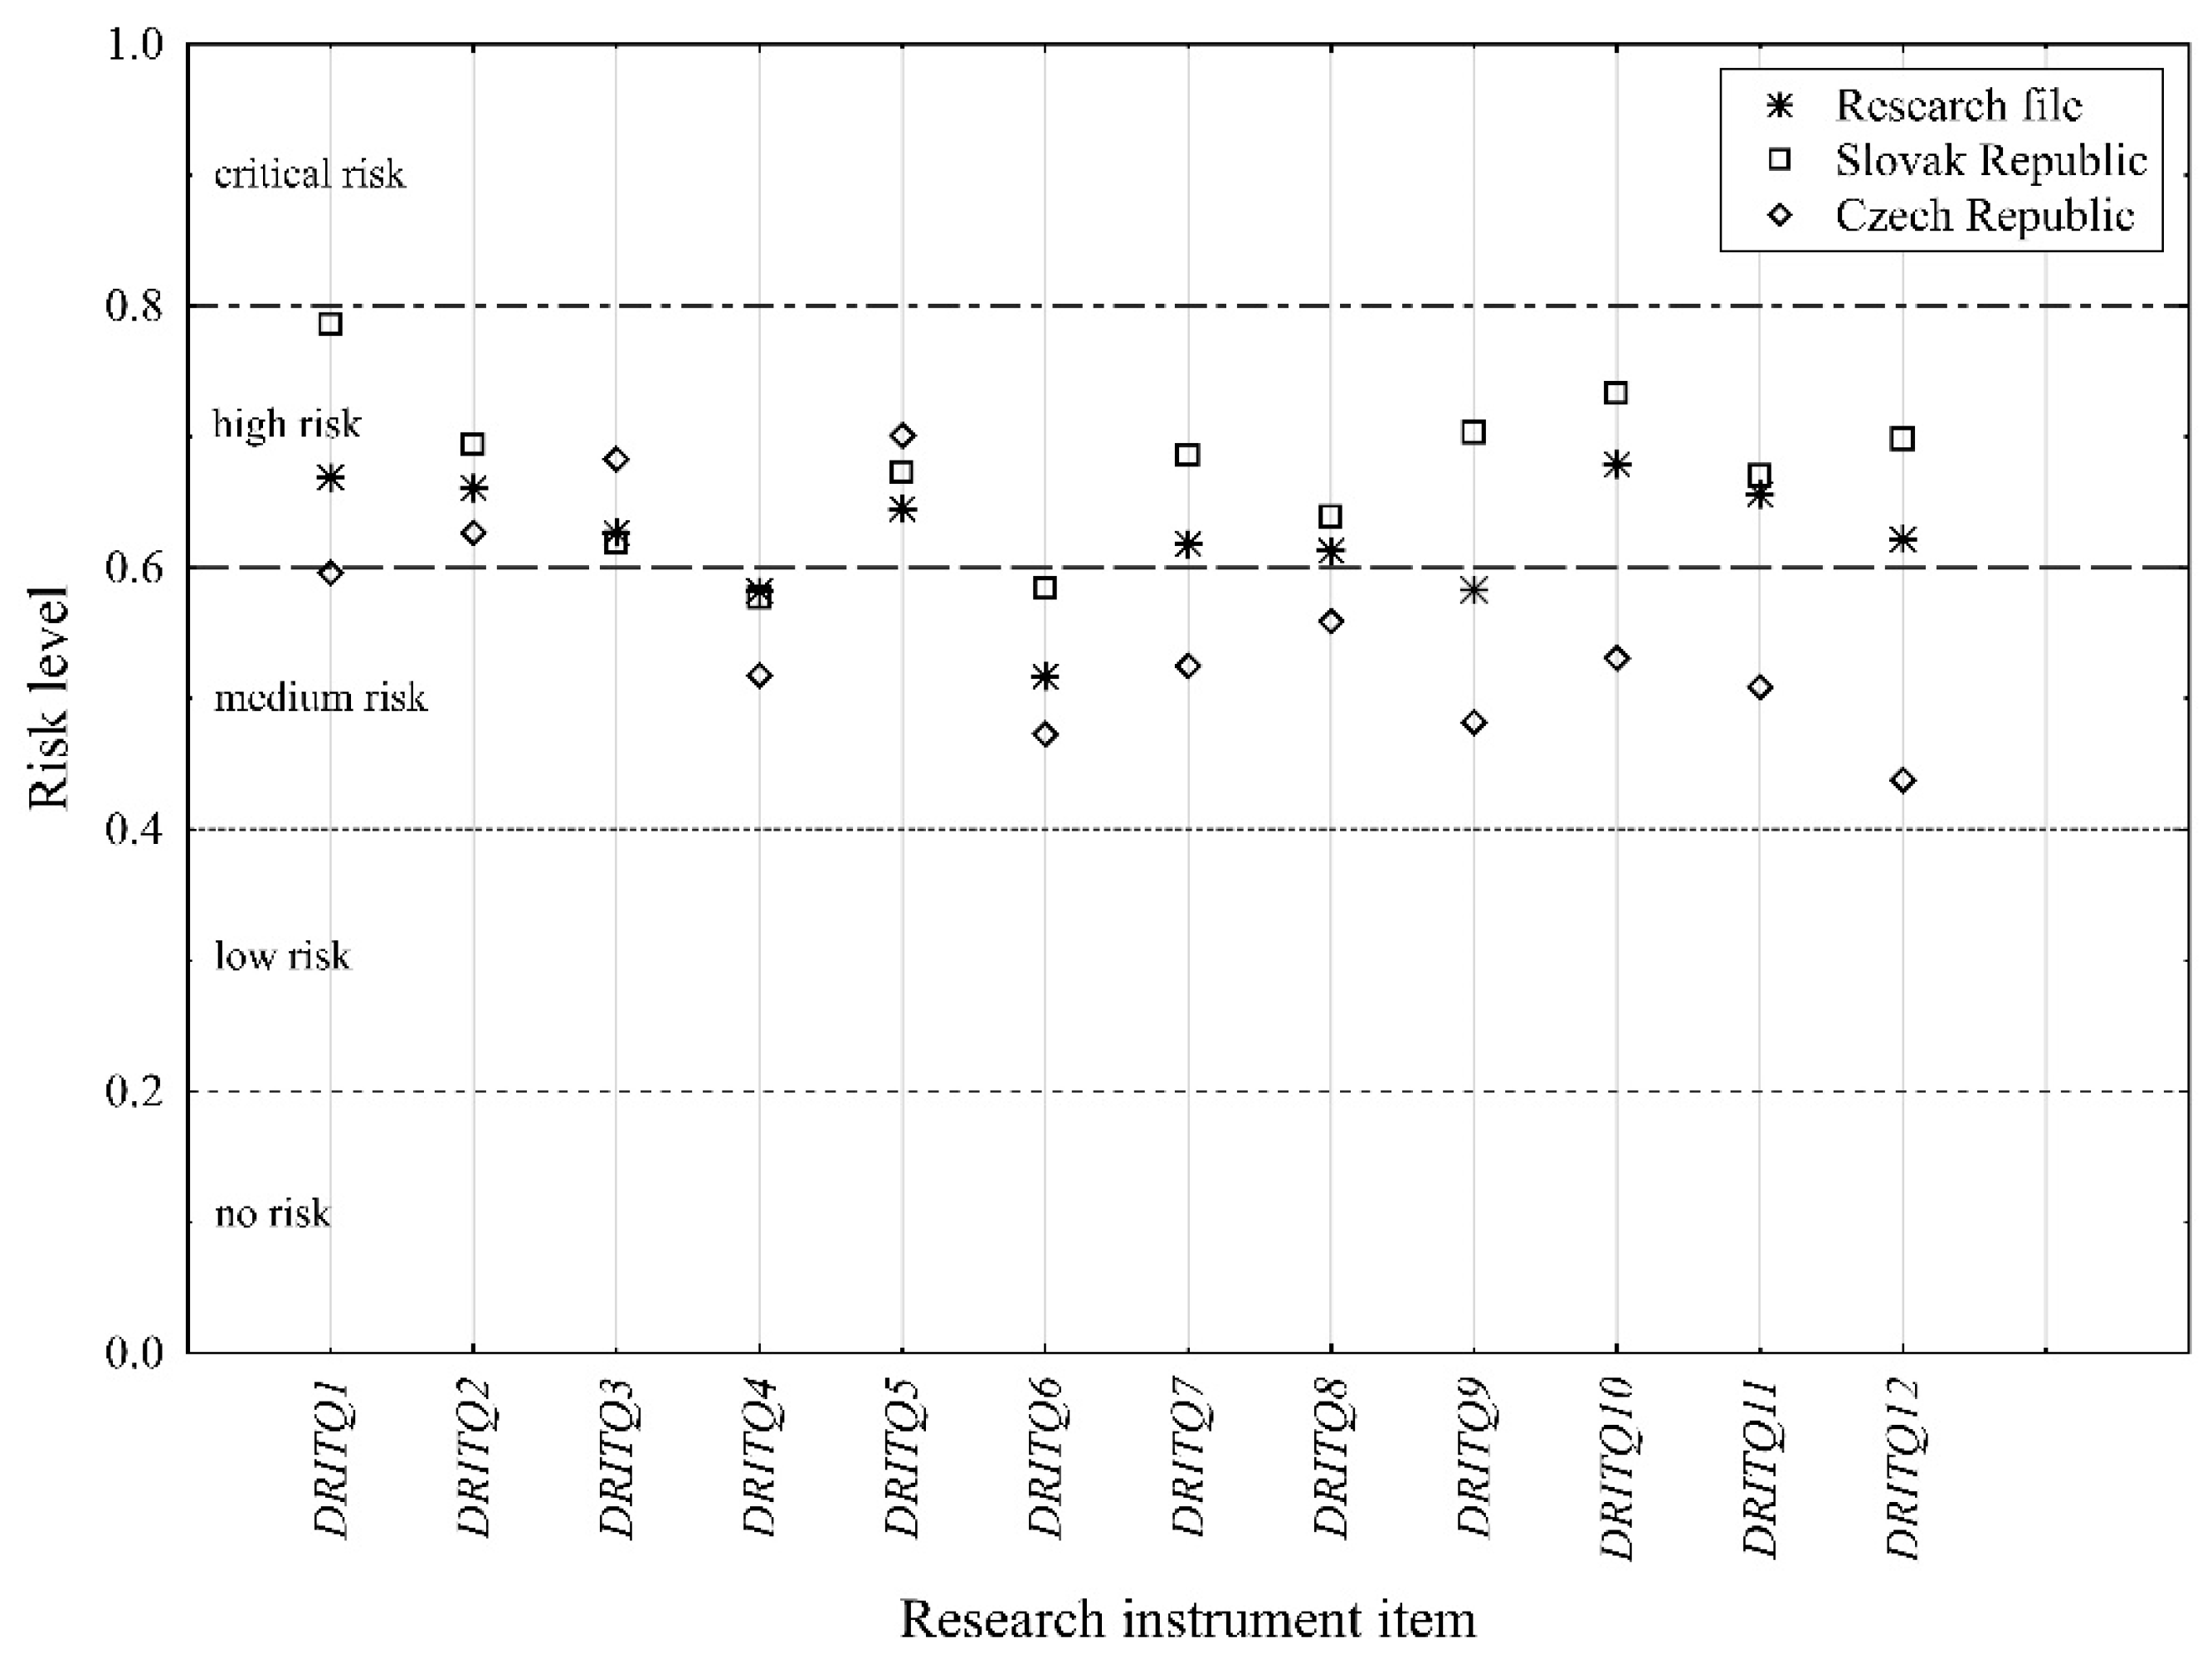
p < 0.000). A graphic depiction of differences in risk perception of individual items of the pillar disrupting or reducing IT infrastructure resilience of (DISRIT), hybrid threat Cybersecurity, between SK and CZ respondents, including a display of the entire research file, is shown in Figure 4.
The third pillar of cybersecurity (Figure 2), defined as cyberterrorism (CYBTER), is analysed from the viewpoint of both the order of importance and the degree of assigned risk by respondents from the Slovak and Czech Republics, including the differences between the analysed groups in Table 12.
Table 12. The parameters estimation of the cyberterrorism pillar for the CZ and SK respondents.
RelationshipSlovak RepublicCzech Republic
Est.Std. Est.tpEst.Std. Est.tp
CTQ1<---CYBTER1.0000.68515.197<0.000 *1.0000.3605.254<0.000 *
CTQ2<---CYBTER0.8750.61214.986<0.000 *1.6880.5937.435<0.000 *
CTQ3<---CYBTER1.0960.71717.640<0.000 *1.3570.4555.637<0.000 *
CTQ4<---CYBTER1.0910.76516.479<0.000 *1.7400.6326.715<0.000 *
CTQ5<---CYBTER1.1150.72115.536<0.000 *1.3340.4785.671<0.000 *
CTQ6<---CYBTER1.1400.73216.265<0.000 *1.6380.6226.373<0.000 *
CTQ7<---CYBTER0.9150.64313.547<0.000 *1.8140.5957.087<0.000 *
*—significant at the level of significance α = 0.05, Est.—regression weight, Std. Est.—standardised regression weight, tt-statistic, p—probability level, CYBTER—cyberterrorism.
Based on the results presented in Table 12, it can be concluded that both analysed groups (SK, CZ) marked the same items of the research instrument in terms of the order of importance of the individual threats of the CYBTER pillar as well as in terms of the degree of risk. For both groups, the issue of obtaining sensitive information of an intelligence nature for the purpose of using it in a kinetic terrorist attack (CTQ4) is in first place, with an assigned high level of risk, and the issue of managing sympathisers by third parties, primarily by inciting their activity against possible targets, planning terrorist operations, providing feedback, etc. (CTQ6) is in second place, with an equally high level of risk. For the SK group of respondents, the third most important issue is the spread of propaganda and materials to support followers of radicalisation and their recruitment (CTQ5), with a high level of risk assigned (0.721, p < 0.000), while for the CZ respondents, this issue is in fifth place with a medium level of risk (0.478, p < 0.000). The third most significant problem for the CZ respondents is the question on the low preparedness of the security forces for a specific digital environment and operating in it (CTQ7), with a medium level of risk, while this problem for the SK group is in sixth place but with a high level of risk (0.643, p < 0.000). It can be seen in Table 12 that the respondents from the SK group assigned a high level of risk to all items of the research instrument, while those from the CZ group marked only two items as high risk (CTQ4, 
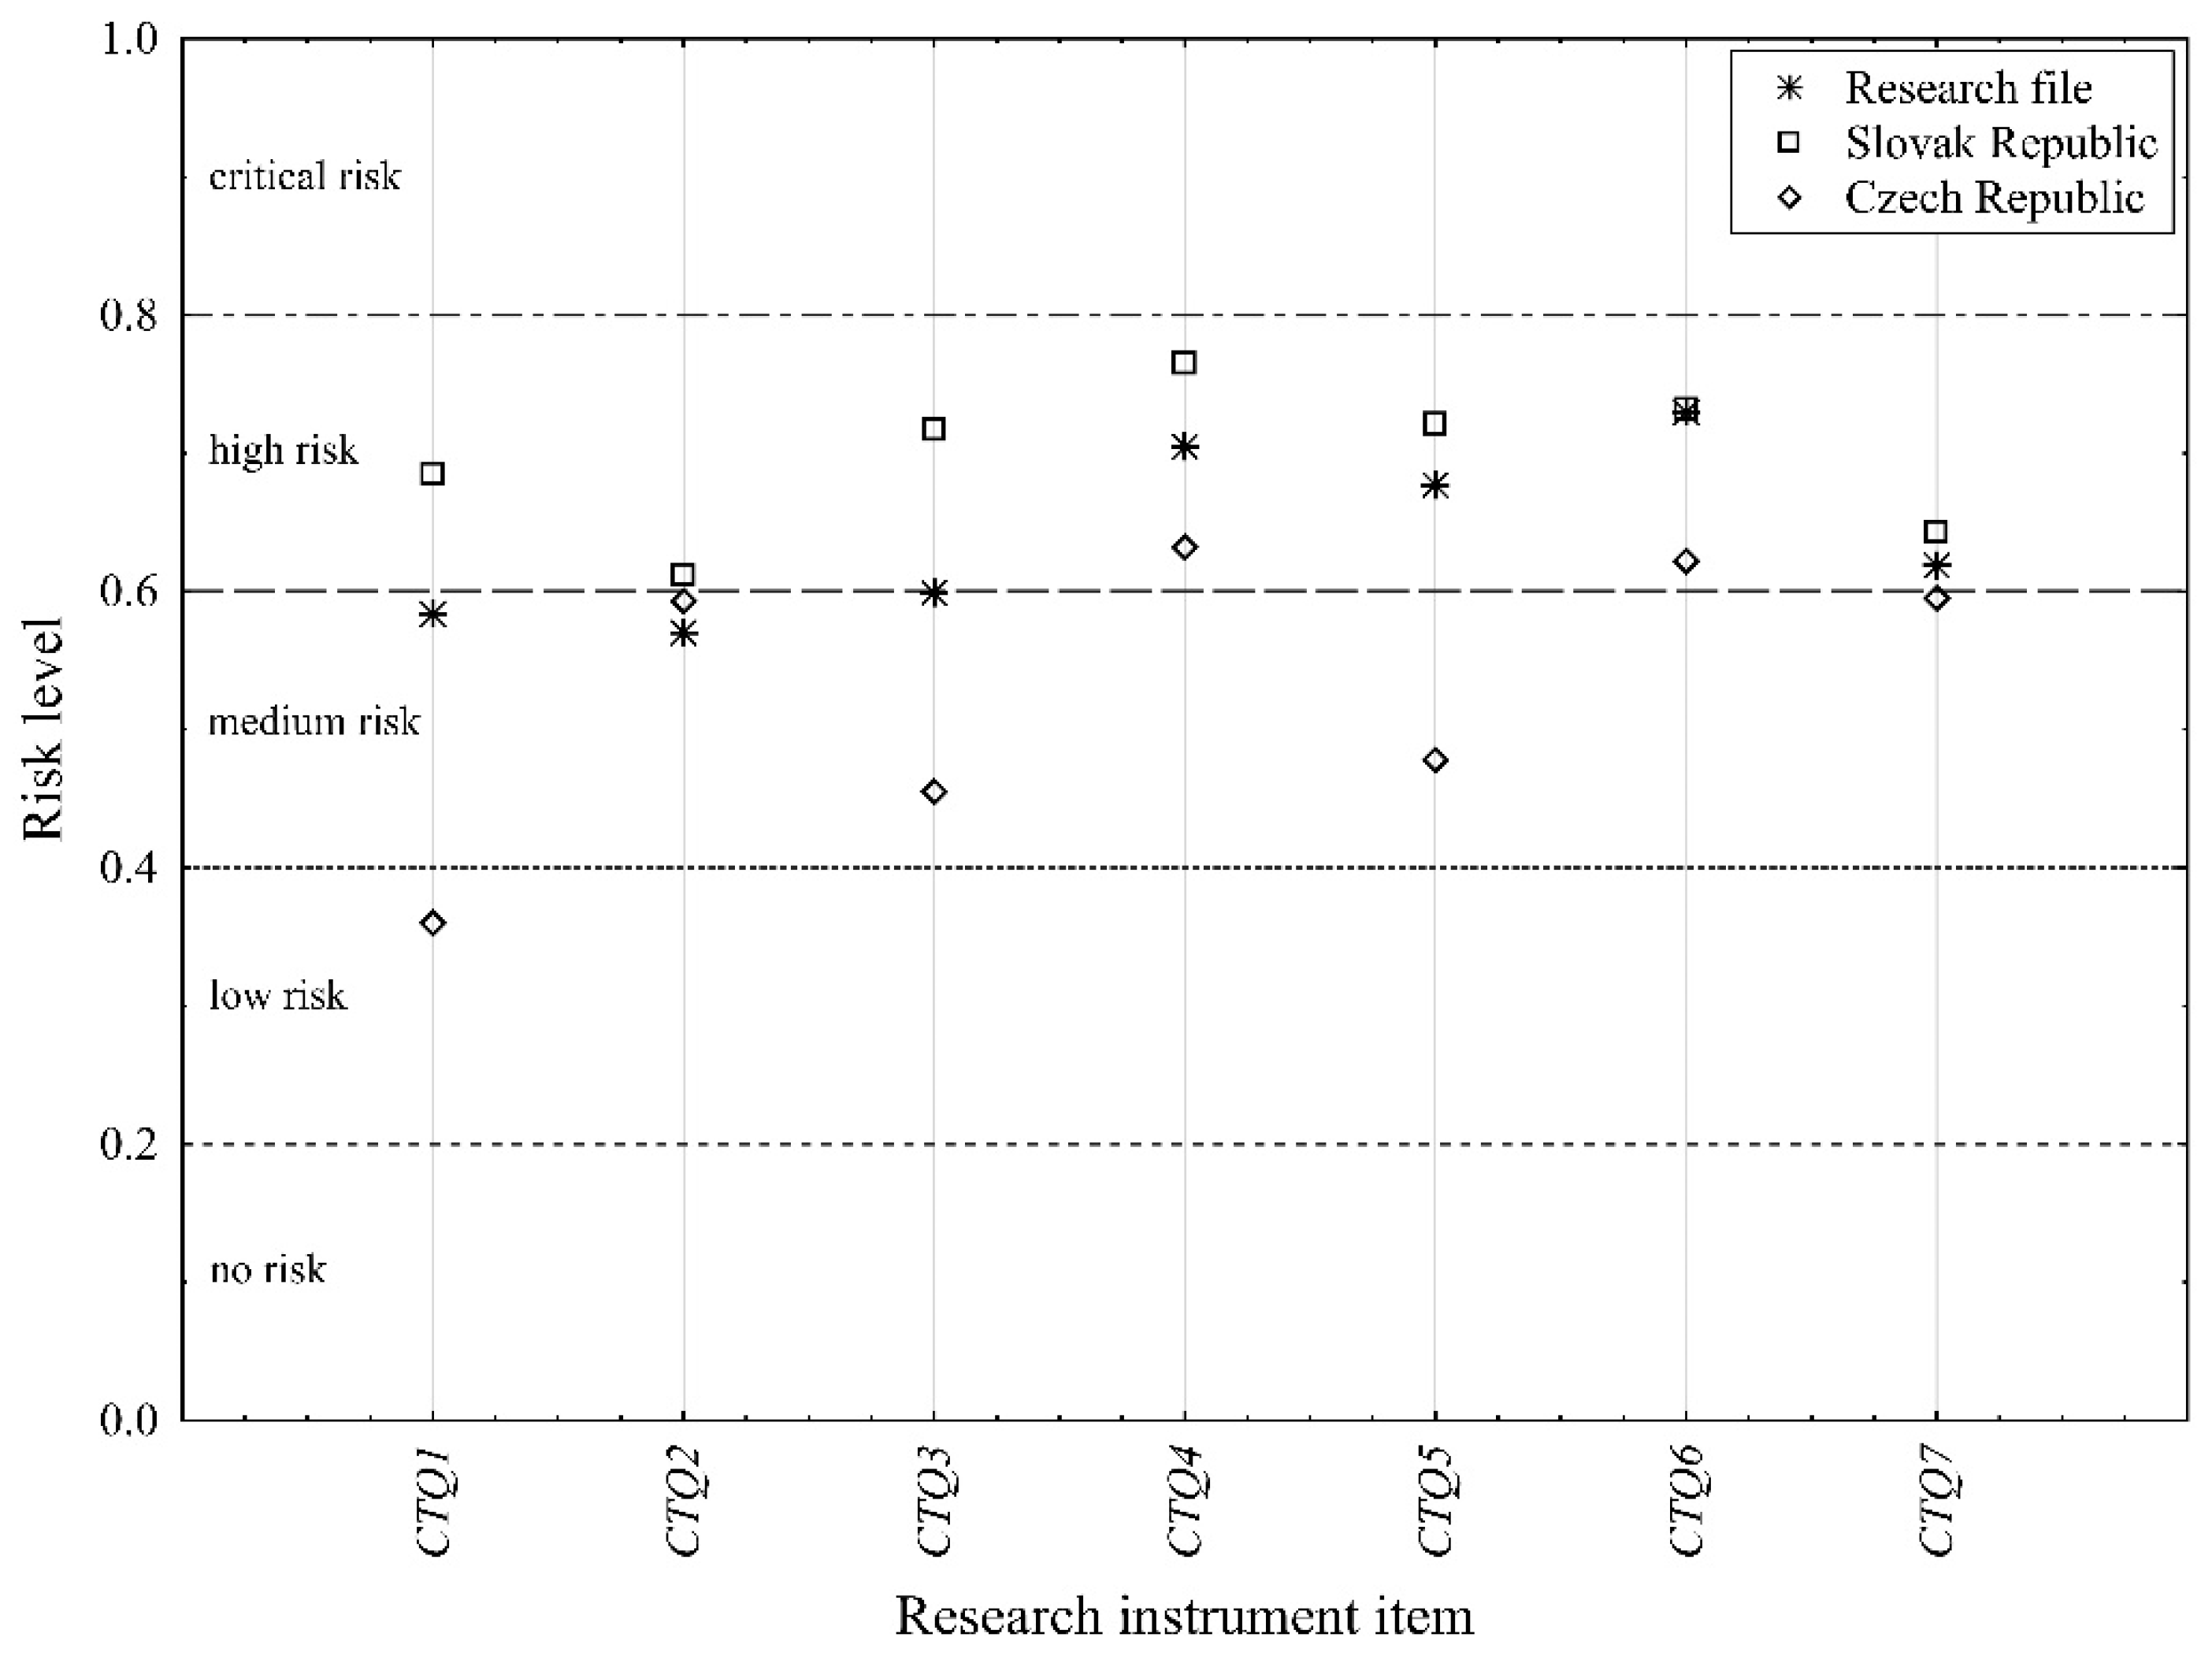
CTQ6) and assigned a medium level of risk to the remaining five. Thus, even here, differences are evident in the perception of the degree of risk between the analysed groups. A graphic depiction of the differences in the perception of the risk of individual items of the cyberterrorism (CYBTER) pillar of the hybrid threat cybersecurity between the SK and CZ respondents, including the display of the entire research file, is shown in Figure 5.
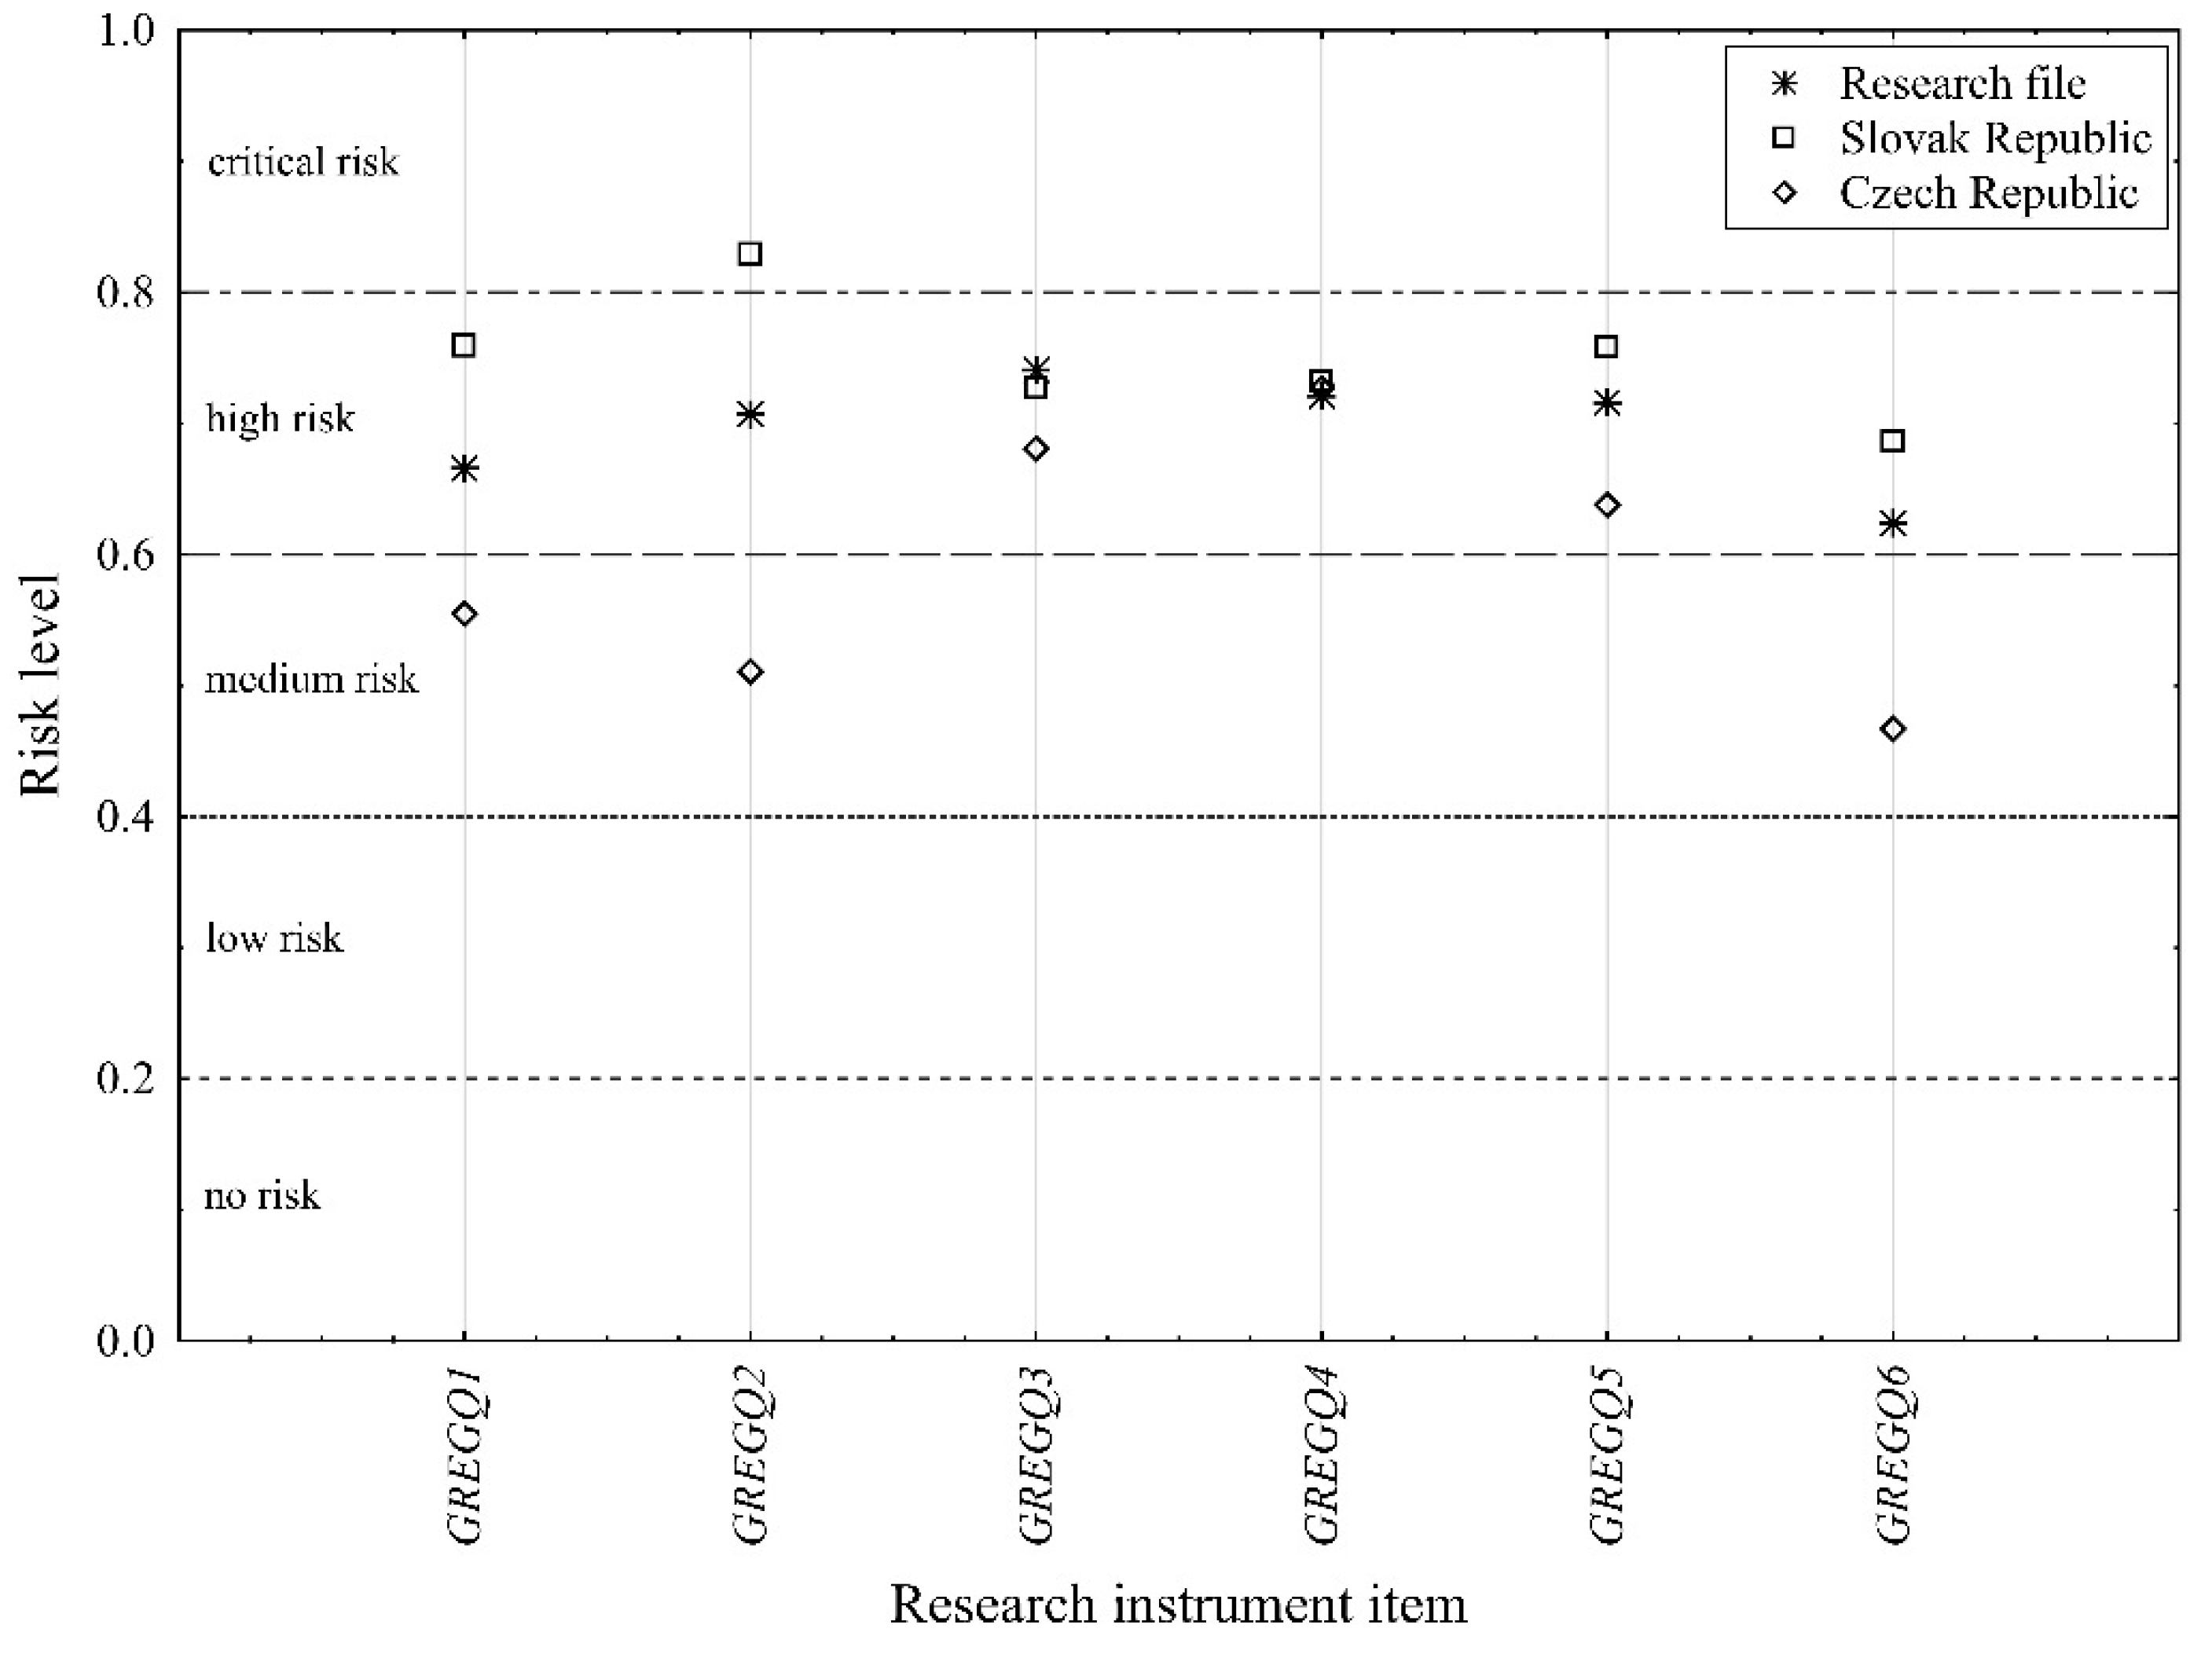
The analysis of the differences in respondents’ views on the degree of risk of the fourth defined pillar of the hybrid threat cybersecurity (Figure 2), that of the pillar disrupting or reducing eGovernment security (DISREG), is presented in Table 13.
Table 13. Estimates of the parameters of the pillar disrupting or reducing eGovernment security for respondents from the Slovak and Czech Republics.
RelationshipSlovak RepublicCzech Republic
Est.Std. Est.tpEst.Std. Est.tp
GREGQ1<---DISREG1.0000.75918.936<0.000 *1.0000.5559.163<0.000 *
GREGQ2<---DISREG1.1120.82921.007<0.000 *0.9040.5119.007<0.000 *
GREGQ3<---DISREG1.0440.72717.877<0.000 *1.0680.6819.850<0.000 *
GREGQ4<---DISREG0.9090.73218.063<0.000 *1.1740.72710.253<0.000 *
GREGQ5<---DISREG0.9780.75817.394<0.000 *1.1320.63810.658<0.000 *
GREGQ6<---DISREG0.9160.68615.202<0.000 *0.8110.4676.833<0.000 *
*—significant at the level of significance α = 0.05, Est.—regression weight, Std. Est.—standardised regression weight, tt-statistic, p—probability level, DISREG—disrupting or reducing e-government security.
The most significant problem perceived as a critical risk by the SK respondents (0.829, p < 0.000) is that of the underestimating of cyber threats in state or public administration (GREGQ2), and at the same time, for this one question only, respondents indicated a critical degree of risk. This same problem has only a medium level of risk (0.511, p < 0.000) for respondents from the CZ group and in order of importance was in the penultimate, or fifth, place. For respondents from the Czech Republic, the most important form regarding the DISREG pillar is the question that relates to the bad setting of the cybersecurity policy by the state (GREGQ4), with a high degree of risk (0.727, p < 0.000). Respondents from the SK group assigned an equally high level of risk (0.732, p < 0.000) to this problem, but for them, it is only in fourth place in terms of importance. The second most significant threat for SK respondents is insufficient funding in the field of cybersecurity (GERGQ1), with a high level of risk, while for the comparison group (CZ) this problem is in fourth place with a medium level of risk (0.555, p< 0.000). In contrast, for the groups of respondents from the Czech Republic, the issue of insufficient security of information systems intended for communication with citizens (GREGQ3) is in second place, with a high degree of risk (0.671, p < 0.000), and this same problem was put in fifth place by the SK respondents, but with the same high degree of risk (0.727, p < 0.000). The problem relating to the low awareness and education of the population about cybersecurity (GREGQ6) is in third place for both compared groups in terms of importance, with the same high degree of risk. As with the previously analysed pillar (CYBTER), with this one (DISREG), an interesting fact can be seen: while the respondents from the SK group assigned a critical level of risk to one item and a high level of risk to the remaining five, the respondents from the CZ group assigned a high level of risk to three items of the research instrument and a medium level of risk to four items. A graphic depiction of differences in risk perception of individual items of the pillar disrupting or reducing eGovernment security (DISREG), hybrid threat cybersecurity, between respondents of the SK and CZ groups, including a display of the entire research file, is shown in Figure 6.
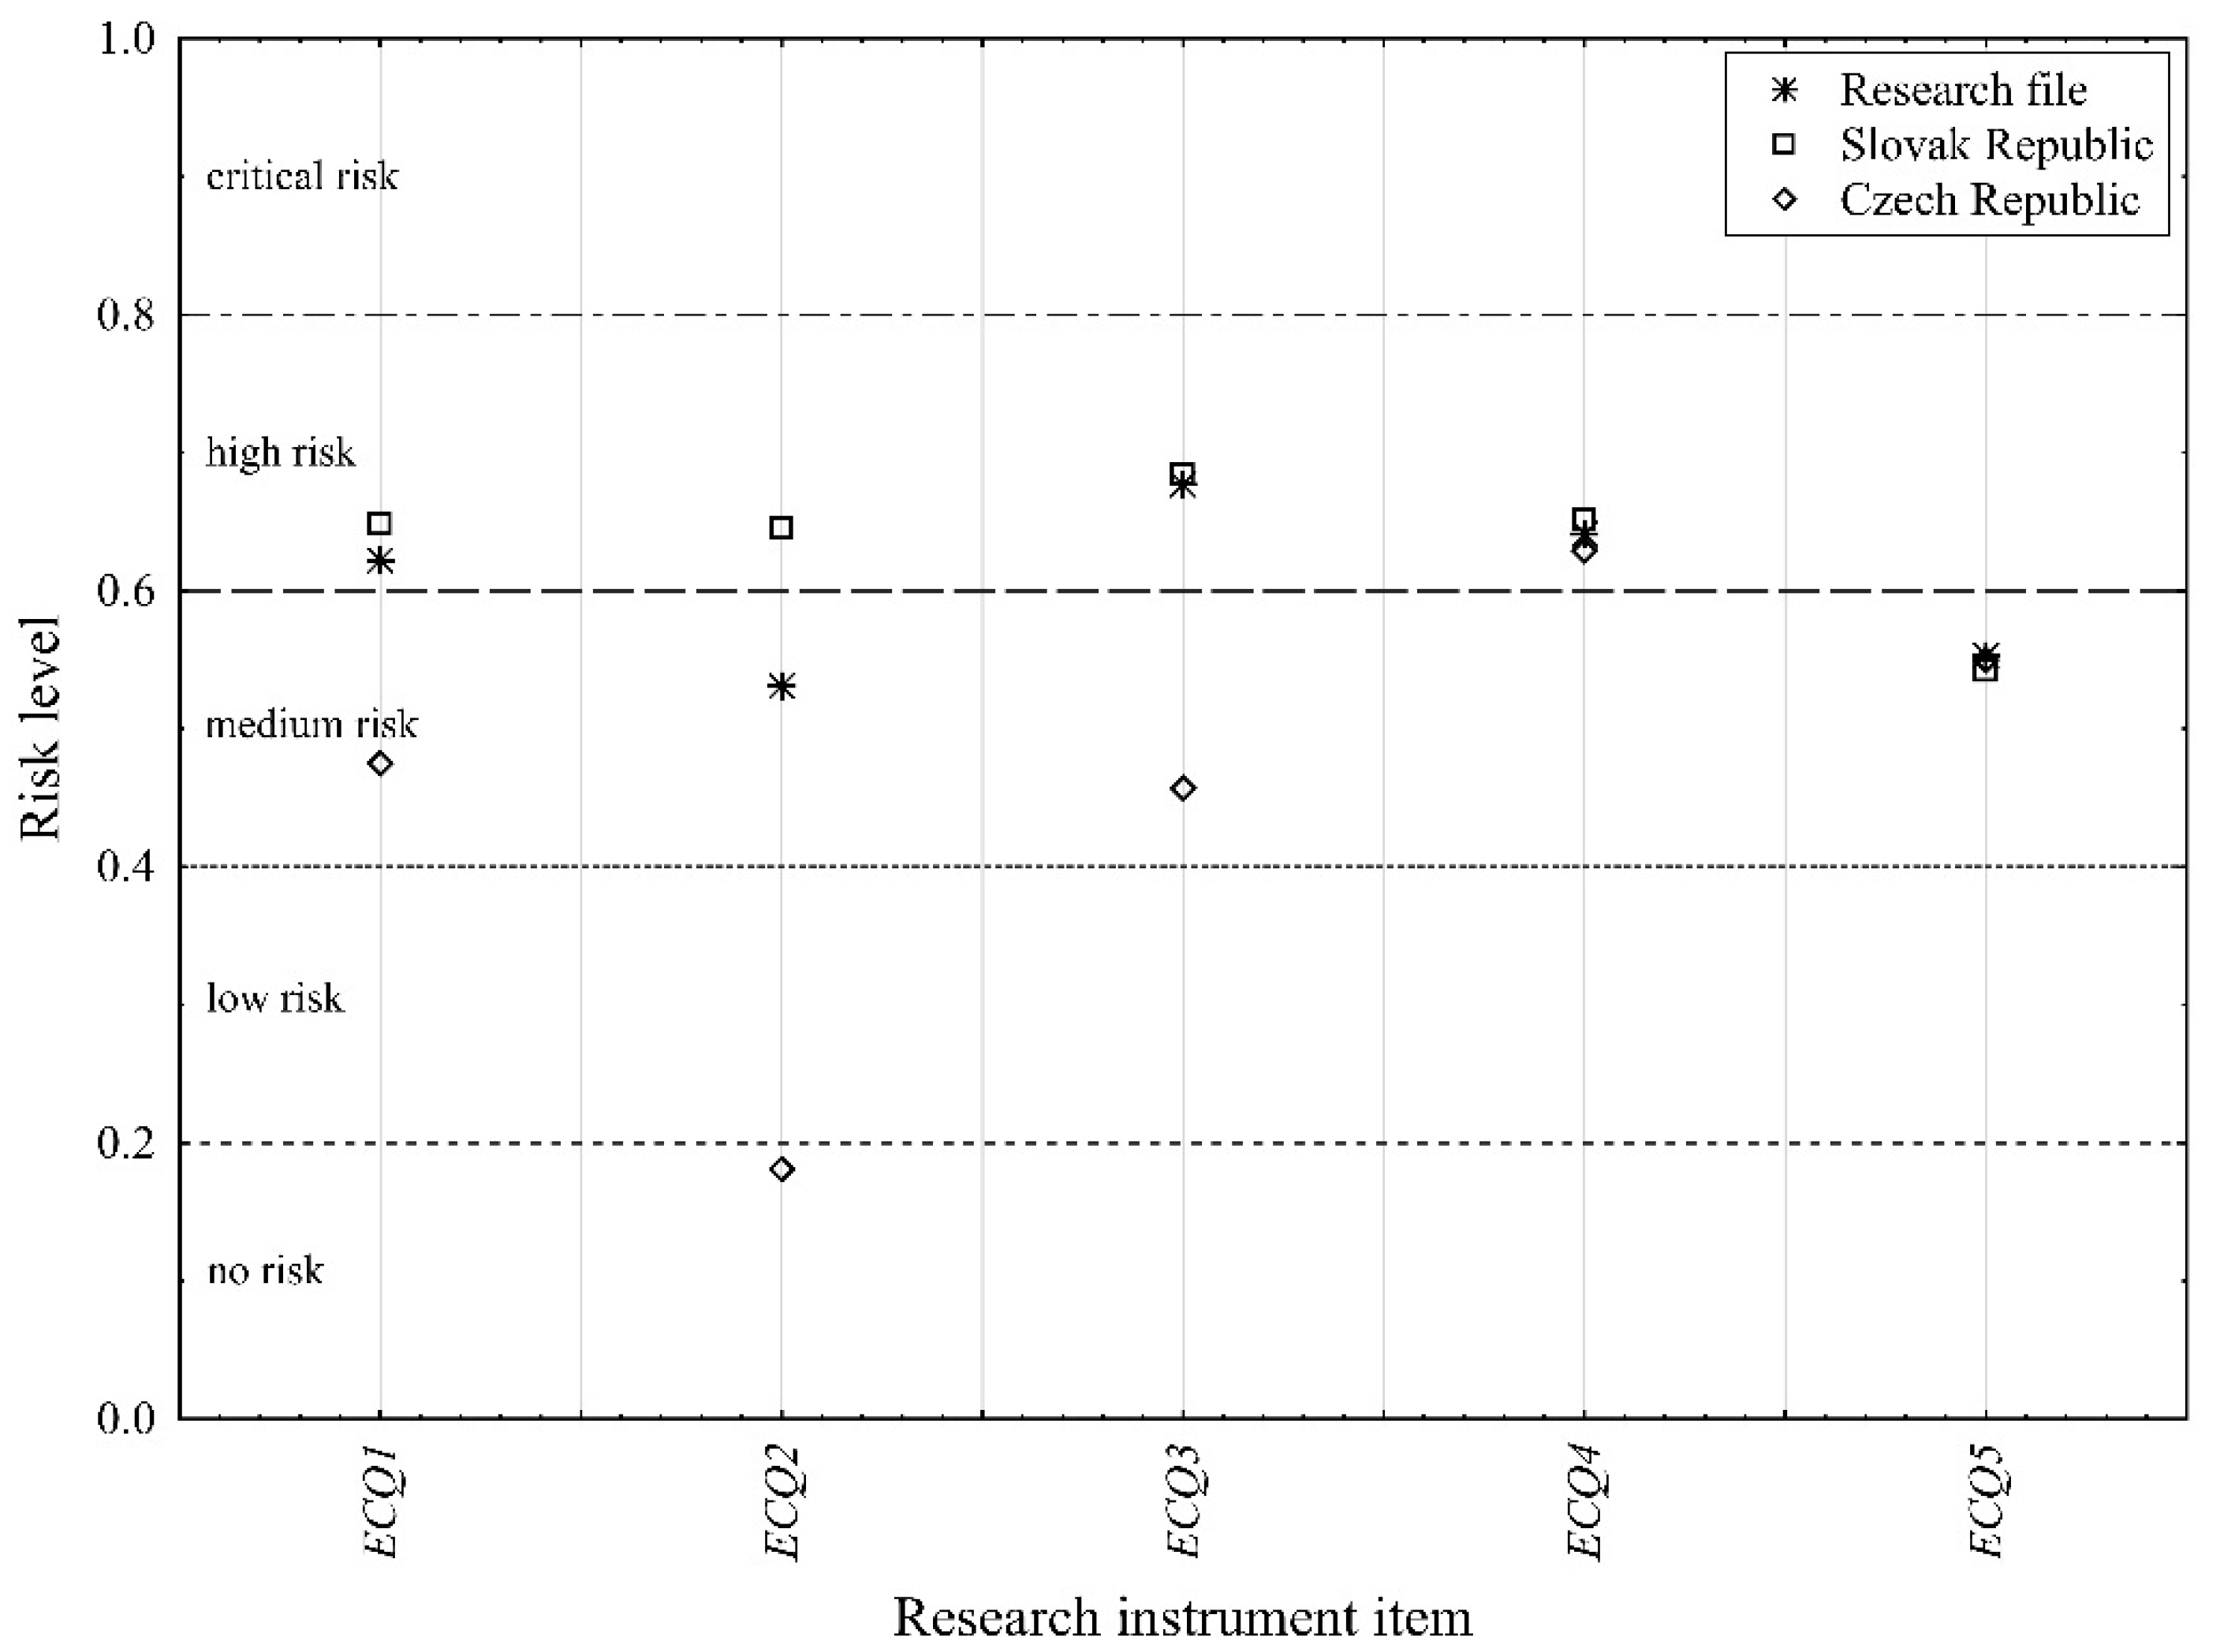
The analysis of the last pillar of the hybrid threat cybersecurity in the sense of the theoretical model (Figure 1), which we called enemy campaigns (ENECAM), is presented for the compared groups in Table 14.
Table 14. Estimates of the parameters of enemy campaign pillar for respondents from the Slovak and Czech Republics.
RelationshipSlovak RepublicCzech Republic
Est.Std. Est.tpEst.Std. Est.tp
ECQ1<---ENECAM1.0000.64815.551<0.000 *1.0000.4758.055<0.000 *
ECQ2<---ENECAM0.9900.64515.339<0.000 *0.3450.1813.783<0.000 *
ECQ3<---ENECAM1.0360.68414.244<0.000 *0.8250.4578.506<0.000 *
ECQ4<---ENECAM0.9830.65113.698<0.000 *1.2240.6298.228<0.000 *
ECQ5<---ENECAM0.8400.54211.708<0.000 *1.0210.5507.821<0.000 *
*—significant at the level of significance α = 0.05, Est.—regression weight, Std. Est.—standardised regression weight, tt-statistic, p—probability level, ENECAM—enemy campaigns.
The most important problem of the ENECAM pillar for the SK respondents is the question that relates to the ownership structure of individual Internet media, which can follow their own interests or the interests of other states (ECQ3). This is proclaimed with a high level of risk (0.684, p < 0.000), while this problem is in fourth place for the CZ respondents, with a medium level of risk (0.457, p < 0.000). For the CZ respondents the most significant problem is that of insufficient screening of state/public administration employees who may work for the benefit of third parties (ECQ4), with a high degree of risk (0.629, p < 0.000), while for the SK respondents, this issue ranks second and has an equally high degree of risk (0.651, p < 0.000). The third most significant problem in terms of order of importance for the first compared group (SK) is the one related to the effect of influence and disinformation campaigns on the Internet to shape residents’ moods (ECQ1), with an assigned high degree of risk (0.648, p < 0.000). While respondents from the CZ group assigned a medium level of risk to this problem (0.475, p < 0.000), like the SK group, put it in third place in terms of importance. An interesting difference between the opinions of the compared groups is the problem of the wide use of the social network environment due to their international aspect and different approach to freedom of speech, which enables them to be used to a greater extent to spread hate and disinformation campaigns (ECQ2). While the respondents from the SK group assigned a high level of risk to this problem (0.645, p < 0.000), the respondents from the CZ group assigned the “no risk” degree of risk (0.181, p < 0.000) to this item of the research instrument (ECQ2). Here it should be noted that within the entire research instrument, only this item (ECQ2) is perceived as risk-free. In this case, too, it can be seen that the SK respondents assign a higher level of risk to individual items of the research instrument than those from the CZ group. A graphic depiction of the differences in the perception of the risk of individual items of the enemy campaigns (ENECAM) pillar of the hybrid threat cybersecurity between the respondents of the SK and CZ groups, including the display of the entire research file, is shown in Figure 7.
The differences in the perception of the relationships between the individual-defined pillars of the hybrid threat cybersecurity between the compared groups can also be analysed. We present a basic analysis of these relationships in Table 15.
Both compared groups consider the link between the CYBSPY and DISRIT pillars to be the most important relationship. The correlation coefficient of this relationship for respondents from the SK group is at the level of 0.908 (p < 0.000), while this relationship in terms of Cohen’s scale can be considered almost perfect, and for respondents from the CZ group, the value of the correlation coefficient for the analysed relationship of the pillars of Cybersecurity is at the level 0.883 (p < 0.000), which means a very significant relationship. For the group of SK respondents, the relationship between the pillars of Cybersecurity CYBTER and DISREG reaches the value of the correlation coefficient of 0.862 (p < 0.000) and takes second place in the order of importance, while for the group of CZ respondents, the correlation coefficient is 0.762 (p < 0.000) and occupies the third place. For respondents from the SK group, a change of order also occurs in the third most significant relationship between the pillars of cybersecurity, namely the relationship between DISRIT and DISREG, with a correlation coefficient value of 0.882 (p < 0.000), while this relationship is in third place for respondents from the CZ group, with the correlation coefficient at 0.837 (p < 0.000) with the second level of significance. We see the most significant shift in the perception of the relationship between the CYBSPY and CYBTER pillars, where for the SK respondents this relationship is very significant (0.809, p < 0.000) and is in fifth place in terms of importance, and for the CZ respondents, this relationship is characterised as significant (0.531, p < 0.000) and fills the last place in terms of importance. In terms of the significance of the individual-defined pillars of cybersecurity for the individual compared groups, the respondents from the SK group consider the DISREG pillar, with 22.700% influence, as the biggest risk versus the CZ respondents, who consider the DISRIT pillar, with 24,274% influence, as the biggest problem. The DISRIT pillar is the second most important pillar for Slovak respondents with a share of 21.885%, while the second most important pillar for the Czech respondents is the CYBSPY pillar with a share of influence at the level of 22.637%. The third most important pillar of Cybersecurity as a hybrid threat for respondents of the SK group is the CYBTER pillar (19.447%), followed by the ENECAM pillar (17.995%) and the CYBSPY pillar (17.924%). If we rank the Cybersecurity pillars in the same way for the CZ respondents, third place in terms of the share of influence goes to the DISREG pillar (21.612%), followed by the ENECAM pillar (18.268%) and the CYBTER pillar (13.210%). Therefore, it is possible to state that there are significant differences between the compared groups of respondents (SK, CZ) both in the perception of the relationships between the individual-defined pillars of cybersecurity and in the perception of the risk of the individual pillars as a whole. This creates an interesting starting point, which must reflect the obtained results in education and the approach to cybersecurity in both of these countries. In conclusion, it needs to be noted that the respondents were students of police and military universities in Slovakia and the Czech Republic, and their preparation to battle against hybrid threats is crucial in terms of protecting countries from the danger of hybrid threats.

5. Conclusions

No state is completely protected from the threats of cyberspace these days. The worsening security situation, and not only in areas immediately bordering NATO and EU Member States, is amplifying the increasing demands on countries’ abilities to independently respond to security threats in cyberspace. It is possible to observe the growing efforts of both state and non-state actors to build and use cyber offensive resources, whose aim is mainly critical infrastructure, or those parts of it exposed in cyberspace—critical information infrastructure and significant information systems. Indeed, these represent a key system of elements whose disruption or non-functionality would have a serious impact on the security of a state, the provision of the basic life needs of the population or the economic situation.
Our study on maintaining cybersecurity in the face of hybrid threats through risk perception analysis clarified the multifaceted challenges that organisations and individuals are facing in the digital age. The presented findings emphasise the principle importance of not only technical guarantees but also the human factor in cybersecurity. Understanding and managing risk perception can significantly affect an organisation’s ability to effectively mitigate hybrid threats and respond to them. By being aware that perceptions shape behaviour, organisations can invest in training, awareness campaigns and collaborative efforts to strengthen their security. Moreover, our research highlights the need for ongoing collaboration between government agencies, private sector entities and academia to address the evolving hybrid threat environment. This interdisciplinary approach can lead to the development of more robust cybersecurity strategies, information-sharing mechanisms and policy frameworks. Maintaining cybersecurity is an ongoing process that requires vigilance, adaptability and proactive thinking and taking a proactive approach towards rapidly evolving technologies and threats. By incorporating knowledge about risk perception into cybersecurity strategies and cultivating a culture of cybersecurity awareness, it becomes possible to work together and coordinate a safer and more resilient digital ecosystem. Protecting the digital future will in the end depend on the ability to stay one step ahead, to innovate and to work together effectively in the battle against hybrid threats.
As part of the presented study, we attempted to analyse the opinions and attitudes towards the risk assessment of one of the basic hybrid threats, namely cybersecurity, based on the author’s research instrument on a sample (N = 964) of students of the Slovak and Czech Republics who study at universities of the police and military type of study. The choice of the target group of respondents was motivated by the fact that it is this group of respondents who will represent the first line of the battle against hybrid threats in the future. The research instrument, as such, is based on official documents of the Slovak and Czech Republics in the field of security. Within the analysis, the authors defined a basic theoretical factor model (Figure 1) of the hybrid threat “Cybersecurity”, which is defined by five basic pillars: cyber spying (CYBSPY), disrupting or reducing IT infrastructure resilience (DISRIT), enemy campaigns (ENECAM), disrupting or reducing eGovernment security (DISREG), and cyberterrorism (CYBTER). An analysis of the agreement of the respondents’ answers (Table 2, Table 9) with the factor theoretical model (Figure 1) was subsequently carried out using confirmatory factor analysis (CFA) for the entire research set and then separately for respondents from the Slovak and Czech Republics with the aim of defining the basic differences in the perception of the level of risk between the analysed groups.
Within the framework of the theoretical factor model (Figure 1) of the hybrid threat “Cybersecurity”, a significant influence of all defined pillars was demonstrated at the chosen level of significance α = 5%. From the point of view of the significance and impact of individual pillars on cybersecurity in terms of view of risk, the most significant pillar for the entire research set (N = 964) is “Disrupting or reducing IT infrastructure resilience” (DISRIT) with a share of Cybersecurity risk perception at a level of 22.284%. The second most important pillar of cybersecurity is the pillar disrupting or reducing eGovernment security (DISREG) with a share of 21.842%. The third most important pillar is the Enemy campaigns pillar (ENECAM) with a share of 19.532%, followed by the cyberterrorism pillar (CYBTER) with a share of 18.381% and the cyber spying pillar (CYBSPY) with a share of 17.961%. The relatively small differences in the importance of the individual pillars of cybersecurity suggest that all the defined pillars are perceived by the respondents as having approximately the same level of risk. On the other hand, based on the analysis conducted, it is possible to define basic differences in the perception of the pillars of cybersecurity between respondents from the Slovak and Czech Republics. For respondents from Slovakia, the most important pillar in terms of its risk is the DISREG pillar (22.700%), followed by the DISRIT (21.885%), CYBTER (19.477%), ENECAM (17.995%), and CYBSPY (17.942%) pillars. Here, too, relatively small differences in the perception of individual shares can be identified. Among respondents from the Czech Republic, a change occurs in the order of importance as well as the share of the individual pillars of cybersecurity. For this group of respondents, the most important pillar is the DISRIT pillar (24.274%), followed by the CYBSPY (22.637%), DISREG (21.612%), ENECAM (18.268%), and CYBTER (13.210%) pillars. The difference in risk perception of individual pillars is greater among the Czech respondents than among those from Slovakia. The biggest difference between the compared groups is the perception of the CYBTER pillar. A detailed analysis of the differences in the perception of individual items of the research instrument that form the defined pillars of cybersecurity is presented in the study. The overall conclusion is that respondents from the Slovak Republic attach a higher degree of risk to most individual threats than respondents from the Czech Republic, which we document in the analytical part of the contribution.
The factor model of cybersecurity (FMCS) represents an attempt to quantify the attitudes towards risk perception of the individual defined pillars CYBSPY, DISRIT, ENECAM, DISREG, and CYBTER of the FMCS model and the individual threats that make up the pillars. A practical output could be the defining of critical threats and pillars which are perceived by the respondents at the level of high or critical risk with subsequent focusing of the attention of the responsible state authorities on these areas. A second indisputable benefit should be the effort to educate specifically in these critical areas of cybersecurity. Of course, it would be correct and is also one of the main aims of the authors to expand the research set with relevant groups of respondents in EU countries while also expanding the research set with respondents from the state and public administration. The current makeup of the research group also represents a certain limitation of the presented research. At the same time, it is also necessary to analyse the views and attitudes of the respondents on the perception of the risk of cybersecurity (FMCS) from the point of view of other groups of respondents (gender, age) and to focus the education of the respondents in the field of cybersecurity according to the results obtained. A very important challenge, on which the team of authors is currently working actively, is an analysis of other relevant hybrid threats and, above all, sustainable and resilient cybersecurity.

Author Contributions

Conceptualization, M.G., A.K., P.R., and A.V.; methodology, M.G., P.R., and A.V.; software, M.G.; validation, A.V., M.G., A.K., and P.R.; formal analysis, A.K. and A.V.; investigation, M.G., A.K., A.V., and P.R.; resources, A.V., A.K., and M.G.; data curation, M.G.; writing—original draft preparation, M.G., A.V., A.K., and P.R.; writing—review and editing, M.G., A.V., A.K., and P.R.; visualization, A.K., M.G., A.V., and P.R.; supervision, M.G., A.K., P.R., and AV.; project administration, A.K.; funding acquisition, A.K. All authors have read and agreed to the published version of the manuscript.

Funding

This research was funded by the grant from The European Social Fund, grant project code ITMS2014+:314011CDW7, grant project title “Increasing Slovakia’s resistance to hybrid threats by strengthening public administration capacities”. The APC was funded by this grant ITMS2014+:314011CDW7.

Informed Consent Statement

Informed consent was obtained from all the subjects involved in the study.

Data Availability Statement

Data are available based upon the request.

Acknowledgments

The authors would like to thank the Ministry of Interior of the Slovak Republic and the grant agency for supporting this research work through the project of the EU SF, ITMS2014+:314011CDW7, and the Ministry of Defence of the Czech Republic for the support via grant VAROPS.

Conflicts of Interest

The authors declare no conflicts of interest.

References

  1. Adamczak, M.; Kolinski, A.; Trojanowska, J.; Husár, J. Digitalization Trend and Its Influence on the Development of the Operational Process in Production Companies. Appl. Sci. 2023, 13, 1393. [Google Scholar] [CrossRef]
  2. Rudenko, R.; Pires, I.M.; Oliveira, P.; Barroso, J.; Reis, A. A Brief Review on Internet of Things, Industry 4.0 and Cybersecurity. Electronics 2022, 11, 1742. [Google Scholar] [CrossRef]
  3. Matana, G.; Simon, A.T.; Filho, M.G.; Helleno, A.L. Method to assess the adherence of internal logistics equipment to the concept of CPS for industry 4.0. Int. J. Prod. Econ. 2020, 228, 107845. [Google Scholar] [CrossRef]
  4. O’Donovan, P.; Gallagher, C.; Leahy, K.; O’Sullivan, D.T.J. A comparison of fog and cloud computing cyber-physical interfaces for Industry 4.0 real-time embedded machine learning engineering applications. Comput. Ind. 2019, 110, 12–35. [Google Scholar] [CrossRef]
  5. Gao, Z.; Wanyama, T.; Singh, I.; Gadhrri, A.; Schmidt, R. From Industry 4.0 to Robotics 4.0—A Conceptual Framework for Collaborative and Intelligent Robotic Systems. Procedia Manuf. 2020, 46, 591–599. [Google Scholar] [CrossRef]
  6. de Azambuja, A.J.G.; Plesker, C.; Schützer, K.; Anderl, R.; Schleich, B.; Almeida, V.R. Artificial Intelligence-Based Cyber Security in the Context of Industry 4.0—A Survey. Electronics 2023, 12, 1920. [Google Scholar] [CrossRef]
  7. Jan, Z.; Ahamed, F.; Mayer, W.; Patel, N.; Grossmann, G.; Stumptner, M.; Kuusk, K. Artificial intelligence for industry 4.0: Systematic review of applications, challenges, and opportunities. Expert Syst. Appl. 2023, 216, 119456. [Google Scholar] [CrossRef]
  8. Aceto, G.; Persico, V.; Pescapé, A. Industry 4.0 and Health: Internet of Things, Big Data, and Cloud Computing for Healthcare 4.0. J. Ind. Inf. Integr. 2020, 18, 100129. [Google Scholar] [CrossRef]
  9. Zhong, R.Y.; Xu, X.; Klotz, E.; Newman, S.T. Intelligent Manufacturing in the Context of Industry 4.0: A Review. Engineering 2017, 3, 616–630. [Google Scholar] [CrossRef]
  10. Corallo, A.; Lazoi, M.; Lezzi, M.; Luperto, A. Cybersecurity awareness in the context of the Industrial Internet of Things: A systematic literature review. Comput. Ind. 2022, 137, 103614. [Google Scholar] [CrossRef]
  11. Kohout, D.; Lieskovan, T.; Mlynek, P. Smart Metering Cybersecurity—Requirements, Methodology, and Testing. Sensors 2023, 23, 4043. [Google Scholar] [CrossRef] [PubMed]
  12. What Is Industry 4.0? Available online: https://www.ibm.com/topics/industry-4-0#+What+technologies+are+driving+Industry+4.0%3F (accessed on 27 November 2023).
  13. Alqudhaibi, A.; Albarrak, M.; Aloseel, A.; Jagtap, S.; Salonitis, K. Predicting Cybersecurity Threats in Critical Infrastructure for Industry 4.0: A Proactive Approach Based on Attacker Motivations. Sensors 2023, 23, 4539. [Google Scholar] [CrossRef] [PubMed]
  14. Treverton, G.F.; Thvedt, A.; Chen, A.R.; Lee, K.; McCue, M. Addressing Hybrid Threats, 1st ed.; Swedish Defence University: Stockholm, Sweden, 2018; p. 101. ISBN 978-91-86137-73-1. [Google Scholar]
  15. Aslan, Ö.; Aktuğ, S.S.; Ozkan-Okay, M.; Yilmaz, A.A.; Akin, E. A Comprehensive Review of Cyber Security Vulnerabilities, Threats, Attacks, and Solutions. Electronics 2023, 12, 1333. [Google Scholar] [CrossRef]
  16. Granholm, F.; Tin, D.; Ciottone, G.R. Not war, not terrorism, the impact of hybrid warfare on emergency medicine. Am. J. Emerg. Med. 2022, 62, 96–100. [Google Scholar] [CrossRef]
  17. Cox, E. “I hope they shouldn’t happen”: Social vulnerability and resilience to urban energy disruptions in a digital society in Scotland. Energy Res. Soc. Sci. 2023, 95, 102901. [Google Scholar] [CrossRef]
  18. Almaiah, M.A.; Al-Otaibi, S.; Shishakly, R.; Hassan, L.; Lutfi, A.; Alrawad, M.; Qatawneh, M.; Alghanam, O.A. Investigating the Role of Perceived Risk, Perceived Security and Perceived Trust on Smart m-Banking Application Using SEM. Sustainability 2023, 15, 9908. [Google Scholar] [CrossRef]
  19. Bıçakcı, A.S.; Evren, A.G. Thinking multiculturality in the age of hybrid threats: Converging cyber and physical security in Akkuyu nuclear power plant. Nucl. Eng. Technol. 2022, 54, 2467–2474. [Google Scholar] [CrossRef]
  20. Nshom, E.; Khalimzoda, I.; Sadaf, S.; Shaymardanov, M. Perceived threat or perceived benefit? Immigrants’ perception of how Finns tend to perceive them. Int. J. Intercult. Relat. 2022, 86, 46–55. [Google Scholar] [CrossRef]
  21. Eberle, J.; Daniel, J. Anxiety geopolitics: Hybrid warfare, civilisational geopolitics, and the Janus-faced politics of anxiety. Political Geogr. 2022, 92, 102502. [Google Scholar] [CrossRef]
  22. Procházka, J.; Vinkler, P.; Jojart, K.; Szenes, Z.; Gruszczak, A.; Kandrík, M. One threat-multiple responses: Countering hybrid threats in V4 countries. Obrana A Strateg. 2023, 23, 49–73. [Google Scholar] [CrossRef]
  23. Mekala, S.H.; Baig, Z.; Anwar, A.; Zeadally, S. Cybersecurity for Industrial IoT (IIoT): Threats, countermeasures, challenges and future directions. Comput. Commun. 2023, 208, 294–320. [Google Scholar] [CrossRef]
  24. Qin, X.; Jiang, F.; Cen, M.; Doss, R. Hybrid cyber defense strategies using Honey-X: A survey. Comput. Netw. 2023, 230, 109776. [Google Scholar] [CrossRef]
  25. Hausken, K. Cyber resilience in firms, organizations and societies. Internet Things 2020, 11, 100204. [Google Scholar] [CrossRef]
  26. Tsaruk, O.; Korniiets, M. Hybrid nature of modern threats for cybersecurity and information security. Smart Cities Reg. Dev. J. 2020, 4, 57–78. [Google Scholar]
  27. Bachmann, S.D.; Gunneriusson, H. Terrorism and Cyber Attacks as Hybrid Threats: Defining a Comprehensive Approach for Countering 21st Century Threats to Global Risk and Security. J. Terror. Secur. Anal. 2014, 26–36. Available online: https://ssrn.com/abstract=2252595 (accessed on 6 September 2023). [CrossRef]
  28. Galinec, D.; Steingartner, W.; Zebić, V. Cyber Rapid Response Team: An Option within Hybrid Threats. In Proceedings of the 2019 IEEE 15th International Scientific Conference on Informatics, Poprad, Slovakia, 20–22 November 2019; pp. 43–50. [Google Scholar] [CrossRef]
  29. Maglaras, L.; Janicke, H.; Ferrag, M.A. Combining Security and Reliability of Critical Infrastructures: The Concept of Securability. Appl. Sci. 2022, 12, 10387. [Google Scholar] [CrossRef]
  30. Shaked, A.; Margalit, O. Sustainable Risk Identification Using Formal Ontologies. Algorithms 2022, 15, 316. [Google Scholar] [CrossRef]
  31. Sadik, S.; Ahmed, M.; Sikos, L.F.; Islam, A.K.M.N. Toward a Sustainable Cybersecurity Ecosystem. Computers 2020, 9, 74. [Google Scholar] [CrossRef]
  32. Nam, T. Understanding the gap between perceived threats to and preparedness for cybersecurity. Technol. Soc. 2019, 58, 101122. [Google Scholar] [CrossRef]
  33. Larsen, M.H.; Lund, M.S.; Bjørneseth, F.B. A model of factors influencing deck officers’ cyber risk perception in offshore operations. Marit. Transp. Res. 2022, 3, 100065. [Google Scholar] [CrossRef]
  34. Spearman, C. “General intelligence” objectively determined and measured. Am. J. Psychol. 1904, 15, 201–293. [Google Scholar] [CrossRef]
  35. Trojanowska, J.; Husár, J.; Hrehova, S.; Knapčíková, L. Poka Yoke in Smart Production Systems with Pick-to-Light Implementation to Increase Efficiency. Appl. Sci. 2023, 13, 11715. [Google Scholar] [CrossRef]
  36. Kulugh, V.E.; Mbanaso, U.M.; Chukwudebe, G. Cybersecurity Resilience Maturity Assessment Model for Critical National Information Infrastructure. SN Comput. Sci. 2022, 3, 217. [Google Scholar] [CrossRef]
  37. Increasing Slovakia’s Resilience to Hybrid Threats by Strengthening Public Administration Capacities. The Project of The European Social Fund of the EU, Grant Code ITMS2014+:314011CDW7. The National Project of the Ministry of Interior of the Slovak Republic Solved with Co-Partners (Within Them: The Academy of the Police Force in Bratislava). Available online: https://www.minv.sk (accessed on 5 December 2023).
  38. Shah, R.; Goldstein, S.M. Use of structural equation modeling in operations management research: Looking back and forward. J. Oper. Manag. 2006, 24, 148–169. [Google Scholar] [CrossRef]
  39. Wallenburg, C.M.; Weber, J. Structural Equation Modelling as a Basis for Theory Development within Logistics and Supply Chain Management Research. In Research Methodologies in Supply Chain Management; Kotzab, H., Seuring, S., Muller, M., Reiner, G., Eds.; Physica: Heidelberg, Germany, 2005; pp. 171–186. [Google Scholar]
  40. Oroni, C.Z.; Xianping, F. Structural evaluation of management capability and the mediation role of cybersecurity awareness towards enterprise performance. J. Data Inf. Manag. 2023, 5, 345–361. [Google Scholar] [CrossRef]
  41. Huang, Z.; Shahzadi, A.; Khan, Y.D. Unfolding the Impact of Quality 4.0 Practices on Industry 4.0 and Circular Economy Practices: A Hybrid SEM-ANN Approach. Sustainability 2022, 14, 15495. [Google Scholar] [CrossRef]
  42. Ritmak, N.; Rattanawong, W.; Vongmanee, V. A New Dimension of Health Sustainability Model after Pandemic Crisis Using Structural Equation Model. Sustainability 2023, 15, 1616. [Google Scholar] [CrossRef]
  43. Rosak-Szyrocka, J.; Tiwari, S. Structural Equation Modeling (SEM) to Test Sustainable Development in University 4.0 in the Ultra-Smart Society Era. Sustainability 2023, 15, 16167. [Google Scholar] [CrossRef]
  44. Stoelting, R. Structural Equation Modeling/Path Analysis. 2002. Available online: http://userwww.sfsu.edu/~efc/classes/biol710/path/SEMwebpage.htm (accessed on 20 August 2023).
  45. Mulaik, S.A. A brief history of the philosophical foundations of exploratory factor analysis. Multivar. Behav. Res. 1987, 22, 267–305. [Google Scholar] [CrossRef]
  46. Mulaik, S.A. Factor Scores and Factor Indeterminacy. Foundations of Factor Analysis, 2nd ed.; Chapman and Hall/CRC: London, UK, 2009. [Google Scholar]
  47. Graham, J.M.; Guthrie, A.C.; Thompson, B. Consequences of not interpreting structure coefficients in published CFA research: A reminder. Struct. Equ. Model. 2003, 10, 142–153. [Google Scholar] [CrossRef]
  48. Rhemtulla, M.; Brosseau–Liard, P.; Savalei, V. When Can Categorical Variables Be Treated as Continuous? A Comparison of Robust Continuous and Categorical SEM Estimation Methods Under Suboptimal Conditions. Psychol. Methods 2012, 17, 354–373. [Google Scholar] [CrossRef] [PubMed]
  49. Xia, Y.; Yang, Y. RMSEA, CFI, and TLI in structural equation modeling with ordered categorical data: The story they tell depends on the estimation methods. Behav Res 2019, 51, 409–428. [Google Scholar] [CrossRef] [PubMed]
  50. Torun, E.D. Educational Use of Social Media in Higher Education: Gender and Social Networking Sites as the Predictors of Consuming, Creating, and Sharing Content. Acta Educ. Gen. 2020, 10, 112–132. [Google Scholar] [CrossRef]
  51. Hu, L.-T.; Bentler, P.M. Fit indices in covariance structure modeling: Sensitivity to underparameterized model misspecification. Psychol. Methods 1998, 3, 424–453. [Google Scholar] [CrossRef]
  52. Jöreskog, K.G.; Sörbom, D. LISREL 8: Structural Equation Modeling with the SIMPLIS Command Language; Scientific Software International: Skokie, IL, USA, 1993. [Google Scholar]
  53. Marsh, H.W.; Balla, J.R.; McDonald, R.P. Goodness-of-fit indexes in confirmatory factor analysis: The effect of sample size. Psychol. Bull. 1988, 103, 391–410. [Google Scholar] [CrossRef]
  54. Schermelleh-Engel, K.; Moosbrugger, H.; Müller, H. Evaluating the Fit of Structural Equation Models: Tests of Significance and Descriptive Goodness-of-Fit Measures. Methods Psychol. Res. 2003, 8, 23–74. [Google Scholar]
  55. Bentler, P.M.; Bonett, D.G. Significance tests and goodness of fit in the analysis of covariance structures. Psychol. Bull. 1980, 88, 588–606. [Google Scholar] [CrossRef]
  56. Bentler, P.M. Multivariate analysis with latent variables: Casual modeling. Annu. Rev. Psychol. 1980, 31, 419–456. [Google Scholar] [CrossRef]
  57. Marsh, H.W.; Hau, K.-T.; Artelt, C.; Baumert, J.; Peschar, J.L. OECD’s Brief Self-Report Measure of Educational Psychology’s Most Useful Affective Constructs: Cross-Cultural, Psychometric Comparisons Across 25 Countries. Int. J. Test. 2006, 6, 311–360. [Google Scholar] [CrossRef]
  58. Browne, M.W.; Cudeck, R. Alternative Ways of Assessing Model Fit. Sociol. Methods Res. 1992, 21, 230–258. [Google Scholar] [CrossRef]
  59. Byrne, B.M.; Campbell, T.L. Cross-Cultural Comparisons and the Presumption of Equivalent Measurement and Theoretical Structure: A Look Beneath the Surface. J. Cross-Cult. Psychol. 1999, 30, 555–574. [Google Scholar] [CrossRef]
  60. Cho, G.; Hwang, H. Structured Factor Analysis: A Data Matrix-Based Alternative Approach to Structural Equation Modeling. Struct. Equ. Model. A Multidiscip. J. 2023, 30, 364–377. [Google Scholar] [CrossRef]
  61. Robitzsch, A. Estimating Local Structural Equation Models. J. Intell. 2023, 11, 175. [Google Scholar] [CrossRef]
Figure 1. The theoretical CFA model in general form. A, B—factors, “1”—unit limitation identification.
Mathematics 12 00343 g001
Figure 2. Theoretical factor model of cybersecurity (FMSC) threat risk perception.
Mathematics 12 00343 g002
Figure 3. Differences in risk perception of the cyber spying (CYBSPY) pillar between SK and CZ groups.
Mathematics 12 00343 g003
Figure 4. Differences in the perception of the risk of the pillar Disrupting or reducing IT infrastructure resilience (DISRIT) between the SK and CZ groups.
Mathematics 12 00343 g004
Figure 5. Differences in the perception of the risk of the cyberterrorism (CYBTER) pillar between the SK and CZ groups.
Mathematics 12 00343 g005
Figure 6. Differences in risk perception of the pillar Disrupting or reducing eGovernment security (DISREG) between the SK and CZ groups.
Mathematics 12 00343 g006
Figure 7. Differences in the perception of risk of the enemy campaigns (ENECAM) pillar between the SK and CZ groups.
Mathematics 12 00343 g007
Table 1. Description of the research sample by categories: country, gender, and age of the respondent.
N = 964COUNTGENAGE1
<25 Years
AGE1
26–35 Years
AGE1
36–45 Years
AGE1
46–55 Years
AGE1
>55 Years
Row
Totals
CountSKmale135603440233
Column Percent34.62%54.05%54.84%23.53%
Row Percent57.94%25.75%14.59%1.72%0.00%
Table Percent23.28%10.34%5.86%0.69%0.00%40.17%
CountSKfemale2555128130347
Column Percent65.38%45.95%45.16%76.47%
Row Percent73.49%14.70%8.07%3.75%0.00%
Table Percent43.97%8.79%4.83%2.24%0.00%59.83%
CountTotal39011162170580
Table Percent67.24%19.14%10.69%2.93%0.00%100.00%
CountCZmale2133924120288
Column Percent76.34%86.67%72.73%50.00%0.00%
Row Percent73.96%13.54%8.33%4.17%0.00%
Table Percent55.47%10.16%6.25%3.13%0.00%75.00%
CountCZfemale666912396
Column Percent23.66%13.33%27.27%50.00%100.00%
Row Percent68.75%6.25%9.38%12.50%3.13%
Table Percent17.19%1.56%2.34%3.13%0.78%25.00%
CountTotal2794533243384
Table Percent72.66%11.72%8.59%6.25%0.78%100.00%
Note: COUNT—country, GEN—gender, AGE1—age (on a numerical scale).
Table 2. Evaluation criteria of the fundamental factor model of cybersecurity.
Fit Indices UsedPerfect Fit IndicesAcceptable Fit IndicesCFA ResultsReferences
χ2/df0 ≤ χ2/df ≤ 22 ≤ χ2/df ≤ 31.085[51]
GFI0.95 ≤ GFI ≤ 1.000.90 ≤ GFI ≤ 0.950.974[52,53,54]
AGFI0.90 ≤ AGFI ≤ 1.000.85 ≤ AGFI ≤ 0.900.957
CFI0.95 ≤ CFI ≤ 1.000.90 ≤ CFI ≤ 0.950.998[55,56,57]
NFI0.95 ≤ NFI ≤ 1.000.90 ≤ NFI ≤ 0.950.971
TLI0.97 ≤ TLI ≤ 1.000.95 ≤ TLI ≤ 0.970.996
RMSEA0.00 ≤ RMSEA ≤ 0.050.05 ≤ RMSEA ≤ 0.080.009[51,54,58,59]
SRMR0.00 ≤ SRMR ≤ 0.050.05 ≤ SRMR ≤0.100.0196
pp > 0.050.098
Note: χ2—Chi-square, df—degrees of freedom, GFI—goodness of fit index, AGFI—adjusted goodness of fit index, CFI—comparative fit index, NFI—the Bentler–Bonett normed fit index, TLI—Tucker–Lewis’s coefficient, RMSEA—root mean square error of approximation, SRMR—standardised root mean square residual.
Table 9. Assessment criteria of partial factor models of cybersecurity for respondents from the Slovak Republic (SK) and Czech Republic (CZ).
Fit Indices UsedPerfect Fit IndicesAcceptable Fit IndicesResults
SK
Results
CZ
χ2/df0 ≤ χ2/df ≤ 22 ≤ χ2/df ≤ 31.0851.102
GFI0.95 ≤ GFI ≤ 1.000.90 ≤ GFI ≤ 0.950.9580.942
AGFI0.90 ≤ AGFI ≤ 1.000.85 ≤ AGFI ≤ 0.900.9320.897
CFI0.95 ≤ CFI ≤ 1.000.90 ≤ CFI ≤ 0.950.9970.993
NFI0.95 ≤ NFI ≤ 1.000.90 ≤ NFI ≤ 0.950.9600.933
TLI0.97 ≤ TLI ≤ 1.000.95 ≤ TLI ≤ 0.970.9950.988
RMSEA0.00 ≤ RMSEA ≤ 0.050.05 ≤ RMSEA ≤ 0.080.0120.016
SRMR0.00 ≤ SRMR ≤ 0.050.05 ≤ SRMR ≤ 0.100.02380.0385
pp > 0.050.0930.068
χ2—Chi-square, df—degrees of freedom, GFI—goodness of fit index, AGFI—adjusted goodness of fit index, CFI—comparative fit index, NFI—Bentler–Bonett normed fit index, TLI—Tucker–Lewis coefficient, RMSEA—root mean square error of approximation, SRMR—standardised root mean square residual, p—probability level, SK—Slovak Republic, CZ—Czech Republic.
Table 10. Estimates of the parameters of the cyber spying pillar for respondents from the Slovak and Czech Republics.
RelationshipSlovak RepublicCzech Republic
Est.Std. Est.tpEst.Std. Est.tp
CSPYQ1<---CYBSPY1.0000.63713.521<0.000 *1.0000.6400.818<0.000 *
CSPYQ2<---CYBSPY0.8620.58312.385<0.000 *0.8180.5008.083<0.000 *
CSPYQ3<---CYBSPY0.4960.3618.237<0.000 *0.5090.3466.443<0.000 *
CSPYQ4<---CYBSPY1.0730.63814.841<0.000 *1.1220.6459.422<0.000 *
CSPYQ5<---CYBSPY1.1590.70914.684<0.000 *1.2200.7069.382<0.000 *
CSPYQ6<---CYBSPY1.0450.65113.573<0.000 *1.2030.6118.755<0.000 *
CSPYQ7<---CYBSPY1.1110.66713.976<0.000 *0.9780.5437.943<0.000 *
CSPYQ8<---CYBSPY1.0640.62113.340<0.000 *1.0270.5948.799<0.000 *
CSPYQ9<---CYBSPY1.0560.59812.664<0.000 *0.8360.4797.806<0.000 *
*—significant at the level of significance α = 0.05, Est.—regression weight, Std. Est.—standardised regression weight, tt-statistic, p—probability level, CYBSPY—Cyber spying.
Table 15. Analysis of the interrelationships of the individual pillars of cybersecurity.
RelationshipSlovak RepublicCzech Republic
Covar.p-ValueCorrelationCovar.p-ValueCorrelation
CYBSPY<-->CYBTER0.324<0.001 *0.8090.103<0.001 *0.531
DISRIT<-->DISREG0.523<0.001 *0.8820.227<0.001 *0.837
DISRIT<-->ENECAM0.415<0.001 *0.7930.150<0.001 *0.627
CYBSPY<-->DISREG0.325<0.001 *0.7580.237<0.001 *0.757
DISRIT<-->CYBTER0.447<0.001 *0.8050.123<0.001 *0.730
CYBSPY<-->ENECAM0.295<0.001 *0.7820.188<0.001 *0.680
CYBSPY<-->DISRIT0.419<0.001 *0.9080.237<0.001 *0.883
DISREG<-->ENECAM0.407<0.001 *0.8390.204<0.001 *0.728
CYBTER<-->ENECAM0.402<0.001 *0.8860.132<0.001 *0.762
CYBTER<-->DISREG0.386<0.001 *0.7490.130<0.001 *0.663
*—significant at the level of significance α = 0.05, Covar.—covariation, p-value—probability level, CYBSY—cyber spying, CYBTER—cyberterrorism, DISRIT—disrupting or reducing IT infrastructure resistance, ENECAM—enemy campaigns, DISREG—disrupting or reducing e-government security.
Disclaimer/Publisher’s Note: The statements, opinions and data contained in all publications are solely those of the individual author(s) and contributor(s) and not of MDPI and/or the editor(s). MDPI and/or the editor(s) disclaim responsibility for any injury to people or property resulting from any ideas, methods, instructions or products referred to in the content.

