Abstract
The process of software development is incomplete without software testing. Software testing expenses account for almost half of all development expenses. The automation of the testing process is seen to be a technique for reducing the cost of software testing. An NP-complete optimization challenge is to generate the test data with the highest branch coverage in the shortest time. The primary goal of this research is to provide test data that covers all branches of a software unit. Increasing the convergence speed, the success rate, and the stability of the outcomes are other goals of this study. An efficient bioinspired technique is suggested in this study to automatically generate test data utilizing the discretized Bat Optimization Algorithm (BOA). Modifying and discretizing the BOA and adapting it to the test generation problem are the main contributions of this study. In the first stage of the proposed method, the source code of the input program is statistically analyzed to identify the branches and their predicates. Then, the developed discretized BOA iteratively generates effective test data. The fitness function was developed based on the program’s branch coverage. The proposed method was implemented along with the previous one. The experiments’ results indicated that the suggested method could generate test data with about 99.95% branch coverage with a limited amount of time (16 times lower than the time of similar algorithms); its success rate was 99.85% and the average number of required iterations to cover all branches is 4.70. Higher coverage, higher speed, and higher stability make the proposed method suitable as an efficient test generation method for real-world large software.
Keywords:
bioinspired testing method; discretized bat optimization algorithm; branch coverage; stability; success rate MSC:
68Q07; 68T20
1. Introduction
The research problem in this paper originates from the important and increasing role of software in various applications of human life. Software is also widely used in even highly critical and vital cases such as medical, financial, and military applications. Currently, the failure of safety-critical software may result in irrecoverable life and financial costs. Software testing is considered a significant step in the software development process, which is aimed at improving the software quality. A software test includes the running of the intended software to identify probable faults. Testing accounts for almost half of the development cost [1,2]. As a result, one of the major and difficult issues of software engineering is the requirement to lower the overall costs of software tests [3,4,5]. One method for regulating and lowering the expenses of software testing is thought to be the automation of testing processes. Test automation enables the testing team to identify a higher number of faults with less time and cost. One problem that programmers deal with is the automatic creation of effective test data. Effective test data is considered to have primarily greater code coverage capacity. In real-world programs with millions of lines of code, it is hard to manually generate effective test data.
The main research question of this study is as follows: how to generate effective test data rapidly is one of the research’s challenges. Generating a test set having a maximum branch coverage in a finite period is an NP-complete optimization issue since there are 2n branches (test pathways) in a program with n conditional instructions. The major goal of this study is to generate test data with the greatest amount of branch coverage in the shortest time possible. Test data have been produced using a variety of heuristic algorithms, such as the Genetic Algorithm (GA), Particle Swarm Algorithm (PSO), Ant Colony Optimization (ACO) method, and Artificial Bee Colony (ABC) algorithm [6,7,8]. The existing methods are not able to cover the hard-to-cover codes of programs. Furthermore, the insufficient success rate of the existing methods to provide optimal coverage is one of the other demerits of the existing methods. This study’s objective is to rapidly produce the test data for a software unit (function) with maximum branch coverage and success rate. Identifying and testing the paths with a higher error-propagation rate is the other challenging problem. The fitness function can be expanded to incorporate the numerous issues that come up while creating test data for software.
In this study, a method for automatically generating effective test data was proposed. By modifying and discretizing Bat Optimization Algorithm (BOA), an efficient technique is suggested in this work to automatically create test data. The proposed method seeks to produce test data that have the greatest branch coverage in the least amount of time. The given program’s code is statistically examined in the first step of the suggested method to determine its branches and related predicates. The suggested BOA then creates efficient test data iteratively. Based on how well the software covered its branches, the fitness function was created. The contributions of this work are as follows:
- Developing a bioinspired technique for automatically creating test data using the modified version of the BOA,
- Achieving more branch coverage at a faster convergence rate,
- Stable outcomes are produced by the suggested technique in different executions,
- Implementing an autonomous test generation system that is open source and free for software testers and engineers to use.
This paper is organized as follows: The topic of pertinent research, ideas, and obstacles surrounding the automatic creation of test data is covered in Section 2. The suggested test generation method is described and discussed in Section 3. The findings are then discussed in Section 4. Section 5 concludes with suggestions for additional research.
2. Related Work
Nowadays, different machine learning and artificial intelligence algorithms have been extensively used in different fields of software engineering. Numerous studies have been conducted on this domain of software engineering. Regarding the way of producing testing data and detecting software errors, researchers in this area have recently concluded that search-based methods have more coverage and performance than other methods. An approach has been recently proposed for testing data by using random algorithms. Harmen et al. [6] proposed a random approach for generating test data. This approach keeps producing random data until effective data are generated. It did not produce the desired outcomes since there was no effective goal function. Simulated annealing (SA) was suggested by researchers as a solution to the creation of testing data. The SA approach, in other words, produces ideal testing data by transforming the difficulty of producing test data into an optimization problem [7]. The main issue with this technique is that it relies on local optimization, which can be resolved by non-greedy choices. This approach is suitable for structural testing. Sharma et al. [8] addressed the application of GA as a successful evolutionary algorithm in this problem. The results of experiments were evaluated on six benchmark programs, which indicated that the produced data has been improved.
In line to produce testing data, GA was used for selecting sub-paths [9]; also, they used candidate solutions for achieving optimal processes. In this work, the fitness function was presented under the name of the similarity function, which assesses how closely the traveled path resembles the desired path. The remaining test set was chosen using this method. Path coverage when running the program is referred to as “path optimality” in this context. The level of optimality rises as the extent of path coverage does. In this study, it was found that, when the GA is used, the required time for finding the optimal route is remarkably reduced. To produce testing data that maximized branch coverage, an ACO-based technique was proposed by Mao et al. [10]. In this work, a unique fitness function was created to increase branch coverage probability. The results of the studies showed that this approach has greater coverage, convergence speed, and stability qualities.
Particle swarm optimization (PSO) algorithm was employed by Mao et al. [11] to resolve the issue of autonomous test data creation due to its remarkable advantages and capabilities. The branch coverage criterion served as the basis for the objective function of this method. The research outcomes demonstrated that this approach outperformed various algorithms regarding branch coverage and execution speed. The branch coverage metric was utilized to generate testing data using the harmony search method [12]. The creation of test cases was significantly influenced by the fitness function. The branch distance criterion was used for designing this function. The obtained results indicate that by using harmony search, testing data can be produced that have much higher coverage than the other methods.
ABC algorithm was also utilized to create test data [13]. The suggested technique begins with the user selecting the program under test (PUT). The structural information of PUT, such as the number of input arguments, branches, and lines of code (LOC) was statically identified in the first stage of this technique. In this paper, branch coverage was defined as the fitness function. In this paper, branch weight relates to a branch’s reachability; the predicate weight shows the degree of complexity of the branches’ predicates. These predicates must be true (the condition must be satisfied) before the branch can be said to be covered by the data values. As benchmarks for comparisons, seven popular and traditional programs from the research were used. Based on the findings, the ABC-based approach outperforms GA, PSO, ACO, and SA on average: 99.99% average branch coverage, 99.94% success rate, 3.59 average convergence, and 0.18 ms average execution time.
An automated test-data generating approach utilizing the Shuffle frog leaping algorithm (SFLA) was presented by Ghaemi and Arasteh [14]. The branch-coverage-based fitness function was used in this study. SFLA as a swarm-based heuristic algorithm was used to generate test data. In this method, everyone was defined as test data. The randomly generated test data at the first iteration of this method were evolved iteratively by the imitation operator of the SFLA algorithm. This technique was thoroughly evaluated using the seven conventional standard benchmarks, and the findings indicate that it has certain benefits over prior algorithms like GA, PSO, and ACO. In the fewest iterations possible, the SFLA-based technique produces test data with 99.99% branch coverage. Moreover, with a 99.97% success rate, it consistently produces the best test data.
Arasteh et al. [15] offered an automated approach for generating structural test data was proposed. The program source code is statically evaluated in the first phase, and the structural information necessary for the subsequent stages is extracted. In the subsequent phase, the imperialist competitive algorithm (ICA) was implemented to generate the best test data. The objective function was established using the coverage-based distance function. By exploring and directing the generated data in this approach, branch coverage is increased. Each agent in the population is a portion of test data drawn at random from the starting population. The imperialists were chosen because they were the best agents the same as GA. The suggested method outperformed the other methods with 99.99% average coverage, a 99.94% average success rate, and a 2.77 average generation. Table 1 contrasts the earlier methods.

Table 1.
A comparison of test generation methods.
3. Proposed Method
In this work, an automatic technique to generate the structural test data (at the unit level) is suggested. Figure 1 depicts the suggested method’s flowchart. The input program’s source code is statically examined in the first stage, after which the structural data needed for the succeeding processes is extracted. The BOA [18,19] is modified and used in the second stage to provide effective test data. The test data generated by the BOA is the second step’s output. The first and second steps of the suggested technique run entirely automatically on the input program unit. The suggested approach has been used to construct an automated software tool. The test criterion in the suggested technique was the coverage of program branches.
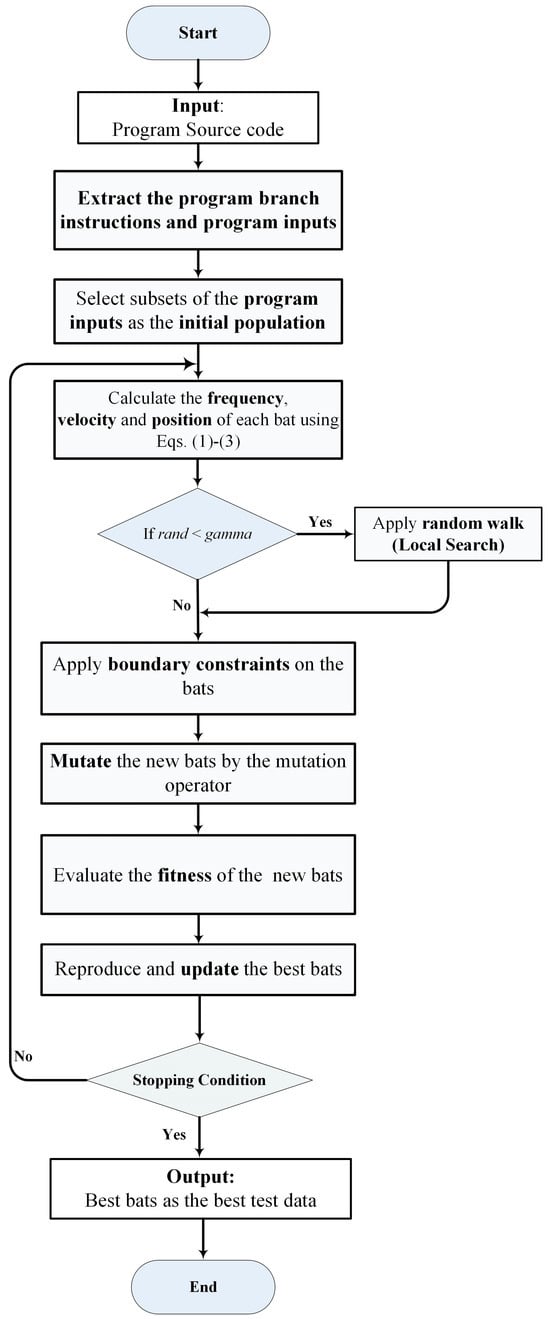
Figure 1.
Process of the proposed method.
Test-data generation consists of two parts: determining the path predicates and satisfying (covering) the predicates. For every test path Pi, there is a conjunctive predicate Pi = C1 ∧ C2 ∧ … ∧ Cn, whose conjuncts Cj match the decision nodes along the test path Pi. Given the path Pi, the test generation method should find the test data Xk which covers the Pi by satisfying its predicates. The software test generation method evaluates the assignments and decision Booleans of the test path (Pi). In this problem, Ak is the number of assignments in Pi and Bk is the number of simple Booleans in the test path Pi. Since test generation methods evaluate the decision expressions (assignments and decision Booleans) of the test path, the time complexity is proportional to Ak + Bk. In the worst case, the problem of finding Xk (test data) to Boolean satisfiability of Pk can be considered an NP-complete problem [20]. Indeed, the satisfaction (coverage) of Pk in the worst case is proportional to .
3.1. Program Source-Code Analysis
The suggested technique considers a program source code to be tested as its input. The number of inputs, the domain of the inputs, the number of conditional instructions in the program, and the expressions into conditional instructions are all retrieved from the program source code. The suggested method’s initial step is carried out automatically. The recommended method’s time complexity for this step is equal to O(n). The input and output of the first phase of the suggested technique for a benchmark program are shown in Figure 2.
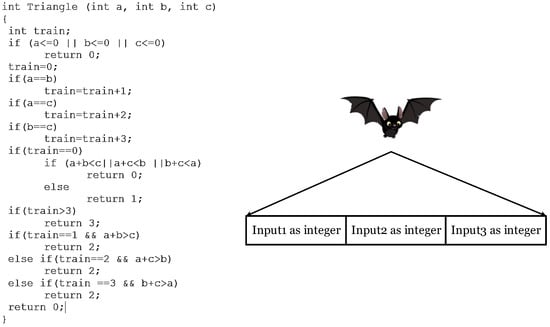
Figure 2.
Static analysis of the input program for extracting the structure of the input data and creating the bat array that includes the input parameters.
3.2. Test Data Generation using BOA
The BOA is considered to be one of the evolutionary algorithms inspired by nature which was introduced by Yang [18,19]. Agents (bats) in the BOA use sound reflection when swarming and hunting their prey. Agents make a lot of loud noise (sound) in their surroundings; then, they listen to their reflections on all sides. Wavelength is related to the prey size. All bats apply sound reflection to detect the distance to prey. Algorithm 1 shows the pseudocode of the suggested BOA.
| Algorithm 1 Pseudocode of the suggested BOA for producing test data in program testing | |
| 1 | Function BAT_algorithm(n, A, fmin, fmax, alpha, gamma, fobj, maxIter) % output: [bestSolution, bestFitness] |
| 2 | Begin |
| 3 | n: Number of bats; |
| 4 | A: Loudness; |
| 5 | fmin, fmax: Frequency range; |
| 6 | alpha: Loudness decay; |
| 7 | gamma: Pulse rate; |
| 8 | fobj: Objective function handle; |
| 9 | maxIter: Maximum number of iterations; |
| 10 | Initialize the bat population; |
| 11 | Initialize the velocities; |
| 12 | Evaluate the initial solutions; |
| 13 | Find the initial best solution; |
| 14 | % Main loop |
| 15 | for iter = 1:maxIter % Update bat positions and frequencies |
| 16 | for i = 1:n |
| 17 | Update the bat frequency by Eq. (1); |
| 18 | Update the bat velocity by Eq. (2); |
| 19 | Update the bat position by Eq. (3); |
| 20 | % Apply the random walk with probability gamma |
| 21 | if rand() < gamma |
| 22 | bat(i) = bestSolution + randn(1, numel(fmin)) * alpha; |
| 23 | end |
| 24 | % Apply boundary constraints if necessary |
| 25 | bat(i) = max(bat(i), fmin); |
| 26 | bat(i) = min(bat(i), fmax); |
| 27 | Apply mutation operator on the best bat; |
| 28 | Evaluate new solution; |
| 29 | % Update best solution |
| 30 | if newFitness < bestFitness |
| 31 | bestFitness = newFitness; |
| 32 | bestSolution = bat(i); |
| 33 | end |
| 34 | end |
| 35 | % Update loudness |
| 36 | end |
| 37 | end |
Bats fly randomly at Vi speed in the Xi location with the fmin frequency and different wavelengths of λ and the sound loudness of Ai. Sound loudness may vary from Rmin (the minimum amount) to Rmax (the maximum amount). The position of each bat indicates the input data (test data) of the program. Each bat includes position Xi, pulse frequency fi, initial pulse ri, and sound loudness Ai. Figure 3 shows how to encode the position of each bat in the TDG problem. The BOA typically involves several stages during each iteration. Initialization is the first stage of the BOA. In this stage, a population of bats with random positions in the search space is generated and their velocities and frequencies are randomly initialized. The fitness of each bat is evaluated using the objective function (i.e., Equation (8)). In the second stage, the bat with the best fitness value is selected as the best bat. After selecting the best bat, the velocities of bats based on their current positions and the global best solution are updated; then, the positions of bats based on their velocities are updated (using Equations (1)–(3)). In the third stage, a local solution (bat) is generated around the selected best solution. The fitness of the new bat is evaluated, and the best solution is compared to it. If the new Bat has better fitness than the current global best, the global best solution is updated. The loudness and pulse rate are updated.
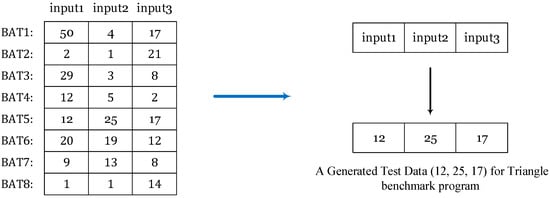
Figure 3.
Population structure and the representation of the bat position as an array in TDG problem.
In the BOA, local and global searches are conducted to find the best bat (solution) in the current iterations. Bat positions are updated according to sound loudness Ai and pulse rate ri. Moreover, the global optimal solution is simultaneously updated. The location of the bat (as an array) is encoded as the test data. New solutions (test data) are generated by adjusting frequency based on a fitness function, speed, and location; they are updated by using Equations (1)–(3). Here, β is considered as a random number between 0 and 1 with uniform distribution. Equation (4) was used to implement the local search stage; the location of the current best bat is modified using direct exploitation (random walk). In Equation (4), is a random number with uniform distribution from [−1, 1].
Each bat’s new position is updated locally using a random walk algorithm in which one integer is chosen at random. Here, At indicates the average loudness of bats’ sounds within iteration t. The sound loudness and the pulse rate within each iteration are updated by using Equations (5)–(7). Moreover, α and are used as a constant coefficient parameter, ().
3.3. Fitness Function
An objective (fitness) function has been defined for comparing the solutions’ effectiveness and selecting the best solution. One of the most important phases in solving optimization issues is selecting the proper fitness function. The fitness function employed in this work was the distance function. The input program for this function contains s branches (s indicates the number of branch instructions). Using bchi, the program’s several branches are selected. In this study, TS indicates a test suite that includes a set of generated test data. An input data is indicated by the variable Xk TS (1 < k < m) if there are exactly m inputs. Equation (8) is used for calculating the fitness function of test data:
The value of δ, as the constant number, is determined by trial and error. Its value is 0.01. The weight of a branch in the source code is represented by a variable. Here, f indicates the branch distance function. Table 2 is used to calculate the distance function of the branch instructions in the source code. The distance function of a branch instruction is a function of its conditional expression. The fitness function of all the test data in the test suit (TS) is calculated using Equation (9):

Table 2.
Branch-distance function based on the branch’s predicates.
Equation (9) calculates the fitness of the generated test suite based on the distance function. Table 2 was used to calculate the distance value ( for each branch in the program. The result of the distance function will be zero, as indicated in Table 2, if the conditional expression is true given the generated inputs; otherwise, the variable value will be added to the conditional expression’s value. The δ value is 0.01 in the experiments. Equation (9) is assessed as 1/δ if the test set (TS) covers all of the branches; as a result, maximum effectiveness is attained. Branch weight (wi) is the coefficient of the distance function (f) in Equation (9). The weight of the branch in the branch instruction is indicated by variable wi. The branch weight of a branch instruction is the summation of its nesting level and its predicate weight and is calculated using Equation (10), where wi denotes the weight of the ith branch and λ indicates the equilibrium coefficient. In the experiments, is set to 0.5 [10]. The branch weight is the function of the following factors:
- Branch level (nesting level)
- Expression weigh
The nesting level or branch level (as the first factor of branch weight) is obtained via Equation (11). The value of this equation denotes the nesting level of the branch. Accessing a branch with a higher nesting level will be more difficult. The variable i denotes a particular branch where () and the variable depicts the nesting level of the ith branch. The variable nlmin designates the program’s lowest branch level, which is 1 in this case. In the program, the highest branch level is indicated by the variable nlmax. Each branch instruction’s level is normalized using Equation (12).
The expression weight (as the second factor of the branch weight) reveals the expressions’ complexity. Using Equation (13) and Table 3, the expression weight of a branch is determined. Each expression includes h predicates. The expression weight is equivalent to the square root of the predicates’ weight in cases when the branch instruction consists of h predicates that have been merged using “and” operator. The expression weight is the same as the least amount of the predicate weight if the branch instruction contains h expressions that have been merged by “or” operator. Equation (14) was used for normalizing the weight of an expression where the expression weight of the respective branch is divided by the total weight of the branches.

Table 3.
Weight of the operators into the predicate of conditional expressions [10].
In Equation (13), bchi denotes the ith branch (). The variable h indicates the number of available predicates in the respective branch. Here, cj indicates the jth conditional predicate () in the respective branch. The variable wr denotes the weight of an operator in the predicate whose value is determined using Table 3. The operators that could be present in the various predicates are listed in this table.
4. Experiment System and Results
In this investigation, the best test data with the most branch coverage were produced using the modified BOA. The effectiveness of the suggested strategy for producing test data was assessed and investigated through a series of experiments and tests on benchmark programs. Figure 4 shows how experiments are conducted.
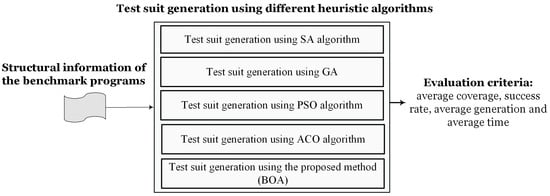
Figure 4.
Process of experiments conducted in this study.
4.1. Experiment System
The suggested technique, together with the SA [7], GA [9], ACO [10], and PSO [11], was implemented in MATLAB programming language v2016a. In the current investigation, an identical hardware setup with 8GB RAM, Intel Core i7 CPU, and Windows 10 OS was used for all trials. MATLAB is a programming language with outstanding functions for computational operations; it offers numerous demonstrational computation features and programming.
It has an extensive toolbox including an array of mathematical and computational functions. The evaluation criteria are as follows:
- Average coverage: this criterion shows the branch coverage of the created test set. The efficacy increases with the value of this criteria.
- Average generation: It represents the typical number of iterations needed for the particular method to cover all program branches. The suggested method performs better the smaller the value of this criteria is.
- Average execution time (ATE): It speaks of the typical time needed to cover every program branch. Milliseconds are used to measure this criterion (ms). The performance of the corresponding approach is inversely correlated with the value of this metric.
- Success rate (SR): It shows the ability of the algorithm to cover all branches of the program.
The collection of benchmark programs has been employed in several earlier studies to assess the effectiveness of test data [9,10,11,12,13,14,15]. The characteristics of the benchmark programs employed in this investigation are listed in Table 4.

Table 4.
Specifications of the benchmarks.
4.2. Results and Discussion
In this study, a large number of experiments were conducted, and the suggested approach was assessed using the aforementioned standards. The first criterion was the average branch coverage by the generated test data, as was previously described. Each test production method was run ten times to acquire the average values of the branch coverage. The results show that most benchmark programs provide test data with better branch coverage. The ability to detect bugs increases with the degree of coverage of the data. One could argue that the test results produced by the recommended method are more beneficial.
The program’s source code is divided into classes and functions; huge programs are made up of classes and functions towards the end. Contrarily, according to programming best practices, a function contains between 20 and 100 lines of code. The benchmarks utilized in this paper are extremely established and popular. Additionally, any programming constructions that can be applied to complicated software in the actual world are included in these benchmarks. These benchmarks employ every possible conditional, loop, arithmetic, logical, and jump operator and instruction. The same results can be produced by the suggested technique in real-world programs. The produced test data by the suggested methods in the triangleType, Cal, and Reminder benchmarks is 100%, as shown in Table 5. The suggested approach generates test data that has approximately 99.99% coverage. The suggested approach achieves 99.93% coverage in calDay, whereas PSO and ACO algorithms produce 100% coverage for this program. In terms of average coverage, the suggested strategy works better overall.

Table 5.
Average coverage of the test data generated by different test data generating methods (%).
As previously indicated, another factor utilized to compare the proposed technique to other algorithms in the creation of test data was convergence speed. This criterion shows the typical rate of delivering effective test results. An algorithm’s rate of convergence is determined by the average number of iterations needed to generate test data (AG). The algorithm’s rate of convergence is shown by the average number of iterations.
The average number of iterations indicates the convergence speed of the algorithm. Fewer numbers of iterations indicate a higher convergence speed of the related algorithm. Table 6 gives the average number of iterations for each algorithm concerning test data production. The obtained results reveal that the convergence speed of the BOA method is, on average, better than that of the GA. That is, when compared with the GA, in triangleType, isValidDate, Cal, Reminder, and printCalender, the proposed method can achieve maximum convergence speed.

Table 6.
Average generation of test generation methods.
Another assessment factor that was taken into account was the amount of time needed to produce the test data with the greatest possible coverage. A related algorithm’s fast speed is shown by less time spent producing test data. Table 7 displays the AET required to produce test data using various techniques. The suggested approach outperforms the GA and the PSO algorithm in terms of speed, as shown by the results collected and shown in Table 7. In triangleType, calDay, isValidDate, Cal, and Reminder benchmarks, the BOA method as well as the ACO method have higher speeds (lower time consumption) than the other methods. Indeed, can generate effective test data in less time and cost.

Table 7.
AET of different test data generating methods.
The success rate is another evaluation criterion that was used in this study for comparing different methods. This criterion reflects the chance that the test data generated will cover every software branch. Higher numbers for the output in this criterion suggest more efficacy. Each method was run ten times on each benchmark to calculate this criterion. The likelihood that each method would completely cover all program branches was then calculated. The likelihood that various algorithms will achieve 100% coverage is shown in Table 8. Except for the printCalender benchmark program, the suggested technique achieved a high percentage of success.

Table 8.
SR (%) of different test generation methods.
Another factor for assessing the results was the stability of the outcomes. It should be emphasized that the heuristic methods randomly produce the starting population. Hence, the results provided by different executions of each algorithm may be different. Accordingly, the results of only one execution may not demonstrate the capability of an algorithm; each algorithm should be executed more than once. Furthermore, the average standard deviation of the results should be computed and taken into consideration. In this study, 10 different executions (each execution includes 200 iterations) were investigated. The results from 10 executions of the benchmark programs showed that the average objective function of the BOA performed better than GA and ACO. Table 9 gives standard deviation values for 10 exactions of the different algorithms.

Table 9.
Standard deviation values for 10 exactions.
Figure 5 illustrates the coverage of the produced test data for all programs. In the experiments, the overall coverage of the test data is 99.95%. ACO and BOA generate test data with the most coverage. The average required time of the proposed method to achieve 99.95% coverage is 1.77 s. None of the existing methods generate test data with a coverage rate of 99.95% in 1.7 s. Regarding the average results shown in Figure 6, Figure 7 and Figure 8, the ACO achieves 99.97% code coverage in 26.15 s. Indeed, the time spent by the ACO algorithm is almost 14 times the time required by the BOA method. In real-world large software products, the required time of ACO is not acceptable compared to the time required by the BOA.
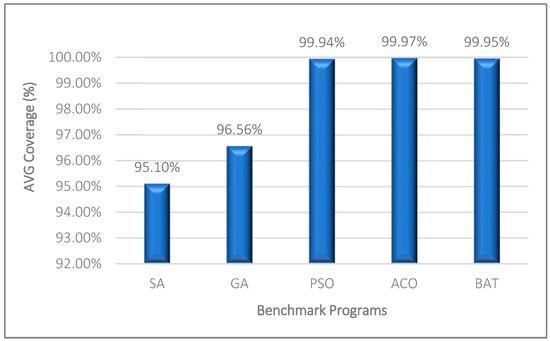
Figure 5.
Average coverage of the test data generated by different algorithms.
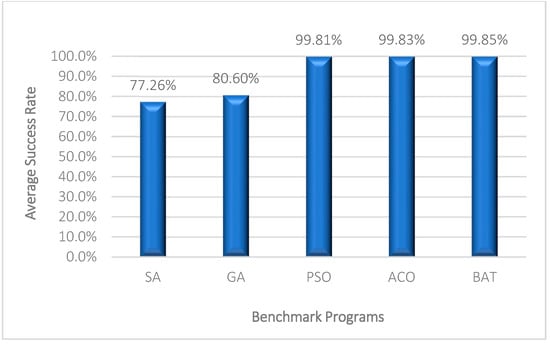
Figure 6.
Average success rate of the generated test data by the different algorithms.
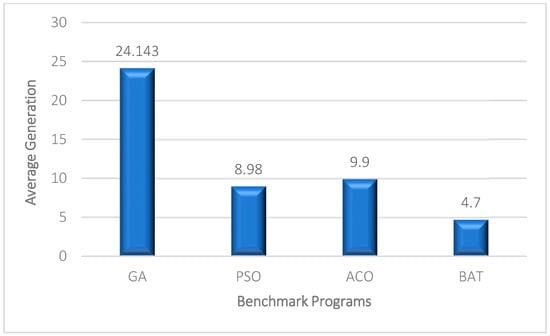
Figure 7.
Average number of iterations that is required for generating the test data with maximum coverage by the different algorithms.
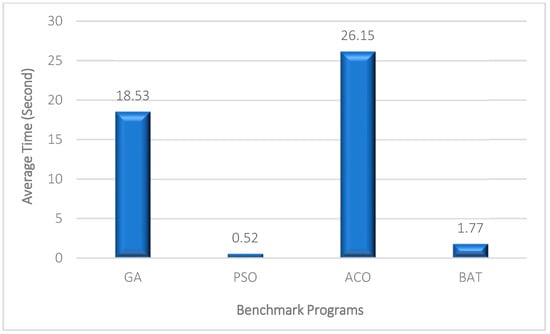
Figure 8.
Average execution time required to generate the optimal test data.
Figure 6 shows the success rate of algorithms in generating maximum-coverage test data. Significantly, 99.85% of the generated test data can achieve maximum coverage. Figure 7 shows the average number of iterations required by each algorithm to generate maximum-coverage test data. Figure 8 also illustrates the average required time of the test generation algorithms. The proposed method generates the maximum-coverage test data after about 4.7 iterations on average. Indeed, the proposed method has a higher convergence speed than the other test generation algorithms. Generating test data with 99.95% coverage after 4.7 iterations (on average) and 1.7 s by the proposed method is a superior result in the field. ACO can generate test data with a higher amount of coverage, but its speed is considerably lower than the proposed method. On the other hand, the stability of the proposed method is higher than the other algorithm. The stability of a heuristic-based algorithm indicates its reliability during different executions. The same or very similar results during different executions indicate the reliability of heuristic-based test generation algorithms. The standard deviation among the obtained results of the proposed method is 0.09 which is lower than the other algorithms. All in all, the proposed method can be used as an effective test generation method to test real-world large software products. Generating test data with 99.95% with a negligible amount of time and the lowest standard deviation (higher reliability) are the main advantages of the method.
4.3. Parameter Calibration and Statistical Analysis
Finding the best values for each method’s parameters is one of the downsides of heuristic algorithms. In most cases, parameters are crucial in advancing an algorithm toward the best outcome. The six parameters that make up the BOA can be modified depending on the software and the application in question. Like all the other algorithms, adjusting the parameters of the BOA is carried out via trial and error. These parameters are first given in Table 10; then, the optimal adjusted values for the BOA are shown in Table 11.

Table 10.
Parameters of modified BOA.

Table 11.
BOA parameters calibration.
To analyze the significance of the results, a statistical test has been performed on the results. ANOVA was used to evaluate the significance of the difference in the coverage of the generated test data. The outcomes of the ANOVA test are shown in Table 12. The significance of the variance in the results is shown by the values of f and p. The null hypothesis in the ANOVA test indicates that the coverage of the test data produced by various algorithms does not differ significantly. The ANOVA results show that the null hypothesis was not accepted, and they also show that the suggested approach and the other methods significantly differ in how well they cover the given program branches. The suggested strategy provides much more coverage of the test data generated.

Table 12.
Results of the ANOVA test on the average convergence of the generated test.
In this study, BOA was modified and discretized, and adopted to the test generation problem. Furthermore, a mutation operator was embedded into the BOA to create local diversity in the population. The modified and discretized BOA, as a swarm-based heuristic algorithm, has higher performance in the software test generation problem. Software test data generation is formally a combinatorial optimization problem. BOA was used to find the optimal combination of the test data to attain the highest branch coverage. The movement operator in the BOA was implemented based on sound loudness and frequency; in the test data generation problem, the developed BOA had a higher success rate and performance than the SA, GA, PSO, and ACO.
The mutation test was carried out to assess the efficacy of the generated test data using the suggested technique. The Mujava tool was used to automatically introduce a set of faults (bugs) into the program’s source code. The provided test data were used to identify the injected faults. Mujava evaluates the mutation score of the test data. The ability of each test set to find the implanted bugs is represented by the mutation score. Table 13 displays the mutation score (fault detection capabilities) of test data for each program. The findings validate the suggested method’s usefulness in generating bug detection data. Table 14 shows the generated test data for the triangletype program.

Table 13.
Mujava tool to calculate the mutation score.

Table 14.
Generated test data by the proposed method for the triangletype program.
5. Conclusions
Automatic test data creation refers to a procedure that generates data to fulfill the test criteria. The generation of test data in this study was done using the modified and discretized BOA. The authors focused on four criteria: branch coverage, average number of iterations, success rate, and average time to find optimal test data. The results of the experiment demonstrated that the proposed BOA has several benefits over other heuristic algorithms, such as GA, PSO, and ACO. The recommended BOA had an average branch coverage of 99.95%, an average duration of 1.77 s, and a success rate of 99.85%. The average number of iterations required to cover all branches was 4.70. The fundamental goal of the suggested technique was to cover every branch of a program. Additionally, some test paths in programs have higher error propagation. Therefore, the objective function should only include the paths that have a higher error propagation rate. Identifying and testing the paths with a higher error-propagation rate is suggested as a future study. As further research, other metaheuristic algorithms, such as Olympiad optimization [21], artificial rabbits optimization [22], gazelle optimization [23], African vultures optimization [24], and jellyfish search optimization [25], can be used to generate effective test data. The optimization and learning methods can be used in the software test generation methods. The fitness function can be expanded in future studies to incorporate the numerous issues that come up while creating test data for software.
Author Contributions
Conceptualization, O.F.; Methodology, B.A. and S.S.S.; Software, F.K.; Validation, B.A. and E.B.T.; Formal analysis, B.A., O.F., S.H. and E.B.T.; Investigation, K.A. and S.H.; Resources, K.A. and F.K.; Data curation, K.A.; Writing—original draft, F.K. and S.S.S.; Writing—review & editing, S.H. and E.B.T.; Project administration, S.S.S.; Funding acquisition, O.F. All authors have read and agreed to the published version of the manuscript.
Funding
This study has been conducted under the project ‘MObility and Training fOR beyond 5G ecosystems (MOTOR5G)’. The project has received funding from the European Union’s Horizon 2020 programme under the Marie Skłodowska Curie Actions (MSCA) Innovative Training Network (ITN) under grant agreement No. 861219.
Data Availability Statement
The datasets created and the code used during the current investigation are accessible on Google Drive and can be accessed through https://drive.google.com/drive/folders/1acF5W6p4hRvWy7hmNwdsy_N3d8iU26Q-?usp=sharing (accessed on 13 November 2023).
Conflicts of Interest
All authors state that there is no conflict of interest.
References
- Khamprapai, W.; Tsai, C.-F.; Wang, P.; Tsai, C.-E. Performance of Enhanced Multiple-Searching Genetic Algorithm for Test Case Generation in Software Testing. Mathematics 2021, 9, 1779. [Google Scholar] [CrossRef]
- Khurma, R.A.; Alsawalqah, H.; Aljarah, I.; Elaziz, M.A.; Damaševičius, R. An Enhanced Evolutionary Software Defect Prediction Method Using Island Moth Flame Optimization. Mathematics 2021, 9, 1722. [Google Scholar] [CrossRef]
- Khari, M.; Kumar, P. An extensive evaluation of search-based software testing: A review. Soft Comput. 2019, 23, 1933–1946. [Google Scholar] [CrossRef]
- Khoshniat, N.; Jamarani, A.; Ahmadzadeh, A.; Kashani, M.H.; Mahdipour, E. Nature-inspired metaheuristic methods in software testing. Soft Comput. 2023. [Google Scholar] [CrossRef]
- Aleti, A.; Moser, I.; Grunske, L. Analysing the fitness landscape of search-based software testing problems. Autom. Softw. Eng. 2017, 24, 603–621. [Google Scholar] [CrossRef]
- Khatun, S.; Rabbi, K.F.; Yaakub, C.Y.; Klaib, M.F.J. A Random search based effective algorithm for pairwise test data generation. In Proceedings of the International Conference on Electrical, Control and Computer Engineering 2011 (InECCE), Kuantan, Malaysia, 21–22 June 2011; pp. 293–297. [Google Scholar] [CrossRef]
- Cohen, M.B.; Colbourn, C.J.; Ling, A.C.H. Augmenting Simulated Annealing to Build Interaction Test Suites. In Proceedings of the Fourteenth International Symposium on Software Reliability Engineering (ISSRE’03), Denver, CO, USA, 17–20 November 2003; pp. 394–405. [Google Scholar]
- Sharma, C.; Sabharwal, S.; Sibal, R. A Survey on Software Testing Techniques using Genetic Algorithm. Int. J. Comput. Sci. 2014, 10, 381–393. [Google Scholar]
- Lin, J.C.; Yeh, P.L. Automatic Test Data Generation for Path Testing using Gas. J. Inf. Sci. 2001, 131, 47–64. [Google Scholar] [CrossRef]
- Mao, C.; Xiao, L.; Yu, X.; Chen, J. Adapting Ant Colony Optimization to Generate Test Data for Software Structural Testing. J. Swarm Evol. Comput. 2015, 20, 23–36. [Google Scholar] [CrossRef]
- Mao, C. Generating Test Data for Software Structural Testing Based on Particle Swarm Optimization. Arab. J. Sci. Eng. 2014, 39, 4593–4607. [Google Scholar] [CrossRef]
- Sahoo, R.K.; Ojha, D.; Mohapatra, D.P.; Patra, M.R. Automatic Generation and Optimization of Test Data Using Harmony Search Algorithm. Comput. Sci. Inf. Technol. Conf. Proc. 2016, 6, 23–32. [Google Scholar] [CrossRef]
- Aghdam, Z.K.; Arasteh, B. An Efficient Method to Generate Test Data for Software Structural Testing Using Artificial Bee Colony Optimization Algorithm. Int. J. Softw. Eng. Knowl. Eng. 2017, 27, 951–966. [Google Scholar] [CrossRef]
- Ghaemi, A.; Arasteh, B. SFLA-based heuristic method to generate software structural test data. J. Softw. Evol. Proc. 2020, 32, e2228. [Google Scholar] [CrossRef]
- Arasteh, B.; Hosseini, S.M.J. Traxtor: An Automatic Software Test Suit Generation Method Inspired by Imperialist Competitive Optimization Algorithms. J. Electron. Test. 2022, 38, 205–215. [Google Scholar] [CrossRef]
- Martou, P.; Mens, K.; Duhoux, B.; Legay, A. Test scenario generation for feature-based context-oriented software systems. J. Syst. Softw. 2023, 197, 111570. [Google Scholar] [CrossRef]
- Sulaiman, R.A.; Jawawi, D.N.; Halim, S.A. Cost-effective test case generation with the hyper-heuristic for software product line testing. Adv. Eng. Softw. 2023, 175, 103335. [Google Scholar] [CrossRef]
- Yang, X.; Gandomi, A. Bat Algorithm: A Novel Approach for Global Engineering Optimization. Engineering Computations. Eng. Comput. 2012, 29, 464–483. [Google Scholar] [CrossRef]
- Yang, X.S. A New Metaheuristic Bat-Inspired Algorithm, in: Nature Inspired Cooperative Strategies for Optimization (NISCO 2010). Stud. Comput. Intell. 2010, 284, 65–74. [Google Scholar]
- Alachtey, M.; Young, P. An Introduction to the General Theory of Algorithms; Elsevier: North-Holland, NY, USA, 1978. [Google Scholar]
- Arasteh, B.; Bouyer, A.; Ghanbarzadeh, R.; Rouhi, A.; Mehrabani, M.N.; Tirkolaee, E.B. Data replication in distributed systems using olympiad optimization algorithm. Facta Univ. Ser. Mech. Eng. 2023, 21, 501–527. [Google Scholar] [CrossRef]
- Wang, L.; Cao, Q.; Zhang, Z.; Mirjalili, S.; Zhao, W. Artificial rabbits optimization: A new bio-inspired meta-heuristic algorithm for solving engineering optimization problems. Eng. Appl. Artif. Intell. 2022, 114, 105082. [Google Scholar] [CrossRef]
- Agushaka, J.O.; Ezugwu, A.E.; Abualigah, L. Gazelle optimization algorithm: A novel nature-inspired metaheuristic optimizer. Neural Comput. Appl. 2023, 35, 4099–4131. [Google Scholar] [CrossRef]
- Singh, N.; Houssein, E.H.; Mirjalili, S.; Cao, Y.; Selvachandran, G. An efficient improved African vultures optimization algorithm with dimension learning hunting for traveling salesman and large-scale optimization applications. Int. J. Intell. Syst. 2022, 37, 12367–12421. [Google Scholar] [CrossRef]
- Zarate, O.; Zaldívar, D.; Cuevas, E.; Perez, M. Enhancing Pneumonia Segmentation in Lung Radiographs: A Jellyfish Search Optimizer Approach. Mathematics 2023, 11, 4363. [Google Scholar] [CrossRef]
Disclaimer/Publisher’s Note: The statements, opinions and data contained in all publications are solely those of the individual author(s) and contributor(s) and not of MDPI and/or the editor(s). MDPI and/or the editor(s) disclaim responsibility for any injury to people or property resulting from any ideas, methods, instructions or products referred to in the content. |
© 2024 by the authors. Licensee MDPI, Basel, Switzerland. This article is an open access article distributed under the terms and conditions of the Creative Commons Attribution (CC BY) license (https://creativecommons.org/licenses/by/4.0/).