Abstract
This study investigated non-instantaneous deteriorating items because not all products deteriorate immediately. In the high-tech product life cycle, the product demand increases linearly substantially in the growth stage and maintains a near-constant level in the maturity stage. This is a ramp-type demand rate. To satisfy the demand as shortages occur, partial backlogging is necessary. The advance-cash-credit payment scheme, comprising advance, cash, and credit payments, has gained popularity in business transactions to improve cash flow flexibility among supply chain participants. This study explored a partial backlogging inventory model with ramp-type demand for non-instantaneous deteriorating items under generalized payment. The proposed model also incorporated discounted cash flow analysis to account for the time value of the profit function. This study attempted to determine the optimal replenishment strategy to maximize the present value of the total profit. Finally, we conducted a sensitivity analysis to examine the efficacy of the proposed model and gain managerial insights. The optimal total profit rises with an increase in the permissible delay period and sale price but decreases with an increase in ordering and purchase costs. Then, the decision-maker can refer to the managerial insights to choose the appropriate parameter value for the operation.
MSC:
90B06
1. Introduction
Deterioration refers to the degradation or damage items may sustain while in storage. Many products deteriorate, such as fish, vegetables, and light bulbs. However, not all products deteriorate immediately when stored. They may deteriorate after a certain period because of superior preservation. These are non-instantaneous deteriorating items. In contrast to the assumptions of existing models, this study considered non-instantaneous deteriorating items, which is a crucial factor in inventory management. The three-parameter Weibull distribution deterioration is a general deterioration distribution, where indicates the deterioration rate at time t, and are the scale, shape, and location parameters of the distribution, respectively (Walpole and Myers [1]). For simplicity, we used only a single time point in this study: the time point at which items begin deteriorating. Previous scholars have also explored the topic of non-instantaneous deteriorating items. For a detailed literature discussion, refer to Section 2.1 in the manuscript (see [2,3,4,5,6,7,8,9,10,11]).
The economic order quantity (EOQ) model, in which the demand rate is constant, remains the model most popularly applied by researchers. However, in practice, the demand for items such as fashionable products or new mobile phones typically increases substantially, either linearly or exponentially, in the growth stage and stabilizes to a near-constant level in the maturity stage, producing a ramp-type demand pattern. Thus, investigating this demand type is more practical. Previous scholars have also explored the issue of ramp-type demand rate. For a detailed literature discussion, refer to Section 2.2 in the manuscript (see [12,13,14,15,16,17,18,19,20,21]).
In the competitive market, making and receiving timely payments is critical for companies to uphold positive cash flow and effectively manage their liquidity. Sellers and buyers utilize diverse payment terms to settle their business transactions. Typically, suppliers may allow retailers to settle the balances due by using various payment methods, including cash in advance (advance payment), cash on delivery (cash payment), a deferred payment period of 30 days or more (credit payment), and other comparable arrangements.
In cases of advance payment, the seller benefits by earning interest and avoiding default risk. The seller is also assured that the buyer will not cancel the order. Suppliers may require buyers to pay the total purchase cost before delivery to mitigate order cancellation risk. In addition, in case of strong demand and insufficient supply, when market instability occurs for a product, buyers may prefer to prepay a portion or all the total purchase cost to ensure that items are received on time. However, requiring buyers to pay in advance may reduce sales because this is the least attractive option to buyers encountering cash flow problems and having insufficient money to complete payments. To sustain sales, suppliers may offer alternative payment options such as paying portions of the purchase cost in multiple installments of equal amounts at equal time intervals or paying a portion of the purchase cost before delivery and receiving replenishment only after paying the remaining purchase cost. This is an advance-cash transaction. Suppliers may also offer a permissible delay in payment to retailers for the remaining total purchase cost in an advance-credit transaction.
In the case of cash payment, suppliers require retailers to pay the total purchase cost upon the receipt of products. The cash payment benefits for the supplier are that they may earn revenue and some interest. Moreover, cash payment is convenient for small businesses because the purchaser does not require a credit card, and credit card processing fees can be avoided. Retailers with inadequate cash flow may ask suppliers to accept delayed payment of a part of the total purchase cost in a cash-credit transaction.
In the case of credit payment, a supplier may provide a credit period to retailers to stimulate sales. Permitting delayed payment, in which a retailer is granted a grace period to pay for a purchase, is an alternative incentive policy to quantity discounts. Concurrently, a retailer may also provide a credit period to their customers. A two-level trade credit policy is used. This policy can reduce buyer costs, attract new customers, and prevent price competition. The seller provides the buyer with several interest-free short-term loans. No interest is levied if the buyer settles the full purchase amount within the permissible delay period. Alternatively, if the buyer fails to pay the total balance within the permissible delay period, the seller charges interest on the remaining balance. Longer credit periods generally lead to higher sales volumes, but also increase the risk of default compared with shorter credit periods. Occasionally, sellers require buyers to make a partial payment upon delivery and pay the remaining balance before the end of the credit period to reduce the default risk associated with long credit periods and maintain positive cash flow. This cash-credit payment policy is called partial trade credit.
Occasionally, sellers may permit buyers to make advance-cash-credit (ACC) payments. This policy involves paying a part of the total purchase cost in advance when placing an order, paying a portion in cash upon receiving the order, and paying the remainder within a permissible delay period. This is mutually beneficial for sellers and buyers in a supply chain network; sellers avoid order cancellation and increase sales to remain competitive, whereas buyers avoid inadequate cash flow and earn interest before balance settlement. To maximize profit or minimize costs, suppliers and retailers can use various payment policies to settle transactions. Such policies can increase sales and enhance cash flow flexibility among supply chain members.
In summary, as mentioned previously, scholars have also explored the topic of various payment policies. For a detailed literature discussion, refer to Section 2.3 in the manuscript (see [22,23,24,25,26,27,28,29,30,31,32,33,34,35,36,37,38,39,40,41,42,43,44,45,46,47,48,49,50,51,52,53,54,55,56,57]).
As a result, through the introduction above, we develop a partial backlog inventory model for non-instantaneous items with ramp-type demand (such as high-tech product demand) under an ACC payment. The problem is to find the optimal replenishment strategy to maximize the present value of the total profit per unit of time when the ACC payment is employed. The relevant research is provided in the next section.
2. Literature Review
This manuscript addresses three topics: (1) non-instantaneous deteriorating items, (2) ramp-type demand rate, and (3) ACC payment. The related articles are stated as follows.
2.1. Research on Non-Instantaneous Deteriorating Items
Many products, such as fish, meat, vegetables, pharmaceuticals, chemical substances, light bulbs, and high-tech fashion items, deteriorate. Ouyang et al. [2] studied an inventory model for non-instantaneous deteriorating items with a permissible delay in payments. Geetha and Uthayakumar [3] provided an economical design for an inventory policy for non-instantaneous deteriorating items with a permissible delay in payments. Maihami and Kamalabadi [4] established joint pricing and inventory control for non-instantaneous deteriorating items with partial backlogging and time- and price-dependent demands. Soni and Patel [5] proposed a fuzzy expected value model to identify the optimal pricing and inventory policies for non-instantaneous deteriorating items with a permissible delay in payment. Chang et al. [6] presented optimal pricing and ordering policies for non-instantaneous deteriorating items with an order size-dependent payment delay. Tiwari et al. [7] presented the impact of trade credit and inflation on retailer ordering policies for non-instantaneous deteriorating items in a two-warehouse environment. Jaggi et al. [8] studied credit financing in economic ordering policies for non-instantaneous deteriorating items with a price-dependent demand and two storage facilities. Lashgari et al. [9] developed ordering policies for non-instantaneous deteriorating items with simultaneous hybrid partial prepayment, partial trade credit, and partial backordering. Tavassoli et al. [10] suggested a lot-sizing model for non-instantaneous deteriorating products with advance payment and nonlinear partial backlogging. Pathak et al. [11] implemented a two-warehouse inventory system for shelf-life stock, characterized by time-varying bi-quadratic demand, to explore optimal replenishment strategies under conditions of shortages and inflation.
2.2. Research on Ramp-Type Demand
The demand rate for many new products, such as high-tech or seasonal products, increases considerably, either linearly or exponentially, in the growth stage of the product lifecycle, and the rate remains near constant in the maturity stage (ramp-type demand). Manna and Chaudhuri [12] developed an EOQ model with a ramp-type demand rate, in which time-dependent deterioration rate and shortages were considered. Deng et al. [13] provided a note on inventory models for deteriorating items with a ramp-type demand rate. Panda et al. [14] examined an optimal replenishment policy for perishable seasonal products during a season with ramp-type dependent demand. Agrawal and Banerjee [15] established a two-warehouse inventory model with ramp-type demand and partially backlogged shortages. Skouri et al. [16] described inventory models with a ramp-type demand rate, time-dependent deterioration rate, unit production cost, and shortages. Agrawal et al. [17] provided an inventory model for deteriorating items with ramp-type demand and partially backlogged shortages in a two-warehouse system. Halim [18] proposed a Weibull-distributed inventory distribution model with a ramp-type demand rate and fully backlogged shortages. Shi et al. [19] explored optimal ordering policies for a single deteriorating item with a ramp-type demand rate and a permissible delay in payments. Yang [20] established an inventory model for ramp-type demand with two-level trade credit financing linked to order quantity. Viswanath et al. [21] conducted an analysis of instantaneous items featuring fully backlogged shortages, ramp-type demand, and a constant deterioration rate.
2.3. Research on Generalized Payments
An ACC payment is one of several payment options. Thus, in this subsection, in order to make the literature discussion more complete, we explore not only the literature related to ACC payments but the kinds of literature related to generalized payments.
- Cash or cash-credit payment: In 1913, Harris [22] proposed the EOQ model, in which the buyer must pay cash on delivery (i.e., cash payment). However, in the existing competitive market, most companies offer their products with various credit terms (i.e., credit payment) to stimulate sales and remain competitive. Teng [23] presented cash-credit payments for retailers with poor-credit customers, in which partial cash payment reduces default risk and partial credit payment stimulates sales. Yang et al. [24] explored the optimal retailer order and credit policies when suppliers offer either a cash discount or delayed payment based on the order quantity.
- Credit payment: Substantial research has investigated credit payment, which involves the provision of a permissible delay in payment. In 1985, Goyal [25] developed an EOQ model for credit payment circumstances that neglected differences in the sale price and purchase cost. Shah [26] considered a stochastic inventory model with permissible delay in payments. Teng [27] presented an EOQ ordering policy with a conditionally permissible delay in payments. Gupta and Wang [28] explored a stochastic inventory model with trade credit. Taleizadeh et al. [29] investigated an EOQ model with partially delayed payment and partial backordering. Mahata and De [30] proposed an EOQ inventory system for items with a price-dependent demand rate under a retailer partial trade credit policy to reduce default risk. Huang [31] extended Goyal’s model to develop an EOQ model, in which the supplier offers the retailer a permissible delay period (i.e., upstream trade credit), and the retailer, in turn, provides a trade credit period (i.e., downstream trade credit) to its customers. This is a two-level trade credit policy. Since then, many models have been developed in numerous directions. For example, Yang explored an inventory model for a ramp-type demand with two-level trade credit financing linked to order quantity [20]. Subsequently, Yang [32] presented an optimal ordering policy for deteriorating items with limited storage capacity under two-level trade credit linked to the order quantity using a discounted cash flow (DCF) analysis. Relevant articles can be found in the references of these studies. Moradi et al. [33] proposed an inventory model for imperfect quality items, integrating the impacts of learning effects and partial trade credit. Lin et al. [34] focused on optimizing ordering policies and credit terms for items whose demand varies with inventory levels under the condition of a trade credit limit. Pal et al. [35] examined a two-warehouse inventory model that accounts for non-instantaneous deterioration, incorporating credit policy, inflation, demand dependent on price and time, and partial backlogging.
- Advance or advance-credit payment: Inventory models with advance payment have rarely been studied. Zhang [36] proposed an optimal advance payment scheme involving fixed prepayment costs. Gupta et al. [37] presented an application of a genetic algorithm for producing an inventory model with advance payment and interval-valued inventory costs. Maiti et al. [38] considered advance payment in an inventory model with a stochastic lead time and price-dependent demand. Taleizadeh [39] proposed an EOQ model with partial backordering and advance payments for evaporating items. Teng et al. [40] adopted an inventory lot size policy for deteriorating items with expiration dates as well as advance payment. Khan et al. [41] explored the effects of full and partial advance payments with discount facilities for deteriorating products when the demand is both price- and stock-dependent. Zhang et al. [42] developed an EOQ model with full advance payment and partial-advanced–partial-delayed payment. Zia and Taleizadeh [43] devised a lot sizing model with back-ordering under hybrid linked-to-order multiple advance payments and delayed payment. Diabat et al. [44] proposed an advance-credit payment for a lot sizing model with partial downstream delayed payment, partial upstream advance payment, and partial backordering for deteriorating items. Duary et al. [45] explored a price discount inventory model with advance and delayed payments for deteriorating items under capacity constraints and partially backlogged shortages.
- Advance-cash-credit payment: In addition to the aforementioned studies, Li et al. [46] presented pricing and lot sizing policies for perishable products with an ACC payment, which were examined using a DCF analysis. Li et al. [47] considered an ACC payment with a time-dependent demand. Wu et al. [48] provided inventory policies for perishable products with expiration dates and ACC payment schemes. Li et al. [49] studied optimal pricing, lot sizing, and back-ordering decisions for when a seller demands an ACC payment. Li et al. [50] proposed lot sizing and pricing decisions for perishable products with three-echelon supply chains and ACC payments when the demand depends on the price and stock age. Li et al. [51] developed EOQ-based pricing and customer credit decisions for generalized supplier payments (i.e., ACC payments). Tsao et al. [52] provided a supply chain network design for an ACC payment. Feng et al. [53] investigated the optimal sale price, replenishment cycle, and payment time for ACC payments from a seller’s perspective. Feng et al. [54] explored pricing and lot sizing for fresh goods when the demand depends on the unit price, displayed stock, and product age under generalized payment. Shi et al. [55] also used ACC payment schemes to demonstrate an optimal retailer strategy for perishable products with increasing demand under a two-level trade credit. Recently, Tsao et al. [56] developed a model for a single supplier–manufacturer chain to identify the optimal replenishment cycle time and predictive maintenance effort needed to minimize the total cost’s present value, given that the manufacturer receives an ACC payment from the supplier. Chang and Tseng [57] formulated EOQ models to analyze how ACC payment schemes and carbon emission policies affect replenishment and pricing strategies for perishable goods.
To summarize the above, the major characteristics of our study of selected articles are shown in Table 1.

Table 1.
The major characteristic of inventory models in selected articles.
In view of these, an ACC payment is a generalized payment scheme involving several types of payment (e.g., advance, cash, credit, advance-cash, advance-credit, and cash-credit).
Therefore, this study investigated a partial backlogging inventory model for non-instantaneous deteriorating items with the ramp-type demand under ACC payment and DCF. The contributions of this study are as follows: First, to the best of our knowledge, the ramp-type demand and non-instantaneous deteriorating items under ACC payment have not been simultaneously investigated. Thus, in this research, we developed a partial backlogging inventory model for non-instantaneous deteriorating items with a ramp-type demand under ACC payment. Second, we conducted a DCF analysis of the time value of the profit function. Finally, we used numerical examples and sensitivity analysis to determine the effects of system parameters on the total profit function and decision-making and to provide managerial insights. These are the differences between this article and others. It’s an innovation.
The remainder of this paper is organized as follows: We describe the assumptions and define the notations used throughout the paper in Section 3. We develop the mathematical models for different scenarios in Section 4. In Section 5, we derive the necessary conditions in each scenario for arrival at the optimal solution. Section 6 and Section 7 provide numerical examples and discuss managerial insights obtained from sensitivity analysis. Section 8 provides the conclusion.
3. Assumptions and Notation
The mathematical models for inventory problems were based on the following assumptions:
- Items can deteriorate after being in stock for a period. No replacement or repair of deteriorating items is assumed to occur during the period.
- Each cost considered is assumed to be continuously compounded throughout the analysis. The cash flows associated with product transactions are assumed to be instantaneous.
- Allowance for shortages is permitted. Unfulfilled demand is stored for later fulfillment, and the proportion of backlogged shortages is a continuously differentiable and decreasing function of t, which is denoted by , where t represents the time until the next replenishment, 0 1, and . If = 1 (or 0) for all t values, then shortages are completely backlogged (or lost). If 0 < < 1, then the shortage is partially backlogged and partially lost.
- The buyer pays the seller a fraction α of the total purchase cost in advance as a deposit for L years. The buyer then pays another fraction β of the total purchase cost in cash upon receiving the order quantity Q units at time 0. The seller grants an upstream credit period of M for the remainder fraction of the total purchase cost (i.e., .
The following notations are also used throughout this paper:
Parameters:
= demand rate at time t, we assume that is constant and deterministic after the length of demand growth stage (in years), and is an increasing linear function of time t during the growth stage. That is
= time at which deterioration starts; product quality is stable before (in years), this is defined as the stable quality period
= deterioration rate, where
= backlogging rate, which is a decreasing function of waiting time t, without loss of generality, we assume that where , and t is the waiting time
= fixed prepayment period in years, L > 0
= permissible delay period in years
= fraction of total purchase cost to be paid to the seller in advance, . If , the ACC payment scheme becomes a cash-credit payment. If = 1, payment is an advance payment.
= fraction of total purchase cost to be paid to the seller upon receiving items, . If = 0, the ACC payment scheme is an advance-credit payment. If = 1, the payment is a cash payment.
= fraction of total purchase cost granted an upstream credit period M by the seller to the buyer, , and . If = 0, the ACC payment scheme becomes an advance-cash payment. If = 1, the payment is a credit payment.
r = annual compound interest rate per dollar per unit of time
= interest charged per dollar per unit of time
= interest earned per dollar per unit of time
= ordering cost per order in dollars
= holding cost per unit time in dollars
= backlogging cost per unit time if the shortage is backlogged in dollars
= unit opportunity cost due to lost sale if the shortage is lost in dollars
= purchase cost per unit in dollars
= unit sale price in dollars
Variables:
= initial inventory level at the time
= order quantity in units
= inventory level at time t
= backlogged level at time t
= present value of the total profit per unit of time
Decision variables:
= time at which the inventory level reaches zero in years, where and is defined as the stock period. Without loss of generality, we assume that .
= replenishment cycle in years; the time at which the shortage level reaches the minimum point during the replenishment cycle, where
4. Mathematical Models
The difference between the length of the stable quality period and the length of the demand growth period is considered. Two scenarios exist: (1) and (2) .
4.1. Scenario 1. (i.e., the Demand Growth Period Is Not Longer than the Stable Quality Period)
In the growth and stable quality interval , we assume that no deterioration occurs and that the inventory level gradually decreases because of demand, where . Next, the inventory level depletes because of constant demand in the maturity and stable quality interval , where . After the stable quality period , the items begin to deteriorate, and the inventory level also gradually decreases because of both constant demand and deterioration in the interval , where . The inventory level at time t is governed by the following differential equation:
with the boundary condition and . The solutions to (1)–(3) are as follows:
and
respectively. Using the continuity of and at time and at time , (4)–(6) produces
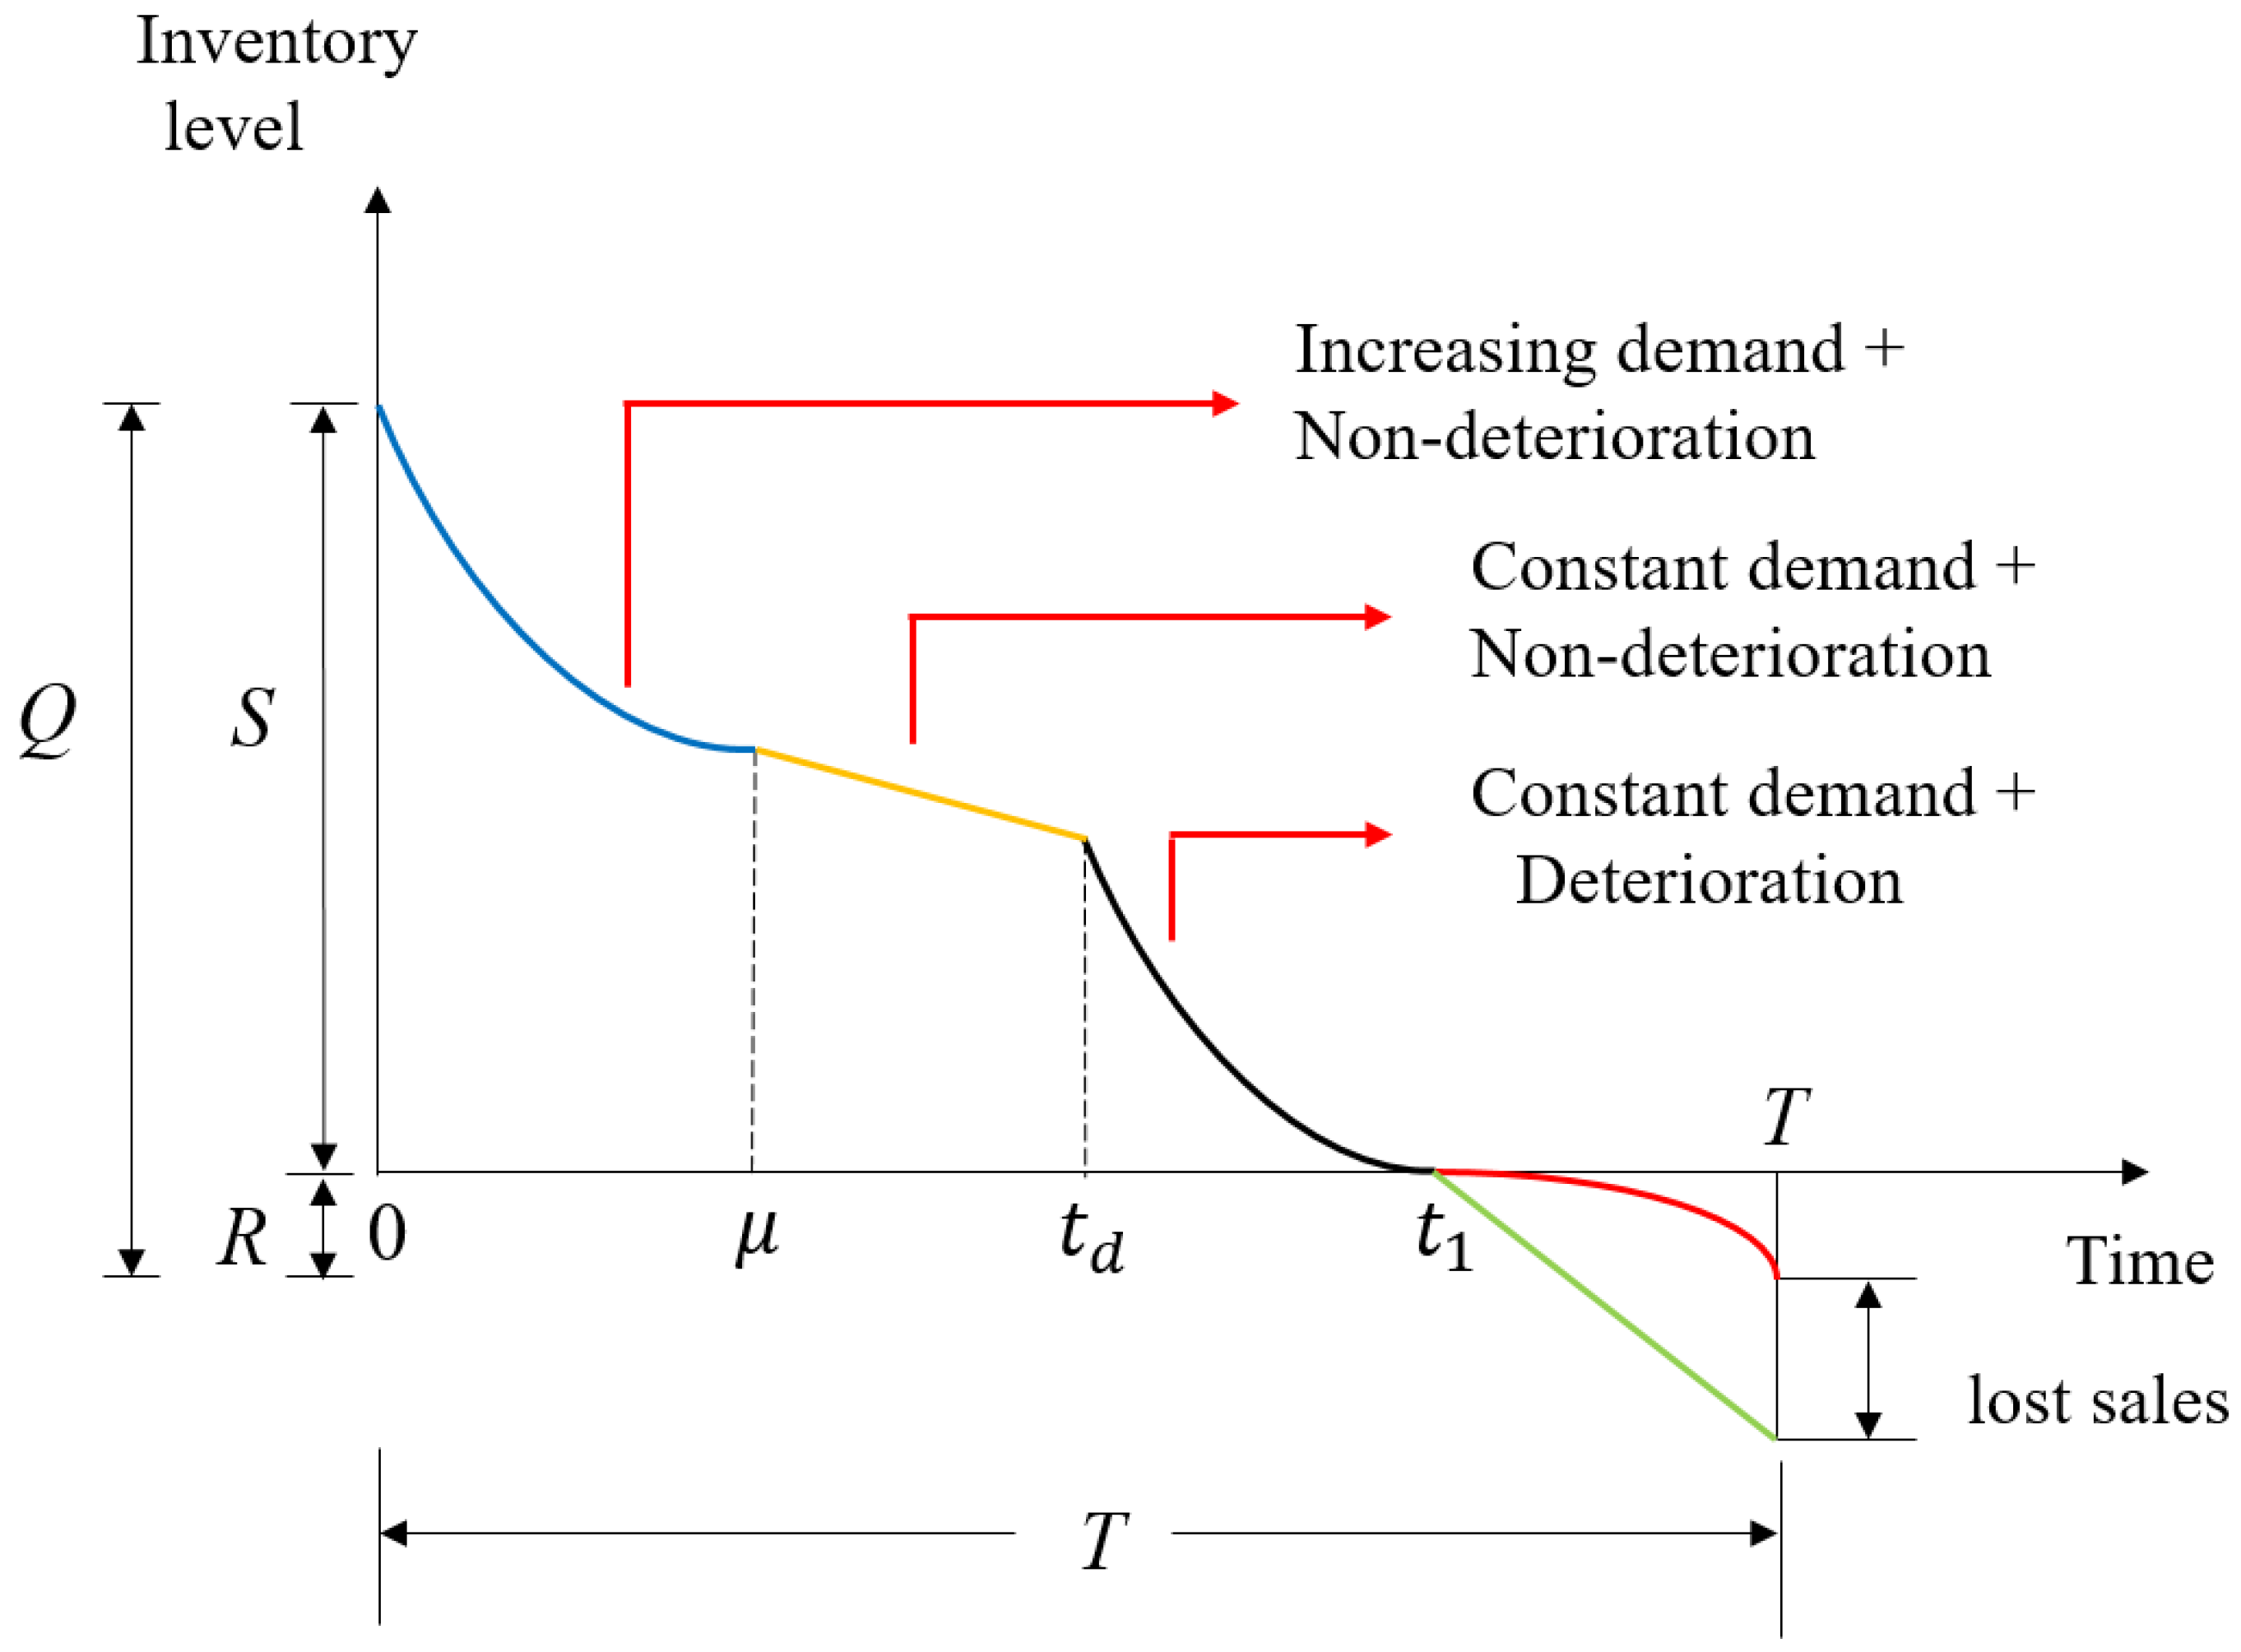
In summary, in this case: (i) From time 0 to time , the demand is increasing, and the items do not deteriorate. (ii) From time to time , the demand is constant, and the items still do not deteriorate. However, (iii) after the time , the items begin to deteriorate, and the demand remains constant. (iv) The inventory level at time is zero, and then shortages occur, including back-ordered quantity and lost sales during the time interval [, T]. A graphical representation is depicted in Figure 1.
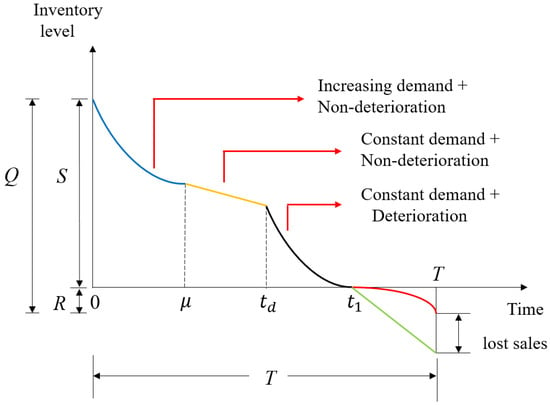
Figure 1.
Graphical representation of the research model, where .
4.2. Scenario 2. (i.e., the Demand Growth Period Is Not Shorter than the Stable Quality Period)
During the growth and stable quality interval , no deterioration occurs, and the inventory decreases gradually because of demand. After the stable quality period , the inventory level depletes because of both the demand and deterioration in the demand growth interval , and the inventory level then depletes because of both deteriorated and constant demand in the maturity and deterioration interval . The inventory level at time t is governed by the following differential equation:
with the boundary condition and . The solutions to (8)–(10) are as follows:
and
respectively. Using the continuity of and at time and at time , (11)–(13) produces
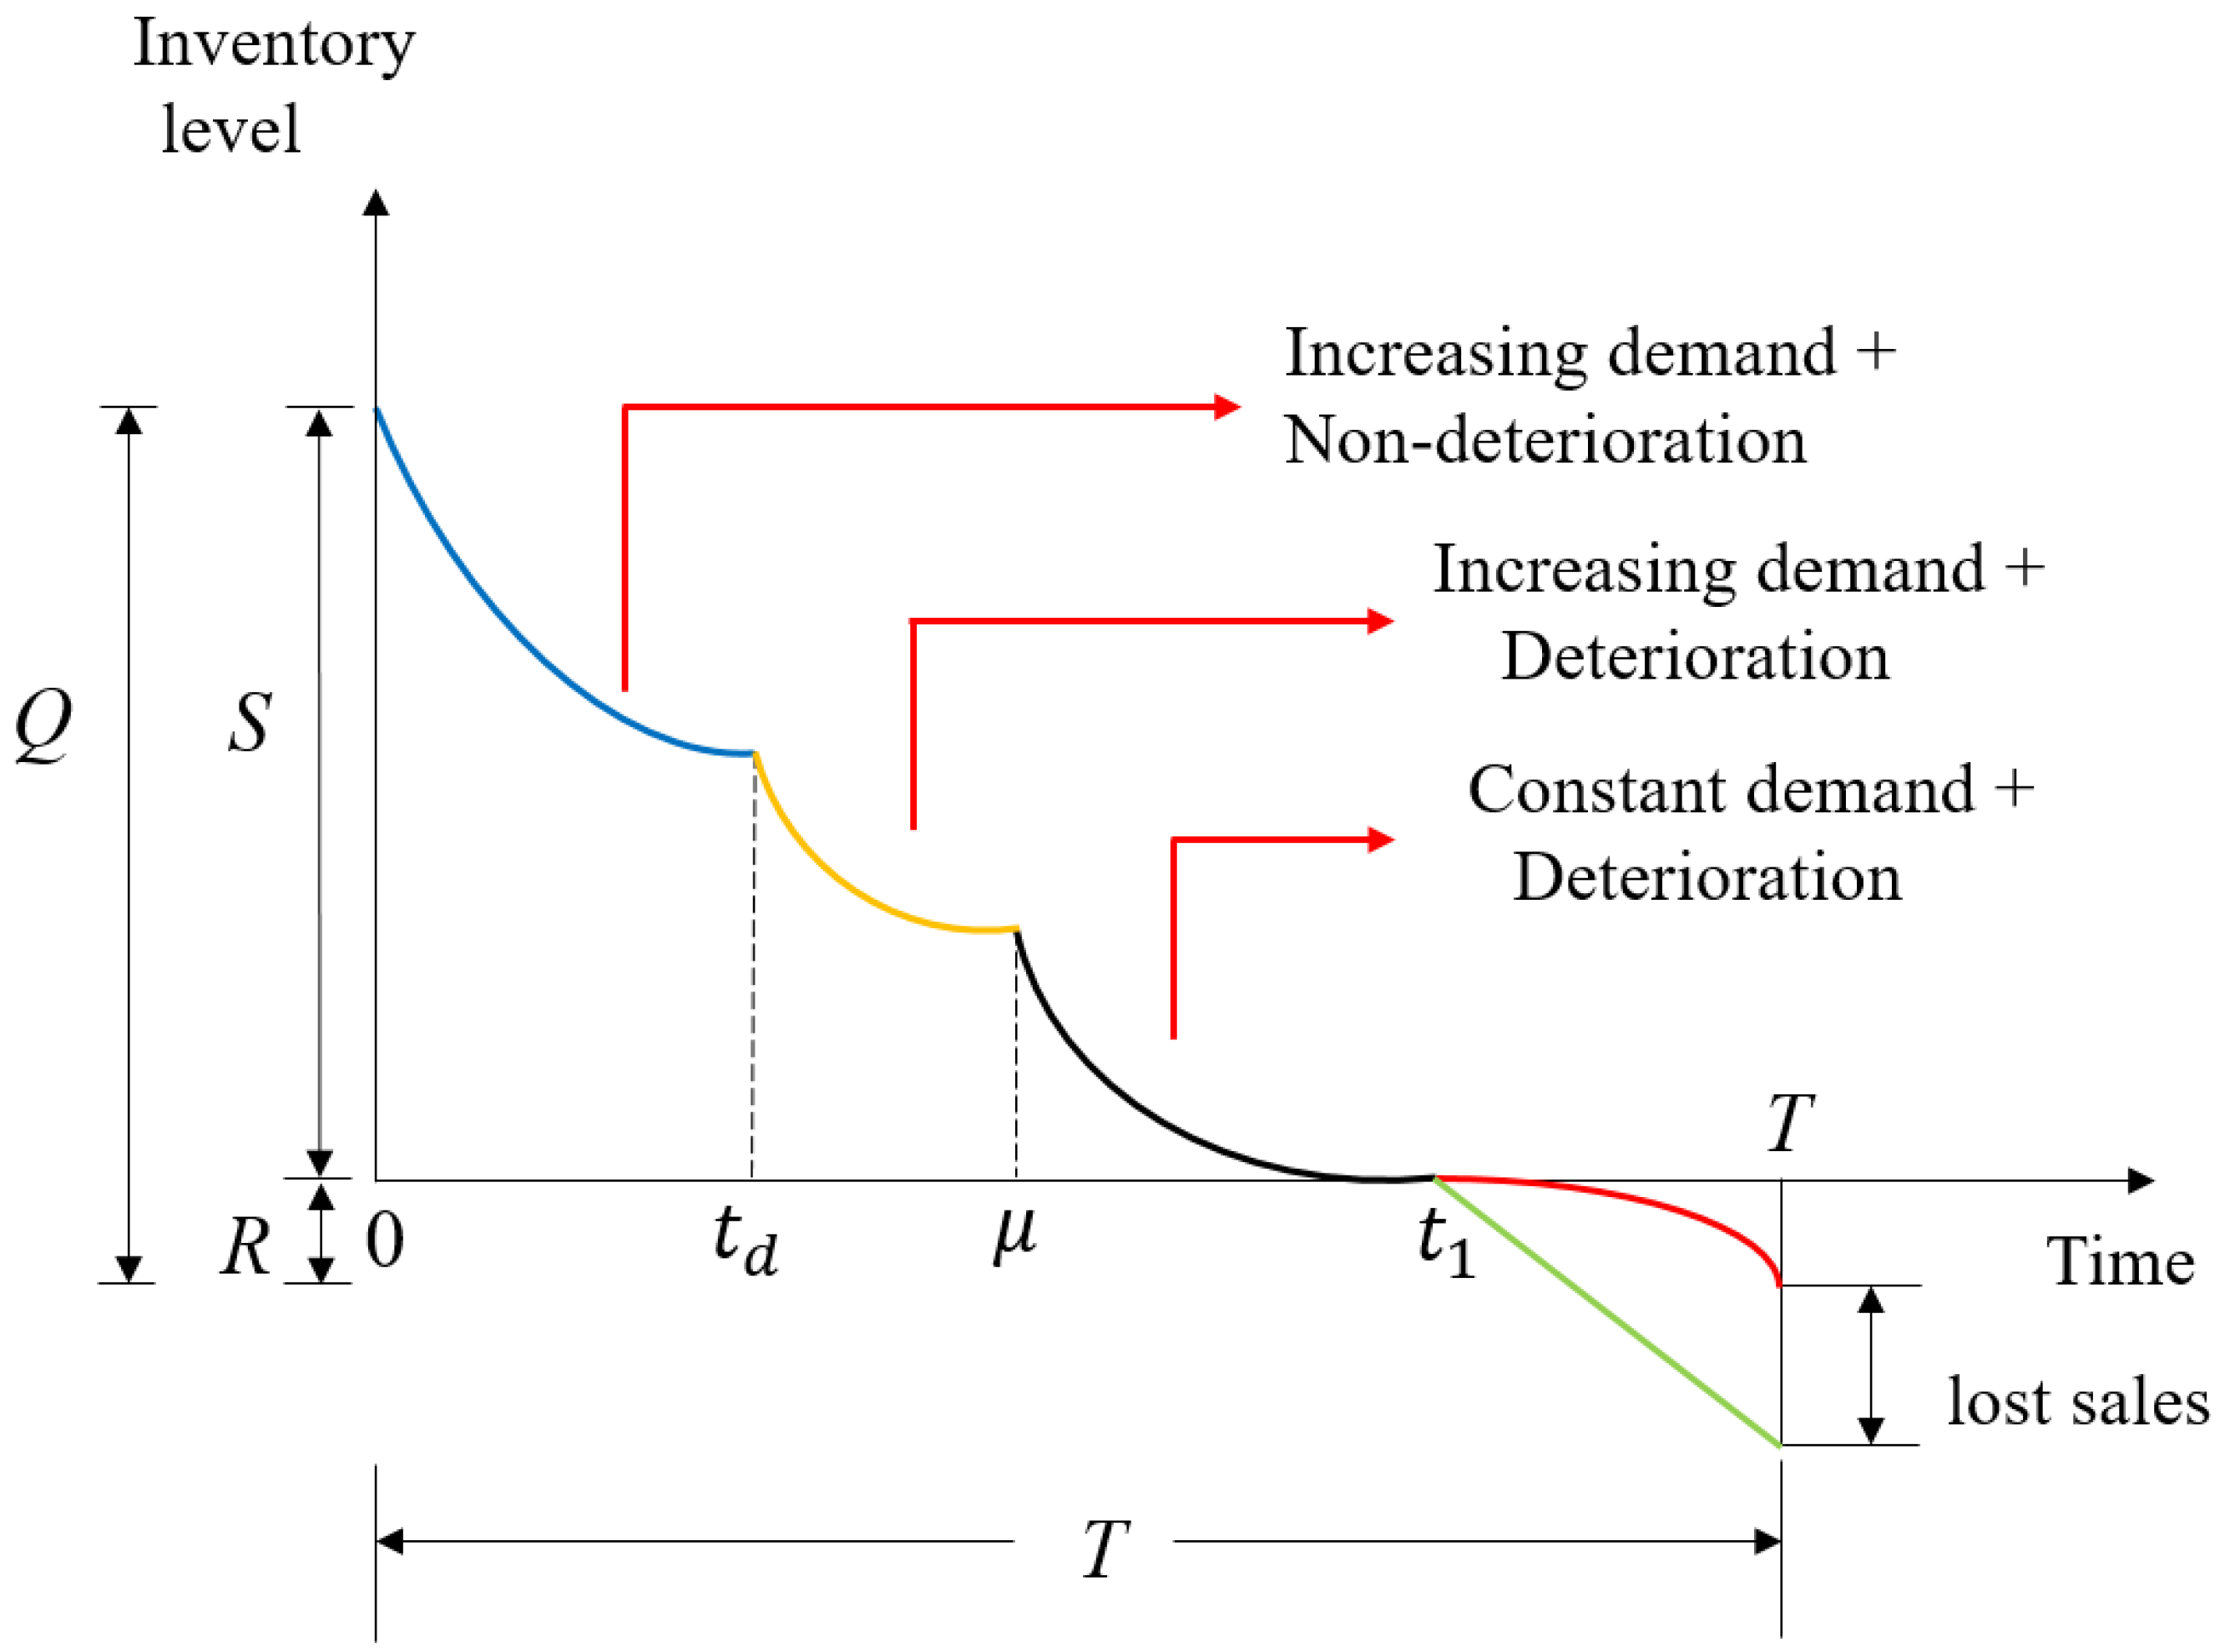
In summary, in this case: (i) From time 0 to time , the demand increases, and the items do not deteriorate. (ii) From time to time , the demand is still increasing, and the items begin to deteriorate. However, (iii) after the time , the demand is constant, and the items still deteriorate. (iv) The inventory level at time is zero, and then shortages occur, including backordered quantity and lost sales during the time interval [, T]. A graphical representation is depicted in Figure 2.
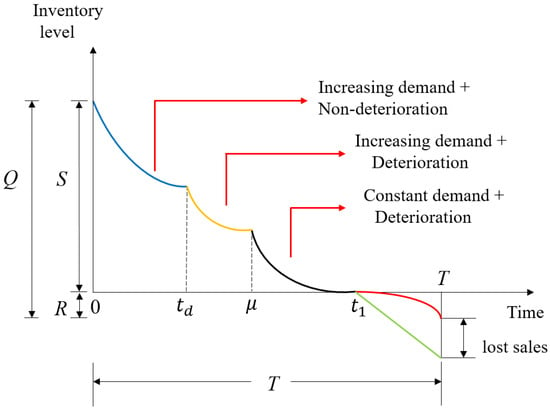
Figure 2.
Graphical representation of the research model, where .
Thus, based on Figure 1 and Figure 2, the cumulative inventory during is . Therefore, the present value of the holding cost is
or
respectively.
According to Figure 1 and Figure 2, at time , the stock is zero; thereafter, shortages occur. The quantity that is not immediately available to customers is backordered and offered at the start of the next cycle. At time , the replenishment cycle restarts. During the shortage interval , the backlogged level B(t) at time t is governed by the following differential equation:
with the boundary condition . The solution to (17) is
The number of lost sales at time t is
The present values of the backlogging cost and the opportunity cost due to lost sales are
and
respectively. Equation (18) demonstrates that the backordered quantity is B(T), denoted by R, that is,
Thus, the order size is Q = S + R, and the present value of the total purchasing cost of each cycle is
The present value of the sales revenue of each cycle is
The present value of the ordering cost is
Next, for advance payment and cash payment, the present value of interest charged is as follows:
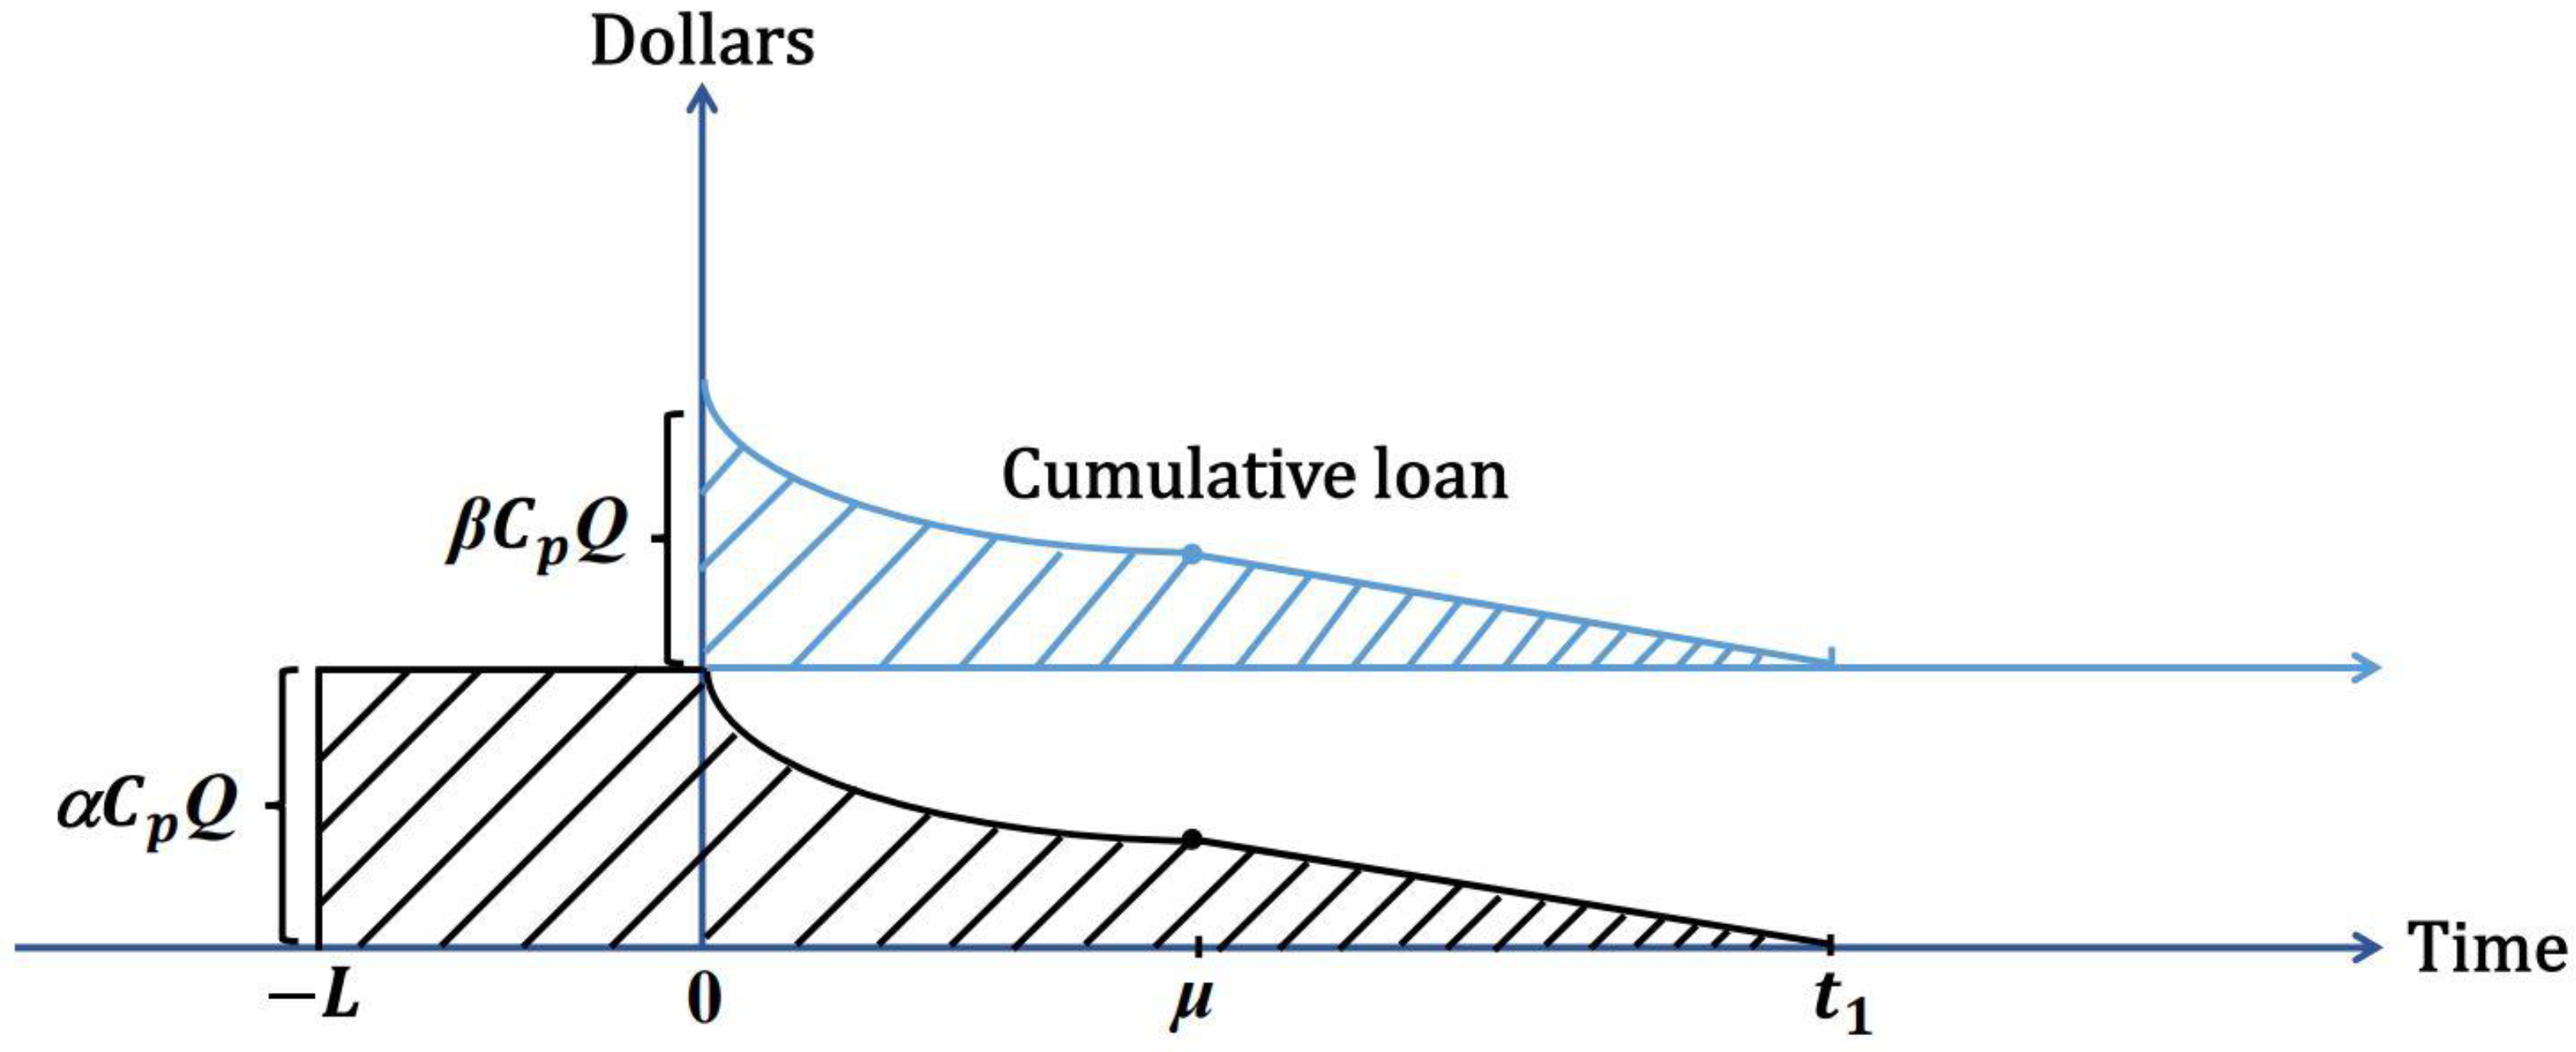
A graphical representation is depicted in Figure 3 as follows: the black slash region represents the interest charged on the advance payment, while the blue slash region illustrates the interest charged on the cash payment.
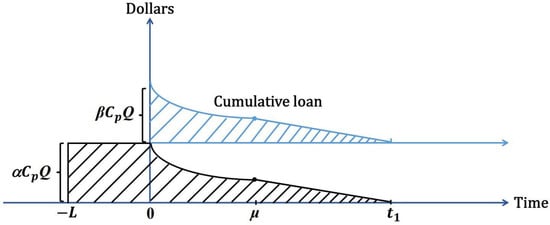
Figure 3.
The interest charged for the advance and cash payments.
The interest charged and earned on the credit payment discussed must be based on the values , , and M. Three cases must be discussed: ; (ii) (iii) .
The retailer is charged at rate , and the interest paid is
The interest earned is
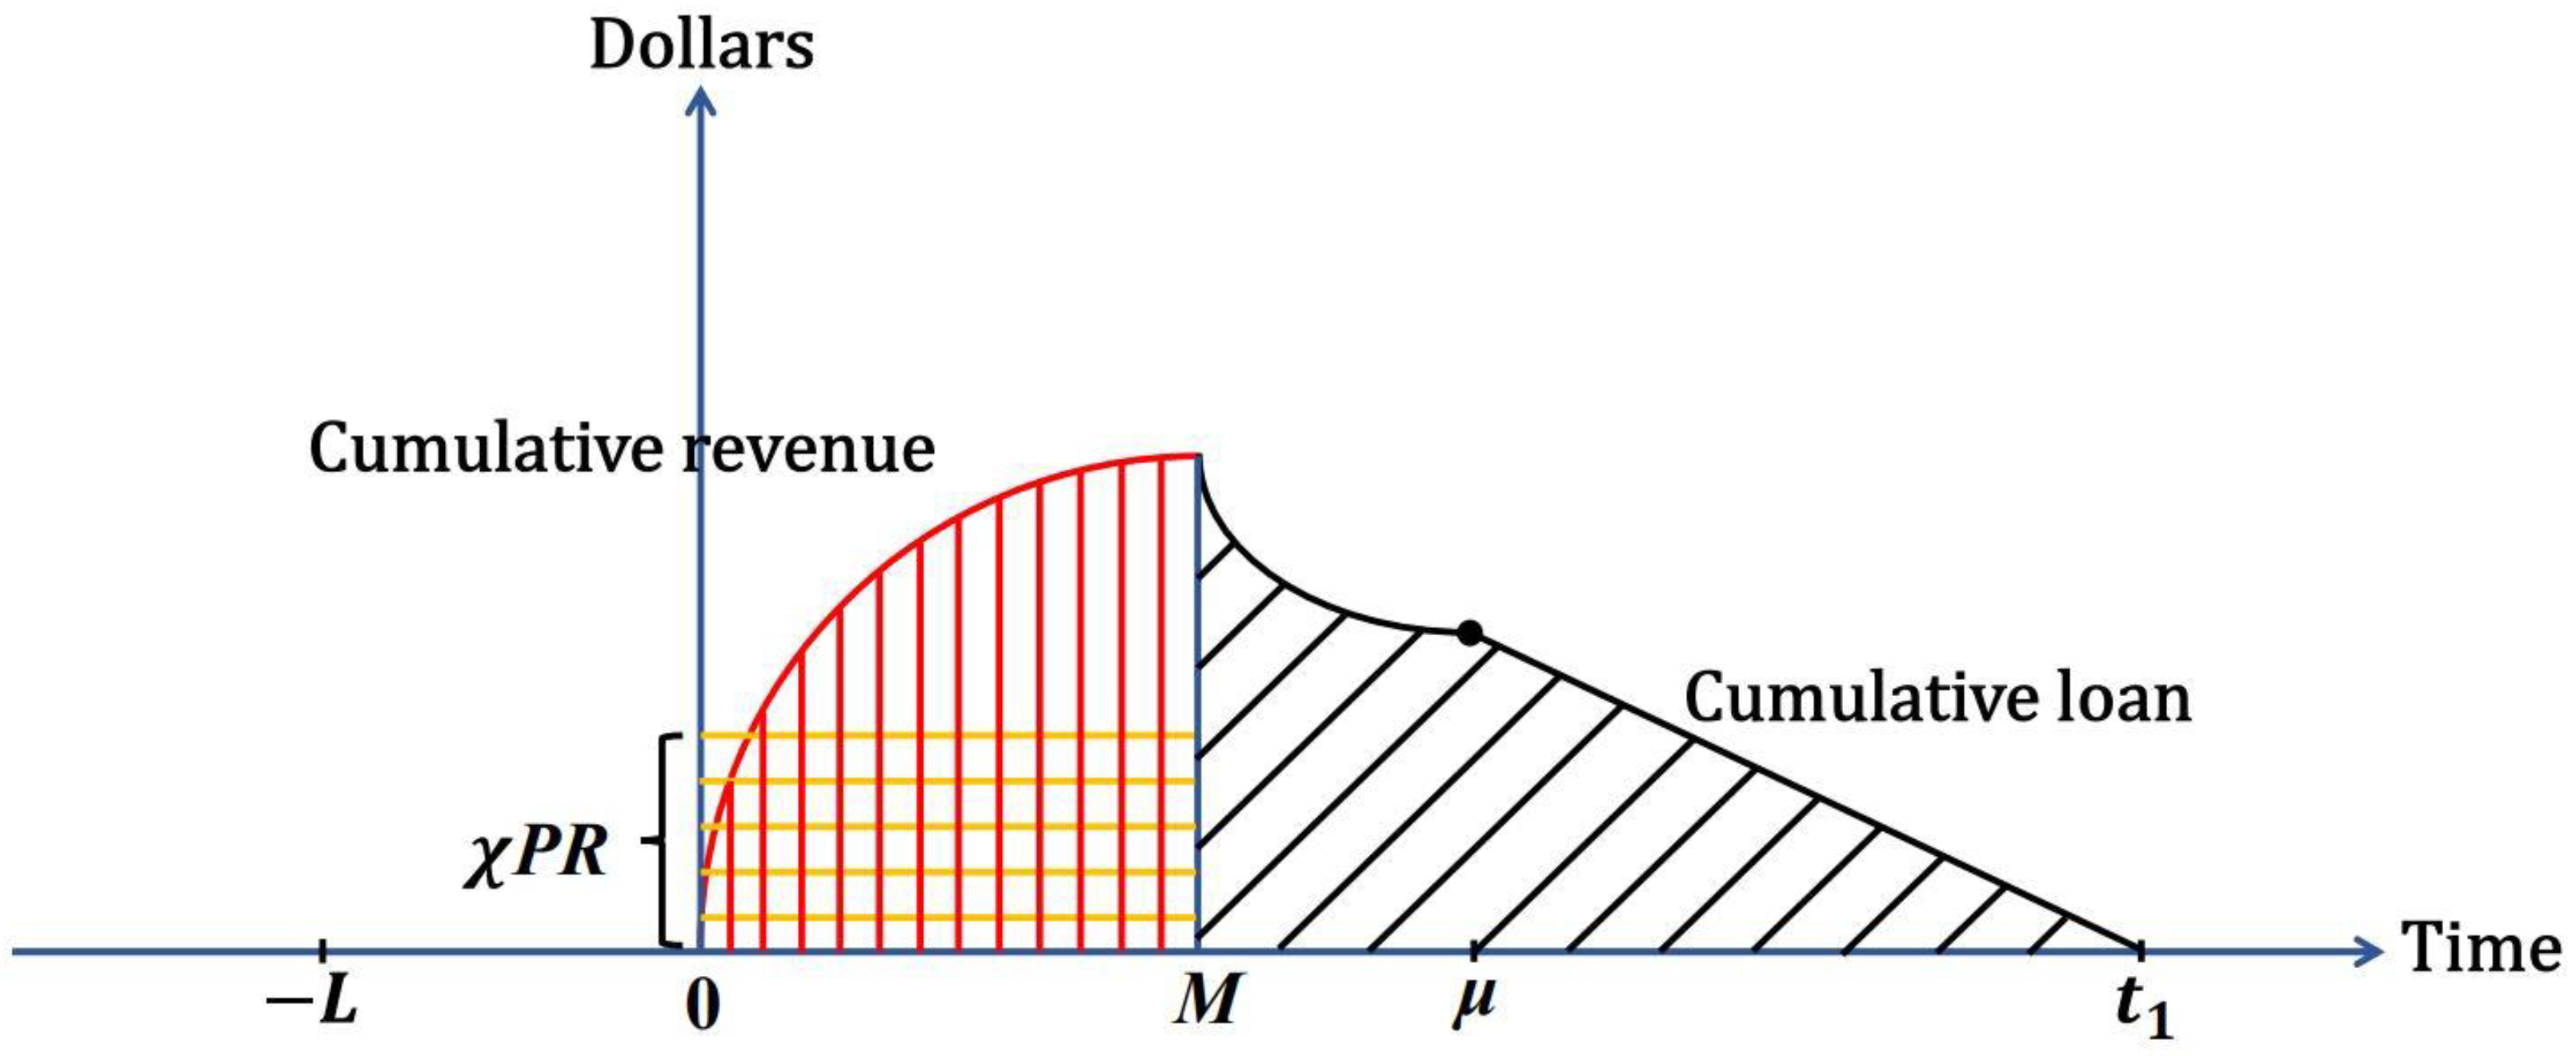
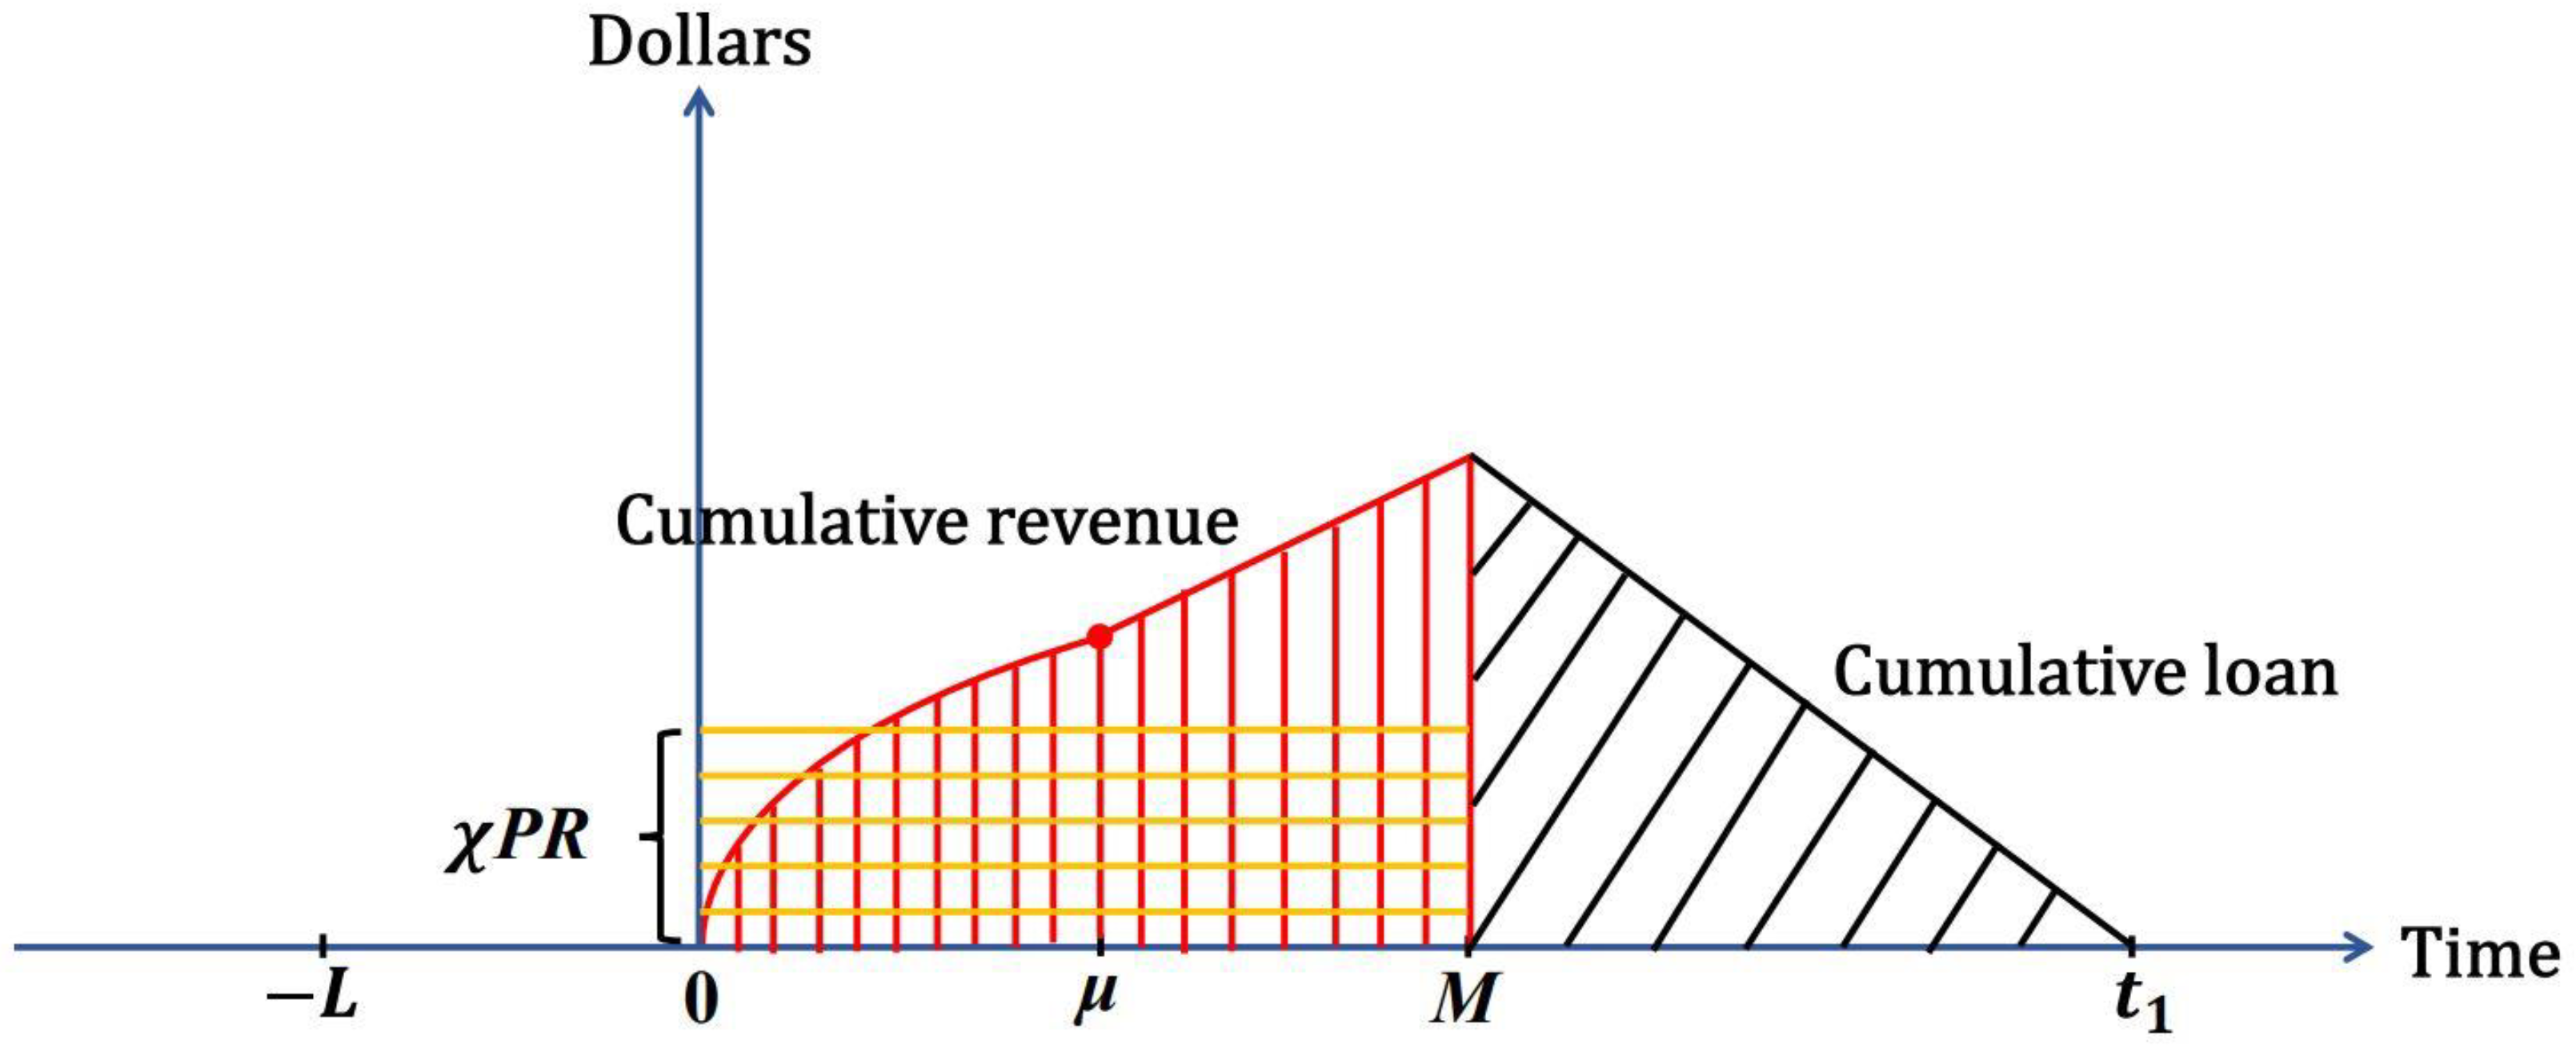
A graphical representation is depicted in Figure 4 as follows: the region with black slashes indicates the interest charged on the credit payment, and the region with red vertical lines combined with yellow horizontal lines indicates the interest earned on the credit payment.
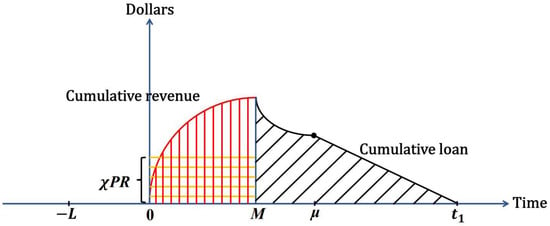
Figure 4.
The interest charged and earned for the credit payment when .
The capital cost is calculated as
(ii)
The retailer is charged at rate , and the interest paid is
The interest earned is
A graphical representation is depicted in Figure 5 as follows: the area covered by black slashes denotes the interest charged on the credit payment, while the area with red vertical and yellow horizontal lines denotes the interest earned on the credit payment.
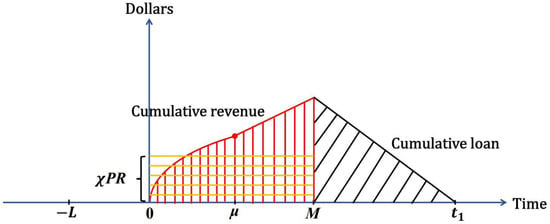
Figure 5.
The interest charged and earned for the credit payment when .
The capital cost is calculated as
(iii) .
After the permissible delay period M, no interest is charged, that is,
The interest earned is
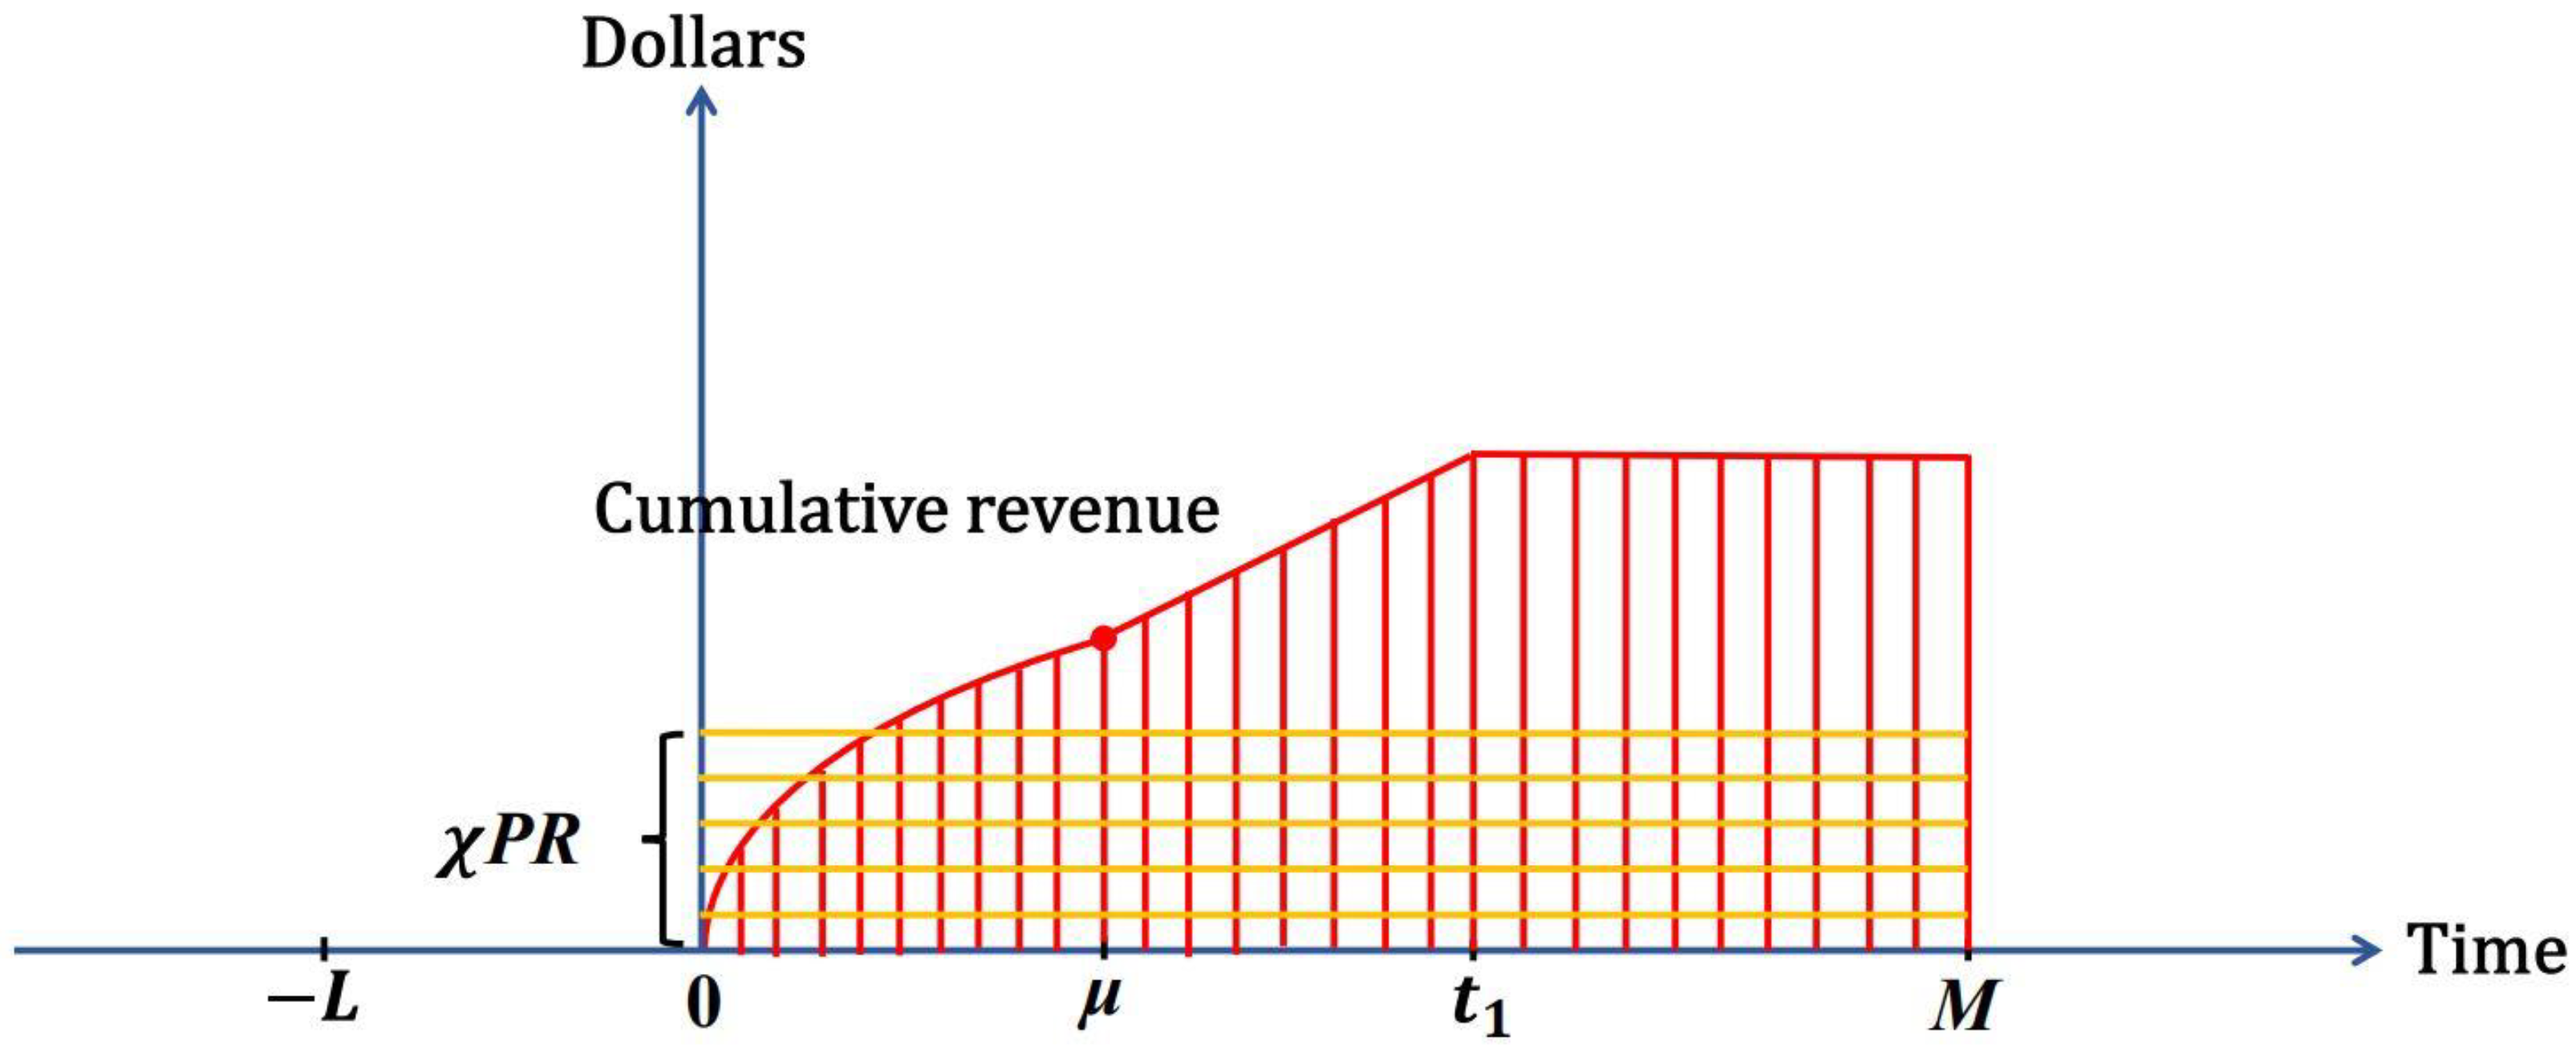
A graphical representation is depicted in Figure 6 as follows. The red vertical and yellow horizontal lines represent the interest earned for the credit payment.
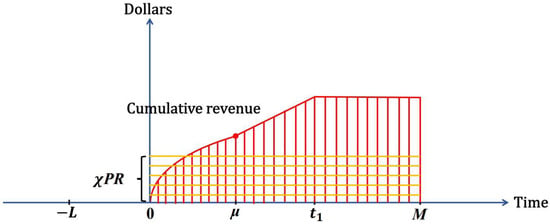
Figure 6.
The interest earned for the credit payment when .
The capital cost is calculated as
Consequently, the present values of the total profit per unit time for the research model during the cycle in the three cases are given by
Total profit = sales revenue − ordering cost − purchasing cost − holding cost − backlogging cost − lost sales cost − capital cost.
Therefore, the present value of the total profit per unit time is as follows, for i = 1, 2, 3:
Thus, the research model was used to determine the optimal time points and for maximization of the present value of total profit per unit time in the inventory system.
5. Solutions to Proposed Models
5.1. Scenario 1:
The necessary conditions for in (30) to be maximized can be written as follows, where i = 1, 2, 3:
where
and
5.2. Scenario 2:
The necessary conditions for in (31) to be maximized can be written as follows, where i = 1, 2, 3:
where
and
Note: The corresponding Hessian matrix for the present value of the total profit function
is negative definite,
if < 0 and , for j = 1, 2 and i = 1, 2, and 3.
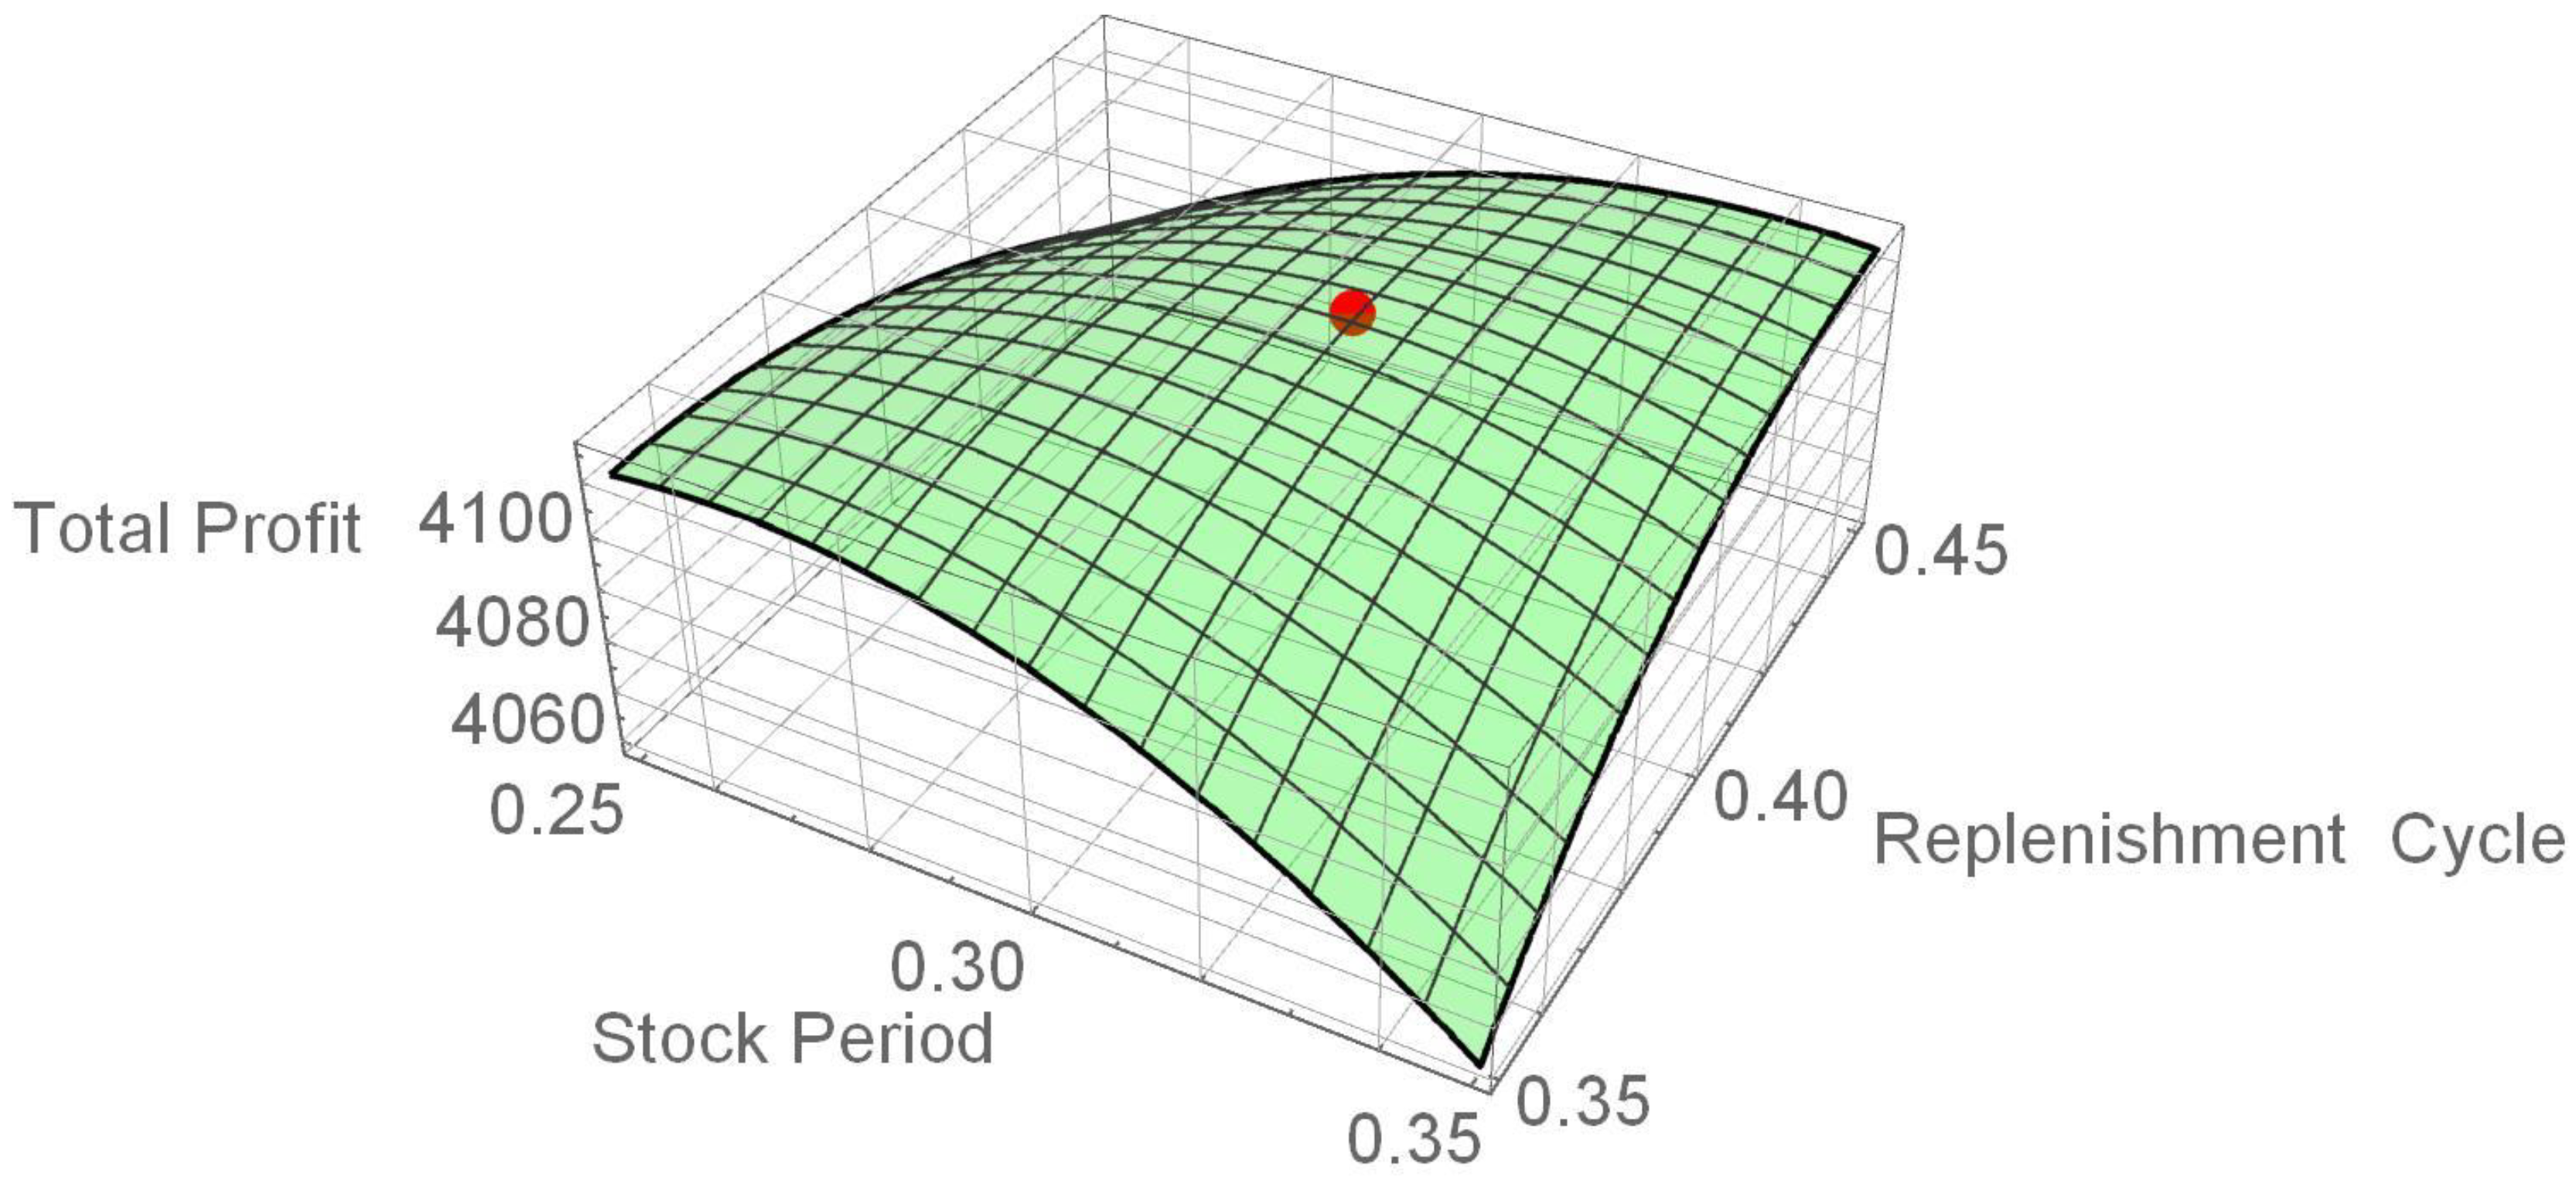
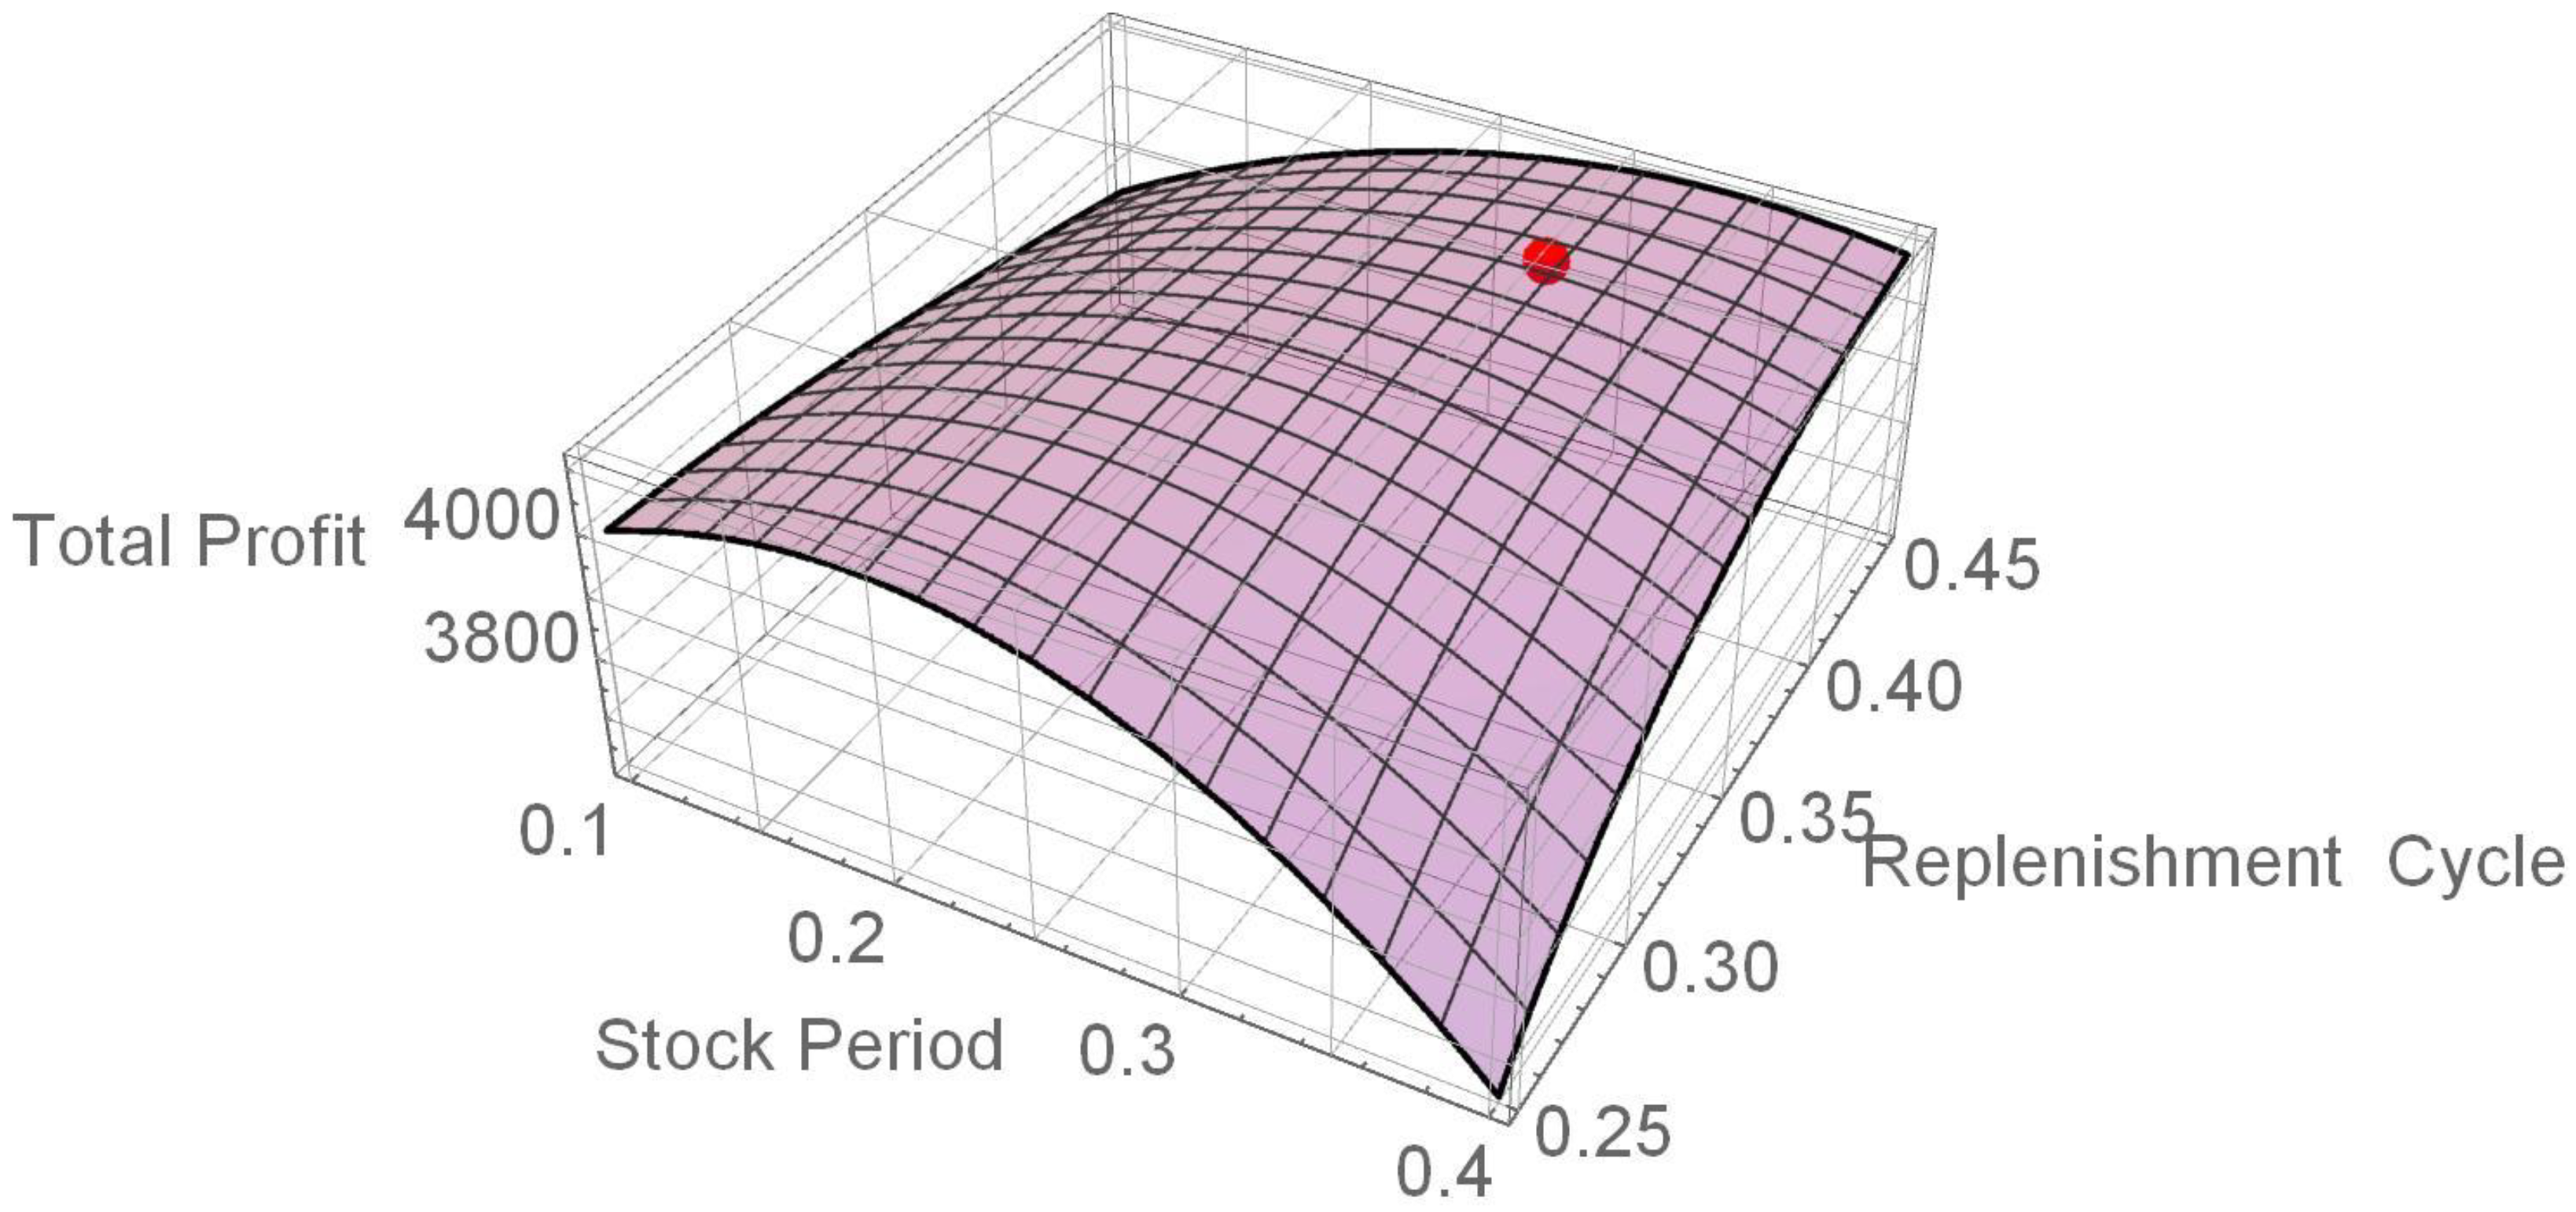
Due to the complexity of the problem, it is not easy to express the second-order partial derivatives in a closed form, and so the joint concavity of the present value of total profit per unit time over and T does not appear straightforward. Thus, we use the first-order derivative of for i = 1, 2, 3 and j = 1, 2, (i.e., Equations (32)–(35)) to determine the optimal solution. Then, check the sufficient condition that the Hessian is negative-definite by applying the software Mathematica 13.1 to numerical examples. In addition, graphs of and , as shown in Figure 7 and Figure 8 below, indicate that and are jointly concave over both and T.
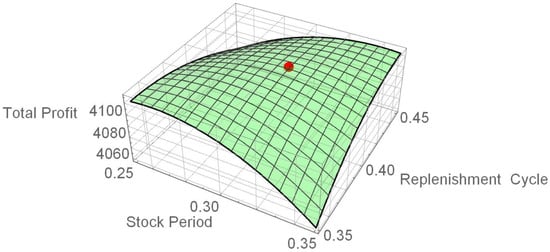
Figure 7.
The graph of .
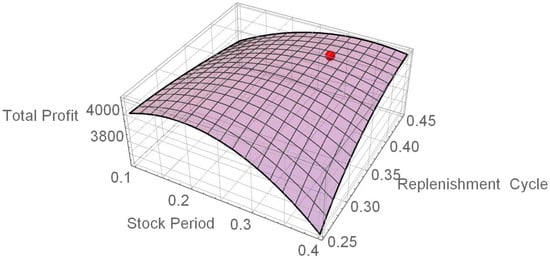
Figure 8.
The graph of .
6. Numerical Examples
In the following examples, the values used have been modified based on previous articles for reference, see Yang (2019a) [20].
For deteriorating items, the demand rate is , the deterioration rate is , and the backlogging rate . The other parameters are as follows: , , ; fixed prepayment period L , ; ordering cost , , , , , ; permissible delay period ; interest rate charged ; and interest rate earned . The following numerical examples are provided for and :
(1) Example 1: Let and , where and . Using Equations (32) and (33) and Mathematica 13.1, we obtained the following optimal solutions:
The optimal stock period , optimal replenishment cycle , optimal present value of the total profit per unit time , optimal order quantity and optimal backordered quantity R = 22.08. The determinant of the Hessian matrix of at is as follows:
This equation demonstrates that the value of is maximized at = (0.3055, 0.4079). A graph of is shown in Figure 7, where the red dot represents the optimal solution. The graph exhibits concavity at both and T.
(2) Example 2: Let and , where and . Using Equations (34) and (35) and Mathematica 13.1, we obtained the following optimal solutions:
The optimal stock period , optimal replenishment cycle , optimal present value of the total profit per unit time , optimal order quantity and optimal backordered quantity R = 22.21. The determinant of the Hessian matrix of at is as follows:
This equation demonstrates that the value of is maximized at = (0.3016, 0.4046). A graph of is shown in Figure 8, where the red dot represents the optimal solution. The graph exhibits concavity at both and T.
7. Sensitivity Analysis
This section elucidates the numerical analyses performed to gain managerial insights. The primary focus was examining financial parameters’ effects on buyer decision-making and profits. Similarly, a sensitivity analysis was performed for and , respectively.
As shown in Table 2, as increases, each of the decision variables , T, , Q, and R increases. This observation indicates that the longer the demand growth period is, the larger the stock period , the replenishment cycle T, the optimal profit , the ordered quantity Q, and the backordered quantity R are.

Table 2.
Numerical results for different values.
As shown in Table 3, three scenarios occur as the permissible delay period M increases.

Table 3.
(a) Numerical results for different M values () (b) Numerical results for different M values ().
- When , the optimal profit and the backordered quantity R are greater, whereas the stock period , the replenishment cycle T, and the ordered quantity Q are lower.
- When , the replenishment cycle T, the optimal profit , the ordered quantity Q, and the backordered quantity R are all greater, whereas the stock period is shorter.
- When , the stock period , the replenishment cycle T, the optimal profit , and the ordered quantity Q are all greater, whereas the backordered quantity R is lower when but greater when .
In summary, the optimal profit increases as the permissible delay period M increases, regardless of whether the value of or is greater or lower than that of M. This observation indicates that the change in the permissible delay period M significantly affects the optimal profit .
We here used the parameter values from Examples 1 and 2 to perform sensitivity analyses and investigate how each critical parameter affects the optimal solution. The numerical results of the sensitivity analyses are shown in the following tables:
As shown in Table 4, as increases, , T, Q, and R all increase, whereas or decreases. This observation indicates that the greater the ordering cost , the greater the stock period , the replenishment cycle T, the order quantity Q, and the backordered quantity R. However, the larger the ordering cost , the smaller the optimal profit or .

Table 4.
(a) Numerical results for different values (); (b) Numerical results for different values ().
As shown in Table 5, as increases, , T, , and Q all decrease, whereas R increases. This means that the greater the purchase cost , the smaller the stock period , the replenishment cycle T, the optimal profit , and the order quantity Q, but the larger the backorder quantity R.

Table 5.
(a) Numerical results for different values (); (b) Numerical results for different values ().
As shown in Table 6, as increases, , T, , and Q all increase, whereas R decreases. This observation indicates that the greater the unit sale price , the greater the stock period , the replenishment cycle T, the optimal profit , and the order quantity Q, but the smaller the backorder quantity R. A higher sale price clearly results in greater profit.

Table 6.
(a) Numerical results for different values (); (b) Numerical results for different values ().
8. Conclusions
In this research, we explored an ACC payment for non-instantaneous deteriorating items with a ramp-type demand rate with partial backlogging and using DCF analysis. Some necessary conditions for optimal solutions were obtained. Using these necessary conditions and the software Mathematica 13.1, we obtained numerical examples and conducted a sensitivity analysis for scenarios in which (1) the demand growth period is shorter than or equal to the stable quality period, or (2) the demand growth period is greater than or equal to the stable quality period. Our findings indicate that optimal profit rises with an increase in the permissible delay period and sale price but decreases with an increase in order and purchase costs. Thus, to obtain optimal profit, the permissible delay period and the unit sale price should be increased.
This model can be extended in various ways to advance research in this area. For example, the model can be extended by incorporating a demand rate function that is a function of the sale price or the retailer strategy of offering discounted prices to attract more customers when an ACC payment is adopted. Storage capacity constraints should also be incorporated into the model.
Author Contributions
Conceptualization, H.-L.Y. and C.-T.C.; Methodology, H.-L.Y. and C.-T.C.; Software, Y.-T.T.; Formal analysis, H.-L.Y. and C.-T.C.; Visualization, Y.-T.T.; Writing—original draft, H.-L.Y.; Writing—review & editing, H.-L.Y., C.-T.C. and Y.-T.T. All authors have read and agreed to the published version of the manuscript.
Funding
This research received no external funding.
Data Availability Statement
No new data were created or analyzed in this study. Data sharing is not applicable to this article.
Conflicts of Interest
The authors declare no conflict of interest.
References
- Walpole, R.E.; Myers, R.H. Probability and Statistics for Engineering and Scientists; Macmillan: New York, NY, USA, 1978. [Google Scholar]
- Ouyang, L.Y.; Wu, K.S.; Yang, C.T. A study on an inventory model for non-instantaneous deteriorating items with permissible delay in payments. Comput. Ind. Eng. 2006, 51, 637–651. [Google Scholar] [CrossRef]
- Geetha, K.V.; Uthayakumar, R. Economic design of an inventory policy for non-instantaneous deteriorating items under permissible delay in payments. J. Comput. Appl. Math. 2010, 233, 2492–2505. [Google Scholar] [CrossRef]
- Maihami, R.; Kamalabadi, I.N. Joint pricing and inventory control for non-instantaneous deteriorating items with partial backlogging and time and price dependent demands. Int. J. Prod. Econ. 2012, 136, 116–122. [Google Scholar] [CrossRef]
- Soni, H.; Patel, K. Optimal pricing and inventory policies for non-instantaneous deteriorating items with permissible delay in payment: Fuzzy expected value model. Int. J. Ind. Eng. Comput. 2012, 3, 281–300. [Google Scholar] [CrossRef]
- Chang, C.T.; Cheng, M.C.; Ouyang, L.Y. Optimal pricing and ordering policies for non-instantaneously deteriorating items under order-size-dependent delay in payment. Appl. Math. Model. 2015, 39, 747–763. [Google Scholar] [CrossRef]
- Tiwari, S.; Cárdenas-Barrón, L.E.; Khanna, A.; Jaggi, C.K. Impact of trade credit and inflation on retailer’s ordering policies for non-instantaneous deteriorating items in a two-warehouse environment. Int. J. Prod. Econ. 2016, 176, 154–169. [Google Scholar] [CrossRef]
- Jaggi, C.K.; Tiwari, S.; Goel, S.K. Credit financing in economic ordering policies for non-instantaneous deteriorating items with price dependent demand and two storage facilities. Ann. Oper. Res. 2017, 248, 253–280. [Google Scholar] [CrossRef]
- Lashgari, M.; Taleizadeh, A.A.; Sadjadi, S.J. Ordering policies for non-instantaneous deteriorating items under hybrid partial prepayment, partial trade credit and partial backordering. J. Oper. Res. Soc. 2018, 69, 1167–1196. [Google Scholar] [CrossRef]
- Tavassoli, S.; Manavizadeh, N.; Rezzaei, A.; Rabbani, M. A lot-sizing model for non-instantaneous deteriorating products under advance payment and non-linear partial backlogging. Iran. J. Manag. Stud. 2022, 15, 85–110. [Google Scholar] [CrossRef]
- Pathak, K.; Yadav, A.S.; Agarwal, P. Optimizing two-warehouse inventory for shelf-life stock with time-varying bi-quadratic demand under shortages and inflation. Math. Model. Eng. Probl. 2024, 11, 446–456. [Google Scholar] [CrossRef]
- Manna, S.K.; Chaudhrui, K.S. An EOQ model with ramp type demand rate, time dependent deterioration rate, unit production cost and shortages. Eur. J. Oper. Res. 2006, 171, 557–566. [Google Scholar] [CrossRef]
- Deng, P.S.; Lin, R.H.J.; Chu, P. A Note on the inventory models for deteriorating items with ramp type demand rate. Eur. J. Oper. Res. 2007, 178, 112–120. [Google Scholar] [CrossRef]
- Panda, S.; Senapati, S.; Basu, M. Optimal replenishment policy for perishable seasonal products in a season with ramp-type dependent demand. Comput. Ind. Eng. 2008, 54, 301–314. [Google Scholar] [CrossRef]
- Agrawal, S.; Banerjee, S. Two-warehouse inventory model with ramp-type demand and partially backlogged shortages. Int. J. Syst. Sci. 2011, 42, 1115–1126. [Google Scholar] [CrossRef]
- Skouri, K.; Konstantaras, I.; Manna, S.K. Inventory models with ramp type demand rate, time dependent deterioration rate, unit production cost and shortages. Ann. Oper. Res. 2011, 191, 73–95. [Google Scholar] [CrossRef]
- Agrawal, S.; Banerjee, S.; Papachristos, S. Inventory model with deteriorating items, ramp-type demand and partially backlogged shortages for a two-warehouse system. Appl. Math. Model. 2013, 37, 8912–8929. [Google Scholar] [CrossRef]
- Halim, M.A. Weibull distributed deteriorating inventory model with ramp type demand and fully backlogged shortage. Asian J. Math. Comput. Res. 2017, 19, 148–157. Available online: https://www.researchgate.net/publication/319330183 (accessed on 1 September 2024).
- Shi, Y.; Zhang, Z.; Zhou, F.; Shi, Y. Optimal ordering policies for a single deteriorating item with ramp-type demand rate under permissible delay in payments. J. Oper. Res. Soc. 2019, 70, 1848–1868. [Google Scholar] [CrossRef]
- Yang, H.L. An inventory model for ramp-type demand with two-level trade credit financing linked to order quantity. Open J. Bus. Manag. 2019, 7, 427–446. [Google Scholar] [CrossRef][Green Version]
- Viswanath, J.; Thilagavathi, R.; Karthi, K.; Mahadal, M. A study of a two storage single product inventory system with ramp type demand, n-phase prepayment and purchase for exigency. Mathematics 2023, 11, 1728. [Google Scholar] [CrossRef]
- Harris, F.W. How many parts to make at once. Fact. Mag. Manag. 1913, 10, 135–136, 152. [Google Scholar] [CrossRef]
- Teng, J.T. Optimal ordering policies for a retailer who offers distinct trade credits to its good and bad credit customers. Int. J. Prod. Econ. 2009, 119, 415–423. [Google Scholar] [CrossRef]
- Yang, C.T.; Pan, Q.; Ouyang, L.Y.; Teng, J.T. Retailer’s optimal order and credit policies when a supplier offers either a cash discount or delay payment linked to order quantity. Eur. J. Ind. Eng. 2013, 7, 370–392. [Google Scholar] [CrossRef]
- Goyal, S.K. Economic order quantity under conditions of permissible delay in payments. J. Oper. Res. Soc. 1985, 36, 335–338. [Google Scholar] [CrossRef]
- Shah, N.H. Probabilistic time-scheduling model for an exponentially decaying inventory when delay in payments is permissible. Int. J. Prod. Econ. 1993, 32, 77–82. [Google Scholar] [CrossRef]
- Teng, J.T. On the economic order quantity under conditions of permissible delay in payments. J. Oper. Res. Soc. 2002, 53, 915–918. Available online: https://www.jstor.org/stable/822919 (accessed on 1 September 2024). [CrossRef]
- Gupta, D.; Wang, L. A stochastic inventory model with trade credit. Manuf. Serv. Oper. Manag. 2009, 11, 4–18. [Google Scholar] [CrossRef]
- Taleizadeh, A.A.; Pentico, D.W.; Jabalamei, M.S.; Aryanezhad, M. An EOQ model with partial delayed payment and partial backordering. Omega 2013, 41, 354–368. [Google Scholar] [CrossRef]
- Mahata, G.C.; De, S.K. An EOQ inventory system of ameliorating items for price dependent demand rate under retailer partial trade credit policy. Opsearch 2016, 53, 889–916. [Google Scholar] [CrossRef]
- Huang, Y.F. Optimal retailer’s ordering policies in the EOQ model under trade credit financing. J. Oper. Res. Soc. 2003, 54, 1011–1015. [Google Scholar] [CrossRef]
- Yang, H.L. Optimal ordering policy for deteriorating items with limited storage capacity under two-level trade credit linked to order quantity by a discounted cash-flow analysis. Open J. Bus. Manag. 2019, 7, 919–940. [Google Scholar] [CrossRef]
- Moradi, S.; Gholamian, M.R.; Sepehri, A. An inventory model for imperfect quality items considering learning effects and partial trade credit policy. Opsearch 2023, 60, 276–325. [Google Scholar] [CrossRef]
- Lin, F.; Shi, Y.; Zhou, X. Optimizing order policy and credit term for items with inventory-level-dependent demand under trade credit limit. J. Manag. Sci. Eng. 2023, 8, 413–429. [Google Scholar] [CrossRef]
- Pal, S.; Manna AKAli, I.; Roy, P.; Shaikh, A.A. A two-warehouse inventory model with credit policy and inflation effect. Decis. Anal. J. 2024, 10, 100406. [Google Scholar] [CrossRef]
- Zhang, A.X. Optimal advance payment scheme involving fixed pre-payment costs. Omega 1996, 24, 577–582. [Google Scholar] [CrossRef]
- Gupta, R.K.; Bhunia, A.K.; Goyal, S.K. An application of genetic algorithm in solving an inventory model with advance payment and interval valued inventory costs. Math. Comput. Model. 2009, 49, 893–905. [Google Scholar] [CrossRef]
- Maiti, A.K.; Maiti, M.K.; Maiti, M. Inventory model with stochastic lead-time and price-dependent demand incorporating advance payment. Appl. Math. Model. 2009, 33, 2433–2443. [Google Scholar] [CrossRef]
- Taleizadeh, A.A. An EOQ model with partial backordering and advance payments for an evaporating item. Int. J. Prod. Econ. 2014, 155, 185–193. [Google Scholar] [CrossRef]
- Teng, J.T.; Cárdenas-Barrón, L.E.; Chang, H.J.; Wu, J.; Hu, Y. Inventory lot-size policies for deteriorating items with expiration dates and advance payments. Appl. Math. Model. 2016, 40, 8605–8616. [Google Scholar] [CrossRef]
- Khan, M.A.A.; Shaikh, A.A.; Panda, G.; Konstantaras, I.; Cárdenas-Barrón, L.E. The effect of advance payment with discount facility on supply decisions of deteriorating products whose demand is both price and stock dependent. Int. Trans. Oper. Res. 2020, 27, 1343–1367. [Google Scholar] [CrossRef]
- Zhang, Q.; Tsao, Y.C.; Chen, T.H. Economic order quantity under advance payment. Appl. Math. Model. 2014, 38, 5910–5921. [Google Scholar] [CrossRef]
- Zia, N.P.; Taleizadeh, A.A. A lot-sizing model with backordering under hybrid linked-to-order multiple advance payments and delayed payment. Transp. Res. Part E Logist. Transp. Rev. 2015, 82, 19–37. [Google Scholar] [CrossRef]
- Diabat, A.; Taleizadeh, A.A.; Lashgari, M. A lot sizing model with partial downstream delayed payment, partial upstream advance payment, and partial backordering for deteriorating items. J. Manuf. Syst. 2017, 45, 322–342. [Google Scholar] [CrossRef]
- Duary, A.; Das, S.; Arif, M.G.; Abualnaja, K.M.; Khan, M.A.A.; Zakarya, M.; Shaikh, A.A. Advance and delay in payments with price-discount inventory model for deteriorating items under capacity constraint and partially backlogged shortages. Alex. Eng. J. 2022, 61, 1735–1745. [Google Scholar] [CrossRef]
- Li, R.; Chan, Y.L.; Chang, C.T.; Cárdenas-Barrón, L.E. Pricing and lot-sizing policies for perishable products with advance-cash-credit payments by a discounted cash-flow analysis. Int. J. Prod. Econ. 2017, 193, 578–589. [Google Scholar] [CrossRef]
- Li, R.; Skouri, K.; Teng, J.T.; Yang, W.G. Seller’s optimal replenishment policy and payment term among advance, credit, and credit payments. Int. J. Prod. Econ. 2018, 197, 35–42. [Google Scholar] [CrossRef]
- Wu, J.; Teng, J.T.; Chan, Y.L. Inventory policies for perishable products with expiration dates and advance-cash-credit payment schemes. Int. J. Syst. Sci. Oper. Logist. 2018, 5, 310–326. [Google Scholar] [CrossRef]
- Li, R.; Liu, Y.; Teng, J.T.; Tsao, Y.C. Optimal pricing, lot-sizing and backordering decisions when a seller demands for an advance-cash-credit payment scheme. Eur. J. Oper. Res. 2019, 278, 283–295. [Google Scholar] [CrossRef]
- Li, R.; Teng, J.T.; Chang, C.T. Lot-sizing and pricing decisions for perishable products under three-echelon supply chains when demand depends on price and stock-age. Ann. Oper. Res. 2021, 307, 303–328. [Google Scholar] [CrossRef]
- Li, R.; Yang, H.L.; Shi, Y.; Teng, J.T.; Lai, K.K. EOQ-based pricing and customer credit decisions under general supplier payments. Eur. J. Oper. Res. 2021, 289, 652–665. [Google Scholar] [CrossRef]
- Tsao, Y.C.; Muthi’ah, A.D.; Vu, T.L.; Arvitrida, N.I. Supply chain network design under advance-cash-credit payment. Ann. Oper. Res. 2021, 305, 251–272. [Google Scholar] [CrossRef]
- Feng, L.; Skouri, K.; Wang, W.C. Optimal selling price, replenishment cycle and payment time among advance, cash, and credit payments from the seller’s perspective. Ann. Oper. Res. 2022, 315, 791–812. [Google Scholar] [CrossRef] [PubMed]
- Feng, L.; Wang, W.C.; Teng, J.T.; Cárdenas-Barrón, L.E. Pricing and lot-sizing decision for fresh goods when demand depends on unit price, displaying stocks and product age under generalized payments. Eur. J. Oper. Res. 2022, 296, 940–952. [Google Scholar] [CrossRef]
- Shi, Y.; Zhang, Z.; Tiwari, S.; Tao, Z. Retailer’s optimal strategy for a perishable product with increasing demand under various payment schemes. Ann. Oper. Res. 2022, 315, 899–929. [Google Scholar] [CrossRef]
- Tsao, Y.C.; Pantisoontorn, A.; Vu, T.L.; Chen, T.H. Optimal production and predictive maintenance decisions for deteriorated products under advance-cash-credit payments. Int. J. Prod. Econ. 2024, 269, 109132. [Google Scholar] [CrossRef]
- Chang, C.T.; Tseng, Y.T. The impact of payment schemes and carbon emission policies on replenishment and pricing decisions for perishable products in a Supply Chain. Mathematics 2024, 12, 1033. [Google Scholar] [CrossRef]
Disclaimer/Publisher’s Note: The statements, opinions and data contained in all publications are solely those of the individual author(s) and contributor(s) and not of MDPI and/or the editor(s). MDPI and/or the editor(s) disclaim responsibility for any injury to people or property resulting from any ideas, methods, instructions or products referred to in the content. |
© 2024 by the authors. Licensee MDPI, Basel, Switzerland. This article is an open access article distributed under the terms and conditions of the Creative Commons Attribution (CC BY) license (https://creativecommons.org/licenses/by/4.0/).

