1. Introduction
In the rapidly evolving digital world, network topology describes the arrangement of nodes within a network, such as computers, servers, routers, etc., and the connections between them. By quantifying network topology through mathematical models, one can analyze the patterns of connectivity and data flow paths to predict and prevent potential cyber attacks, optimize the layout and structure of the network to enhance its efficiency and reliability, and assist in the strategic allocation of security resources to maximize the overall network security with limited resources. Mathematical models for quantifying network topology provide a deep theoretical understanding of network structure and security.
The Internet is composed of autonomous systems (AS) interconnected through the BGP protocol, managed by operators from different countries. Routers, as the smallest unit of resources, may have a geographic distribution that differs from the country of their affiliated operators. A network composed of routers located within the same country is referred to as the country’s territorial network, while a network of routers that belong to operators from the same country is called the country’s AS network. Routers within a country’s AS network may be distributed across multiple countries, and conversely, a country’s territorial network may contain routers from multiple countries’ AS networks.
The relationship between a country’s AS and territorial networks is graphically represented in
Figure 1. Within this framework, the territorial network is divided into an internal network and an extra-AS network, while the AS network consists of an internal network and an extra-territorial network. The intersection between the territorial network and the AS network forms the internal network, which includes routers that are geographically located within the country and owned by its AS. Conversely, the portion of the AS network that extends beyond the country’s geographical boundaries constitutes the extra-territorial network. Similarly, the portion of the foreign AS network that operates within the country’s territorial network is designated as the extra-AS network.
Previous work has focused on detecting global network topology and mapping it to higher-level network topologies. For example, the Ark platform [
1] initiated by CAIDA, the iPlane project [
2], the TopologyZoo project [
3], and Internet Atlas [
4] efficiently discovered IP-level network topology through comprehensive address space measurement. CAIDA developed tools like Iffinder [
5] and midar [
6] to map IP-level topology to router-level topology. Huffaker [
7] localized routers by decoding router hostnames, while Luckie [
8] improved the accuracy of geographical information extraction. Gharaibeh [
9] utilized public and commercial databases to localize routers. Huffaker [
10] also proposed heuristic methods to map IP2AS to Router2AS, Marder proposed the MAP-IT [
11] method to infer AS-level and router-level border information [
12], and Luckie [
13] introduced the BDRMAP method to identify inter-AS router connections.Despite these significant advancements, there remain gaps in research regarding the evaluation of network resource distribution.
To more equitably assess the differences in network resources among countries worldwide, we propose a method to quantify the relationship between AS and territorial networks. Using global router-level topology data as the foundational dataset for network resources, we abstract the dual mapping information of routers’ geographic distribution and their associated operators into a mathematical matrix model. The rows of the matrix represent the number of routers distributed across different countries’ territories within a country’s AS network, while the columns indicate the number of routers deployed by different countries’ AS networks within a specific country’s territorial network.
We propose relevant indicators from the perspectives of network scale and border connectivity to compare the matrix model data across different periods, thereby quantitatively assessing the changes in network structures among countries globally. In the analysis of network scale, we introduce two indicators, deployment consistency and the impact of the AS network, to evaluate the scale and scope of router distribution in the country’s AS and territorial networks. Deployment consistency measures the proportion of identical routers within a country’s AS and territorial networks, focusing on the internal network aspect. The impact of the AS network calculates the cumulative proportion of routers from a country’s AS network deployed within other countries’ territories, emphasizing the extra-territorial network. In the analysis of border connectivity, we present two indicators, border connection consistency and router node degree, to assess the connectivity of the country’s AS and territorial networks. Border connection consistency measures the proportion of identical border links within both AS and territorial networks. The router node degree reflects the average number of connections for each router within the network. By evaluating these four indicators of network topology across different periods, we observe the changes in country-level networks over time.
The contributions of this paper are mainly reflected in two aspects: First, this study innovatively proposes a mathematical model of the relationship between AS and territorial networks based on real network data. It performs quantitative analysis from multiple dimensions, including network resource distribution scale, coverage range, connectivity, and temporal evolution, aiming to explore the differences in network resource allocation among countries worldwide. Second, this study constructs four key quantitative indicators based on the geographical distribution and connection patterns of routers. It converts actual network data into quantifiable relational data to evaluate the heterogeneity of network deployments across countries. These findings provide new perspectives for understanding global Internet infrastructure and offer valuable insights for policymakers, network operators, and researchers.
This study conducts an in-depth analysis of the distribution of internet resources and the complex dynamic relationship between AS and territorial networks, leading to the following key conclusions:
- 1.
Concentration of Internet Resources: A significant portion of global internet resources is concentrated in a few countries. The United States leads with 38.04% of the global routers. These routers are widely deployed across 87.88% of countries, covering 90.91% of the network, with an influence score of 20.08. In contrast, most countries control only 0.43% of the global routers on average, deploying them in just 8.12% of countries/regions, and connect to 16.95% of networks.
- 2.
Disparities in Router and Border Link Distribution: The allocation of routers within AS and territorial networks is more evenly distributed than border links between different countries. Only 23.81% of countries/regions have an impact of the AS network exceeding the baseline level. Meanwhile, 72.22% of countries/regions have a node degree of internal routers lower than that of external routers, while 66.67% of countries/regions have a higher node degree of routers in external AS networks than within their own territories.
- 3.
Geographic Variations in Network Relationships: The relationship between AS and territorial networks shows significant geographic differences. Asian countries/regions exhibit the strongest cohesion between these networks, with this trend strengthening over time. They maintain a balance in deployment and border connection consistency as well as node degree of router, with stable impact scores. African countries/regions show a similar pattern to Asia, though with relatively lower metrics. European countries/regions are characterized by a gradually weakening relationship between AS and territorial networks, yet they achieve the highest impact scores.
These findings provide a new perspective for understanding the distribution and dynamic changes of global internet resources. They also contribute to further discussions on the fairness and efficiency of network resource allocation.
The remainder of the paper is organized as follows.
Section 2 explains the dataset for the study we are investigating;
Section 3 introduces the network analysis model and indicators, then obtains experimental results;
Section 4 describes the border connection analysis model and indicators, then obtains experimental results;
Section 5 observes the variation of indicators over time in terms of continent;
Section 6 evaluates the limitations of the method and discussion;
Section 7 introduces related work; and
Section 8 concludes the paper.
2. Date Set
To ensure transparency and reproducibility in our experimental process, allowing other researchers to verify and replicate our results, we utilize the Macroscopic Internet Topology Data Kit (ITDK) provided by the Center for Applied Internet Data Analysis (CAIDA) [
14]. CAIDA engages in network research and develops research infrastructure to facilitate extensive data collection, curation, and distribution to the scientific community. The ITDK offers insights into global Internet connectivity and routing by aggregating data from a broad spectrum of the Internet. A key aspect of our methodology involves employing traceroute-like techniques for discovering IP interfaces and their connections to construct a network topology that mirrors the actual network more closely. This requires the identification of interfaces that belong to the same router. Our approach utilizes two primary tools: Iffinder and MIDAR.
Iffinder operates by sending probing UDP packets to an unused port on an interface address. Many routers respond to these packets with an ICMP PORT UNREACHABLE error, revealing the source address as the interface address on the returning unicast route. If a probe sent to one interface elicits this error from another, it signifies that both interfaces are part of the same network node. MIDAR, or Monotonic ID-Based Alias Resolution, identifies routers by examining the IP ID value in response packets from an interface address. Routers typically generate IP ID values using a simple, shared counter across interfaces. Detecting shared counter-generated IP ID values in response packets from two interfaces indicates that these interfaces belong to the same network node.
Our analysis is based on IPv4 router-level topology data, resolved using MIDAR and Iffinder techniques. The topology information is organized into two primary files: one detailing the nodes and the other outlining the links. Other files provide additional information, such as the assignment of Autonomous Systems (ASes) to each node, geolocation data for each node, and a record of transit or destination hops for each observed interface.
2.1. Data Pre-Processing
For our analysis, we meticulously clean the router interfaces and extract inter-router links to ensure data accuracy. The cleaning process adheres to the following rules:
- 1.
Interface Addresses in 224.0.0.0/3: These addresses are not genuine and are artificially generated to identify potentially unique, non-responding interfaces encountered in traceroute paths.
- 2.
Interface Address in 100.64.0.0/16: This range is reserved for carrier-grade NAT (CGN) and does not correspond to geolocatable locations or mappable AS configurations.
- 3.
Annotation by the .iface File: Interface addresses annotated as the destination hop, rather than the transit hop, are classified as endpoint nodes instead of router nodes.
For the .link file, we eliminate connections involving cleaned routers and reclassify the connection relationships into a router-to-router link table.
We have processed the CAIDA ITDK router-level topology data across four distinct periods. The categorization includes nodes, anonymous nodes, multi-interface nodes, destination nodes, and remaining nodes, as detailed in
Table 1. Anonymous nodes are those for which the actual IP address cannot be determined or annotated. Destination nodes serve as terminals relative to other nodes in the network, and their abundance can significantly skew network topology modeling. Our focus is on the Internet’s core infrastructure, with routers as the primary objects of study. Therefore, we eliminate anonymous and destination nodes from the original dataset, leaving the remaining nodes as the subjects requiring annotation. The dataset from January 2020 exhibits the highest counts of original nodes, anonymous nodes, and destination nodes, while April 2019 records the lowest. Interestingly, March 2018 features the largest number of multi-interface routers.
2.2. Data Annotation
To enrich our analysis, we annotate routers using the
.geo file for geolocation details and the
.as file for AS information. Furthermore, we utilize AS2Country data [
15] to associate each router with a country based on its AS ownership. In cases where the links table contains a router that is annotated but its counterpart is not, such links are removed from consideration. This ensures that our experimental base data are both accurate and relevant, consisting solely of annotated links and routers.
Our annotation of the CAIDA ITDK router-level topology data spans four distinct periods, revealing insightful trends regarding the number of links, routers, and countries involved. As shown in
Table 2, April 2019 records the highest number of links alongside the lowest count of routers, indicating a dense network of connections among fewer nodes. Conversely, January 2020 presents the smallest number of links but boasted the largest router population, suggesting a more expansive network with sparser connections. By August 2020, the data encompass routers from 228 countries, a notable increase from 222 countries in March 2018, highlighting the growing global diversity of the internet’s structural components.
3. Network Scale Analysis
In this analysis, we treat the network topology data annotated as per the process outlined in
Section 2.2 as representative of the complete global network topology. Through this approach, we can illustrate the routers and links of each country’s territorial network based on geographical location, and depict the routers and links of each country’s AS network according to the country of AS ownership.
3.1. Network Scale Modeling
To systematically understand the distribution and deployment of routers within AS and territorial networks across countries, we construct a square matrix, , where n represents the total number of countries involved in the study. The elements within are defined as follows:
- 1.
Row and Column Vectors: The row vector signifies the quantity of routers that the AS network of country i has deployed across each country’s territorial network. Conversely, the column vector represents the number of routers deployed by all countries’ AS networks within the territorial network of country j. Therefore, the element specifically indicates the number of routers that the AS network of country i deploys in the territorial network of country j.
- 2.
Principal Diagonal: On the principal diagonal of (where ), the element reflects the quantity of routers deployed by a country’s own AS network within its own territorial network, highlighting the presence of internal routers.
- 3.
Zero and Non-Zero Elements: An element suggests that the AS network of country i has no deployment within the territorial network of country j. The count of non-zero elements within a row vector illustrates the diversity of territorial networks in which a single AS network is deployed. Similarly, the count of non-zero elements within a column vector indicates the variety of AS networks that have deployments within a single territorial network:
3.2. Deployment Consistency
We analyze the deployment consistency of each country’s AS network and territorial network using the
Dice similarity coefficient from the perspective of network scale. The sum of the values in the row vector is the number of routers in AS network. The sum of the values in the column vector is the number of routers in territorial network. The number of the same routers in AS and territorial networks is the value of the principal diagonal term. The deployment consistency of AS and territorial network for country K is
:
When the total counts of routers within AS and territorial networks are held constant, a larger value of indicates a higher number of routers shared between the AS network and the territorial network of country K. A higher value of signifies greater congruence between a country’s AS and territorial networks, suggesting a more cohesive and potentially secure national network infrastructure.
3.3. Impact of AS Network
From the perspective of network scale, the distribution of each country’s AS network concerning foreign routers impacts the respective countries. To objectively evaluate the impact that an AS network of one country K exerts on the territorial network of another country T, we adopt a uniform weighting approach, where each country’s impact on the Internet is considered equivalent and assigned a weight of 1. This standardization facilitates a fair and balanced comparison across diverse geopolitical landscapes. The impact metric
is then defined as follows, and this formulation of
quantitatively captures the extent to which an AS network from one country penetrates or influences the territorial network of another, providing a measure of inter-network impact:
To analyze the broader influence of an AS network from country K across the global internet, we define a cumulative impact measure,
, which aggregates the impact of country K’s AS network on the territorial networks of all countries:
The impact of each country’s AS network on the global internet, denoted as
I, can be systematically calculated through matrix operations. Specifically,
I is derived from the matrix product of the router matrix
and a transformation matrix
:
is a column matrix where each entry corresponds to the reciprocal of the total number of routers in the territorial network of each country. The transpose of
, denoted as
, is a row matrix. However, for the impact calculation, we use
in its original column matrix form to align with the dimensions of RN for matrix multiplication:
By evaluating across various k and t pairs, we can map out the intricate web of influences that AS networks exert across international borders, thereby gaining insights into the global dynamics of internet connectivity and control. offers a comprehensive view of how extensively and significantly a single country’s AS network influences the global network topology.
3.4. Result
In this paper, we delve into the August 2020 topology data to examine the nuances of AS and territorial networks. This encompasses the deployment of routers, consistency in deployment, and the impact scores of AS networks.
3.4.1. Global Router Deployment
The classification of routers within our framework is as follows: routers common to both AS and territorial networks are classified as internal routers; those deployed by an AS network in foreign countries are termed extra-territorial routers; and routers within a territorial network belonging to foreign AS networks are identified as extra-AS routers.
Figure 2 illustrates the distribution of these routers across countries, showcasing the sum of internal and extra-territorial routers as the total for AS networks, and the aggregate of internal and extra-AS routers as the total for territorial networks. The data are organized in descending order based on the count of internal routers, with one country represented for every six countries.
Our analysis highlights a significant concentration of global Internet resources within a handful of countries. The disparity in router distribution is stark, with only 28 countries possessing over 10,000 internal routers. Among these, only the United States, China, and Germany boast more than 100,000 internal routers, with the United States alone accounting for over 750,000. Conversely, 11 countries have a minimal presence of just one internal router; notably, Eritrea has 835 extra-AS routers, indicating a detection bias and underscoring the minimal router counts observed in these territories. Mexico emerges as a country with a notably high number of extra-AS routers, contrasting with American Samoa, the Falkland Islands, and Wallis and Futuna, which report none. Similarly, Estonia and Mauritius have a higher count of extra-territorial routers, whereas Mayotte has none. This distribution underscores the uneven spread of internet infrastructure globally, with a few countries dominating in terms of internal routers, while others exhibit significant external dependencies or minimal internal presence, reflecting varied levels of engagement and influence within the global internet architecture.
In our analysis, we explore the deployment patterns of AS and territorial networks across different countries as depicted in
Figure 3. This figure differentiates between countries based on whether their AS networks deploy abroad (AS-only countries), their territorial networks host foreign deployments (territorial-only countries), or they exhibit a mix of both behaviors (same countries). The countries are ranked in descending order by the count of “same countries”, with each country represented every six countries on the horizontal axis for clarity.
Notably, the United States and the United Kingdom stand out for having AS networks deployed in over 100 of the same countries, highlighting their significant international presence in both AS and territorial networks. Conversely, 118 countries have a greater presence of foreign territorial networks than their own AS network deployments abroad. Guinea-Bissau exemplifies this trend, with more than 66 countries hosting its territorial network but very few hosting its AS network, indicating a reliance on external networks for connectivity. Colombia and Spain also show notable disparities, with more than 47 and 43 countries, respectively, hosting their territorial networks compared to their AS network deployments. On the other end of the spectrum, 95 countries have a broader international footprint through their AS networks than through foreign deployments in their territorial networks. Switzerland leads this group with deployments in over 82 countries, followed by Sweden and Finland, with more than 67 and 42 countries, respectively. Unique cases include the Holy See, American Samoa, the Falkland Islands, and Wallis and Futuna, whose territorial networks are comprised solely of domestic AS networks, indicating a closed network environment with no foreign AS presence. Similarly, the Holy See, Saint Pierre and Miquelon, Mayotte, and Tuvalu AS networks are exclusively deployed within their own territories, reflecting a focused domestic internet infrastructure without international deployments.
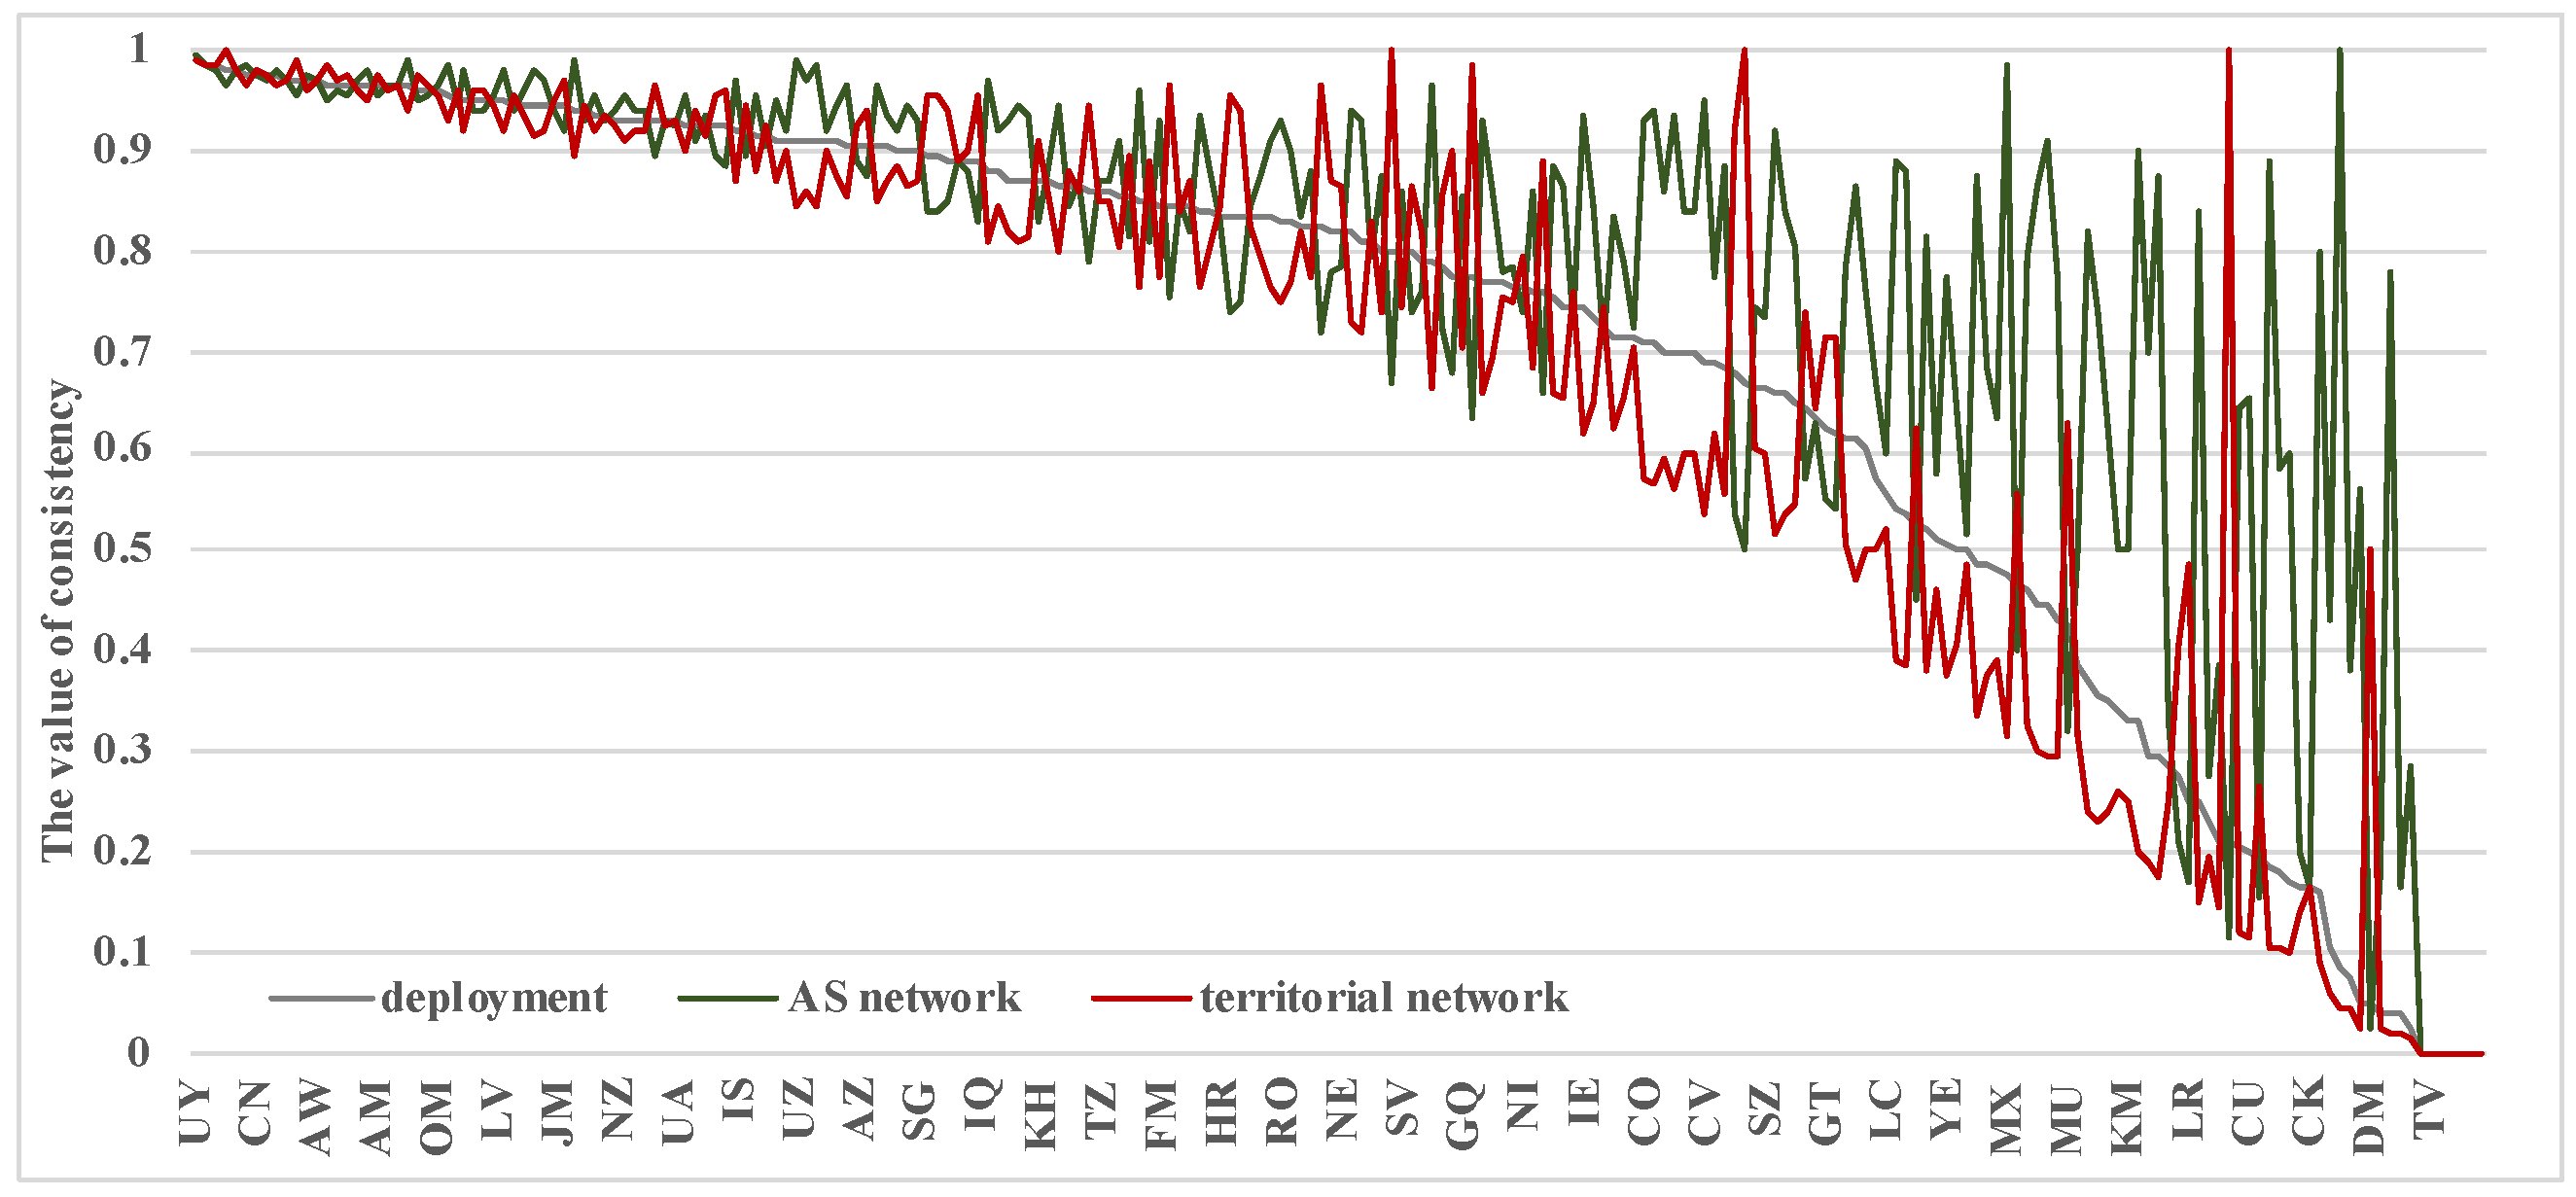
3.4.2. Deployment Consistency of Router
The deployment consistency within each country’s AS and territorial networks is critically analyzed and displayed in
Figure 4, where countries are arranged in descending order based on their deployment consistency. The horizontal axis is structured to showcase one country for every six, facilitating a clearer comparison across a diverse set of nations.
Deployment consistency is gauged by the presence of the same router within both a country’s AS and its territorial networks. A higher consistency indicates a stronger alignment between the two network types. The average deployment consistency across the dataset stands at 0.70, with 153 countries scoring above this average. Notably, Uruguay, Egypt, Vietnam, Bangladesh, and Korea emerge as leaders in this aspect, showcasing the highest levels of deployment consistency. Further breaking down the concept, AS network consistency is defined as the ratio of the internal router count to the total number of routers within the AS network, boasting an average value of 0.78. On the other hand, territorial network consistency, which compares the internal router count to the total within the territorial network, averages at 0.68. This indicates that internal routers tend to align more closely with AS network routers than with those in territorial networks.
A high deployment consistency signifies minimal variance between the consistency ratios of AS and territorial network deployments. Conversely, a country with low consistency reveals a discrepancy in alignment; the internal router configuration is more in sync with either the AS or territorial network but not equally with both. The analysis reveals that most countries exhibit a higher consistency rate with their AS network, suggesting a more centralized control or a strategic focus on developing their AS infrastructure. However, only a select few countries have AS networks with the capacity for extensive international deployment.
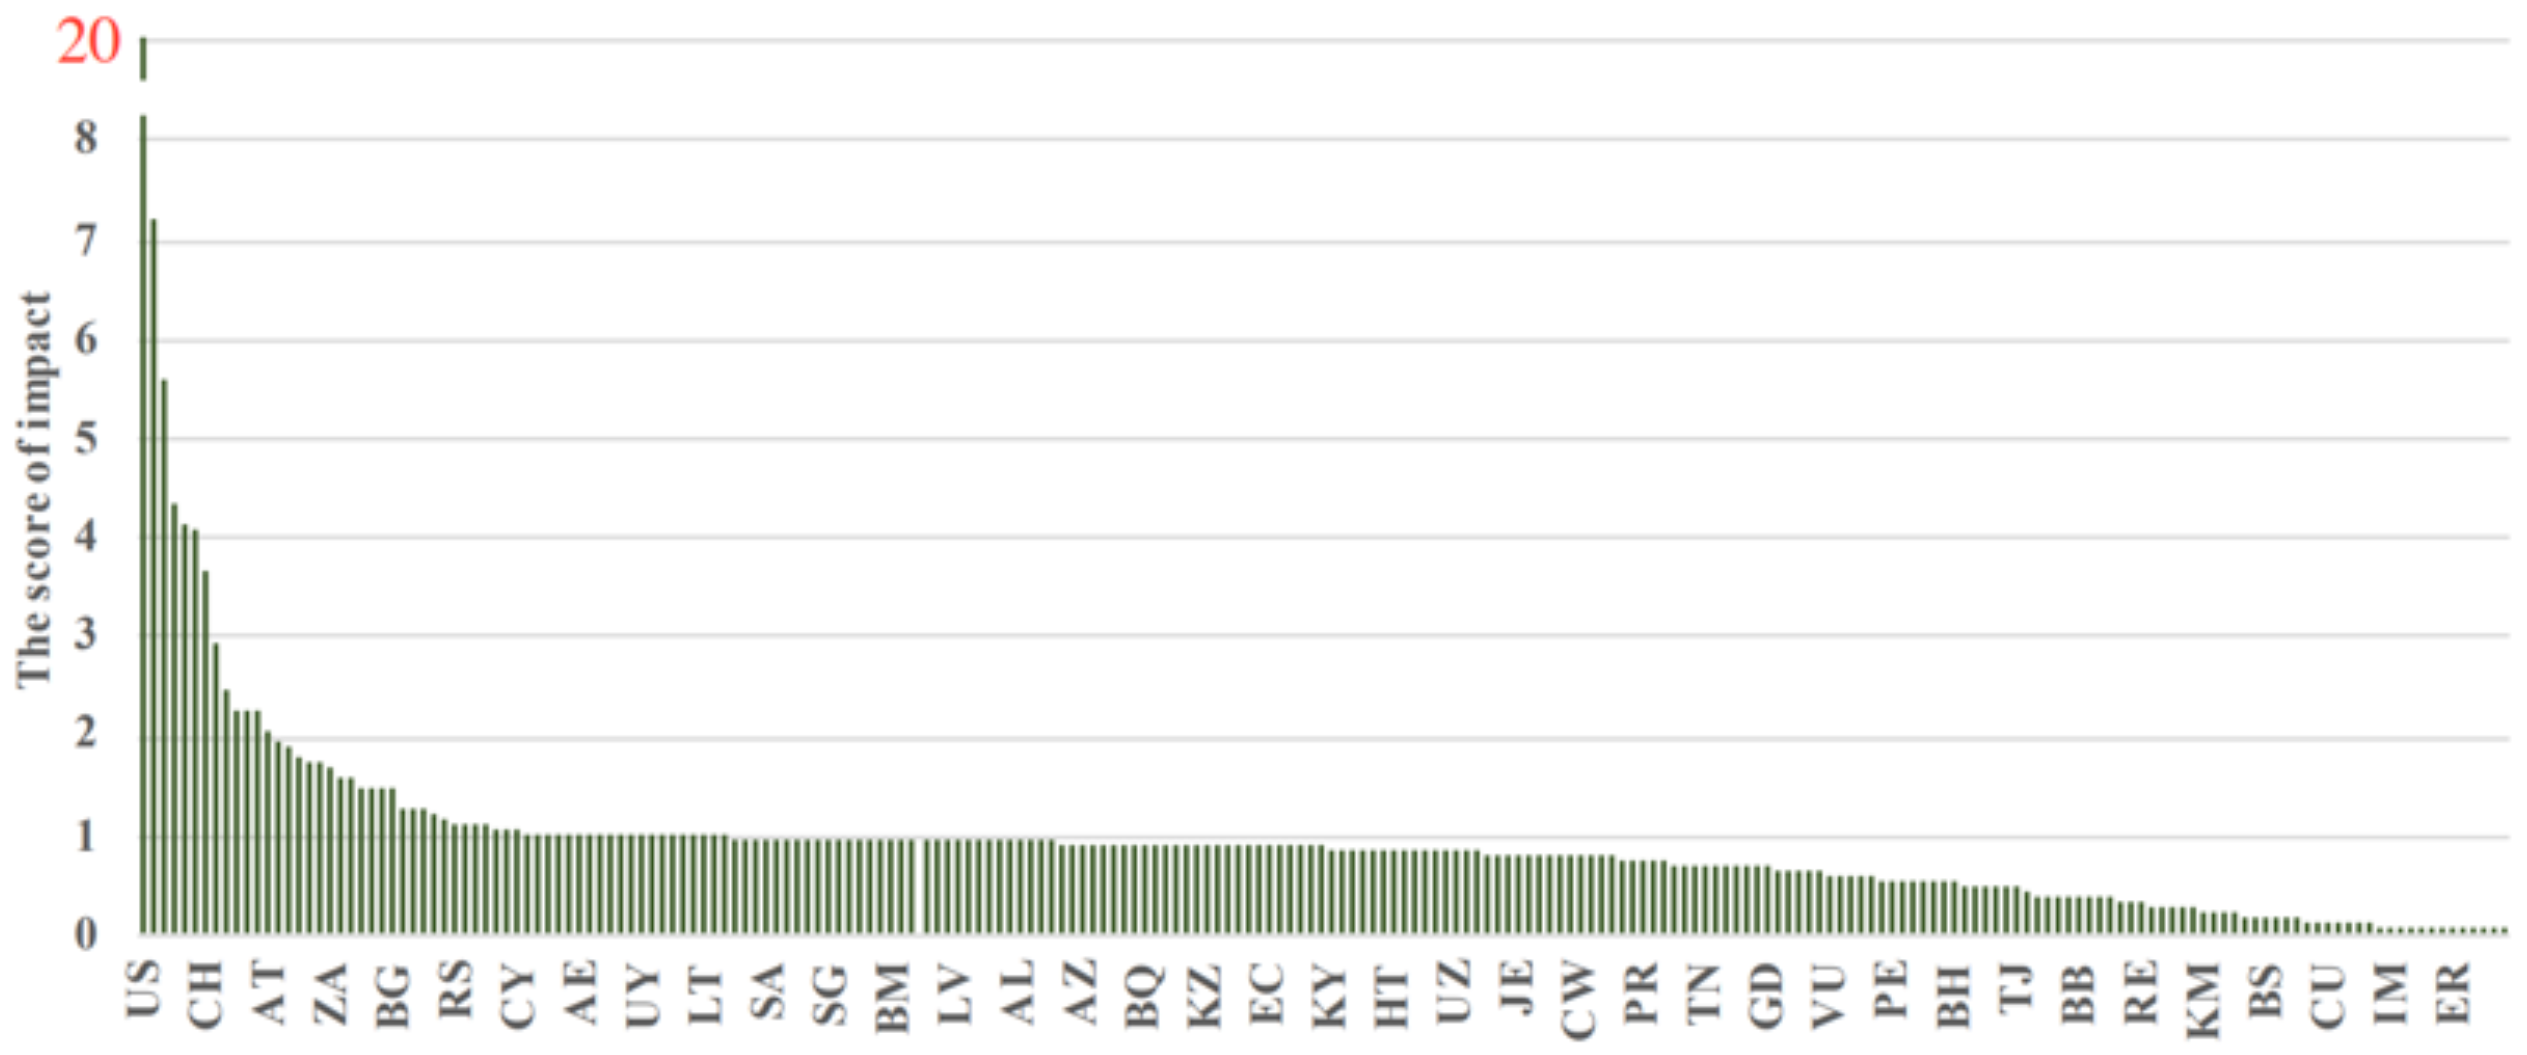
3.4.3. The Impact Score of AS Network
The impact scores of country-level AS networks on the Internet offer a compelling insight into the global distribution of digital influence. This analysis, visualized in
Figure 5 and organized in descending order by impact score, with one country noted for every five, reveals the extent to which countries project their digital presence internationally through their AS networks. This projection is quantified based on the number of routers deployed by these networks across various countries.
The United States emerges as the dominant force, with the highest impact score of 20.1, underscored by its deployment of 90,430 routers across 202 countries. Following the United States are the United Kingdom, France, Germany, and Russia, with respective impact scores of 7.21, 5.58, 4.35, and 4.13. Remarkably, only 55 countries surpass the baseline impact score of 1, collectively accounting for 50% of the total impact score. This statistic reflects a concentrated distribution of influence, where a relatively small number of countries command a disproportionate share of the Internet’s infrastructure. An intriguing case is Dominica, which, despite having a relatively modest AS network with 146 routers deployed in 10 countries, achieves an impact score of 2.49. This high impact relative to its size is attributed to a deployment of routers in locations such as Anguilla, Antigua, and Barbuda, exceeding the proportional deployment within its territorial network.
4. Border Connectivity Analysis
From the perspective of connectivity, we analyze the interconnections between networks, where border connection consistency indicates the degree of connectivity between networks; node degree reflects the connectivity of routers distributed across different networks in each country. This study posits that connections between routers belonging to distinct AS networks constitute AS border links, whereas connections between routers from different territorial networks are identified as territorial border links. The intricate relationship between AS and territorial borders for a given country, referred to herein as country K, is illustrated in
Figure 6.
Within the context of country K, connections that involve an internal router linking to another router within the same network are designated as internal network links, examples of which include links (1, 2, 3, 4). Furthermore, we identify extra-territorial network links (2, 7, 8, 9) and extra-AS network links (3, 5, 6, 7) based on their operational dynamics across territorial and AS borders, respectively. Analyzing the borders further, we categorize links into AS network border links (3, 4, 7, 9) and territorial network border links (2, 4, 6, 7). Among these, common links that serve as border for both networks are recognized as border links (4, 7). Conversely, distinct links are categorized based on their exclusive association with either the AS network, termed AS-only border links (3, 9), or the territorial network, referred to as territorial-only border links (2, 6).
4.1. Border Modeling
To facilitate a detailed analysis of network connectivity and border dynamics across various countries, we introduce a matrix
, where n represents the total number of countries, and the matrix encompasses nine distinct types of links between routers of different classifications within each country. The construction and categorization of this matrix are crucial for understanding the intricate relationships between intra-domain links, AS border links, and territorial border links, alongside their intersections:
For a given country K, the matrix is structured to represent the 9 types of links as follows:
- 1.
Intra-domain Links : These links, specifically , and , operate within the same domain, facilitating communication within a singular network domain without crossing external borders.
- 2.
AS Border Links : Links such as , , and are classified as AS border links. They denote connections that traverse the boundaries between different AS networks, highlighting the points of interconnectivity across autonomous systems.
- 3.
Territorial Border Links : This category includes , , and , representing the links that cross territorial boundaries, thus connecting routers across different geographical territories.
- 4.
Border Links : A subset of links, namely and , are unique in that they simultaneously serve as both AS border links and territorial border links, embodying the intersection of AS and territorial network boundaries.
4.2. Border Connection Consistency
To evaluate the consistency of border connections across countries, we employ the
Dice Similarity Coefficient, a method that quantifies the similarity between two sets. In the context of network analysis for a given country K, the border connection consistency, denoted as
, measures the congruence between territorial network border links
and AS network border links
. This coefficient helps in assessing how closely the two sets of territorial border links and AS network border links overlap, with
representing the intersection where both sets of border links coincide. The formula for calculating
is based on the principle that a higher number of common border links
between the AS network border links
and the territorial network border links
signifies greater consistency. Conversely, a proliferation of cross-border Autonomous Systems (ASes) that do not contribute to
tends to lower the
, indicating less congruence between the AS and territorial network borders:
4.3. Node Degree of the Router
In network analysis, the node degree of a router, defined as the count of its connections with other routers within the network, serves as a key metric for assessing the router’s connectivity. Specifically, the node degree for internal routers
is calculated by dividing the number of internal links by the total count of internal routers. This measure is similarly applied to extra-territorial and extra-AS routers, facilitating a comparative analysis of connectivity across different router classifications:
The node degree can reveal significant insights into the network’s structure and the roles played by various routers within it:
- 1.
AS Network Border Router: The node degree of AS network border routers reflects the level of connectivity between a country’s AS network and the AS networks of other countries. A higher node degree here suggests robust interconnectivity across international AS networks.
- 2.
Territorial Network Border Router: Conversely, the node degree of territorial network border routers illuminates the connectivity between a country’s territorial network and those of other countries, indicating the extent of cross-border territorial network links.
- 3.
Border Router: The node degree of border routers, which straddle the junction of AS and territorial networks, quantifies the degree of geographical boundaries within the AS network. A higher node degree in this category underscores the presence of significant cross-border interactions.
The overarching node degree of a router within these contexts signifies the variance in router connections and underlines the strength of the network connectivity. Typically, countries with well-developed networks generally have the smallest node degree of internal router, the largest node degree of extra-AS router, and the second largest node degree of extra-territorial router.
4.4. Result
Utilizing August 2020 topology data, our analysis delves into the intricacies of AS and territorial networks, focusing on inter-country connectivity, border connection consistency, and the connectivity degrees of various router types.
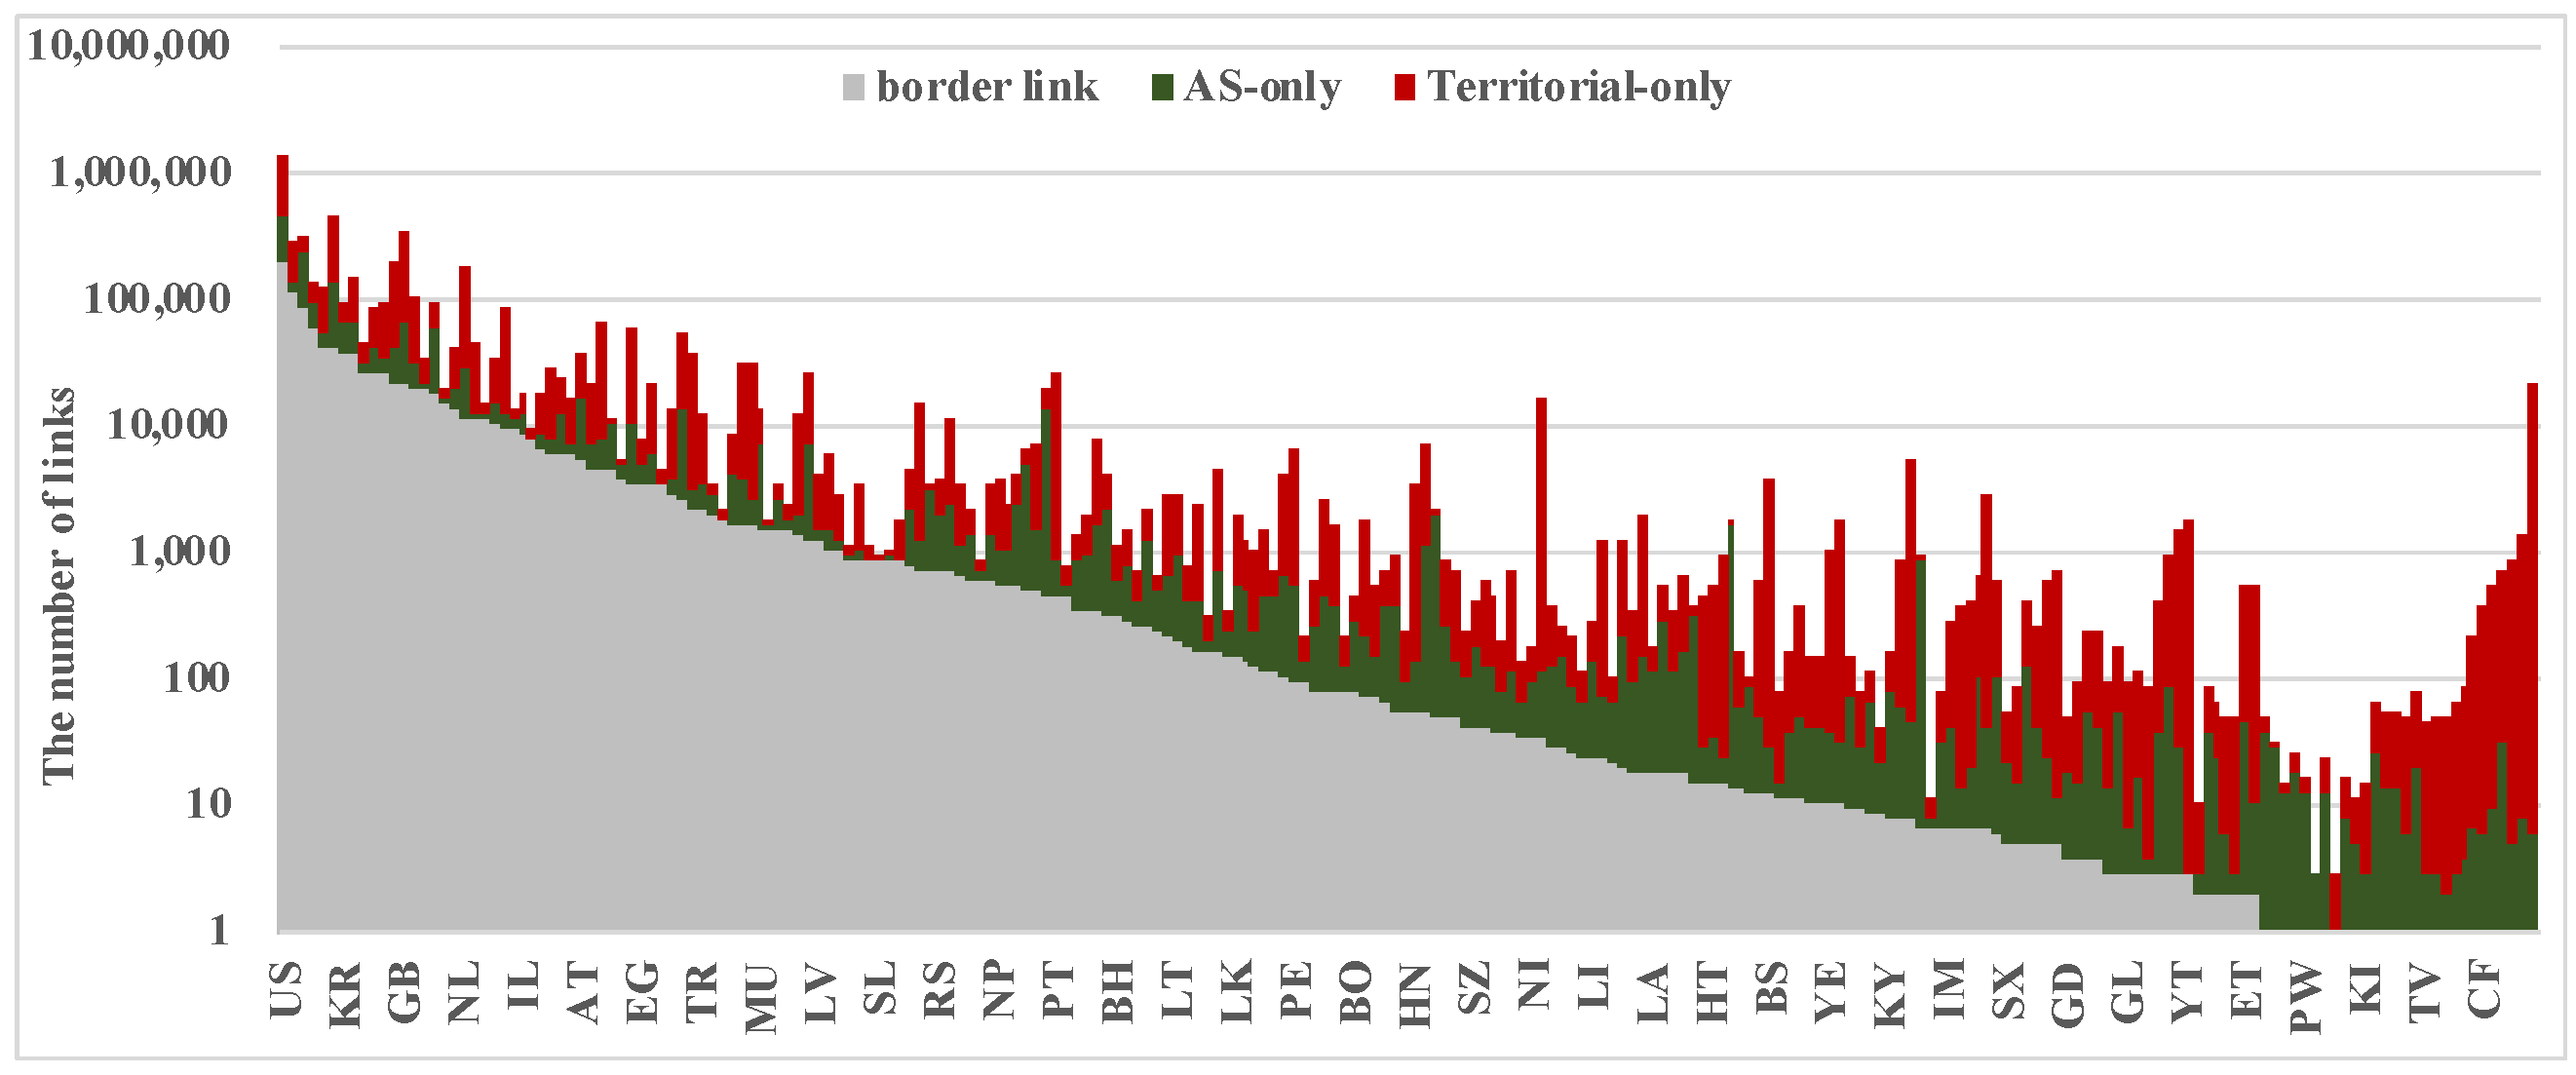
4.4.1. Country Connectivity
Figure 7 presents the distribution of AS and territorial network border links across countries. The aggregate of border links and AS-only border links constitutes the total number of AS network border links, while the sum of border links and territorial-only border links represents the total number of territorial network border links. Countries are arranged on the horizontal axis in descending order based on the quantity of border links, with one country highlighted for every six.
The global internet resource distribution is markedly uneven, with a vast majority of links concentrated in a select few countries. Notably, only the United States and Brazil boast over 100,000 border links. A striking finding is that 27 countries possess merely a single border link shared between networks, highlighting significant disparities in global connectivity. Among them, Guinea-Bissau’s territorial-only border link has 22,848. In most countries, there are more territorial border links than AS, which is consistent with the conclusion of
Figure 3. Guinea-Bissau’s territorial network is closely connected with other countries, consistent with the conclusion of
Figure 2. Furthermore, only 29 countries exhibit a higher count of border links over both AS-only and territorial-only border links, indicating a balanced engagement in both AS and territorial exchanges. Conversely, merely 35 countries have a predominance of AS border links over territorial border links.
The connectivity between countries via AS and territorial network borders offers insightful perspectives on global internet infrastructure.
Figure 8 delineates this connectivity, classifying connections into three categories: connections shared by both AS and territorial networks (same countries), connections exclusive to AS networks (AS-only), and connections unique to territorial networks (territorial-only). This classification helps in understanding the extent and nature of international network interconnections. The data, arranged in descending order based on the count of same countries connected, showcase each country’s connectivity profile with one country highlighted for every five.
A noteworthy observation is that only 15 countries maintain connections with over 100 same countries, demonstrating a significant level of international connectivity. The United States leads with connections to 202 countries, followed closely by Australia with 183. In contrast, 25 countries are connected to two or fewer same countries. On average, territorial networks of each country are connected to 59 other countries, while AS network borders extend to 39 countries.
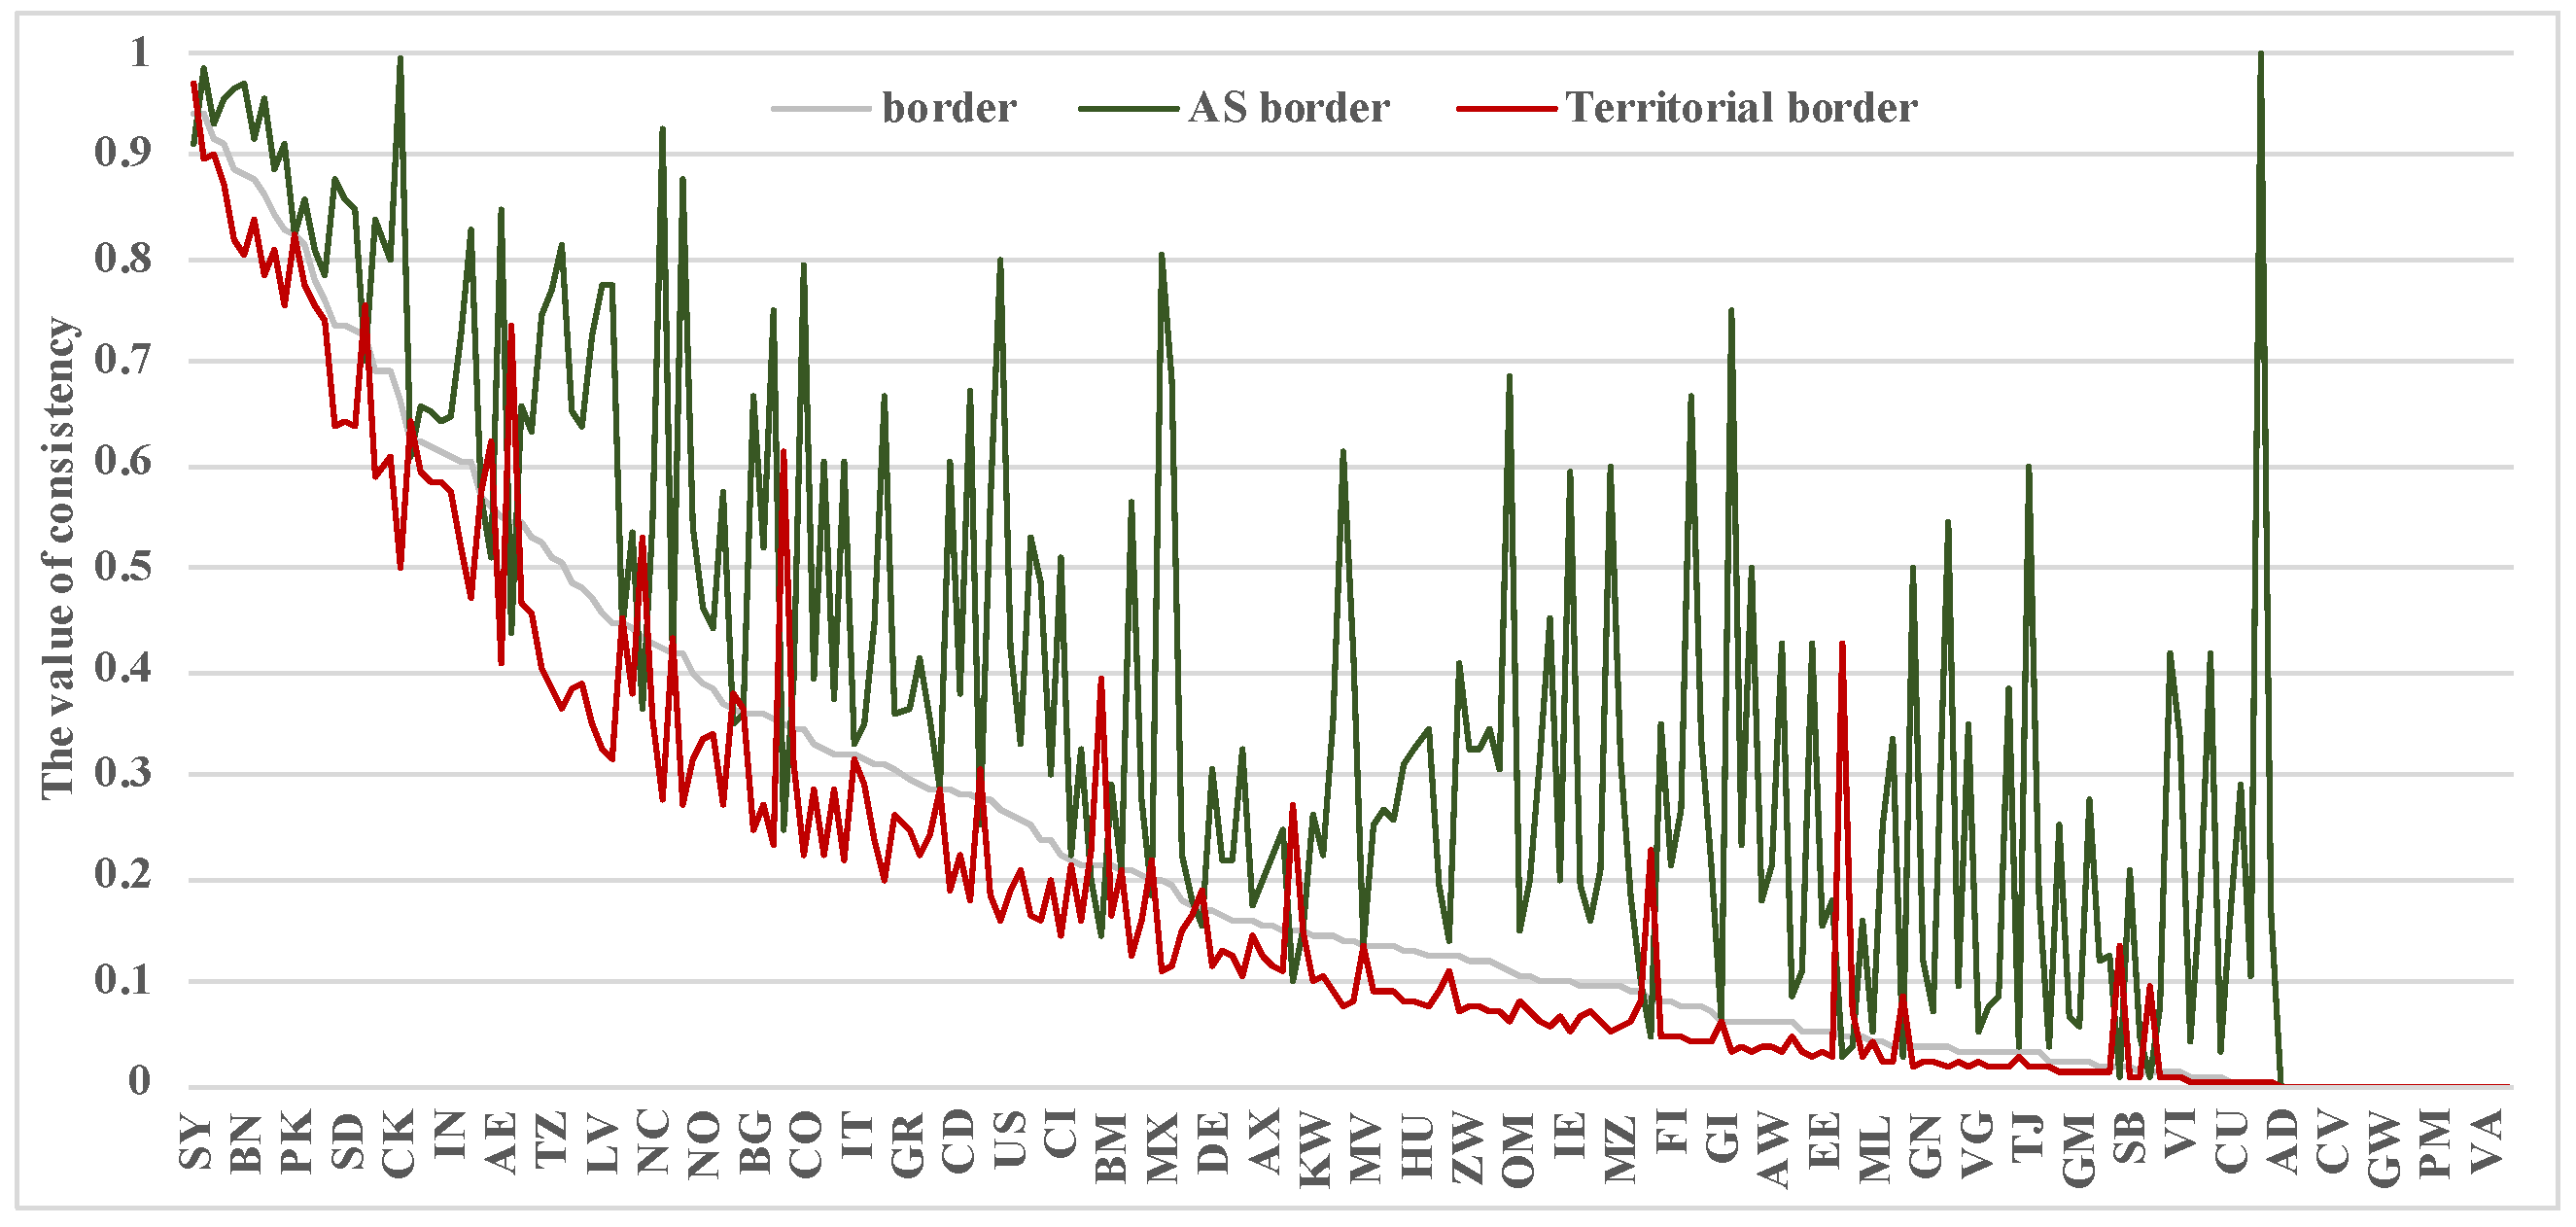
4.4.2. Connection Consistency
The consistency of border connections within each country’s AS and territorial networks provides valuable insights into the coherence of network infrastructure across international boundaries.
Figure 9 presents these data, organized in descending order of connection consistency, with a country highlighted every five on the horizontal axis. This arrangement facilitates a clear comparison of connection consistency across different nations.
Connection consistency is determined by the proportion of border links shared between a country’s AS and territorial networks. With an average consistency score of 0.24, 86 countries exhibit above-average consistency, indicating a relatively high degree of coherence between their AS and territorial networks. Notably, Macao, China, the Syrian Arab Republic, Sierra Leone, Azerbaijan, and Ecuador rank as the top countries in terms of connection consistency. However, 23 countries register a consistency score of zero, reflecting a lack of shared border links between their AS and territorial networks, which may also hint at a detection bias in the topological data, particularly in cases where fewer connections are observed.
The consistency of AS network borders is quantified by the ratio of shared border links to the total AS network border links, averaging 0.38 across the dataset. Conversely, territorial network border consistency, calculated as the ratio of shared border links to total territorial network border links, has a lower average of 0.21. This discrepancy generally suggests that border links align more closely with territorial network borders than with AS network borders.
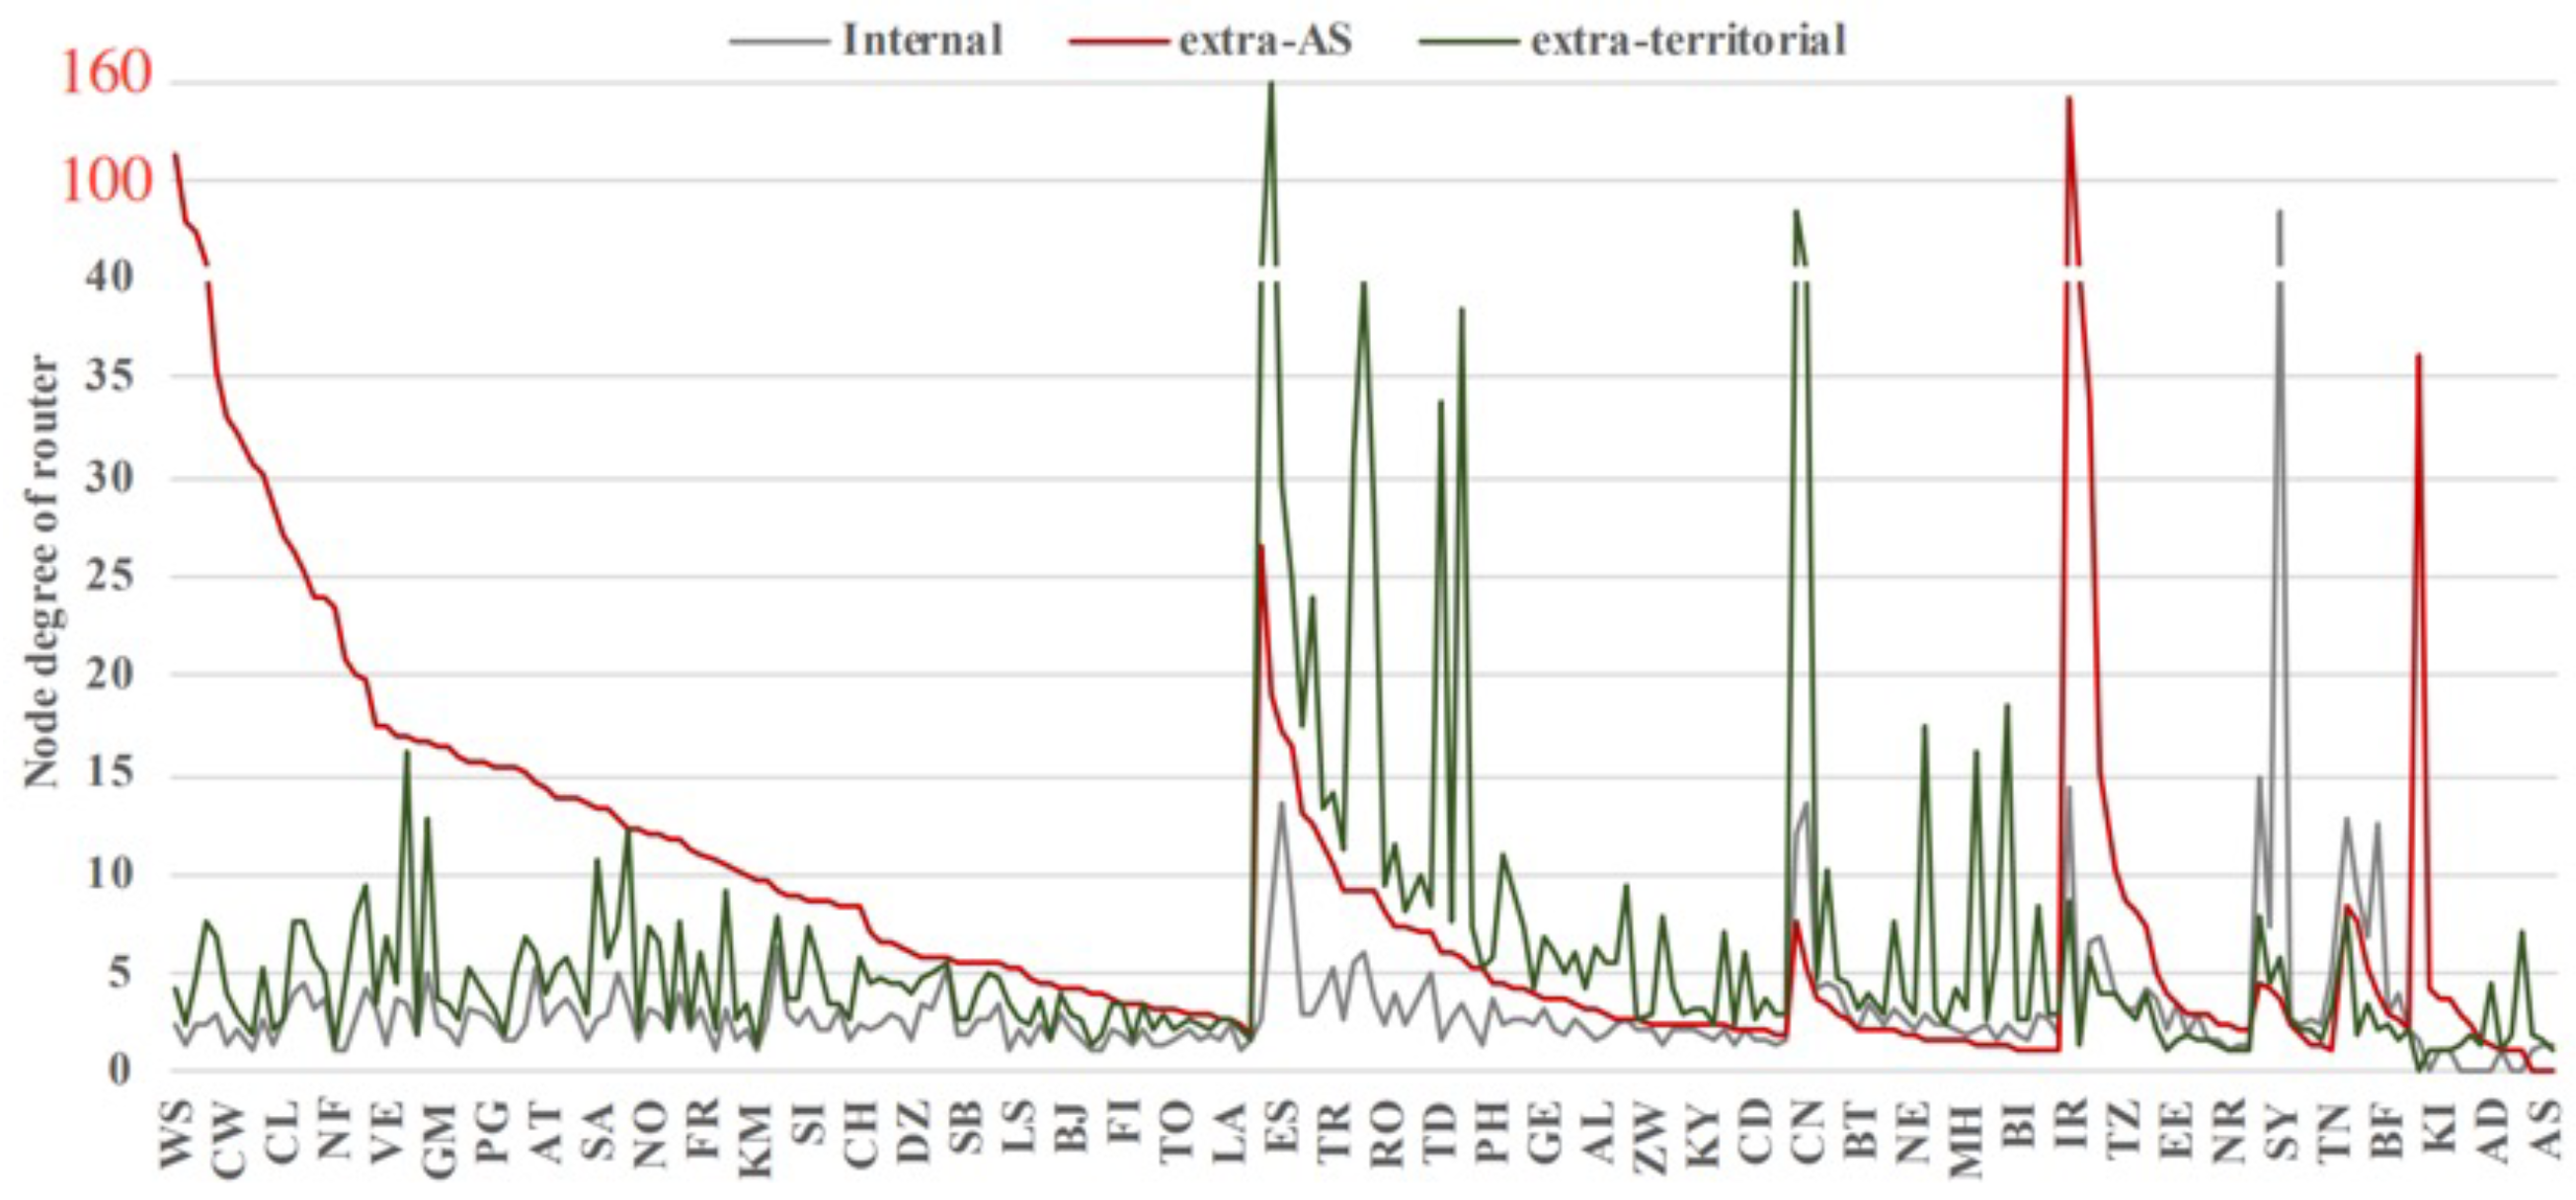
4.4.3. The Node Degree of Different Types of Router
The analysis of the node degree of different types of routers across countries is illustrated in
Figure 10. Countries are categorized based on the node degree of various router types and sorted in descending order by the node degree of extra-AS routers within each category. This sorting method allows for a nuanced comparison across countries, with the horizontal axis showcasing one country for every five.
An outlier in the dataset is the Cook Islands, which, despite having only 13 routers, records an internal router node degree of 446 an extreme value that is excluded from the figure for clarity. Notably, four countries exhibit a node degree greater than 100: Iran and Samoa, with AS external router node degrees of 148 and 116, respectively, and Korea, with an external router node degree of 159. The average node degrees for internal, extra-AS, and extra-territorial routers across all countries stand at 3.2, 9.0, and 6.4, respectively. This categorization reveals that, in the majority of countries, internal routers typically have a smaller node degree compared to external routers, indicating a higher level of connectivity for routers involved in cross-network interactions.
In 104 countries, such as the United States, Sweden, the United Kingdom, Japan, Singapore, and France, the node degree of extra-AS routers surpasses that of extra-territorial routers, suggesting a stronger AS network influence. Conversely, 52 countries, including South Korea, Italy, India, Vietnam, Germany, and Russia, display the opposite trend, with extra-territorial routers exhibiting higher node degrees. Interestingly, 26 countries have internal routers with node degrees larger than those of extra-territorial routers but smaller than those of extra-AS routers. This pattern is observed in nations like China, Mexico, Pakistan, Kazakhstan, and Belarus. In contrast, 18 countries, including Iran, Brazil, and Canada, show the reverse relationship. Furthermore, 17 countries, such as South Africa, Mauritius, and Ecuador, demonstrate internal routers with larger node degrees than both extra-territorial and extra-AS routers. Additionally, 14 countries report zero node degrees for either internal or extra-territorial routers, indicating the absence of connectivity within or across certain network boundaries.
The analysis of the node degree for each country’s AS and territorial network borders, as depicted in
Figure 11, offers a comprehensive view of the connectivity levels at the geographical boundaries of AS networks. This figure is organized in descending order by the node degree of border routers, with an emphasis on showcasing one country for every five along the horizontal axis for clarity and conciseness.
In the dataset, Syria stands out with only 34 routers, yet it exhibits an exceptionally high node degree of 891 for its border router, an outlier that is consequently omitted from the figure to maintain clarity. Notably, three countries exhibit a node degree of border router exceeding 100: Madagascar’s border router has a node degree of 135.4, with its AS border router reaching 162.5; Sierra Leone’s border router achieves a node degree of 100.2; and Iran’s territorial border router stands at 167.5. Conversely, 23 countries have a node degree of zero for their border routers, indicating a lack of connectivity at their geographical boundaries. On average, the node degree for each country’s border routers across AS and territorial networks is 8.1, with AS network border routers averaging at 8.6 and territorial network border routers at 10.0. These averages underscore the varying degrees of connectivity at the geographical boundaries of different networks.
5. Changes in the Internet in Different Periods
The dynamic nature of the internet, influenced by technological shifts and economic development, prompts significant changes in network configurations over time. Utilizing router-level topology data from CAIDA across four distinct periods, this section delves into the evolving relationship between autonomous system (AS) networks and territorial networks. Our analysis, grounded in a continental perspective, explores the nuances of this relationship for countries within various geographical regions. Changes in the relationship between each country AS and territorial networks on each continent are analyzed in terms of four indicators, including network and border consistency, the impact of the AS network on the internet and the node degree of border routers over four periods.
5.1. Network Consistency
The analysis of deployment consistency between AS and territorial networks across continents provides insight into the alignment of network infrastructures within countries.
Figure 12 organizes countries in descending order based on their deployment consistency in August 2020, highlighting regional variations and temporal changes. An intriguing observation from the data is the distinct deviation in March 2018 compared to other periods, which might be attributed to either the original detection data’s variance or significant network transformations in some countries post-2018. During this period, a majority of countries exhibit their highest deployment consistency, indicating a closer alignment between their AS and territorial networks. Over time, Asia, Africa, and Europe experienced a slight decline in deployment consistency, while South America showed an increase. Conversely, Oceania and North America record their lowest deployment consistency in August 2020.
In terms of regional comparison, most Asian countries demonstrate a deployment consistency higher than 0.9, a benchmark achieved by only a few European countries. In contrast, high deployment consistency exceeding 0.9 is less common among countries in South America, Africa, Oceania, and North America. By August 2020, Asia leads in deployment consistency, followed by Europe, South America, Africa, Oceania, and North America in descending order. Notably, Kuwait’s data in August 2020 markedly diverge from its performance in other periods within Asia, likely due to anomalies arising from a limited dataset obtained during the same timeframe. Similar reasons account for data irregularities observed in Senegal (Africa) and the Cook Islands (Oceania), emphasizing the impact of dataset size and quality on the interpretation of network deployment consistency.
5.2. Border Consistency
The analysis of border connection consistency between AS and territorial networks across continents highlights the dynamics of network infrastructure interconnectivity within countries.
Figure 13 presents these data for August 2020, sorted in descending order of connection consistency, providing insights into regional trends and temporal shifts. A notable observation from the dataset is the significant deviation in March 2018 compared to other periods. This discrepancy is largely attributed to countries with substantial differences exhibiting fewer links in the raw data, suggesting a potential data bias for smaller networks. Over the analyzed periods, most countries in Asia, Africa, and North America record their highest connection consistency in March 2018, with a decline observed in April 2019. Conversely, South America shows a reverse trend, while Europe exhibits a gradual decrease over time, and Oceania does not follow a clear pattern.
When comparing connection consistency across regions, Asia and Africa display similar distributions, with Asia consistently outperforming Africa. South America shows more variability over time. In contrast, Europe and Oceania present lower maximum values, and only two countries in North America exceed a connection consistency of 0.45. As of August 2020, Asia leads in connection consistency, followed by South America, Africa, Europe, Oceania, and North America, in that order. The fluctuation in border connection consistency across different periods indicates that while router deployments within countries may remain relatively stable, the connections at borders are subject to change. This variability is primarily attributed to data bias in countries with fewer detected links and actual shifts in network connections in countries with more extensive link datasets.
5.3. The Impact Score
The impact of each country’s AS network across continents reveals significant insights into their roles within the global internet architecture.
Figure 14 showcases these impact scores for August 2020, arranged in descending order, to highlight regional trends and temporal dynamics. Over the observed periods, most Asian and African countries record their highest impact scores in March 2018, with a noticeable dip in April 2019, followed by a gradual increase. Conversely, Oceania’s impact scores decrease over time. Europe and South America, which see their lowest scores in March 2018, experience an increase thereafter, with minimal fluctuations in subsequent periods. North America presents a stark contrast between March 2018 and later periods, with only a few countries achieving high impact scores.
Europe stands out with the highest average impact score, with half of its countries exceeding a score of 1, although a few countries score lower. Asia’s impact scores are more evenly distributed, averaging around 1, indicating a balanced contribution across its nations. North and South America exhibit significant disparities; while a few countries like the United States and Brazil achieve the highest scores, the majority have considerably lower scores. In Africa and Oceania, the differences between countries are less pronounced, with most nations scoring below 1. Notably, the variations in AS network impact across most countries are relatively minor. However, African countries’ impact scores in 2018 significantly diverge from those in other periods. This discrepancy could be attributed to the limited topological data available for African nations, which makes their impact scores more susceptible to fluctuations due to data changes.
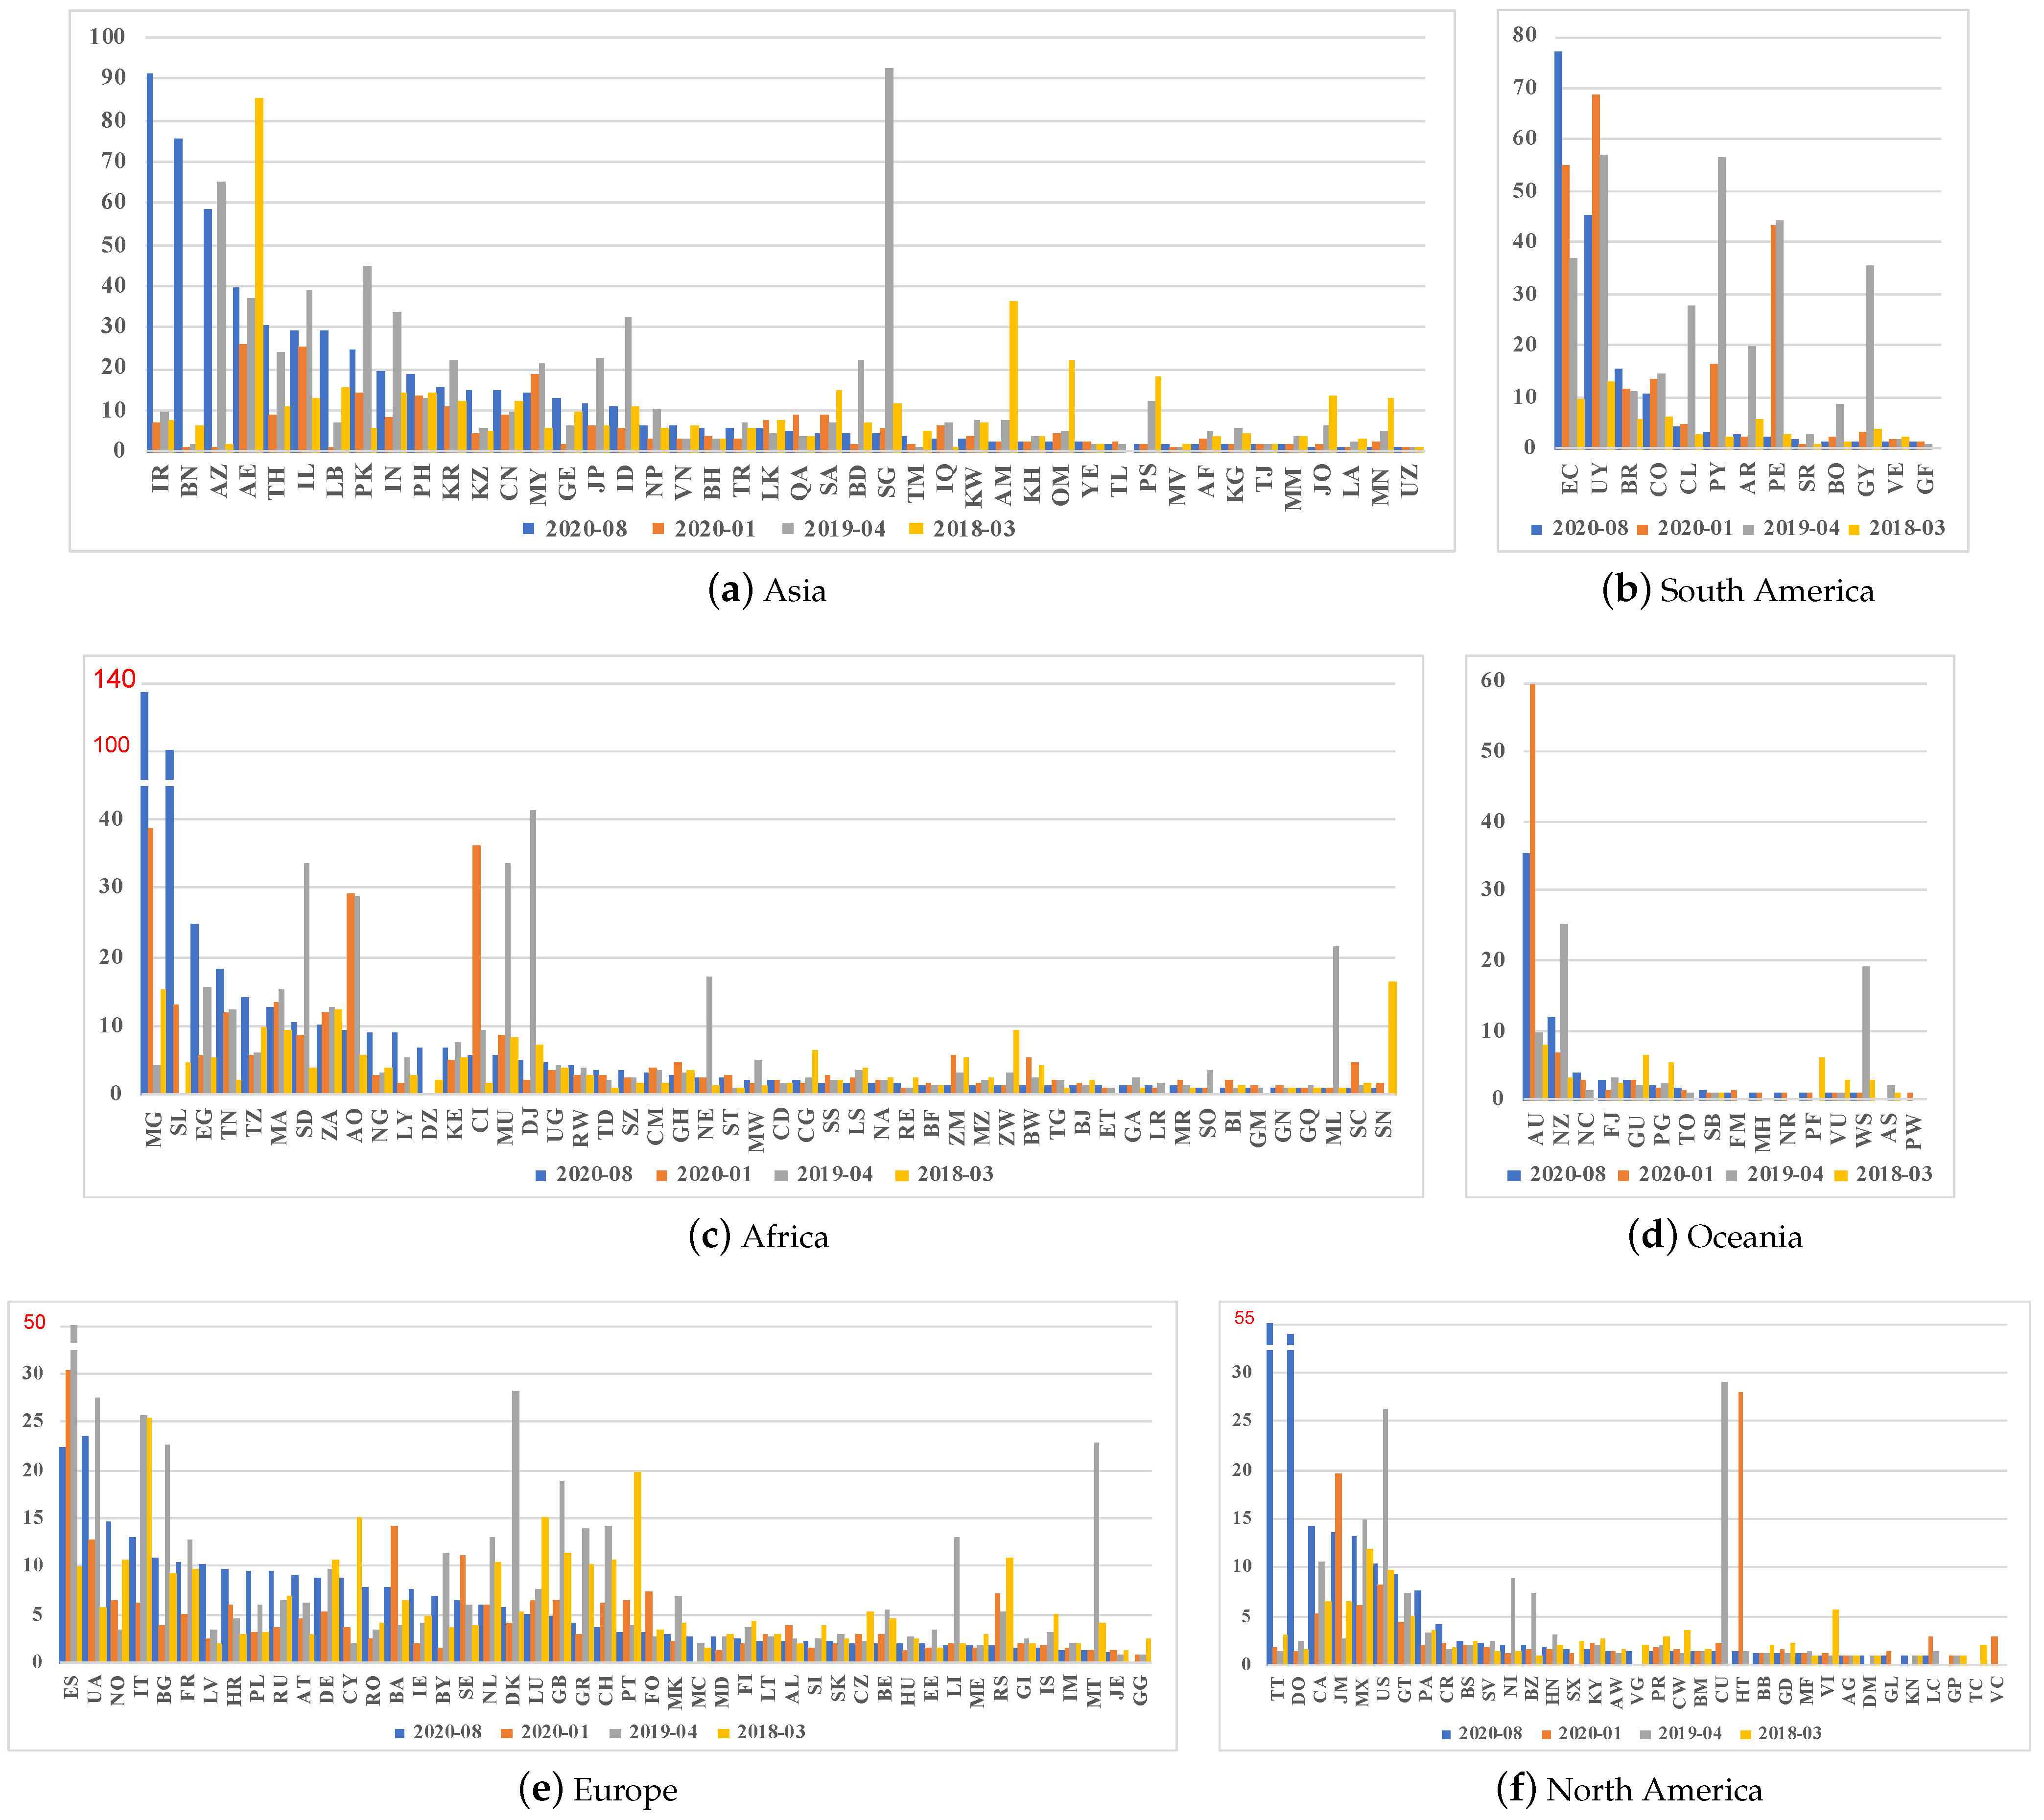
5.4. The Node Degree
The node degree of border routers across countries and continents, as detailed in
Figure 15, offers insights into the connectivity at geographical boundaries. Sorted in descending order by node degree for August 2020, this analysis illuminates the varying levels of network interconnectivity across regions.
Asia demonstrates high node degrees, with half of the countries exceeding a node degree of five. This indicates robust interconnectivity at the borders within many Asian countries. Africa shows less variation between periods compared to other continents, with several countries consistently achieving a node degree above five. North America presents a mixed picture, where a select few countries exhibit higher node degrees at specific times, but most remain below five. In Europe, about half of the countries exhibit node degrees larger than five, albeit with less extreme values than observed in Asia and Africa. In Oceania, Australia and New Zealand stand out with higher node degrees, while other countries generally fall below five. South America experiences significant fluctuations across different periods, indicating variable connectivity at the borders.
The analysis indicates generally minor changes in node degrees across most countries, with notable exceptions where extremely high values are observed due to potential data discovery or annotation errors. Specific examples include high node degree anomalies in Singapore, the United Arab Emirates (Asia), Australia (Oceania), Uruguay (South America), Spain, and Denmark (Europe), likely stemming from topological data discovery or annotation inaccuracies. Conversely, countries such as Iran, Brunei, Azerbaijan (Asia), Trinidad and Tobago, the Dominican Republic, Cuba, Haiti (North America), Malta (Europe), the Independent State of Samoa (Oceania), and several African nations exhibit less dramatic node degree mutations, possibly due to limited topological data.
The node degree of border routers serves as a crucial indicator of a country’s network connectivity with its neighbors and the broader internet. Higher node degrees suggest more robust external connections, essential for international communication and data exchange. The observed variations and anomalies underscore the importance of accurate data collection and interpretation in understanding global network infrastructure. This analysis not only highlights the disparities in network connectivity across continents but also reflects the dynamic nature of global internet architecture, influenced by both technological advancements and data collection methodologies.
5.5. Key Findings
In the analysis of global internet architecture across different continents, several key findings emerge regarding the deployment and border connection consistency, impact scores, and node degrees of routers:
Asia stands out with the highest levels of deployment and border connection consistency, showcasing a balanced impact score across the board. Additionally, Asian countries possess the highest node degrees, indicating robust connectivity and network complexity. This combination of factors positions Asia at the forefront in terms of network organization and global internet influence.
Africa mirrors some of Asia’s trends, albeit with generally lower values across all indicators. Notably, African countries experience a decrease in deployment consistency over time, while border connection consistency and impact scores see an uptrend from April 2019 onwards. This suggests a dynamic shift towards stronger international connectivity and influence despite the challenges in maintaining intra-continental network consistency.
Europe is distinguished by having the highest impact scores among all continents, reflecting its significant role in the global internet ecosystem. However, European countries exhibit smaller node degrees compared to their counterparts in Asia and Africa, suggesting less dense network interconnectivity. Despite the high deployment consistency, Europe faces challenges with lower border connection consistency, both of which slightly decline over time, indicating evolving network dynamics.
North America, with exceptions like the United States, shows lower values across the analyzed indicators and demonstrates less variation over time. This suggests a more stable but less interconnected and influential network structure relative to other regions, highlighting a need for increased focus on enhancing connectivity and global impact.
South America and Oceania, with notable exceptions such as Brazil and Australia, present lower values on all fronts but with more variability over time.
6. Limitations
Our study’s conclusions are based on the analysis of publicly available data. However, any errors in the analysis process could lead to incorrect results. To enhance the reliability of our research, we use widely recognized CAIDA network topology data to ensure the robustness of our experimental setup. Nonetheless, relying on this dataset introduces certain limitations:
- (1)
Coverage of Data: Limitations in Dataset Coverage: The completeness of network topology measurement data is inherently limited [
16,
17,
18,
19]. While our analysis covers 228 countries/regions, the data show that 80 countries/regions have fewer than 100 routers, and 52 countries/regions have fewer than 100 links. This incomplete coverage suggests that the dataset may not fully capture the complexity of global internet connectivity.
- (2)
Accuracy of Data: The accuracy of router geolocation and AS data is crucial for analyzing AS and territorial networks at the country level, yet this accuracy has not been fully validated [
20,
21,
22,
23,
24,
25]. Any potential inaccuracies in these data could lead to misinterpretations of the analysis results, affecting the reliability of quantitative metrics such as network consistency, border connectivity, and node degree. This, in turn, could impact our understanding of the true nature of global internet architecture.
- (3)
Subjectivity of Quantitative Indicators: The proposed method for quantifying the relationship between a country’s AS network and territorial network is based on prior knowledge and introduces four indicators from the perspectives of network scale and border connectivity. Due to the current lack of standardized metrics and guidelines, these quantitative indicators exhibit a degree of subjectivity. This method only considers the number of routers and links, neglecting the differences in significance among various types of routers and connections within the network. For example, it does not distinguish between backbone routers and edge routers, nor does it account for variations in load, capacity, bandwidth, and latency for each connection.
This paper is dedicated to ensuring the transparency and reproducibility of the experimental process by quantifying the relationship between a country’s AS network and territorial network strictly from a structural perspective, allowing other researchers to verify and replicate the results. In future work, we hope that these quantitative indicators can be validated and optimized through further experiments or more precise data, incorporating weights for routers and links.
7. Related Work
In the context of continuous advancements in network topology measurement techniques, the academic community has made significant progress in studying the global internet structure. In terms of global network topology analysis, Li et al. utilized large-scale measurement datasets from iPlane and CAIDA to conduct an in-depth analysis of network topologies across different continents, revealing the high concentration of intercontinental connection points in a few countries [
26]. Tilch et al. integrated data from multiple large-scale measurement activities and employed various graph-theoretic measurement methods to create a comprehensive snapshot of the global internet topology [
27]. Jiao et al., based on datasets spanning from September 1999 to March 2018, validated the effectiveness of their proposed internet structure model, capturing the scale-independent structural characteristics of the internet [
28]. Vermeulen et al. further analyzed changes between topology snapshots, pointing out that many so-called routing changes were actually due to load balancer remapping events rather than actual routing or policy changes [
29]. In this paper, like the aforementioned works, we utilize publicly available datasets to analyze the global network. However, this paper differentiates itself by proposing a series of metrics to quantitatively evaluate changes in router-level network topology, thereby enhancing the comparability of the results.
In analyzing network topology changes at the country level, Karlin et al. developed a framework for country-level routing analysis, evaluating the importance of countries in internet accessibility by predicting interdomain paths between any two IP addresses and quantifying each country’s impact on international traffic flow [
30]. Roberts et al. studied the internet structures built by national governments within their borders, identifying a few autonomous systems acting as control points for each country’s network. They measured the complexity of each national autonomous system network, revealing significant differences in autonomous system networks across different countries and regions [
31]. Leyba et al. quantified how the topology changes across national borders and developed the BGP-SAS tool to simulate BGP routing and compute national choke point metrics. This has provided new tools for assessing national AS topologies and their impact on transnational BGP paths [
32]. Witono estimated the geographical location of autonomous systems by analyzing the geolocation information of IP prefixes, exploring connectivity and distribution in the study of internet autonomous system layer topologies [
21]. Ivanovic et al. proposed a method using quantitative network metrics to assess censorship resilience and global internet reachability, applicable to current BGP/IP networks and alternative internet architectures [
33]. The aforementioned studies analyzed network changes by evaluating AS network changes and introduced country-level analysis but did not detail the distribution of operator networks in other countries. In contrast, this paper focuses on the geographical distribution of operator networks globally, specifically investigating how the internal and foreign networks of operators impact inter-country network connectivity and influence.
8. Conclusions
This study develops a new method to explore the relationship between autonomous systems and territorial networks, aiming to analyze the differences in global network resource allocation. The research abstracts the dual information of network topology mapping into a matrix-form mathematical model. From multiple perspectives and using various indicators, it quantitatively evaluates the changes in the network structures of countries worldwide over different periods. Firstly, from the perspective of network scale analysis, we quantify the deployment consistency and impact of AS networks in the global internet to identify network deployment patterns. Then, from the perspective of border connectivity analysis, we quantify the connection consistency and the node degree of border routers to evaluate border connectivity. Finally, using these metrics, we analyze the changes in the relationship between AS and territorial networks across different continents over various time periods.
Our study posits that high deployment consistency and impact scores near the baseline reflect strong border connection consistency and clear geographical boundaries of AS networks. This indicates a high degree of integration between a country’s AS network and its territorial network. When two or more metrics exceed the average level or approach the baseline, it suggests a close relationship between the AS and territorial networks of that country. The results show that Asian countries have the closest relationship between AS and territorial networks, followed by African countries. In contrast, Europe shows a lower degree of interconnectivity, with a more fragile relationship between AS and territorial networks. The coordination and connectivity levels in North America, South America, and Oceania vary significantly, reflecting different strategies in digital infrastructure management and network architecture in these regions.
Through this study, we aim to provide new perspectives and methods for understanding the differences in global network resource allocation, evaluating network deployment, and assessing border connectivity. These insights can serve as valuable references for policy-making and network management.


