Abstract
The complexity of cancer development involves intricate interactions among multiple biomarkers, such as gene-environment interactions. Utilizing microarray gene expression profile data for cancer classification is anticipated to be effective, thus drawing considerable interest in the fields of bioinformatics and computational biology. Due to the characteristics of genomic data, problems of high-dimensional interactions and noise interference do exist during the analysis process. When building cancer diagnosis models, we often face the dilemma of model adaptation errors due to an imbalance of data types. To mitigate the issues, we apply the SMOTE-Tomek procedure to rectify the imbalance problem. Following this, we utilize the overlapping group screening method alongside a binary logistic regression model to integrate gene pathway information, facilitating the identification of significant biomarkers associated with clinically imbalanced cancer or normal outcomes. Simulation studies across different imbalanced rates and gene structures validate our proposed method’s effectiveness, surpassing common machine learning techniques in terms of classification prediction accuracy. We also demonstrate that prediction performance improves with SMOTE-Tomek treatment compared to no imbalance treatment and SMOTE treatment across various imbalance rates. In the real-world application, we integrate clinical and gene expression data with prior pathway information. We employ SMOTE-Tomek and our proposed methods to identify critical biomarkers and gene-environment interactions linked to the imbalanced binary outcomes (cancer or normal) in patients from the Cancer Genome Atlas datasets of lung adenocarcinoma and breast invasive carcinoma. Our proposed method consistently achieves satisfactory classification accuracy. Additionally, we have identified biomarkers indicative of gene-environment interactions relevant to cancer and have provided corresponding estimates of odds ratios. Moreover, in high-dimensional imbalanced data, for achieving good prediction results, we recommend considering the order of balancing processing and feature screening.
Keywords:
binary logistic regression; cancer diagnostic; gene-environment interaction; joint modeling; overlapping group screening; SMOTE-Tomek; TCGA MSC:
62P10; 92-08; 92-10; 92-11
1. Introduction
Precision medicine is a global medical development trend, also known as “personalized medicine”. It is an innovative method of disease prevention and treatment that takes into account differences in human genetics, environment, and lifestyle. Accurate cancer diagnosis enables the administration of suitable drug treatments, significantly enhancing patients’ chances of survival. Therefore, cancer diagnosis is a very important research topic today. The development of diseases is widely recognized as a complex process often stemming from the association of various biomarkers, such as gene-environment (G-E) interactions. In the realm of biomedical and epidemiological studies, G-E interactions hold significant implications for the etiology and progression of numerous complex diseases, including cancer and diabetes [1]. Franks and Paré [2] noted that identifying G-E interactions can give guidance for health-related choices and medical interventions in complex diseases. Furthermore, Batchelor et al. [3] showed an interaction between the TP53 gene and age on prognosis in glioblastoma; Lin et al. [4] examined the interaction of the ADAMTS7P1 gene and alcohol consumption on diastolic blood pressure.
Furthermore, the classification of cancer using microarray gene expression profiling data and clinical environmental factors has garnered significant attention in computational biology and medicine [5]. Numerous statistical and machine learning methods have been thoroughly investigated for cancer classification [6,7,8], including multiple logistic regression models (MLRs), support vector machines (SVMs), K-Nearest Neighbors (KNNs), linear discriminant analysis (LDA), random forests (RFs), and others. These advanced methods can be readily and user-friendly implemented via the R package version 4.4.3. However, Tian et al. [9] pointed out that machine learning models are challenging to interpret and do not offer direct estimates of outcome probabilities. Considering the potential shortcomings mentioned above, MLR models can be endowed with explanatory and probabilistic properties.
Two established methodologies (marginal and joint models) have been used to identify crucial G-E interaction biomarkers in high-dimensional genomic data [10]. Marginal methods focus on analyzing one gene at a time, while joint analysis considers all genes within a single model. Because marginal models are low-dimensional, the main advantages are rooted in computational stability and conceptual simplicity. Consequently, marginal procedures remain widely favored in bioinformatics and biomedicine to date. Even today, a common drawback of traditional marginal methods is their lack of robustness, often attributed to the contamination of response outcomes and predictive biomarkers. Some research endeavors have been undertaken to identify G-E interactions associated with patient disease status using marginal models [11,12].
On the other hand, models within a conjoint analysis framework offer improved capability in describing disease biology, as complex diseases are typically influenced by the combined effects of multiple genetic biomarkers [13]. The conceptual conjoint model is “Outcome~Es + Gs + (Gs) × (Es)”, where outcome response can be quantitative, qualitative or survival trait status; Es denotes a collection of environmental factors, encompassing environmental exposures, demographic, socioeconomic, and clinical variables; Gs represents a set of gene expressions and (Gs) × (Es) signifies the interactions among all G and E factors. Some research endeavors have been undertaken to identify G-E interactions associated with patient disease status using joint models [14,15]. In this article, our attention is directed towards the conjoint analysis framework. A prevalent challenge encountered in conjoint analysis is its high dimensionality, which poses difficulties in identifying significant interaction effects. Furthermore, feature contamination and class imbalance make cancer diagnosis more challenging.
In high-dimensional statistical learning, the regularized regression method is recommended [16]. The main potential drawback is that the model size often exceeds the sample size by a considerable margin, which can lead to suboptimal statistical power within the penalized regression framework [17]. In this context, it is widely recognized that preliminary feature screening can substantially enhance the model selection process carried out by regularization methods. Additionally, Wang and Chen [18] proposed an overlapping group screening (OGS) method for identifying active G-G interactions by incorporating natural pathway information and further building a survival prediction model, which can also be extended to G-E interaction selection [19]. The OGS method was devised to address the complexities encountered in the analysis of genome-wide data, where the number of features exceeds the sample size and pathways frequently overlap with each other. The OGS method can be viewed as a preliminary feature screening procedure. The same idea of the OGS approach has been applied to balanced clinical cancer/normal outcomes through a binary logistic regression model to identify active G-G interactions [20].
Typically, classification methods encounter difficulties when one class dominates the dataset, indicating that the number of instances belonging to a specific class outweighs the others. The datasets in these cases are called imbalanced datasets, which can mislead classification accuracy since classification models trained on imbalanced data can increase overfitting and bias problems as the prediction accuracy is very good in the majority classes but is very poor in the minority classes. Imbalanced data is common in real-data applications. For instance, in our own The Cancer Genome Atlas (TCGA) dataset for lung adenocarcinoma (LUAD), we have two categories: 505 samples of cancerous tissue and 58 samples of normal tissue, with 58 patients contributing both normal and cancerous tissue samples. Obviously, cancer tissue and normal tissue samples are the majority class and minority class, respectively, and the imbalanced ratio (IR) of the LUAD data is IR = 8.71. A larger IR value indicates an imbalance.
Several strategies have been proposed to overcome the imbalanced problem and further establish cancer diagnosis models [21,22] and so on. Here, we utilize resampling methods and suitable evaluation metrics to address this imbalance. The purpose of using resampling is to balance the number of each class. Many resampling methods have been proposed, which can generally be divided into two categories: over-sampling and under-sampling. Over-sampling algorithms oversample the minority class by creating a set of synthetic samples; under-sampling algorithms under-sample the majority class to create possibly balanced samples. The advantage of the over-sampling method is that it does not miss any information, but the disadvantage is that duplication of data in a few categories may lead to overfitting problems in the built model. If there is noise (erroneous or inaccurate data) in the training data, it can cause the model to overfit. This happens because the model attempts to capture and learn from all variations in the data, including non-representative or erroneous instances of noisy data, thus affecting the model’s predictive power and performance. Moreover, the ideal situation for under-sampling is that the amount of data in the minority category is not too small; otherwise, a lot of data in the majority category will be lost after the under-sampling procedure. To this end, we adopt a hybrid approach developed by integrating the synthetic minority oversampling technique (SMOTE) [23] and the Tomek link under-sampling approach [24], namely SMOTE-Tomek [25]. This approach provides a compelling solution to mitigate the shortcomings associated with SMOTE and Tomek link technologies.
In cancer diagnosis literature [7,8], real-world data often suffer from imbalance issues. Hence, research typically begins by addressing these imbalances, followed by the construction of diagnostic models using machine learning methods. Our study aligns with this approach, but our unique contribution lies in integrating gene-environment interactions into the model. This integration increases model complexity and introduces challenges such as variable collinearity and potential contamination. To overcome these, we utilize the OGS method to integrate gene pathway information, thereby improving the accuracy of our cancer diagnostic model. Furthermore, we primarily adopt the MLR models, which can provide both explanatory and probabilistic properties.
In this study, we initially utilize the SMOTE-Tomek procedure to rectify the imbalance, followed by employing the OGS method on a binary logistic regression model to detect significant biomarkers associated with clinical cancer or normal outcomes. Simulation studies across various imbalanced rates and gene structures demonstrate that our proposed method performs effectively, surpassing common machine learning methods in terms of classification prediction accuracy. In the real data application, all cancer and normal tissue samples were used for modeling, but we removed some cancer samples where normal tissue samples were collected because they had the same clinical environmental factors. Subsequently, we integrated clinical and gene expression profiling data with prior pathway information and utilized the SMOTE-Tomek and OGS approaches to select several essential biomarkers as well as G-E interactions that are associated with the clinically imbalanced binary cancer/normal outcome of patients with TCGA lung adenocarcinoma (LUAD) and breast invasive carcinoma (BRCA) data and the construction of microarray-based cancer diagnostic models. In real-world data applications, we also identified cancer-related gene-environment interaction biomarkers and reported the corresponding estimates of odds ratios.
2. Materials and Methods
2.1. Data Structure and the Multiple Pathways
We consider a study with n subjects and assume each subject i has q environment factors , p genes assigned to G potentially overlapping pathways; that is, a given gene may be shared with more than one pathway. Pathway information illustrates the inherent hierarchy of genes, where overlapping pathways are frequently observed in gene expression data. Our objective is to pinpoint critical biomarkers and their interactions linked to imbalanced clinical binary outcomes for cancer and normal status while considering pathway information. The pathway information is accessible in the Human Molecular Signature Database, which can be obtained from the website http://www.broadinstitute.org/gsea/msigdb (accessed on 1 September 2023).
The TCGA clinical and gene expression data are available for download from the R packages “TCGAbiolinks” [26] or “UCSCXenaTools” [27]. For instance, our TCGA LUAD genomic dataset comprises two categories: 505 samples of cancerous tissue and 58 samples of normal tissue, with 58 patients contributing both normal and cancerous tissue samples. All cancer and normal tissue samples were used for modeling, but we removed some cancer samples where normal tissue samples were collected because they had the same clinical environmental factors. Therefore, we conducted an analysis focusing on a specific subset comprising 447 cancerous and 58 normal tissue samples, denoted as 1 and 0, respectively.
2.2. Evaluation Criteria for Binary Classification
Various criteria are employed to assess the performance of binary classification models. When the data is imbalanced, a simple measure of “Accuracy” is not enough and can produce misleading measures, so we also consider “Recall”, “Specificity”, “Precision”, “F1” as the following equations evaluate the performance of binary classification. Initially, we define four terms using the confusion matrix: the number of true positives (TP), the number of false positives (FP), the number of true negatives (TN), and the number of false negatives (FN). In Table 1, these four terms can be represented by a 2 × 2 confusion matrix as follows:

Table 1.
Confusion matrix for binary classification.
Then,
Accuracy = (TP + TN)/(TP + TN + FP + FN);
Recall = Sensitivity = TP/(TP + FN);
Specificity = TN/(TN + FP);
Precision = TP/(TP + FP);
F1 = 2 × (Precision × Recall)/(Precision + Recall).
Greater values for these measures signify higher predictive accuracy.
2.3. SMOTE-Tomek Procedure for Imbalanced Data
SMOTE [23] is one of the over-sampling methods, and its working principle is to apply sampling methods to increase the number of minority categories through random data replication such that the amount of minority data is equal to the amount of majority data. The SMOTE algorithm is as follows: For each randomly selected sample in the minority class, use the KNN method to find the K minority class samples closest to the sample , and randomly select a sample among these K samples. Generally, the new synthetic sample can be expressed as follows:
where is a random number between 0 and 1. Repeat the above procedures until the number of samples in the minority class matches that of the majority class, achieving balance.
Tomek Links [24] is different from traditional under-sampling methods, which remove most of the data to achieve balance. Tomek Links steps are as follows: Assume that and belong to different categories, and represents the distance between the two samples and . The distance calculation uses the Euclidean distance and incorporates all environmental and gene variables. When there is no third sample between and , such that or , then is a Tomek Link. When two samples are Tomek Links, one of the samples is noisy or both samples are near the boundary. By identifying Tomek Link, the majority of class samples will be deleted, while the minority class samples will be retained, so that the nearest neighbor samples are all of the same class and then perform better classification.
The SMOTE-Tomek method [25] is a hybrid sampling method of SMOTE and Tomek Links. It improves the original SMOTE because the new samples are likely to overlap each other, affecting the classification results and making it difficult to judge and define the boundaries between samples, resulting in overfitting. The Tomek link is used as post-processing for SMOTE to clean up the noise after SMOTE generates new synthetic samples. Therefore, SMOTE-Tomek combines the ability of SMOTE to generate minority class data with the ability of Tomek Links to delete both the original samples that might have been noise and the newly generated samples that may be noise to avoid the problems of overfitting and the boundary of the minority class extending to the majority class. The combination of SMOTE and Tomek link has more accurate performance than using them alone.
The SMOTE-Tomek process follows these steps: randomly select data from the minority class, calculate the distance between the selected data and its K nearest neighbors, multiply the difference by a random number between 0 and 1, and add the result to the minority class as a synthetic sample. Repeat these steps until the desired proportion of the minority class is achieved. Next, randomly select data from the majority class. If the nearest neighbor of the selected data belongs to the minority class, remove the Tomek Links, i.e., delete the noisy sample. There are some articles ([28,29,30] and so on) about the application of SMOTE-Tomek, all of which illustrate that SMOTE-Tomek can effectively solve the problem of data imbalance and achieve high model performance. Figure 1 illustrates the SMOTE-Tomek process. Note that, in the original Tomek Links method, majority class points are discarded, as the minority class is deemed valuable and not to be discarded. However, in the SMOTE-Tomek method, because the minority class is artificially generated and the data has been balanced through SMOTE, all points identified as Tomek Links are discarded. In addition, in the SMOTE-Tomek procedure, the SMOTE procedure is the same as the original SMOTE procedure.
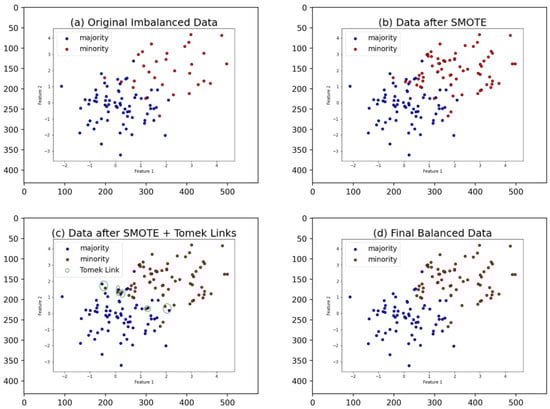
Figure 1.
The SMOTE-Tomek process. (a) In the original dataset, there are 30 samples for the minority class and 70 samples for the majority class, with some noise present. (b) SMOTE is applied to generate synthetic samples for the minority class, resulting in 70 samples for both classes. However, the vicinity of the original noise might generate additional noise. (c) Tomek links are identified. (d) Tomek links are removed, resulting in a dataset where each class has 65 samples. This process removes both the original noise and any additional noise generated during SMOTE.
Since the calculation method used by SMOTE to generate new samples is linear, see Equation (1). In real-life data, this may not be reasonable. Because linear interpolation can indeed affect the generation of data. For instance, in scenarios where a dataset is distributed such that there is a majority class surrounded by minority class instances, linear interpolation on the minority class may result in generated samples overlapping with the majority class. Lastly, linear interpolation can indeed be susceptible to noise. Since the original data may already contain some noise or outliers, generating new instances from these problematic values could introduce further noise and outliers. Therefore, after performing SMOTE, it is necessary to address noise by cleaning it up [31]. In this case, overfitting is inevitable. The cross-validation (CV) procedure can be used to reduce this risk. Finally, in our actual operation of the SMOTE-Tomek method, a 10-fold CV process is used to obtain the optimal tuning parameter K under the SMOTE-Tomek process. Now we introduce how to utilize the 10-fold CV method to find the optimal K value. Firstly, consider K values ranging from 1 to 7. With a fixed K value, divide the original training data into ten equal parts. Then, utilize nine parts to build a random forest prediction model, and use the remaining one part for prediction classification. Calculate the comprehensive prediction metric F1 score, repeating these steps ten times. Then, take the average of these ten F1 scores. This way, we obtain F1 prediction metrics for different K values. The maximum F1 score obtained indicates the most ideal K value. Finally, use the optimal K value for the SMOTE-Tomek procedure to generate a balanced dataset. Note that based on our initial observations of both simulated and actual data, we found that the K values between 3 and 5 yielded the best results. To simplify our computational approach, we have decided to set the maximum possible value of K to 7, and the SMOTE-Tomek procedure can be executed through the Python suite, including imblearn.over_sampling, imblearn.combine, sklearn.ensemble, and sklearn.model_selection.
2.4. The OGS Approach with Binary Logistic Regression for G-E Interactions
For a subject i, assume a cancer or normal outcome related to environmental factors , gene expression features , and their two-way interactions through the binary logistic regression model. In the binary logistic regression framework, the probability of a dichotomous phenotype by converting log-odds to probability is a linear combination of one or more considered features, that is,
where are corresponding effects of main and interaction biomarkers.
Since pathways overlap each other, we adopt the latent effect approach proposed by Jacob et al. [32] to take into account the overlapping grouping information by decomposing the original characteristic effect of the genes into sums of group-specific effects, that is, where is the latent coefficient vector for group . We give a simple example in Appendix A to illustrate the latent effects approach. The steps of the OGS method for G-E interaction selection under binary logistic regression models are described below.
Step 1: Our aim is to identify significant pathways by integrating grouping information into the modeling process using the latent effect approach. This can be achieved through the R package “grpregOverlap” [33]. We anticipate that candidate pathways will be identified in this step.
Step 2: Following the approach outlined by Wang, Wang, and Chen [19], we investigate G-E interaction pairs between genes from candidate pathways identified in the first step and environmental factors in Es, where Es represents a set of environmental factors. Subsequently, we employ the Sequence Kernel Association Test (SKAT), as proposed by Wu et al. [34], for dichotomous phenotypes to obtain group-specific significance. The SKAT statistic for a binary logistic regression model is defined as
Here, represents the vector of residuals estimated from the null model, obtained by regressing binary outcomes solely on the environmental factors Es, without incorporating the gene expression data; , where is the number of G-E interaction pairs in the candidate pathway group , is the -th G-E interaction pair of -th subject in the candidate pathway group , and is a diagonal weight matrix that contains the weights of the interaction pairs in the candidate pathway group . In accordance with Wu et al. [34], we adopt an unsupervised weight method aimed at enhancing testing power. This method is defined as follows:
where . In other words, the square root of the weight corresponds to a beta probability density function with specific parameters 1 and 25. This function is evaluated using the ratio of the sample variance of the i-th variable to the sample variance of all variables.
Derived from the null model, which involves regressing binary outcomes without any gene predictors, let , where is the estimated probability that the i-th subject is a case under the null model. Define where is the matrix equal to . Under the null hypothesis, the SKAT statistic conforms to a weighted sum of chi-square distributions
where , j = 1, …, l are the eigenvalues of , and ’s are independent 1-df central chi-square random variables. We employ the Davies method [35] to approximate the tail probabilities of the mixed chi-square distribution, which can be computed using the R package “CompQuadForm” [36]. The p-value serves as our group filtering metric, where smaller p-values indicate greater group importance and higher selection priority.
Step 3: As per [19], we randomly permute the original data to generate permuted data in accordance with the null model. Re-execute step 2 to get group screening measures and the desired threshold is obtained by taking the minimum of . To ensure a stable threshold, we iterate the permutation process multiple times and compute the median of the resulting desired thresholds. This median value is then utilized to establish a cutoff point for selecting the group of candidate pathways. A group of pathway interactions is deemed significant if the associated p-value falls below this cutoff point.
In the final step, utilizing the selected biomarkers identified in steps 1–3 and all considered environmental factors, we employ penalized logistic regression with Ridge/Lasso [16] and Adaptive Lasso [37] penalties to build the ultimate cancer diagnosis model. This regularization procedure can be implemented using the R package “glmnet” [38].
2.5. The Alternative Classification Methods
Since the OGS method can be considered a preliminary feature screening process aimed at effectively reducing data dimensionality by eliminating irrelevant and redundant predictor variables within the feature screening framework, thereby enhancing the model’s classification prediction capability, we selected biomarkers from steps 1–3 of the OGS and all considered environmental factors to develop the cancer prediction model for downstream machine learning (ML) analysis. Furthermore, we provide a brief introduction to ML methods, along with details on the relevant hyperparameters within these methods.
SVM is a supervised ML method that can be applied to both classification and regression analysis. During the algorithm’s process, SVM finds an optimal hyperplane to divide the data into different categories while maximizing the margin between categories. When applied to binary classification and implemented through the R package, the svm() function within the “e1071” package can be used. Several key parameters are set as follows: “Kernel” determines the kernel function used in the SVM algorithm, which can be chosen based on different types of data, such as linear, polynomial, or radial. In this study, radial is selected as the kernel function, which is a nonlinear function characterized by high flexibility, capable of fitting various types of data with higher generality, and suitable for handling complex classification problems; “gamma” is a tuning hyperparameter in the kernel function, where a larger “gamma” value leads to a more complex model. In this study, the tune() function of the “e1071” R package is used to perform CV to search for the optimal parameter, with a range of (0, , , , , 1).
RF is an ensemble learning method that can be applied to both classification and regression analysis. It consists of multiple decision tree algorithms, which are generated by randomly sampling from the training dataset to create multiple different training sets. Each tree undergoes node splitting, where each node only considers a subset of features belonging to its subset. This method of splitting the data and selecting features helps prevent overfitting and improves the generalization of the model. Each decision tree is trained independently and does not affect others. The final outcome of the random forest algorithm is obtained by averaging the results of multiple trees. For classification problems, random forest aggregates the predictions of each tree through voting, with the most voted class being the final prediction. When applied to binary classification and implemented through the R package, several key parameter settings are as follows: “ntree” parameter denotes the number of decision trees, with a default value of 500. Increasing the number of trees may enhance the model’s predictive performance but also increase computational costs; the “mtry” parameter represents the number of features considered for splitting each node in a decision tree, with a default value equal to the square root of the number of feature variables. A smaller “mtry” may increase model diversity but could potentially decrease accuracy. In this study, the range for “mtry” is set from 1 to 10, and the range for “ntree” is set from 1 to 500 as the search range. The randomForest() function of the “randomForest” R package is utilized to perform CV to search for the optimal parameters.
KNN is a supervised ML method that can be applied to both classification and regression analysis. It predicts the label of a new sample based on the labels of the K nearest samples in the feature space. The algorithm requires a predetermined value for K. By calculating the distances between samples in the training set, it identifies the K nearest samples and determines the predicted value of the new sample from these K neighbors. For example, in classification problems, the label of a test sample is predicted by a majority vote among its K nearest neighbors. In this study, the parameter K is varied from 1 to 20 as the search range. The kknn() function from the “kknn” R package is utilized to perform CV to search for the optimal parameter.
LDA is a supervised ML method whose primary goal is to find a linear combination of features that maximally preserves the differences between different classes while minimizing the differences within each class. In this study, the lad() function from the “MASS” R package is used to execute LDA. The model parameter “prior” represents the prior probabilities, which are the default probabilities assigned to each class when the model encounters new data. Prior probabilities can influence the training outcome of LDA. In this study, the prior probabilities for both classes are set to 0.5.
To summarize, we have added Table A1, which clearly describes the relevant hyperparameter settings for the machine learning methods used in this article.
3. Results
3.1. Simulation Studies: Synthetic Imbalanced Dataset with Complex Gene Structure
In the simulation study, we examine various scenarios across different imbalanced rates and genetic structures to compare the predictive performance of our proposed method with several existing machine learning approaches. A synthetic profile comprising a sample size of 300 serves as the training set, with each subject’s response generated based on a Bernoulli distribution with a probability,
with the covariates g following a lognormal distribution (0, c) where imbalance ratios of 60:40 and 70:30, the c values are 1 and 0.7, respectively. Note that if the gene data is more concentrated (i.e., smaller c), it causes the probabilities to become more extreme, approaching either 0 or 1. This results in the generated data becoming more imbalanced. The covariates jointly follow a multivariate standard normal distribution with correlation and the “.” symbol represents all subjects. Also being a two-way G-E interaction covariate. To assess the prediction accuracy of different methods, we generate test data consisting of a sample size of 100, which follows the same distribution as the training data but is independent of it. Within the logistic regression framework, we predict the label of each subject using the following equation:
The group size (number of genes per group) and overlapping structure (number of genes shared by two overlapping groups) considered in this simulation are outlined in Table 2 below. For instance, groups 10 and 11 comprise 15 and 15 genes, respectively. Among these two groups, there are 25 unique genes, with 5 genes being shared. In this example, there are a total of 500 genes and 632 potential group-specific gene effects. Figure 2 illustrates the corresponding gene network structure. Note that the gene network is created using the R packages “ggplot2”, “network”, “sna”, and “igraph”. We assume that groups 1, 7, 13, and 19 are valid, with genes in each of the four groups possessing constant potential effects of 3, 3, 2, and −2, respectively. In this simulation study, we incorporate five environmental variables. The first four are assumed to be associated with the binary outcome, with corresponding effects of 1.5, 2.25, 3, and −1.5. Additionally, valid G-E interactions (G22-E1, G24-E1, and G26-E2) have corresponding effects of (1.5, 1.5, 2), and (G78-E2, G83-E3, and G88-E3) have corresponding effects of (−1, −1.5, −2). These interactions belong to groups 7 and 13, respectively. Out of a total of 3005 such factors, 91 are valid environmental, genetic, or G-E interaction factors.
Table 2.
The gene group structure for the varying gene group-size data.
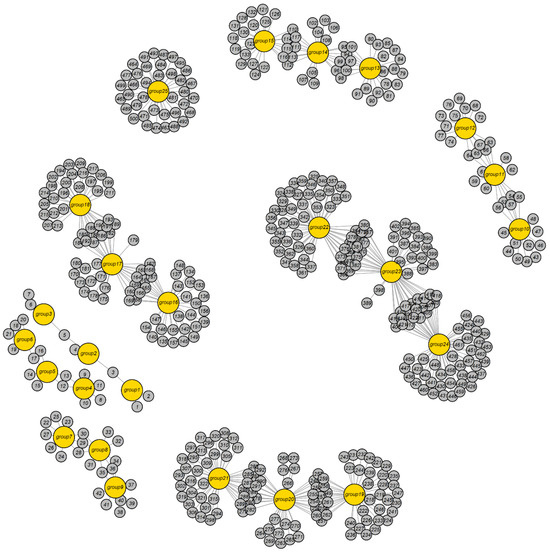
Figure 2.
The gene network structure for the varying group-size data.
Before executing each method, we first employ the SMOTE-Tomek process to deal with the situation of imbalanced training data and use a 10-fold CV procedure to obtain the optimal tuning parameter k under the SMOTE-Tomek process. In the machine learning framework, the predictors are preselected using our proposed OGS procedure. We conducted 300 repetitions of the simulation setup to obtain numerical results. The simulation results presented in Table 3 indicate that in class prediction, OGS combined with regularization methods (Ridge, Lasso, and Adaptive Lasso) outperforms most common machine learning methods except OGS_SVM across different imbalance rates.
Table 3.
The average classification performance (without considering imbalance processing) was measured across 300 simulated replicates of different methods, with various imbalance rates and varying gene group-size data.
Moreover, we investigate a more intricate gene structure and a higher 80:20 imbalance rate to compare the OGS method with regularization against various machine learning methods. In this simulation study, the gene network structure consists of 25 equal groups, each comprising 23 genes, except for group 25, which contains 26 genes. The group size and overlapping structure are depicted in Table 4. In this case, there are 536 genes and 578 potential group-specific gene effects. Figure 3 illustrates the corresponding gene network structure. We assume that groups 1, 7, 13, and 19 are valid, with genes in each of these groups having constant potential effects of 6.6, −5.8, 6.4, and −5.4, respectively. We also incorporate five environmental variables, with the first four assumed to be associated with the binary outcome. These variables have corresponding effects of 1.5, 2.25, 3, and −1.5. It is noteworthy that three groups (1, 2, 25) share three genes (21, 22, 23), instead of only two groups as in simulation study 1, to increase complexity. Additionally, valid G-E interactions (G130-E1, G135-E1, G140-E2) have the corresponding effect (1.5, 1.5, 2), and (G255-E2, G260-E3, G265-E3) have the corresponding effect (−1, −1.5, −2). These interactions belong to groups 7 and 13, respectively. Of a total of 3221 such factors, 102 are valid environmental, genetic, or G-E interaction factors. According to the numeric results shown in Table 5, we see that the class prediction performance of the OGS with regularizations (Ridge, Lasso, and Adaptive Lasso) is better than that of most machine learning methods except OGS_SVM.
Table 4.
The gene group structure for the equal gene group-size data.
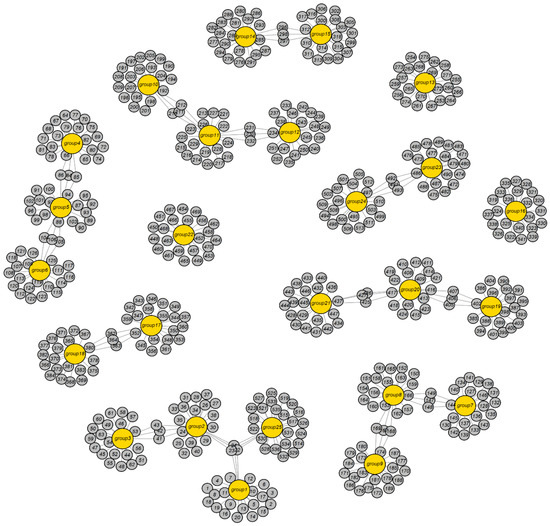
Figure 3.
The gene network structure for the equal group-size data.
Table 5.
The average classification performance (without considering imbalance processing) was measured across 300 simulated replicates of different methods, with the higher imbalance rate and the equal gene group-size data.
Note that these two simulated studies are similar in terms of total gene and cluster numbers. The key distinction is in how genes are distributed within clusters: Simulation 1 varies gene counts within clusters, resembling real data more closely, while Simulation 2 maintains consistent gene counts per cluster, following the approach of Zeng and Breheny [33]. The gene structure in simulation 1 is closer to reality, while the structure in simulation 2 is “synthetic”.
We are also interested in seeing whether the prediction performance after imbalance treatment is better than the prediction performance without imbalance treatment. According to Table 3 and Table 5, the numbers in parentheses in these two tables represent the average predictive performance without considering imbalance processing. The prediction performance after imbalance treatment in Simulation 1 is better than most prediction performances without imbalance treatment. It can be seen from Table 5 that using the regularization method, the “Precision” and “Sensitivity” standards without imbalance processing are extremely high and extremely low, respectively. This is because the prediction model is biased toward the majority category. However, from Table 5 after imbalance processing, the “Precision” criterion is corrected back, and the “Sensitivity” and the comprehensive indicator “F1” are significantly improved. However, this phenomenon was not observed in the machine learning methods.
Furthermore, we are also interested in comparing the predictive performance of models using SMOTE alone versus SMOTE-Tomek. In these two simulation examples, we balanced an imbalanced dataset with SMOTE before applying OGS and building the predictive model. The results are shown in Table A2 and Table A3. Comparing these findings with Table 3 and Table 5, which display the predictive performance after SMOTE-Tomek processing, clearly indicates that SMOTE-Tomek yields superior performance compared to SMOTE alone.
We also examine the “Sensitivity” measure, i.e., the proportion of the underlying effective G and G-E interaction terms being selected using steps 1–3 of the OGS method through simulation scenario 1 and considering different coefficient conditions. The first step of OGS involves selecting significant pathways, while the second and third steps involve selecting G-E interaction terms. From Table 6, two results can be observed. First, the proportion of the underlying effective G-E interactions being selected is superior in balanced processing compared to unbalanced processing. Second, regardless of whether balanced processing has occurred and under different balancing conditions, models with larger coefficients exhibit slightly better performance than models with weaker coefficients (all original coefficients divided by 2).
Table 6.
The proportion of correctly selected genes and G-E interactions by the OGS method.
3.2. Real Data Application: TCGA LUAD Data
Our own TCGA LUAD profile contains 505 patients with 447 cancer tissues (88%), 58 normal tissues (12%), and 20,501 gene expression signatures. We also present the locations where these lung adenocarcinoma tissue samples occurred, with the frequency distribution table shown in Table A4. The three E factors analyzed include number of pack years smoked, race, and gender. The information on these E factors can be summarized in Table 7. To handle missing values in the clinical variables, we employ the sparse boosting method [39] available in the R package “GEInter” to perform multiple imputations.
Table 7.
The selected clinical variables and information from the TCGA LUAD data.
Given the expectation of a limited number of cancer-related genes, it is reasonable to reduce the number of genes before conducting the training/test sample split for the validation set procedure. We utilize supervised learning feature selection for pre-screening and select the top 3000 genes with the highest mutual information (MI) values for further analysis. Overall, a total of 12,003 biomarkers are considered in a conjoint analysis framework. Note that MI quantifies the amount of information shared between two variables. It is a measure of how much knowing one variable tells you about another. MI is commonly used in feature selection to identify which features are most informative for predicting the target variable.
For the proposed OGS approach, from the 3000 preselected genes obtained through mutual information as described above, we incorporate prior pathway information based on gene ontology (GO) terms from the biological process (BP), cellular composition (CC), and molecular function (MF) databases. In the machine learning framework, only predictors selected based on the proposed OGS are considered. Note that the main focus of the GO project is to systematically annotate genes, moving beyond merely describing gene sequences. It employs a more diverse and comprehensive approach to describing gene properties, leading to the development of numerous databases tailored for specific species. In essence, the gene annotation classification of GO provides a systematic tool for analyzing gene functions. Its primary function is to categorize each gene into three major aspects: BP describes specific phenomena occurring within a biological organism, such as signal transduction, cellular development, and so on. CC: Describes the location or region within the cell where the gene is involved. MF: Describes phenomena at the molecular level, such as the catalytic activity of a specific receptor.
We randomly split the entire data 100 times into 404:101 training and test sets to evaluate the performance of all methods considered in the application to TCGA LUAD data, where the SMOTE-Tomek hybrid resampling is performed on the training data to address the class imbalance issue. Table 8 reports the average of 100 random validation set class prediction results for the GO terms of the BP, CC, and MF databases. From this prediction accuracy table, we see that OGS using the regularized logistic regression method performs satisfactorily.
Table 8.
Results (means of prediction accuracy measures) of different methods with the GO terms of the BP, CC, and MF gene sets databases in the TCGA LUAD data over 100 random splits of 404:101 training and test sets.
When employing the OGS with the Ridge penalty on the entire dataset based on the GO BP database, we identify nine significant G-E interaction effects and obtain the corresponding odds ratio estimates, as presented in Table 9. We note that these two selected genes, GPT2 and IDH2, have been shown to be related to LUAD. For example, Wang et al. [40] verified the effect of GPT2 on regulating the tumor immune microenvironment and tumor growth in vivo and inhibiting GPT2 can inhibit tumor growth. Rodriguez et al. [41] pointed out that the coexistence of IDH1/2 mutations with known trunk drivers in the BRAF, EGFR, and KRAS genes suggests that they may be branching drivers leading to subclonal evolution of lung adenocarcinoma. Lei et al. [42] used TCGA data to study molecular differences between racial groups in 10 cancer types, including LUAD. In Table 9, we find that the corresponding odds ratio estimate for the GPT2-Race interaction biomarker is greater than 1, meaning that it is positively associated with the odds of developing LUAD.
Table 9.
Analysis of the whole TCGA LUAD data using the OGS with Ridge penalty approach based on the GO-BP database: odds ratios of identified G-E interactions.
3.3. Real Data Application: TCGA BRCA Data
Our own TCGA BRCA profile contains 1094 patients with 981 cancer tissues (90%), 113 normal tissues (10%), and 20,501 gene expression signatures. We also present the locations where these breast invasive carcinoma tissue samples occurred, with the frequency distribution table shown in Table A5. The three E factors analyzed include day to age at initial pathologic diagnosis (years), race, and gender. The information on these E factors can be summarized in Table 10. These clinical variables contain missing values. We utilize the sparse boosting method [39] in the R package “GEInter” to perform multiple imputations on the missing values in the clinical variables. Given the expectation of a limited number of cancer-related genes, we employed supervised learning feature selection for pre-screening and selected the top 3000 genes with the largest mutual information values for downstream analysis. Overall, a total of 12,003 biomarkers are considered in a conjoint analysis framework.
Table 10.
The selected clinical variables are based on the TCGA BRCA data.
For the proposed OGS approach, from the 3000 preselected genes obtained through mutual information as described above, we incorporate prior pathway information based on GO terms from the BP, CC, and MF databases. In the machine learning framework, only predictors selected based on the proposed OGS are considered. We randomly split the entire data 100 times into 875:219 training and test sets to evaluate the performance of all methods considered in the application to TCGA BRCA data, where the MOTE-Tomek hybrid resampling is performed on the training data to address the class imbalance issue. Table 11 reports the average of 100 random validation set class prediction results for the GO terms of the BP, CC, and MF databases. From this prediction accuracy table, we see that OGS using the regularized logistic regression method performs satisfactorily.
Table 11.
Results (means of prediction accuracy measures) of different methods with the GO terms of the BP, CC, and MF gene sets databases in the TCGA BRCA data over 100 random splits of 875:219 training and test sets.
When applying the OGS with the Ridge penalty to the entire dataset based on the GO BP database, we identify nine significant G-E interaction effects and obtain the corresponding odds ratio estimates, as illustrated in Table 12. We note that these two selected genes, CES1 and CTHRC1, have been shown to be related to BRCA. For example, Qu et al. [43] demonstrated that CES2 could serve as a potential biomarker for predicting the prognosis of T4 breast cancer, with low CES2 expression being linked to a poor prognosis. However, Qu et al. [38] also pointed out that CES2-related genes include CES1. Wang et al. [44] pointed out that CTHRC1 is highly expressed in a variety of tumors, including breast cancer, and elevated CTHRC1 expression is associated with poor prognosis. Furthermore, Lei et al. [42] used TCGA data to study molecular differences between racial groups in 10 cancer types, including BRCA. In Table 12, we find that the corresponding odds ratio estimates for the CES1-Race interaction biomarkers are greater than 1, indicating that it is positively associated with the odds of developing BRCA.
Table 12.
Analysis of the whole TCGA BRCA data using the OGS with Ridge penalty approach based on the GO-BP database: odds ratios of identified G-E interactions.
3.4. Improvement in Predictive Capability for Real Data
However, in Table 8 and Table 11, we found that the typical issue arising from imbalance, characterized by high specificity and low sensitivity, seems to remain unresolved effectively. Blagus and Lusa [45] pointed out that high-dimensional data cannot be subjected to a resampling method without feature filtering. Directly using the resampling method without feature screening may only make the data more complex, which is not effective in improving the prediction effect. Based on this argument, we will revise the analysis steps to firstly, conduct the OGS approach on the imbalanced real training data, followed by the SMOTE-Tomek Link processing. The new “OGS first, SMOTE-Tomek link later” results (Table 13 and Table 14) show that, compared to before (“SMOTE-Tomek link first, OGS later”), most models are performing much better except for the KNN method. Especially in cases of high specificity and low sensitivity, there was a noticeable improvement.
Table 13.
Prediction results of TCGA LUAD data using the “OGS first, SMOTE-Tomek link later” analysis approach.
Table 14.
Prediction results of TCGA BRCA data using the “OGS first, SMOTE-Tomek link later” analysis approach.
Therefore, based on the above analysis results, we suggest that in high-dimensional imbalanced data, the order of balancing processing and feature screening needs to be considered to achieve good prediction results. This is a very interesting topic for establishing an index to guide the selection between “screen first, balance later” or “balance first, screen later” analysis steps that could be beneficial. Blagus and Lusa [45] also suggested that for high-dimensional and imbalanced data, adjusting the classification threshold values is more effective. These are all topics that can be explored in the future.
4. Discussion
Several topics around resampling research require further consideration [23]. For example, automatically and adaptively selecting the number of nearest neighbors would be valuable; different strategies for creating synthetic neighbors; or selecting nearest neighbors that focus on misclassified samples might improve performance. Moreover, when evaluating binary classifiers, Saito and Rehmsmeier [46] recommend using the area under the precision-recall curve metric for imbalanced data. Therefore, we are going to conduct a series of investigations and studies to examine the performance of different metrics on imbalanced biological data.
Another remaining issue is finding suitable unsupervised feature selection methods for a better downstream genome-wide association study (GWAS) and how to improve OGS. For example, when a dataset contains both categorical and continuous features, using MI for selection is more effective than using variance. Furthermore, MI computation is not affected by the scale of features. Even if continuous features are standardized, MI is calculated based on joint and marginal probabilities, unaffected by feature scales. Therefore, compared to variance selection, which is influenced by scale, MI can identify features with higher discriminative power. Moreover, Fan and Lv [17] pointed out that marginal independent feature screening has a significant chance of not selecting three types of feature variables in the following scenarios: 1. An essential predictor, marginally uncorrelated yet jointly correlated with the response variable. 2. Less significant predictors that are highly correlated with important predictors may receive higher priority for selection compared to other important predictors that are weakly associated with the response variable. 3. Collinearity among the predictors. Fan and Lv [17] provided the iterative version for marginal independent feature screening to address these situations. These interesting issues deserve further study and will be investigated in our future work.
The OGS method is adaptable. While our focus lies on imbalanced cancer or normal prediction using a binary logistic regression model, the same principle can be applied to other outcome models, such as the linear regression model for continuous phenotypes. Since there is ample evidence that being overweight increases the risk of many cancers developing [47], Hu et al. [48] studied body mass index (BMI)-related molecular signatures associated with tumor immunity, which may highlight the clinical importance of considering BMI-relevant molecular signatures in cancer precision medicine. TCGA offers extensive high-throughput molecular data alongside corresponding clinical data across various cancer types, presenting researchers with valuable opportunities to systematically investigate the correlation between molecular data and BMI. Therefore, we wanted to extend the OGS approach to study the association between BMI and cancer molecular signatures. It deserves further study and will be investigated in our future work.
In the OGS approach, the SKAT test plays a central role in screening for G-E interactions. Lee et al. [49] conducted a comparison of different gene- or region-based association tests, such as burden tests, variance-component tests, and combined omnibus tests, evaluating their assumptions and performance. Given that different testing methods demonstrate strengths in distinct biological contexts, the exploration of various testing approaches in future studies could potentially bolster the efficacy of OGS.
This article aims to identify G-E interaction biomarkers that could influence the occurrence of specific cancers. In TCGA clinical data, most of the clinical variables are biological indicators occurring after cancer diagnosis (such as pathologic stage, nodes, and tumor size). However, the clinical variables we are interested in are those occurring before cancer diagnosis. Therefore, the number of variables that can be considered is limited. Certainly, in the future, we can consider incorporating a wider range of clinical variables to further refine the cancer diagnosis model and enhance its accuracy.
5. Conclusions
The existing SMOTE-Tomek resampling and OGS selection methods used in this article are well established and have achieved considerable success in previous studies. However, this article makes a practical contribution by using imbalanced TCGA cancer and normal tissue data to build a cancer diagnostic model. Challenges such as data imbalance, ultrahigh-dimensional variables, and gene clustering relationships make developing microarray cancer diagnostic models particularly challenging. So, we cleverly combine the SMOTE-Tomek resampling with the OGS selection approach to develop an accurate microarray cancer diagnostic model.
In summary, we point out how this article is similar to and different from two other related articles [19,20], to state what unique contribution this article makes. Wang, Wang, and Chen [19] employed the OGS approach with Cox’s regression model to identify significant gene-environment interactions linked to clinical censoring survival outcomes. Conversely, Wang and Chen [20] utilized the OGS approach with a binary logistic regression model to discover critical gene-gene interaction biomarkers associated with the occurrence of balanced binary cancer/normal outcomes. In this article, we employ the SMOTE-Tomek resampling procedure to account for imbalanced data and utilize the OGS approach with binary logistic regression to incorporate gene pathway information to identify important gene-environment interaction biomarkers associated with imbalanced cancer and normal tissue outcomes.
Based on the identified biomarkers, we can predict the probability of each patient falling into the cancer/normal category. In simulation studies, we conduct a series of systematic comparisons and demonstrate that the classification performance of our proposed OGS with regularization methods outperforms some existing commonly used machine learning methods across different imbalance rates. We also show that the prediction performance after SMOTE-Tomek treatment is better than that without imbalance treatment [20] and SMOTE treatment at different imbalance rates. In a real data application, we adopt the SMOTE-Tomek resampling procedure to resolve the class imbalance problem and analyze two sets of TCGA LUAD and BRCA genomic data. Numerical results not only demonstrate that the new proposal of a microarray-based cancer diagnostic model achieves satisfactory classification accuracy but also provide corresponding odds ratio estimates for selected biomarkers, which has important clinical implications. Moreover, in high-dimensional imbalanced data, for achieving good prediction results, we recommend considering the order of balancing processing and feature screening.
Author Contributions
Conceptualization, J.-H.W.; methodology, J.-H.W. and C.-Y.L.; software, C.-Y.L.; validation, C.-Y.L., Y.-R.M., Z.-H.W. and P.-L.H.; formal analysis, J.-H.W., C.-Y.L. and Y.-R.M.; investigation, J.-H.W., C.-Y.L., Z.-H.W. and P.-L.H.; resources, J.-H.W.; data curation, Z.-H.W. and P.-L.H.; writing—original draft preparation, J.-H.W.; writing—review and editing, J.-H.W.; visualization, J.-H.W. and C.-Y.L.; supervision, J.-H.W.; project administration, J.-H.W.; funding acquisition, J.-H.W. All authors have read and agreed to the published version of the manuscript.
Funding
This research was funded by the National Science and Technology Council of the Republic of China (Taiwan), grant NSTC 112-2118-M-194-003-MY2.
Data Availability Statement
The R and Python codes for the gene network, the simulation studies and real data are available at the Figshare website. https://doi.org/10.6084/m9.figshare.25315870.v7 (accessed on 1 March 2024). The TCGA, LUAD, and BRCA clinical and genomic data, as well as clinical binary cancer and normal outcomes analyzed during this study, are available at the Figshare website: https://doi.org/10.6084/m9.figshare.25315975.v4 (accessed on 1 March 2024). The TCGA data we analyzed were obtained from the TCGA Hub repository: https://tcga.xenahubs.net (accessed on 1 September 2023).
Acknowledgments
The results shown here are in whole or in part based upon data generated by the TCGA Research Network: https://www.cancer.gov/tcga (accessed on 1 September 2023). The authors thank the academic editors and reviewers for their valuable insights, comments, and suggestions, significantly enhancing the article’s quality.
Conflicts of Interest
The authors declare no conflicts of interest.
Abbreviations
The following abbreviations are used in this manuscript:
| BMI | Body mass index |
| BP | Biological process |
| BRCA | Breast invasive carcinoma |
| CC | Cellular composition |
| CV | Cross-validation |
| FN | Number of false negatives |
| FP | Number of false positives |
| G-E | Gene-environment |
| G-G | Gene-gene |
| GO | Gene ontology |
| GWAS | Genome-wide association study |
| IR | Imbalanced ratio |
| KNNs | K-nearest neighbors |
| LDA | Linear discriminant analysis |
| LUAD | Lung adenocarcinoma |
| MF | Molecular function |
| MI | Mutual information |
| ML | Machine learning |
| MLRs | Multiple logistic regression models |
| OGS | Overlapping group screening |
| RFs | Random forests |
| SKAT | Sequence kernel association test |
| SMOTE | Synthetic minority oversampling technique |
| SVMs | Support vector machines |
| TCGA | The cancer genome atlas |
| TN | Number of true negatives |
| TP | Number of true positives |
Appendix A. Latent Effect Approach
Consider a scenario where four genes are categorized into two overlapping groups. Group 1 encompasses genes 1, 2, and 3, while Group 2 includes genes 2 and 4. Notably, gene 2 is shared between both Group 1 and Group 2. The coefficient vector for genes 1, 2, 3, and 4 is decomposed into group-specific latent effects as
Table A1.
The relevant hyperparameter settings of the machine learning methods.
Table A1.
The relevant hyperparameter settings of the machine learning methods.
| ML Method | R Package and Function | Hyperparameter | Procedure |
|---|---|---|---|
| SVM | “e1071”, svm(), tune() | Kernel: “radial” | given |
| cost: | CV | ||
| gamma: | CV | ||
| RF | “randomForest”, randomForest(), train() | Kernel: “rectangular” | given |
| ntree: 1, 2, …, 500 | CV | ||
| mtry: 1, 2, …, 10 | CV | ||
| KNN | “kknn”, kknn() | k: 1, 2, …, 50 | CV |
| LDA | “MASS”, lad() | prior: 0.5 | given |
Table A2.
The average classification performance was measured across 300 simulated replicates of different methods, considering SMOTE treatment, various imbalanced rates, and varying gene group size data.
Table A2.
The average classification performance was measured across 300 simulated replicates of different methods, considering SMOTE treatment, various imbalanced rates, and varying gene group size data.
| Accuracy | Precision | Sensitivity | F1 | Specificity | |
|---|---|---|---|---|---|
| 60:40 | |||||
| OGS_Ridge | 0.8358 | 0.8084 | 0.8194 | 0.7958 | 0.8456 |
| OGS_Lasso | 0.8308 | 0.7959 | 0.8331 | 0.7961 | 0.8281 |
| OGS_ALasso | 0.8636 | 0.8388 | 0.8572 | 0.8327 | 0.8665 |
| OGS_SVM | 0.8248 | 0.7476 | 0.8437 | 0.7891 | 0.8163 |
| OGS_LDA | 0.7985 | 0.6960 | 0.8709 | 0.7704 | 0.7551 |
| OGS_KNN | 0.4941 | 0.4334 | 0.8440 | 0.5662 | 0.2678 |
| OGS_RF | 0.6520 | 0.6837 | 0.2756 | 0.3700 | 0.8970 |
| 70:30 | |||||
| OGS_Ridge | 0.7575 | 0.7057 | 0.7609 | 0.6717 | 0.7578 |
| OGS_Lasso | 0.7480 | 0.7060 | 0.7525 | 0.6604 | 0.7473 |
| OGS_ALasso | 0.7467 | 0.6689 | 0.8219 | 0.6867 | 0.7080 |
| OGS_SVM | 0.7790 | 0.6752 | 0.7266 | 0.6867 | 0.8158 |
| OGS_LDA | 0.6543 | 0.5016 | 0.7228 | 0.5879 | 0.6210 |
| OGS_KNN | 0.4199 | 0.3650 | 0.9101 | 0.5173 | 0.1626 |
| OGS_RF | 0.6531 | 0.5085 | 0.5771 | 0.5295 | 0.6932 |
Table A3.
The average classification performance was measured across 300 simulated replicates of different methods, considering SMOTE treatment with the higher imbalanced rate and equal gene group-size data.
Table A3.
The average classification performance was measured across 300 simulated replicates of different methods, considering SMOTE treatment with the higher imbalanced rate and equal gene group-size data.
| Accuracy | Precision | Sensitivity | F1 | Specificity | |
|---|---|---|---|---|---|
| 80:20 | |||||
| OGS_Ridge | 0.6640 | 0.9071 | 0.6687 | 0.7369 | 0.6529 |
| OGS_Lasso | 0.6807 | 0.8994 | 0.6957 | 0.7544 | 0.6220 |
| OGS_ALasso | 0.7858 | 0.8984 | 0.8425 | 0.8261 | 0.5490 |
| OGS_SVM | 0.7397 | 0.8905 | 0.7767 | 0.8233 | 0.6125 |
| OGS_LDA | 0.6090 | 0.8889 | 0.5791 | 0.7000 | 0.7195 |
| OGS_KNN | 0.4314 | 0.8390 | 0.3641 | 0.4998 | 0.6842 |
| OGS_RF | 0.7375 | 0.8044 | 0.8835 | 0.8397 | 0.2015 |
Table A4.
A frequency distribution table of TCGA LUAD tissue sample locations.
Table A4.
A frequency distribution table of TCGA LUAD tissue sample locations.
| Location | Left-Lower | Left-Upper | Right-Lower | Right-Middle | Right-Upper | Other | NA |
|---|---|---|---|---|---|---|---|
| Number | 76 | 119 | 96 | 23 | 180 | 4 | 7 |
Table A5.
A frequency distribution table of TCGA BRCA tissue sample locations.
Table A5.
A frequency distribution table of TCGA BRCA tissue sample locations.
| Location | left | Left LIQ | left LOQ | left UIQ | left UOQ |
| Number | 189 | 29 | 40 | 83 | 230 |
| Location | right | right LIQ | right LOQ | right UIQ | right UOQ |
| Number | 175 | 27 | 49 | 83 | 189 |
Here, LIQ, LOQ, UIQ, and UOQ refer to the lower inner quadrant, lower outer quadrant, upper inner quadrant, and upper outer quadrant, respectively.
References
- Thomas, D. Gene–environment-wide association studies: Emerging approaches. Nat. Rev. Genet. 2010, 11, 259–272. [Google Scholar] [CrossRef]
- Franks, P.W.; Paré, G. Putting the genome in context: Gene-environment interactions in type 2 diabetes. Curr. Diabetes Rep. 2016, 16, 57. [Google Scholar] [CrossRef]
- Batchelor, T.T.; Betensky, R.A.; Esposito, J.M.; Pham, L.-D.D.; Dorfman, M.V.; Piscatelli, N.; Jhung, S.; Rhee, D.; Louis, D.N. Age-dependent prognostic effects of genetic alterations in glioblastoma. Clin. Cancer Res. 2004, 10, 228–233. [Google Scholar] [CrossRef]
- Lin, W.; Huang, C.; Liu, Y.; Tsai, S.; Kuo, P. Genome-Wide Gene-Environment Interaction Analysis Using Set-Based Association Tests. Front. Genet. 2019, 9, 715. [Google Scholar] [CrossRef]
- Rauschert, S.; Raubenheimer, K.; Melton, P.E.; Huang, R.C. Machine learning and clinical epigenetics: A review of challenges for diagnosis and classification. Clin. Epigenetics 2020, 12, 51. [Google Scholar] [CrossRef] [PubMed]
- Xie, J.; Wang, M.; Xu, S.; Huang, Z.; Grant, P.W. The unsupervised feature selection algorithms based on standard deviation and cosine similarity for genomic data analysis. Front. Genet. 2021, 12, 684100. [Google Scholar] [CrossRef]
- Lavanya, C.; Pooja, S.; Kashyap, A.H.; Rahaman, A.; Niranjan, S.; Niranjan, V. Novel biomarker prediction for lung cancer using random forest classifiers. Cancer Inform. 2023, 22, 11769351231167992. [Google Scholar]
- Ali, M.D.; Saleem, A.; Elahi, H.; Khan, M.A.; Khan, M.I.; Yaqoob, M.M.; Farooq Khattak, U.; Al-Rasheed, A. Breast cancer classification through meta-learning ensemble technique using convolution neural networks. Diagnostics 2023, 13, 2242. [Google Scholar] [CrossRef] [PubMed]
- Tian, X.; Wang, X.; Chen, J. Network-constrained group lasso for high-dimensional multinomial classification with application to cancer subtype prediction. Cancer Inform. 2015, 13, 25–33. [Google Scholar] [CrossRef] [PubMed]
- Zhou, F.; Ren, J.; Lu, X.; Ma, S.; Wu, C. Gene–Environment Interaction: A Variable Selection Perspective. Methods Mol. Biol. 2021, 6, 191–223. [Google Scholar]
- Murcray, C.E.; Lewinger, J.P.; Gauderman, W.J. Gene-environment interaction in genome-wide association studies. Am. J. Epidemiol. 2009, 169, 219–226. [Google Scholar] [CrossRef] [PubMed]
- Winham, S.J.; Biernacka, J.M. Gene-environment interactions in genome-wide association studies: Current approaches and new directions. J. Child Psychol. Psychiatry Allied Discip. 2013, 54, 1120–1134. [Google Scholar] [CrossRef] [PubMed]
- Cordell, H.J. Detecting gene-gene interactions that underlie human diseases. Nat. Rev. Genet. 2009, 10, 392–404. [Google Scholar] [CrossRef] [PubMed]
- Ahn, J.; Mukherjee, B.; Gruber, S.B.; Ghosh, M. Bayesian semiparametric analysis for two-phase studies of gene-environment interaction. Ann. Appl. Stat 2013, 7, 543–569. [Google Scholar] [CrossRef] [PubMed][Green Version]
- Liu, C.; Ma, J.; Amos, C.I. Bayesian variable selection for hierarchical gene-environment and gene-gene interactions. Hum. Genet. 2015, 134, 23–36. [Google Scholar] [CrossRef] [PubMed]
- Tibshirani, R. Regression shrinkage and selection via the lasso. J. R. Stat. Soc. Ser. B Methodol. 1996, 58, 267–288. [Google Scholar] [CrossRef]
- Fan, J.; Lv, J. Sure independence screening for ultrahigh dimensional feature space. J. R. Stat. Soc. Ser. B Methodol. 2008, 70, 849–911. [Google Scholar] [CrossRef]
- Wang, J.; Chen, Y. Overlapping group screening for detection of gene-gene interactions: Application to gene expression profiles with survival trait. BMC Bioinform. 2018, 19, 335. [Google Scholar] [CrossRef]
- Wang, J.; Wang, K.; Chen, Y. Overlapping group screening for detection of gene-environment interactions with application to TCGA high-dimensional survival genomic data. BMC Bioinform. 2022, 23, 202. [Google Scholar] [CrossRef]
- Wang, J.; Chen, Y. Overlapping group screening for binary cancer classification with TCGA high-dimensional genomic data. J. Bioinform. Comput. Biol. 2023, 21, 2350013. [Google Scholar] [CrossRef]
- Selamat, N.A.; Abdullah, A.; Diah, N.M. Association features of smote and rose for drug addiction relapse risk. J. King Saud Univ. Comput. Inf. Sci. 2022, 34, 7710–7719. [Google Scholar] [CrossRef]
- Abdoh, S.F.; Rizka, M.A.; Maghraby, F.A. Cervical cancer diagnosis using random forest classifier with SMOTE and feature reduction techniques. IEEE Access 2018, 6, 59475–59485. [Google Scholar] [CrossRef]
- Chawla, N.; Bowyer, K.; Hall, L.; Kegelmeyer, P. SMOTE: Synthetic minority over-sampling technique. J. Artif. Intell. 2002, 16, 321–357. [Google Scholar] [CrossRef]
- Tomek, I. Two modifications of CNN. IEEE Trans. Syst. Man. Cybern. 1976, 6, 769–772. [Google Scholar]
- Batista, G.E.A.P.A.; Prati, R.C.; Monard, M.C. A study of the behavior of several methods for balancing machine learning training data. SIGKDD Explor. 2004, 6, 20–29. [Google Scholar] [CrossRef]
- Colaprico, A.; Silva, T.C.; Olsen, C.; Garofano, L.; Cava, C.; Garolini, D.; Sabedot, T.S.; Malta, T.M.; Pagnotta, S.M.; Castiglioni, I.; et al. TCGAbiolinks: An R/Bioconductor package for integrative analysis of TCGA data. Nucleic Acids Res. 2016, 44, e71. [Google Scholar] [CrossRef] [PubMed]
- Wang, S.; Liu, X. The UCSCXenaTools R package: A toolkit for accessing genomics data from UCSC xena platform, from cancer multi-omics to single-cell RNA-seq. J. Open Source Softw. 2019, 4, 1627. [Google Scholar] [CrossRef]
- Sain, H.; Purnami, S.W. Combine sampling support vector machine for imbalanced data classification. Procedia Comput. Sci. 2015, 72, 59–66. [Google Scholar] [CrossRef]
- Liu, C.; Wu, J.; Mirador, L.; Song, Y.; Hou, W. Classifying dna methylation imbalance data in cancer risk prediction using smote and tomek link methods. In International Conference of Pioneering Computer Scientists, Engineers and Educators; Springer: Singapore, 2018; pp. 1–9. [Google Scholar]
- Jonathan, B.; Putra, P.H.; Ruldeviyani, Y. Observation imbalanced data text to predict users selling products on female daily with SMOTE, Tomek, and SMOTE-Tomek. In Proceedings of the 2020 IEEE International Conference on Industry 4.0, Artificial Intelligence, and Communications Technology (IAICT), Bali, Indonesia, 7–8 July 2020; pp. 81–85. [Google Scholar]
- Sasada, T.; Liu, Z.; Baba, T.; Hatano, K.; Kimura, Y. A Resampling Method for Imbalanced Datasets Considering Noise and Overlap. Procedia Comput. Sci. 2020, 176, 420–429. [Google Scholar] [CrossRef]
- Jacob, L.; Obozinski, G.; Vert, J.P. Group lasso with overlap and graph lasso. In Proceedings of the International Conference on Machine Learning, Montreal, QC, Canada, 14–18 June 2009; pp. 433–440. [Google Scholar]
- Zeng, Y.; Breheny, P. Overlapping group logistic regression with applications to genetic pathway selection. Cancer Inform. 2016, 15, 179–187. [Google Scholar] [CrossRef]
- Wu, M.C.; Lee, S.; Cai, T.; Li, Y.; Boehnke, M.; Lin, X. Rare-variant association testing for sequencing data with the sequence kernel association test. Am. J. Hum. Genet. 2011, 89, 82–93. [Google Scholar] [CrossRef] [PubMed]
- Davies, R.B. Algorithm AS 155: The distribution of a linear combination of random variables. J. R. Stat. Soc. Ser. C Appl. Stat. 1980, 29, 323–333. [Google Scholar] [CrossRef]
- Duchesne, P.; Lafaye De Micheaux, P. Computing the distribution of quadratic forms: Further comparisons between the Liu-Tang-Zhang approximation and exact methods. Comput. Stat. Data Anal. 2010, 54, 858–862. [Google Scholar] [CrossRef]
- Zou, H. The Adaptive lasso and its oracle properties. J. Am. Stat. Assoc. 2006, 101, 1418–1429. [Google Scholar] [CrossRef]
- Simon, N.; Friedman, J.; Hastie, T.; Tibshirani, R. Regularization paths for Cox’s proportional hazards model via coordinate de scent. J. Stat. Softw. 2011, 39, 1–13. [Google Scholar] [CrossRef] [PubMed]
- Wu, M.; Ma, S. Robust semiparametric gene–environment interaction analysis using sparse boosting. Stat. Med. 2019, 38, 4625–4641. [Google Scholar] [CrossRef]
- Wang, B.; Pei, J.; Xu, S.; Liu, J.; Yu, J. System analysis based on glutamine catabolic-related enzymes identifies GPT2 as a novel immunotherapy target for lung adenocarcinoma. Comput. Biol. Med. 2023, 165, 107415. [Google Scholar] [CrossRef] [PubMed]
- Rodriguez, E.F.; De Marchi, F.; Lokhandwala, P.M.; Belchis, D.; Xian, R.; Gocke, C.D.; Eshleman, J.R.; Illei, P.; Li, M.-T. IDH1 and IDH2 mutations in lung adenocarcinomas: Evidences of subclonal evolution. Cancer Med. 2020, 9, 4386–4394. [Google Scholar] [CrossRef] [PubMed]
- Lei, B.; Jiang, X.; Saxena, A. TCGA expression analyses of 10 carcinoma types reveal clinically significant racial differences. Cancers 2023, 15, 2695. [Google Scholar] [CrossRef]
- Qu, W.; Yao, Y.; Liu, Y.; Jo, H.; Zhang, Q.; Zhao, H. Prognostic and immunological roles of CES2 in breast cancer and potential application of CES2-targeted fluorescent probe DDAB in breast surgery. Int. J. Gen. Med. 2023, 16, 1567–1580. [Google Scholar] [CrossRef]
- Wang, Z.; Zhang, S.; Zheng, C.; Xia, K.; Sun, L.; Tang, X.; Zhou, F.; Ouyang, Y.; Tang, F. CTHRC1 is a potential prognostic bi omarker and correlated with macrophage infiltration in breast cancer. Int. J. Gen. Med. 2022, 15, 5701–5713. [Google Scholar] [CrossRef] [PubMed]
- Blagus, R.; Lusa, L. SMOTE for high-dimensional class-imbalanced data. BMC Bioinform. 2013, 14, 106. [Google Scholar] [CrossRef] [PubMed]
- Saito, T.; Rehmsmeier, M. The precision-recall plot is more informative than the ROC plot when evaluating binary classifiers on imbalanced datasets. PLoS ONE 2015, 10, e0118432. [Google Scholar] [CrossRef] [PubMed]
- Lauby-Secretan, B.; Scoccianti, C.; Loomis, D.; Grosse, Y.; Bianchini, F.; Straif, K. Body fatness and cancer—Viewpoint of the IARC working group. N. Engl. J. Med. 2016, 375, 794–798. [Google Scholar] [CrossRef] [PubMed]
- Hu, C.; Chen, X.; Yao, C.; Liu, Y.; Xu, H.; Zhou, G.; Xia, H.; Xia, J. Body mass index-associated molecular characteristics involved in tumor immune and metabolic pathways. Cancer Metab. 2020, 8, 21. [Google Scholar] [CrossRef]
- Lee, S.; Abecasis, G.R.; Boehnke, M.; Lin, X. Rare-variant association analysis: Study designs and statistical tests. Am. J. Hum. Genet. 2014, 95, 5–23. [Google Scholar] [CrossRef]


Disclaimer/Publisher’s Note: The statements, opinions and data contained in all publications are solely those of the individual author(s) and contributor(s) and not of MDPI and/or the editor(s). MDPI and/or the editor(s) disclaim responsibility for any injury to people or property resulting from any ideas, methods, instructions or products referred to in the content. |
© 2024 by the authors. Licensee MDPI, Basel, Switzerland. This article is an open access article distributed under the terms and conditions of the Creative Commons Attribution (CC BY) license (https://creativecommons.org/licenses/by/4.0/).