Abstract
Fracture within the rock is one of the main factors leading to rock destabilization and has a significant effect on the stability of the project. In this study, sandstone is used as a research target, specimens with crack inclination angles of 0°, 30°, 45°, 60°, and 90° are prefabricated, and the split Hopkinson pressure bar (SHPB) impact test of sandstone with cracks is carried out based on digital image recognition technology to explore the dynamic damage characteristics of the specimens with five angles. The basic mechanical parameters of sandstone are tested to determine the RHT model intrinsic parameters, and the numerical computational RHT model of sandstone containing crack defects is established, which is verified in comparison with the test to analyze the validity of the model. Finally, the failure characteristics of the numerical model under initial stress were carried out. The study shows the following: with the increase in the fracture angle, the dynamic compressive strength and deformation modulus are distributed in a slanting V-shape, and the inclination angle of 45° is the smallest. The strain rate and energy dissipation rate are distributed in a slanting N-shape, and the inclination angle of 45° is the largest. The transmittance shows a decreasing trend, which is the opposite of the reflectivity pattern. The crack angle determines the location and direction of the initial crack, which affects the failure mode. In addition, the parameters of the RHT constitutive model suitable for sandstone are obtained, and the damage and strength patterns of the established RHT model are highly consistent with the laboratory test results. The damage range of numerical models for crack defects with different inclination angles is negatively correlated with confining pressure values and positively correlated with axial pressure values. The damage zones are symmetrically distributed approximately perpendicular to the direction of cracks, and the confining pressure has a contributing role in the peak of the element stresses; however, the axial compression has no contribution in the peak of the element stresses.
MSC:
65E05
1. Introduction
Sandstone with crack defects, as a widely distributed rock type, plays a pivotal role in major engineering fields such as mineral extraction, tunneling, energy storage, nuclear waste disposal, and military defense [1,2,3]. In the stability evaluation of these projects, the stability of rocks is undoubtedly a crucial consideration factor. One of the main factors causing rock instability is internal crack defects, which may not only cause local damage to the rock but also lead to the collapse of its overall structure. Further observations have revealed that the prevalence of weak planes significantly weakens the overall strength of the rock mass and profoundly alters its mechanical behavior [4]. For example, the sliding of the Malpaset dam in France, the Vajont landslide in Italy, and the instability and failure of underground mining pillars in the United States are all related to the expansion of joints in the rock mass itself [5]. The essence of these destructive phenomena is that crack defects weaken the overall strength of rock materials, making them more susceptible to damage under external forces [6].
Characteristics such as the fracture angle have a significant impact on the mechanical properties and failure modes of sandstone. When these rocks are subjected to external loading, the phenomenon of stress concentration often occurs in the local area, resulting in the destruction of the rock at a relatively low level of loading, showing a high degree of friability, and the destruction process is extremely complex. However, it is very difficult to directly study defective rock masses at the engineering scale. It is feasible to carry out relevant studies and reveal the response damage characteristics using fractured rocks under laboratory and numerical simulation conditions [7].
In recent years, scholars have investigated the dynamic failure characteristics of specimens with cracks by various experimental methods, such as the drop hammer, the SHPB system, and blasting tests. It is found that the presence of cracks weakens the strength of the material, and the destruction of rocks usually starts around pre-existing fissures. For example, Chen et al. [8] carried out drop hammer impact dynamics tests on 45° jointed sandstone and intact red sandstone. It is found that the brittleness and impact resistance of the intact rock mass is greater than that of the fractured rock mass, and the energy absorbed in the destruction of the fractured rock mass is less than that absorbed by the intact rock mass. Wang et al. [9,10] systematically investigated the dynamic failure characteristics of cemented mortar rock samples from rock-like bodies containing different angles of cleavage using the SHPB device. It was found that crack initiation started from the direction of the tip of the prefabricated cleavage. Li et al. [11,12] conducted dynamic SHPB impact tests on fractured marble samples and found that the angle of the fracture affects the mechanical properties and energy evolution of the rock. Li et al. [13,14] used a dynamic focal dispersion line system with transparent polymethyl methacrylate as the medium to study the effects of pre-existing fissures on crack extension under blasting and the effects of cracks on the propagation law of the stress wave and the motion path of crack extension.
Although significant progress has been made in the study of rock failure characteristics under dynamic loading, the failure patterns of different rocks vary significantly. The current study is still not comprehensive enough, especially in the high-strain-rate loading of dynamic loads under the rock with crack is still in its infancy, and its failure law is not clear. For example, studies on the kinetics of energy dissipation have focused on intact rock samples, and relatively few studies have been conducted on fractured rock. In order to study this problem in depth, this paper takes sandstone as the research object and prefabricates the sandstone model with crack defects. Based on the digital image recognition technology and numerical simulation analysis, the dynamic damage law of sandstone with crack defects at different angles under impact loading is studied. The visualized prediction of the dynamic damage process of high-strength fissure-bearing sandstone is realized, which provides more scientific and accurate guidance for geotechnical engineering stability assessment and energy development.
In view of this, Section 1 of this paper describes the significance of the study of sandstones, reviews existing studies, and points out the limitations of these studies. Section 2 describes the model preparation, loading method, and construction of the test system. Section 3 shows the experimental results of dynamic SHPB impact on fissure-bearing sandstone, discusses the mechanical properties and energy consumption law of sandstone with crack under impact, and combines the digital image recognition technology to study the dynamic damage process of sandstone. Section 4 carries out the test for the determination of the basic mechanical parameters of the standard specimen, and based on the basic mechanical parameters, the numerical computation RHT model of sandstone with crack defects is established, and the impact numerical simulation of the model is carried out, which is compared and verified with the laboratory test in Section 3 to elucidate the failure morphology and the strength and strain field evolution law of the model. Section 5 summarizes the whole paper. The above work elucidated the dynamic destabilization damage law of sandstone with different angles of cleavage. The parameters of the RHT model of sandstone were calibrated, and the numerical calculation model of the fractured rock under the effect of peripheral pressure and axial pressure was established. The damage pattern, strength, and strain field evolution of the flawed rock under initial stress are elucidated.
2. Experimental Details
2.1. Dynamic Specimen Preparation and Loading Conditions Design
In this study, the test selected white sandstone as the research object, in order to ensure rock samples were of the same structure and composition; and to improve the credibility of the test and the effect of the comparison, rock samples were selected from the same batch of rock material.
The mineral composition of the white sandstone samples is mainly quartz (73.8%), sodium feldspar (21.7%), and kaolinite (4.4%), which widely exist in practical engineering, with an average compressive strength of 122.18 MPa.
In order to obtain a sufficiently high strain rate, as in reference [9,15], “small” specimens for dynamic testing were made. The specific dimensions of the plate rock samples were 45 mm wide, 45 mm high, and 15 mm thick. In the geometric center of the specimens, pre-existing inclined angles of 0°, 30°, 45°, 60°, and 90° were created with lengths of 8 mm and widths of 1 mm. The pre-existing cracks were prepared using the water jet method. There were 4 blocks for each angle, resulting in a total of 20 blocks. The number of specimens, the loading design, and partially shaped specimens are shown in Table 1.

Table 1.
Number of specimens and loading.
Before the test, the end faces of the specimens were polished to control the non-perpendicularity and non-parallelism of the end faces within ±0.02 mm [16]. At the same time, the surface of the square specimen was cleaned up, and white paint was used to uniformly spray on the surface of the sandstone, following this, the black pigment was randomly covered on the white pigment to obtain spots to meet the requirements of the DIC analysis [17], and the scattering model is shown schematically in Figure 1a. The loading schematic is shown in Figure 1b; the arrow direction is the direction of SHPB loading, the vertical direction is the Y direction of DIC image acquisition, the horizontal direction is the X direction, and the crack inclination is the angle between the crack and the horizontal direction, such that 0° represents the pre-existing crack along the loading direction.
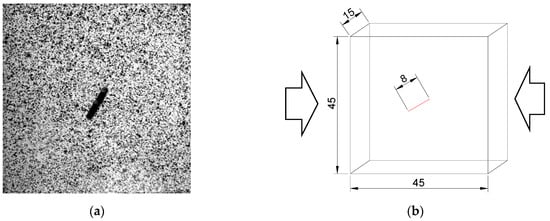
Figure 1.
Speckle fabrication and dynamic loading diagram: (a) Test specimen; (b) Loading diagram.
2.2. Experimental Principle and Loading System
- (1)
- The experimental principle of SHPB
The SHPB experiment is based on the assumption of one-dimensional stress wave and stress uniformity; that is to say, it is assumed that the pressure bar and the specimen satisfy the uniaxial stress state in the experiment and the stress balance and uniform distribution of the specimen during the impact process. According to the one-dimensional stress assumption, the stress , strain , and strain rate of the specimen can be obtained [18].
By the assumption of stress homogenization, there is
Equations (1)–(3) can be simplified as follows:
are the incident, reflected, and transmitted strains, respectively; is the cross-sectional area of the specimen; is the length of the specimen; is the cross-sectional area of the bar; is the elastic modulus of the bar; is the longitudinal wave velocity of the bar, and ; is the density of the bar.
- (2)
- The experimental principle of DIC
The DIC, also known as the digital speckle correlation method, obtains deformation information of the region of interest by performing correlation calculations on two digital images before and after sample deformation. The DIC method directly obtains the displacement and strain information by processing the digital images of the measured object surface before and after deformation. As shown in Figure 2a, we establish a coordinate system, select the area to be studied, divide it into a grid set, and determine the center point P/P’ of the subset. The image before deformation is called the “reference image” and after deformation is called the “deformed image”. When the specimen surface is deformed, the same subset in the reference image and the deformed image (the images are provided by an ultra-high-speed camera) is correlated according to the normalized cross-correlation criteria. The displacement and strain after deformation are expressed in Figure 2b, which is a schematic diagram of displacement transformation [19], where Equation (8) is the displacement relationship before and after deformation and Equation (9) is the strain relationship before and after deformation.
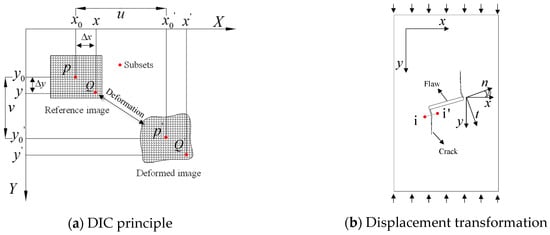
Figure 2.
Crack initiation type identification (displacement measurements are in pixels).
is the displacement in direction ; , are the center points of the reference and deformation image subregion; , are arbitrary points in the research area; is the distance between and ; is the strain component; is the displacement gradient.
- (3)
- Loading system
In order to carry out dynamic tests under impact loading, this paper uses a 50 mm-diameter SHPB device, as shown in Figure 3, and the test system includes a calculation and analysis system, a trigger and synchronous control system, an illumination system, and a high-speed camera. The bullet velocity and incident wave amplitude are controlled by adjusting the air compressor pressure, and the impact air pressure for the SHPB test in this paper is 0.18 MPa, and the shooting duration, trigger delay, frame rate, exposure time, and image resolution of the high-speed camera are set to 900 , 50 , 200,000 fps, 500 , and 924 pixel × 768 pixel, respectively.
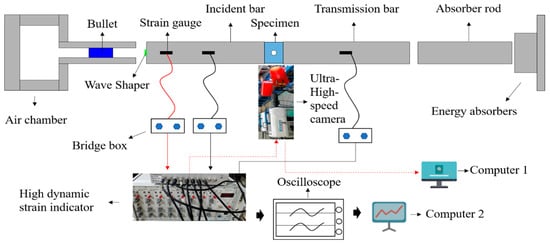
Figure 3.
DIC and SHPB synchronous experimental system.
3. Dynamic Damage Characteristic of Fractured Sandstone
3.1. Mechanical Properties
Firstly, the dynamic stress balance test was carried out. Taking the 60° specimen as an example, with the loading air pressure of 0.18 MPa, the stress balance diagram is drawn in Figure 4a.
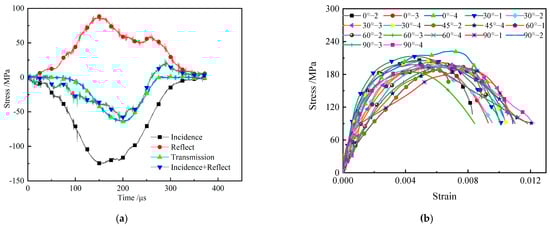
Figure 4.
Experimental results of mechanical properties. (a) Stress equilibrium diagram; (b) Stress−strain curve.
By observing the transmission wave curve and the curve obtained by superimposing the incident wave and the reflected wave in the graph, it can be found that they are approximately overlapped, indicating that the stress at both ends of the specimen is basically balanced. This indicates the authenticity and reliability of the test results.
By performing impact tests on the specimens, based on the data recorded by the dynamic strain gauge and combined with the Hopkinson principle, the average stress–strain curves of sandstone specimens under impact loading can be obtained, as in Figure 4b, including 0°, 30°, 45°, 60°, and 90° pre-existing crack defect specimens.
It can be seen from Figure 5, containing different angles of fracture rock in the impact, basically there is no compression stage, and the specimen internal pore compression and closure occur in a very short time. The dynamic stress–strain curve will first enter the elastic deformation stage; at this time, the curve is in linear growth, but when the stress value reaches 80% of the peak value, the curve growth slows down. The internal microcracks are initially formed, entering the elastic-plastic stage; when the stress value reaches the peak value, the specimen enters the plastic softening stage. The internal cracks of the specimen obtain further expansion, and the specimen appears to be obviously damaged. As the inclination angle of fractures increases, the stress peak and curve slope of sandstone show a decreasing V-shaped trend.
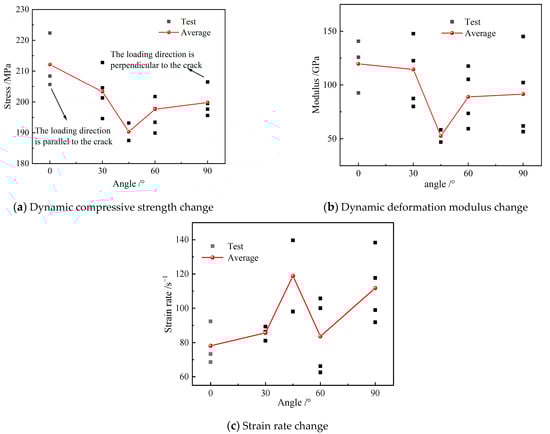
Figure 5.
Variation in mechanical parameters with angle.
In order to further quantitatively analyze the dynamic mechanical properties of sandstone with different angles of crack, the peak stresses of the curves under different angles of cleavage will be counted, and the dynamic deformation modulus and strain rate of the defective rock will be calculated [20,21]. The results are shown in Table 2.
Table 2.
Dynamic mechanical parameters of fractured sandstone with different angles.
Table 2 summarizes the dynamic compressive strength, dynamic deformation modulus, and specimen strain rate of the specimen crack at 0.18 MPa for each angle, and the results have a certain degree of dispersion.
Roughly speaking, the strength and deformation modulus of the specimen group of 0° (the angle with the horizontal direction, along the loading direction) are higher than the ones of the other angles. While the strain rate is lower, the strength and deformation modulus of the specimen group of 45° are lower than the ones of the other angles, while the strain rate is higher. In order to better summarize the change rule of the mechanics of the specimens with different angles of crack, it is now plotted in Figure 5.
Figure 5a clearly demonstrates the pattern of strength variation. The average strength of the 0° specimen group is the highest, and the strength is greatest when cracks are arranged along the loading direction. With an increasing crack angle, the strength of the specimen shows an overall “V” shape change, which is consistent with the findings of the literature [22,23]. However, the average strength of the lowest crack angle is not consistent, the peak strength increases with the crack angle, and the overall strength of the specimen follows a “V” trend of attenuation. The dynamic compressive strength is sorted as 0° > 30° > 90° > 60° > 45°, and the specimen group has the lowest average strength at a crack angle of 45°. The possible reason for this is related to the damage angle of the rock material. The trend of the dynamic modulus of deformation in Figure 5b is consistent with the dynamic compressive strength, and it also shows a “V” trend attenuation as the angle of the crack defect increases.
Figure 5c about the response of different crack angles to the strain rate, the strain rate of the specimen is distributed in the shape of “N”, and the average value of the strain rate of the specimen group with a crack angle of 0° is the lowest. The average value of the strain rate with a crack angle of 45° is the highest, which is the opposite of the change rule of the dynamic compressive strength and the dynamic deformation modulus with the angle. This result shows that the greater the load resistance of the specimen, the less sensitive it is to the strain rate.
In engineering construction when the angle of cleavage and impact direction is 45°, the cleavage weakens the rock body to the greatest extent, which can improve the efficiency of rock-breaking. When the angle of cleavage and impact direction is 0°, the cleavage weakens the rock body to the smallest extent, which is conducive to the action of the bearing capacity of this type of engineering rock body itself.
3.2. Analysis of Energy Consumption Pattern
According to the separated Hopkinson principle, the typical time-range diagrams of incident, reflected, and transmitted energies of the specimen under the impact of 0.18 MPa with time are calculated: refer to Figure 6a, The rules of energy time-range curves for each angle exhibit a strong similarity, as illustrated with the example of 30°, and the remaining groups will not be reiterated here. The incident energy, reflected energy, and transmitted energy increase with time firstly, and then are in a steady state; the dissipated energy curve shows an increase firstly, which tends to be steady after reaching the peak, and slightly decreases after the peak. This is due to the fact that after the dissipated energy reaches the peak, the pre-existing crack penetrates with the crack produced by the far field to make the specimen destroy rapidly, and the energy required at the moment of destruction is slightly higher than the energy demand in the process of destruction. Thus, there is a slightly decreasing tendency for the curve of the dissipated energy after reaching the peak.
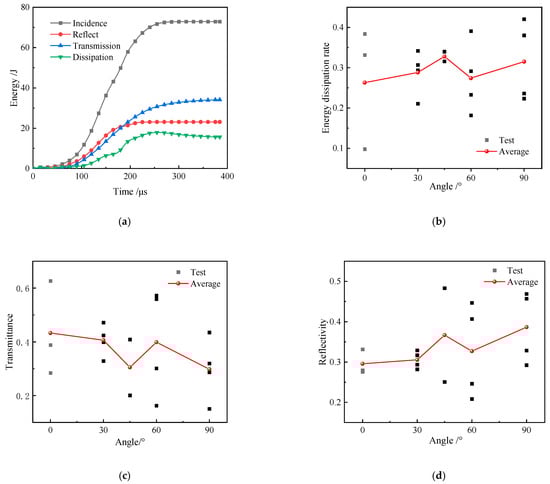
Figure 6.
Energy consumption law: (a) Typical energy time history curve of fracture defect; (b) The dissipation rate varies with angle; (c) The transmittance varies with angle; (d) The reflectance varies with angle.
In this test, the impact velocity of the bullet determines the magnitude of the incident energy, due to the instability of the impact air pressure, which inevitably leads to a certain difference in the impact velocity of the bullet under the same impact air pressure, resulting in the inconsistency of the magnitude of the incident energy. In order to eliminate the effects of this error, the peak values of typical energy–time curves are statistically calculated using the energy ratio method to determine the dissipation rate, transmissivity, and reflection rate, and the results are shown in Table 3.
Table 3.
Energy consumption parameters of fractured sandstone with different angles.
Table 3 summarizes the incident energy, reflected energy, transmitted energy, dissipation rate, transmissivity, and reflection rate of the crack specimens at 0.18 MPa for each angle, and the results of incident energy, reflected energy, and transmitted energy under the same impact air pressure are discrete.
Generally speaking, the dissipation rate and reflection rate of the 45° specimen group are higher than those of the other angles, and the transmittance is lower than those of the other angles. In order to better summarize the law of energy consumption of the specimens with different angles of crack, it is now plotted in Figure 6b–d.
Figure 6b clearly shows the change rule of the energy dissipation rate: the energy dissipation rate of the specimen increases first and then decreases with the increase in the pre-existing fissures inclination angle, and then increases again. This trend is consistent with the characteristics of strain rate, showing an “N”-shaped distribution. The average energy dissipation rate of the 45° specimen group is the highest, compared to the other groups, and the crack inclination of 45° exacerbates the energy dissipation of the specimens to a certain extent and has the greatest influence on the energy dissipation. In Figure 6c, the transmittance increases with the angle, the overall trend is attenuation, and the transmittance fluctuates at 45°, which is similar to that at 90°.
Meanwhile, in Figure 6d, the reflectance increases with the angle, showing an overall increasing trend, and the fluctuation occurs at 45°, which is just the opposite to that of transmittance, which conforms to the theoretical calculations of SHPB. Further, the incidence energy is certain, the transmittance is decreased, and the reflectance is increased, according to the two-wave method. Combined with the strength properties, the fluctuation at 45° may be due to the interaction between the pre-existing crack angle and the damage angle of the rock material changing the propagation characteristics of the stress wave, resulting in different values of transmittance and reflectance for different angles of pre-existing crack inclination.
This result indicates that the greater the load resistance of the specimen, the lower the sensitivity of the strain rate, the less damage energy is used for internal rock damage, the greater the transmittance intensity, and the smaller the reflection energy. When the crack angle and SHPB dynamic impact direction are 45°, the crack on the rock body has the largest degree of weakening, the energy dissipation rate is large, but in the construction of the project a reasonable arrangement of the impact direction can improve the efficiency of rock-breaking. When the crack angle and the impact direction are 0°, the crack on the rock body has the smallest degree of weakening, the transmittance rate is large, and it is conducive to the play of this type of engineering rock body of the load-bearing capacity of its own.
3.3. Dynamic Damage Process and Rupture Mode
In this paper, the full-field strain distribution and the dynamic evolution process of the specimen are analyzed using VIC-2D software. The time at which the impact load is applied to the contact end face of the specimen through the incident rod is recorded as 0 . Among them, Figure 7 shows the main strain rupture evolution of the 0° pre-existing crack. It can be found that a local high strain exists around the tip of the 0° specimen cleft at 30 , which increases as the load continues to advance, and at 60 , the local high strain is concentrated in the middle of the specimen cleft, which increases further with the impact load; at 120 , a small shear zone is formed in the strain concentration region in the middle of the specimen. At this time, due to the high elastic strain energy of the concentration a large amount of energy is released during the crack extension, similar to the rock explosion which occurs in this high-strain-concentration region.
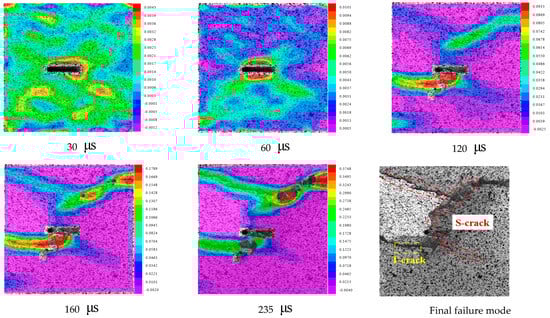
Figure 7.
The principal strain fracture evolution of a 0° pre−existing crack.
With the continuation of the dynamic loading effect, two macroscopic cracks start to form in the small shear zone of the strain concentration region in the middle part of the specimen, one of which is a tensile crack, and the other is a shear crack which expands towards the loaded end. The cracking stops at 160 , then the integrity of the specimen is gradually lost. At 235 , the two macroscopic cracks penetrate through the whole specimen, which finally leads to the composite shear–tensile damage of the specimen.
Figure 8 presents the main strain rupture evolution of a 30° pre-existing crack. It can be found that there is a local high strain around the crack tip of the 30° specimen at 10 , which increases as the load continues to advance; at 60 , the crack tip of the specimen produces a local strain concentration at roughly a certain angle with the loading direction; and with the further increase in the impact load at 140 , a small shear zone is formed in the strain concentration area, which is similar to that of the 0° specimen, with the appearance of the rock chip ejection phenomenon. At 140 , with the continuation of dynamic loading, an initial tensile crack starts to form in the small shear zone of the strain concentration area and expands to the loading end to form two macroscopic shear cracks; at the same time, tensile cracks generate in the distal end of the crack, which terminate at 160 , and the integrity of the specimen is lost. At 235 , the two macroscopic shear cracks and the far-field tensile crack penetrate through the whole specimen, which ultimately leads to the composite shear–tensile damage of the specimen.
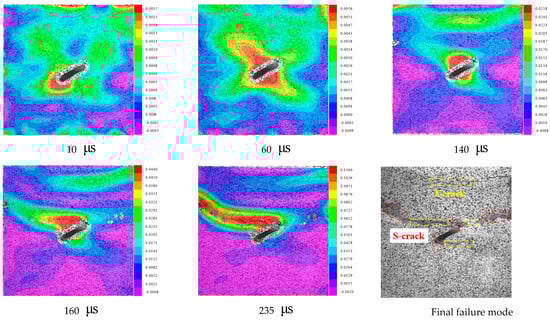
Figure 8.
The principal strain fracture evolution of a 30° pre−existing crack.
Figure 9 shows the main strain rupture evolution of a 45° pre-existing crack. It can be found that there is a local high strain around the tip of the 45° specimen cleft at 20 , which increases as the load continues to advance; at 60 , the tip of the specimen cleft produces a local strain concentration at roughly a certain angle with the loading direction; and with the further increase in the impact load at 120 , a small shear zone is formed in the strain concentration area, and rock chip ejection phenomenon occurs at this time. With the continuation of dynamic loading, an initial shear crack starts to form in the small shear zone of the strain concentration area. At the same time, secondary coplanar cracks generate along the tip of the crack and expand to the loading end, which also produces tensile cracks at the distal end of the crack, and stop cracking at 165 , and the specimen gradually loses its integrity. At 235 , two macroscopic shear cracks and two secondary coplanar cracks penetrate through the far-field tensile cracks, which eventually leads to the composite shear–tensile damage of the specimen.
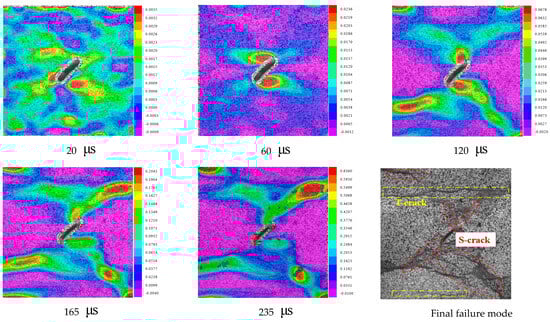
Figure 9.
The principal strain fracture evolution of a 45° pre−existing crack.
Figure 10 shows the main strain rupture evolution of a 60° pre-existing crack. It can be found that the damage process of the prefabricated 60° specimen is similar to that of the 45°; at 15 , there is a local high strain around the tip of the crack; at 60 , the strain gradually gathers to the position at a certain angle to the tip of the crack to form a strain concentration; at 120 , a small shear zone is formed in the strain concentration area, and the phenomenon of rock debris ejection occurs. With the continuous increase in loading, the shear zone forms a wing and anti-wing shear cracks. At the same time, secondary coplanar cracks develop along the tip of the fracture and expand towards the loaded end, and tensile cracks generate at the distal end of the fracture, which stop cracking at 160 , and the specimen gradually lose its integrity. At 235 , two macroscopic shear cracks and two secondary coplanar cracks penetrate through the far-field tensile cracks.
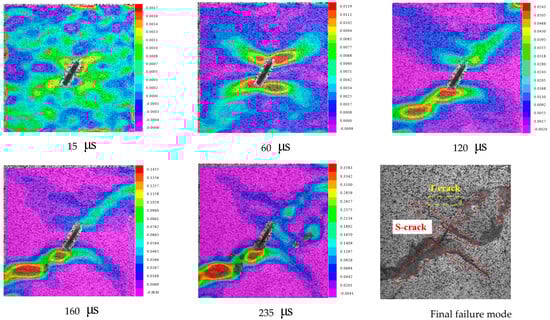
Figure 10.
The principal strain fracture evolution of a 60° pre−existing crack.
We can see from Figure 11 the main strain rupture evolution of a 90° pre-existing crack. It can be found that there is a local high strain around the middle of the fissure at 15 cracks; at 60 , the strain gradually gathers at an angle of 90° with the tip of the crack forming a strain concentration; at 120 , the rock chip ejection phenomenon occurs in the strain concentration area. With the continuous increase in the load, there are two initial tension cracks perpendicular to the tip of the crack, the initial tension cracks expand to the loading end, and after expanding for a certain distance, they turn into shear cracks. At the same time, tensile and shear cracks occur at the distal end of the crack which stop cracking at 160 , and the specimen gradually lose its integrity. At 235 , the two macroscopic composite cracks and the far-field cracks penetrate through the whole specimen, which ultimately leads to the tensile–shear composite damage of the specimen.
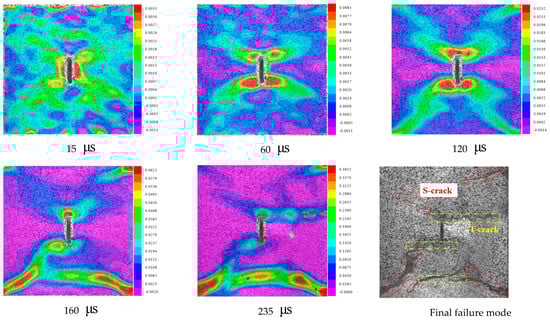
Figure 11.
The principal strain fracture evolution of a 90° pre−existing crack.
4. Research on Dynamic Failure Characteristics of Sandstone with Crack Defects under Initial Stress
In order to deeply investigate the dynamic failure characteristics of sandstone with crack defects under different conditions and to fully grasp the diversity of the problem, numerical analysis is used in this section. In the field of dynamic analysis, LS-DYNA is able to simulate complex problems such as the rapid impact of nonlinear structures, and it provides a variety of material models that can effectively respond to the dynamic response of rock under high strain rates such as impact, and these material models are often used to characterize the constitutive relationship of rocks [24,25]. Among them, the RHT constitutive equation involves the equations of the elastic limit surface, the failure surface, and the residual strength surface of the rock, which can reflect the damage characteristics of the rock qwll [26,27]. Therefore, the RHT constitutive equations were used to establish a numerical calculation model to analyze the dynamic failure characteristics of sandstone with crack defects under prestress.
4.1. Determination of RHT Model Parameters and Validation
4.1.1. Determination of RHT Parameters for Sandstone
The RHT constitutive model has a total of 38 parameters, due to the complexity of its parameter determination, most scholars can only directly quote the research results of Riedel et al. [28,29,30]. This leads to a certain difference between the simulation results and the experimental results. In order to ensure the accuracy of the simulation results, this study conducted physical measurements of the basic mechanical parameters of the sandstone in the experiment and combined the results of the previous research to theoretically derive other parameters [31,32].
- (1)
- Determination of basic strength parameters
The of sandstone was obtained through compression test, splitting test, and wave velocity test. Among them, the wave velocity of the rock was detected by a sonic test system picking an RSM-SY5 (T) non-metallic sonic detector, and the test process is shown in Figure 12.
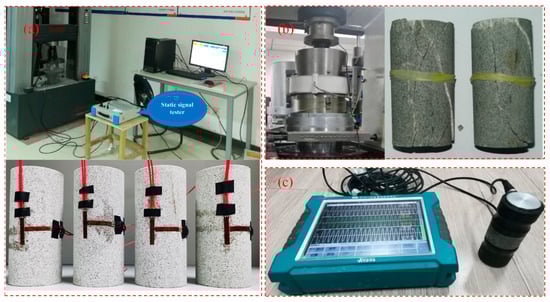
Figure 12.
Test process: (a) Uniaxial compression test; (b) Triaxial compression experiment; (c) Acoustic detection diagram.
The propagation speed of the ultrasonic wave can be read in the time window by adjusting the time scale of the sonic instrument to the first arrival time of the waveform. The measured wave speed is about 2700 m/s. The mechanical strength parameters as shown in Table 4 can be obtained according to the triaxial tests on sandstone in different surrounding rock.
Table 4.
Mechanical parameters under different confining pressures.
In Table 4, where , , , and MPa. We use the balance and mass method to obtain that , , , , , and , The basic mechanical parameters of the sandstone obtained after collation are shown in Table 5.
Table 5.
Static load mechanics parameters.
The shear and tensile strengths of the sandstone can be fitted according to the Hoek–Brown empirical Equations (10)–(12) to obtain the following.
In Equations (10) and (11), and are respectively the maximum principal stress and minimum principal stress when the rock body is damaged, is the degree of softness and hardness of the rock body, m = 15.44, and the fitting curve is presented in Figure 13. is the degree of fragmentation of the rock body, for the rock samples selected in the laboratory this can be considered to be the integrity of the rock, taking . In Equation (12), and are respectively the shear strength of the rock and the normal positive stress. Based on the experimental data in Table 5, we obtain the fitting curve as shown in Figure 14, where A’ = 1.23, B’ = 0.74, thus obtaining the values of shear strength of the rock to be , , .
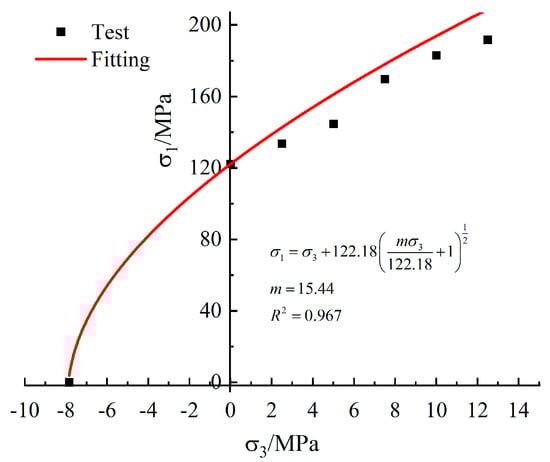
Figure 13.
Hoek−Brown strength formula fitting curve.
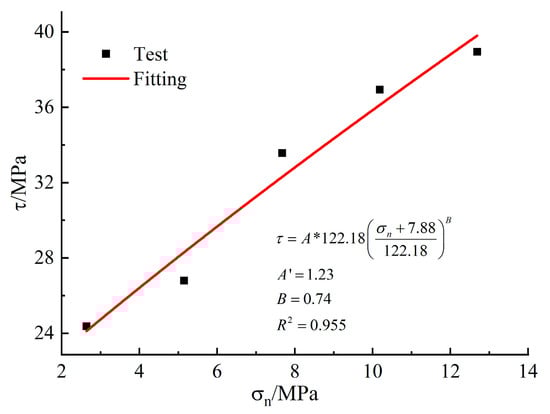
Figure 14.
fitting curve.
- (2)
- Determination of strength parameters of the failure surface
When the rock is under quasi-static loading conditions, , . The expression of its failure surface equation is as follows:
Substituting the data of Table 5 into Equation (13), fitting can obtain the failure surface parameters, and . In Figure 15, we plot the fitting curve. The determination of the and parameters is more complex, and these two parameters have less influence on the calculation results [33]; therefore, the values determined by the Lu and Tu [34] test can be referred to take, , .
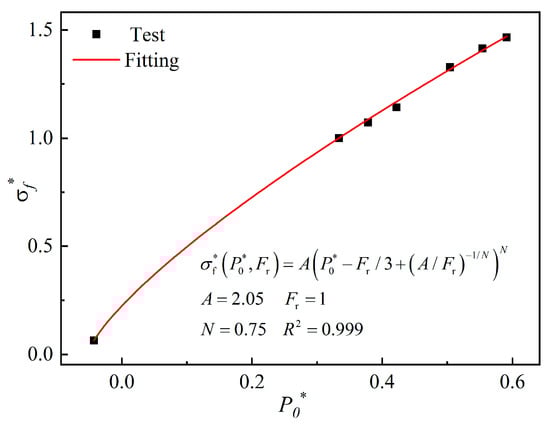
Figure 15.
Fitting curve of failure surface strength parameters.
- (3)
- Determination of p-α equation of state parameters
Brittle materials such as rock generally have many defects inside. When subjected to strong dynamic loads, the inside of the rock will be subjected to high hydro-static pressure and shear stress at the same time. In 1969, Herrman [35] proposed the equation of state by considering the role of the defects . From Figure 16, we can obtain the force process, and the relevant relationship expressed by Mie-Greisen is as shown:
where , , , and are state parameters of the equation, is an empirical parameter, as taken from [36], is the initial defect ratio, is the speed of sound in the rock when the pressure is zero, is the initial density, , , are the Rankine–Hugoniot polynomial coefficients, is assumed [37], and the compression index, , , .
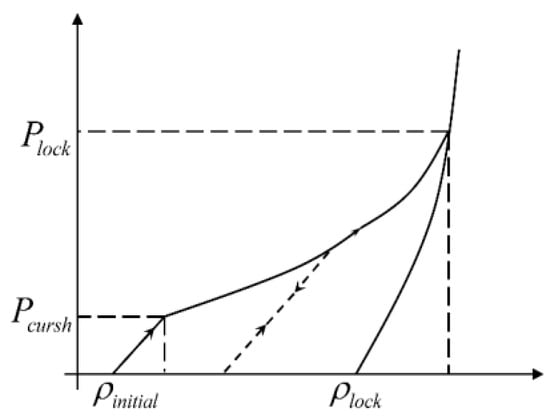
Figure 16.
Relationship between pressure and density.
- (4)
- Determination of strain rate parameters
The compressive strain rate index is , and the tensile strain rate index is . The residual strength surface parameters , , and the shear modulus reduction factor, , , , determined are extremely complex, taking the value cited in the literature 31. The values of the RHT intrinsic parameters of sandstone in this paper are detailed in Table 6.
Table 6.
Values of RHT constitutive parameters.
4.1.2. Establishment and Verification of Numerical Simulation
The SHPB dynamic compression numerical test is carried out according to the numerical specimen of the indoor impact test, and the simulation parameters are the same as the working conditions of the test. The morphology of sandstone damage and destruction, as well as the stress–strain characteristics of the specimen, are compared and verified with the test. Taking the 90° fracture group as an example, the size of the numerical specimen is the same as that of the SHPB test, and the numerical size of the rod is the same as that of the test: the length of the incident rod is 2200 mm, and the length of the transmission rod is 1800 mm, with a diameter of 50 mm, and the mesh size of the numerical specimen is 0.5 mm, and the size of the rod is 5 mm, see Figure 17 for details, and the contact mode is automatic face-to-face contact. For the pre-processing session, the LS-DYNA software is used in this paper for modeling and meshing to generate the required k-files. Subsequently, the k-files were modified and computationally set up in LS-PrePost as necessary. To control the boundary conditions, the *BOUNDARY_SPC_SET keyword is used to constrain the six degrees of freedom of the transmissive rod. In terms of circumferential pressure loading, the dynamic relaxation method (ramp loading) is adopted in this paper to avoid the non-convergence problem in the computational process. In particular, the loading air pressure of the dynamic shock is set to 0.18 MPa. Firstly, this paper applies the initial stress using the ramp load, and then based on the time–stress curve at 0.18 MPa (shown in Figure 4a), the loading is applied on the incident bar by the LOAD_SEGMENT_SET keyword.

Figure 17.
Crack model grid diagram.
Firstly, compared with the failure pattern of the indoor impact test, the damage cloud represents the destruction region, and the damage value interval is in the interval of 0 to 1. When the value of the damage cloud is 1, it represents the complete destruction of the area. The damage cloud is shown in Figure 18a and compared with the test result in Figure 18b. The law of the damage fracture destruction area is basically the same, which indicates that the results of this numerical calculation are valid.
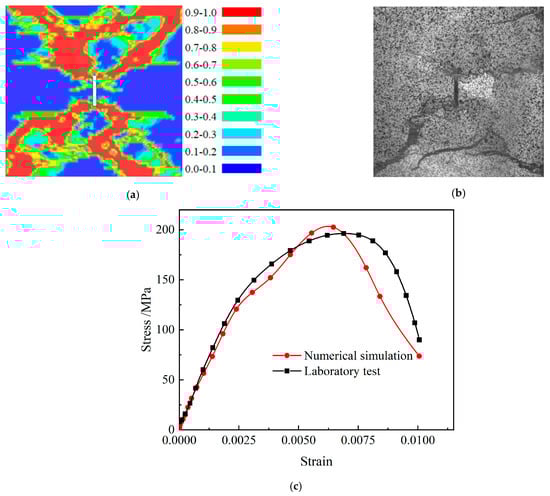
Figure 18.
Damage failure diagram: (a) Numerical result; (b) Test result; (c) Stress−strain characteristics.
Figure 18c shows the stress–strain curves of the specimens from the laboratory test and the numerical test results. From the peak intensity and the direction of the curves, the results of the numerical simulation are in good agreement with the test. This indicates that the calibrated RHT intrinsic parameters are reliable, and in combination with the above-mentioned specimen damage morphology, the modeling tests carried out by the crack group are accurate and reliable.
4.2. Damage and Strength Law of Crack Sandstone under Confining Pressure Effect
Using the validated numerical model, the perimeter pressure was set to 15 MPa and 30 MPa to initialize the stresses in the sandstone model with different angles of crack, and the initialized stress distribution diagrams were obtained as seen in Figure 19a and Figure 20a, compared with the perimeter pressure of 15 MPa. The perimeter pressure of 30 MPa increases the distribution of the stress values; the diagrams show the stress concentration around the crack clearly, the maximum value of the initial stress appears at the tip of the crack, and the minimum value is approximately perpendicular to the direction of the crack. This indicates that the direction perpendicular to the crack is usually in the region of compressive stress concentration under peripheral pressure, and the direction along the crack is in the region of tensile stress concentration, of which the initial stress values are the largest at the crack inclination angles of 30° and 45°.
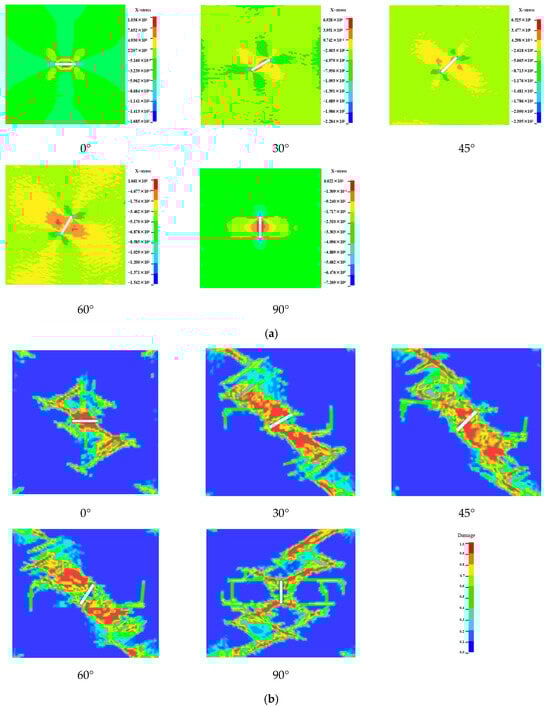
Figure 19.
Confining pressure 15 MPa: (a) Initial stress map; (b) Final damage map.
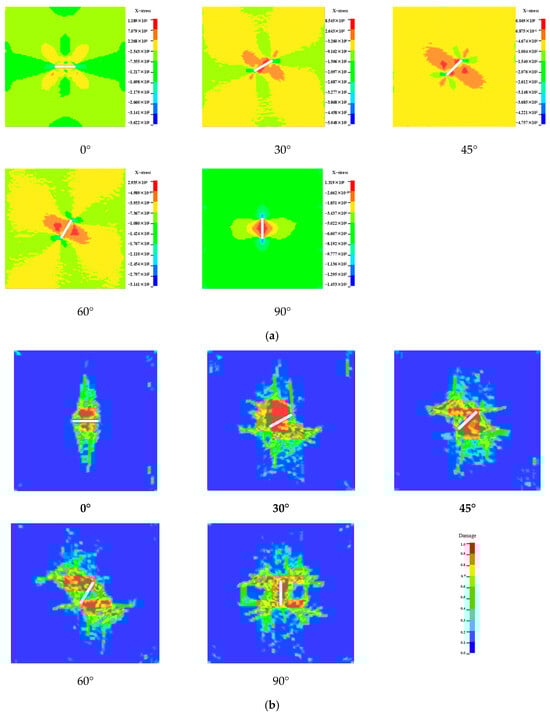
Figure 20.
Confining pressure 30 MPa: (a) Initial stress map; (b) Final damage map.
By SHPB impact on the initial stressing numerical specimen model, the damage distribution of the rock with cracks is obtained as shown in Figure 19b and Figure 20b. Compared with the observation of the damage morphology of the specimen crack of the SHPB impact test, it is found that the damage morphology of the specimen crack has an obvious peri-compression effect, and peri-compression changes the distribution of the damage zones in the specimen with a crack under the impact action. With the increase in the peripheral pressure, the damage degree near the crack increases, but the damage area decreases; except for the 0° and 90° specimens’ crack under the peripheral pressure of 15 MPa, the damage area under other conditions is approximately perpendicular to the direction of the crack.
The damage of the 0° fracture specimen under 15 MPa is concentrated at the middle of the fracture and develops towards the end of the fracture, while the damage of the 90° fracture specimen under 15 MPa is concentrated at the end of the fracture and develops towards the direction of the fracture.
Under the constant incident wave, the strength values of the numerical specimens with cracks under different peripheral pressure conditions were extracted. Figure 21 plots the relationship with the crack angle.
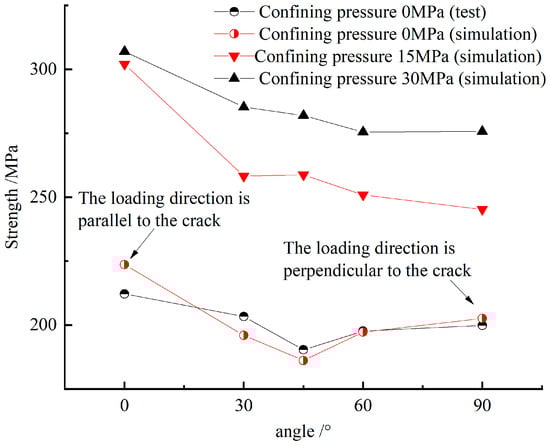
Figure 21.
Strength variation in fractured sandstone under confining pressure.
It is found that the strength of the fissure-containing specimens has an obvious peripheral pressure effect, and the higher the peripheral pressure is, the greater the strength is; the strength of the fissure-containing numerical specimens in the state of peripheral pressure is basically the same as that of the specimens without peripheral pressure, both decreasing with increasing angle, except for an anomalous result at 45°. The analysis suggests that the strength may be related to the destruction angle of the rock material, as the presence of peripheral pressure changes the final destruction angle of the rock, and the inevitable factors during the testing process may also contribute to this.
4.3. Damage and Strength Law of Crack Sandstone under Axial Pressure Effect
Using the same validated numerical models, the axial pressure was set to two levels: 7.5 MPa and 15 MPa, to initialize the stress of the sandstone model with crack defects. The stress distribution after initialization is shown in Figure 22a and Figure 23a.
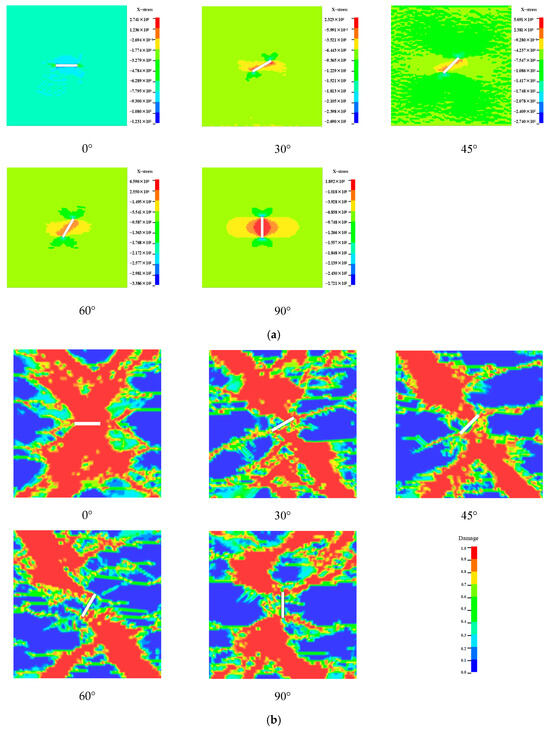
Figure 22.
Axial compression 7.5 MPa: (a) Initial stress map; (b) Final damage map.
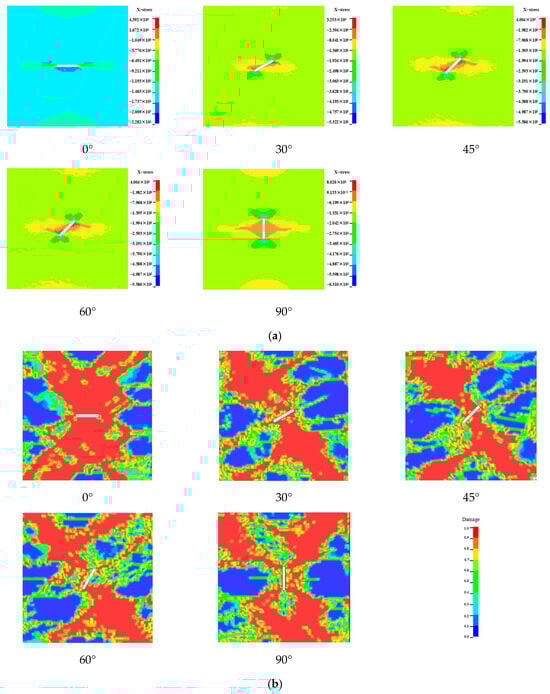
Figure 23.
Axial compression 15 MPa: (a) Initial stress map; (b) Final damage map.
This shows that compared with the axial pressure of 7.5 MPa, the distribution of stress values are enlarged by 15 MPa, and the diagrams clearly show the concentration of the stress around the crack; the maximum value of the initial stress appeared at the location of the tip of the crack, and the minimum value was distributed along the axial direction. This indicates that the axial direction under axial pressure is usually in the compressive stress concentration area, while the cleft end is in the tensile stress concentration area, in which the initial stress value is the largest for the cleft inclination angle of 60°.
SHPB impact was carried out on the numerical specimen model with initial stress, and the damage distribution of the rock was obtained as shown in Figure 22b and 23b. Figure 23a shows the initial stress diagram under axial compression of 15 MPa.
Compared with the observation of the damage morphology of the crack specimen, it is found that the damage morphology of the crack specimen has an obvious axial pressure effect, and with the increase in axial pressure, the damage degree near the crack is increased, the range area of the damage zone is increased, and the damage zones at different crack angles are approximately perpendicular to the direction of the crack and distributed at the two ends of the crack direction.
We extract the strength values of the fracture-containing numerical specimens under each axial pressure condition and plot the relationship with the fracture angle in Figure 24.
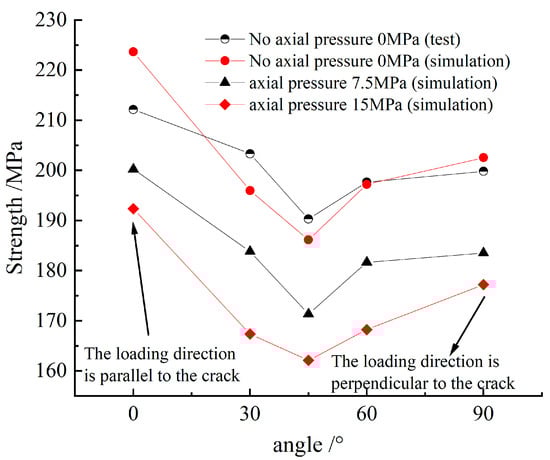
Figure 24.
Strength variation in fractured sandstone under axial compression.
It is observed that the strength of the fracture-containing specimens has an obvious axial pressure effect, and the higher the axial pressure is, the smaller the strength is, the strength of the fracture-containing numerical specimens under the axial pressure is basically the same as that under the absence of axial pressure. And with the increase in the angle, the strength is lowered, and the strength of the specimens as a whole shows a tilted V-trend attenuation, which means that the dynamic compressive strength is sorted in the order of 0° > 30° > 90° > 60° > 45°.
4.4. Stress Field Pattern of Crack Sandstone under Initial Stresses
In order to further quantitatively describe the effect of initial stress on the damage of the cracked defective rock, we monitor the unit around the pre-existing crack, and due to space limitations, the specimen with the perimeter pressure of 15 MPa and the crack inclination angle of 45° is taken as an example for the detailed analyses here; in Figure 25, we can see the arrangement of the monitoring points, with a total of eight monitoring points.
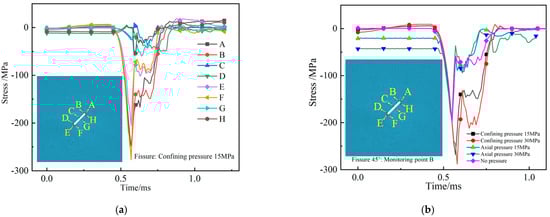
Figure 25.
Stress–time curve of fractured sandstone monitoring points: (a) Different monitoring points; (b) Different initial stresses.
In Figure 25a, it is clearly seen that roughly 0.5 ms before is the initial stress action stage, after 0.5 ms is the joint action stage of the impact stress wave and the initial peripheral pressure, the stress increases and then decreases, and finally the loading ends when it is small enough to be the initial stress.
The curve patterns at different monitoring points are approximately consistent, with the stress value at F > B > A > E > G > H > D > C, and the stress values are the largest at monitoring point B and monitoring point F, with similar curves, approximately 270 MPa. The stress values at monitoring points C, D, G, and H are all less than 60 MPa, of which the stress value at monitoring point C is the smallest, about 38 MPa, and the distribution law of stress further explains the damage distribution law of the rock.
Taking the monitoring point B with the largest stress value as an example, the stress curves of monitoring point B under different initial stresses appear in Figure 25b, and the change rule of stress value with time at monitoring point B under different initial stresses is approximately the same.
The larger the peripheral pressure, the larger the stress peak value of the monitoring point, and the larger the axial pressure, the smaller the stress peak value. When the peripheral pressure is 15 MPa and 30 MPa, the stress values of monitoring point B are 268 MPa and 288 MPa, respectively; while the axial pressure is 7.5 MPa and 15 MPa, the stress values at point B are 200 MPa and 189 MPa, respectively, which are close to the stress values without pressure. Therefore, the perimeter pressure contributes the most to the stress peak value at monitoring point B.
5. Discussion and Conclusions
5.1. Discussion
When the fissure angle is 45° from the impact direction, the energy dissipation rate is large, the transmittance is small, and the fissure weakens the rock mass to the greatest extent for the high-strength sandstone rock mass. The reasonable arrangement of the impact direction in engineering construction can improve the efficiency of rock breaking and save costs. When the fissure angle is 0° with the impact direction, the fissure weakens the rock mass to the least extent, which is conducive to exerting the bearing capacity of the rock mass itself in this kind of project.
Engineers need to develop different reinforcement strategies based on the angle of the fissure in the actual project reinforcement. The 0° region requires higher shear strength materials and reinforcement due to significant shear failure; tensile failure is significant in the 30° region and the lining needs to be strengthened for tensile resistance; the 45° and 60° regions are prone to shear and tensile cracking and require composite reinforcement. However, special attention needs to be paid to the change in failure modes and to the preparation of emergency measures in the 90° zone in order to ensure the safety and stability of the works.
Numerical analysis based on the RHT model can be combined with actual engineering monitoring data for real-time visualization of the stress state and damage level of the rock. Whenever the monitoring data are abnormal, an early warning can be issued in time so that appropriate countermeasures can be taken. In addition, understanding the peak strength and damage change rules of rocks under different confining and axial pressure conditions helps engineers to more accurately assess the bearing capacity of rocks in design and construction. Especially in underground engineering (e.g., tunnels, mines) or slope engineering, the above results may help to determine reasonable support measures and excavation sequences.
5.2. Conclusion
- (1)
- Fracture defects with different inclinations have significant effects on the dynamic mechanical parameters and energy of sandstone. With the increase in fracture angle, the compressive strength and deformation modulus first decrease and then increase and become a “V”-shaped distribution. Compressive strength is the highest at 0° sandstone and lowest at the 45° angle; the strain rate and energy dissipation rate are both distributed in an “N” shape, with the highest at an angle of 45°. The overall trend of transmittance is decaying, contrary to the pattern of transmittance.
- (2)
- Fracture angle significantly affects crack initiation, extension, penetration, and failure patterns. The damage process is similar for specimens at different angles, but the dominant damage type varies. Shear failure dominated the 0° specimens and tensile failure dominated the 30° specimens; the 45° and 60° specimens, on the other hand, produced initial shear cracks and secondary coplanar cracks, whereas the 90° specimens showed predominantly tensile failure, which was later converted to shear failure. The initial crack initiation location was approximately perpendicular to the pre-existing fissure direction for all specimens except the 30° specimen.
- (3)
- The RHT numerical calculation model damage and strength law is highly consistent with the indoor test results, which verifies the validity of the numerical model. With the increase in fracture angle, the peak strength under the confining pressure effect shows an overall trend of attenuation, and the peak strength under the axial pressure effect becomes a “V”-shaped distribution. The peak strength of specimens with different defect types increases with increasing perimeter pressure and decreases with increasing axial pressure; confining pressure contributes to the peak unit stress, while axial pressure contributes essentially nothing to the peak unit stress. The extent of damage was negatively correlated with confining pressure values and positively correlated with axial pressure values. The damage zones of specimens with crack defects at different inclination angles are approximately perpendicular to the direction of the crack and are distributed at both ends of the crack direction.
Author Contributions
H.-Y.Z.: numerical simulation, writing—original draft; D.-S.L.: data curation, methodology; Z.-H.G.: investigation, writing—original draft; E.-A.C.: validation, investigation; J.-Y.R.: funding acquisition, formal analysis; T.H.: writing—review and editing. All authors have read and agreed to the published version of the manuscript.
Funding
This research was funded by the National Natural Science Foundation of China, grant number 51608141, by Guizhou Provincial Department of Transportation 2024 Science and Technology Project Implementation Plan, grant number 2024-122-06, and by the Guizhou Highway Engineering Group Science and Technology Project, grant number YF2023-09-01.
Data Availability Statement
The data that support the findings of this study are available from the corresponding author, [Zhenghua Gao], upon reasonable request.
Conflicts of Interest
Author Hou-You Zhou was employed by the company Gui Zhou Highway Engineering Group Co., Ltd. Author En-An Chi was employed by the company Poly Union Group Co., Ltd. Author Tao Hu was employed by the company Guizhou Communications Construction Group Co., Ltd. The remaining authors declare that the research was conducted in the absence of any commercial or financial relationships that could be construed as a potential conflict of interest.
References
- Wang, J.; Chen, L.; Su, R.; Zhao, X. The Beishan underground research laboratory for geological disposal of high-level radioactive waste in China: Planning, site selection, site characterization and in situ tests. J. Rock Mech. Geotech. Eng. 2018, 10, 411–435. [Google Scholar] [CrossRef]
- Zhao, J.; Zhou, Y.; Hefny, A.; Cai, J.; Chen, S.; Li, H.; Liu, J.; Jain, M.; Foo, S.; Seah, C. Rock dynamics research related to cavern development for Ammunition storage. Tunn. Undergr. Space Technol. 1999, 14, 513–526. [Google Scholar] [CrossRef]
- Li, Y.; Lei, X.; Wang, N.; Ren, Y.; Jin, X.; Li, G.; Li, T.; Ou, X. Study on the failure characteristics of overburden and the evolution law of seepage field in deep buried thick coal seam under aquifers. Nat. Hazards 2023, 118, 1035–1064. [Google Scholar] [CrossRef]
- As’Habi, F.; Lakirouhani, A. Numerical modeling of jointed rock samples under unconfined and confined conditions to study peak strength and failure mode. Arab. J. Geosci. 2021, 14, 174. [Google Scholar] [CrossRef]
- Gao, Z.H.; Li, Q.; Huang, C.; Zhao, T.-D.; Yu, B.-B.; Liu, S.-K. Investigation on Mechanical and Failure Characteristics of Sandstone with Flaw. Geotech. Geol. Eng. 2023, 42, 2169–2183. [Google Scholar] [CrossRef]
- Zhang, Z. Principles and Applications of Rock Failure; Metallurgical Industry Press: Beijing, China, 1994. (In Chinese) [Google Scholar]
- Zhou, Z.; Sun, J.; Wang, H.; Guo, Y. Strain evolution and failure characteristics of porous granite under impact load. J. Cent. South Univ. Nat. Sci. Ed. 2021, 52, 681–692. (In Chinese) [Google Scholar]
- Chen, D.; Zeng, S.; Ren, P.; Liu, J. Dynamic characteristics of red sandstone under impact load. China Min. Mag. 2019, 28, 139–143+148. [Google Scholar]
- Wang, Q.; Wu, B.; Liu, F.; Yuan, W. Experimental study on dynamic compression failure of prefabricated fissure slabs of rock-like materials. Chin. J. Rock Mech. Eng. 2018, 37, 2489–2497. [Google Scholar]
- Wang, Q.; Xia, K.; Wu, B.; Xu, Y.; Liu, F. Experimental study on dynamic failure of prefabricated parallel double-jointed rock plates. J. Tianjin Univ. Nat. Sci. Eng. Technol. 2019, 52, 1099–1108. [Google Scholar]
- Li, D.; Han, Z.; Sun, X.; Zhou, T.; Li, X. Dynamic mechanical properties and fracturing behavior of marble specimens containing single and double flaws in SHPB tests. Rock Mech. Rock Eng. 2018, 52, 1623–1643. [Google Scholar] [CrossRef]
- Li, D.; Han, Z.; Sun, X.; Zhou, T.; Li, X. Experimental study on dynamic mechanical failure characteristics of marble with precast fracture. Chin. J. Rock Mech. Eng. 2017, 36, 2872–2883. [Google Scholar]
- Li, Q.; Gao, Z.H.; Xu, W.L.; Wang, K.; Liu, S.; Ran, G.-F.; Hu, Y. Experimental research on the dynamic propagation process of mode I cracks in the rock under directional fracture blasting using the strain gauge method. Eng. Fract. Mech. 2020, 235, 107113. [Google Scholar] [CrossRef]
- Li, Q.; Gao, Z.H.; Yu, Q.; Huang, C.; Wang, K.; Xu, W.-L. Effect of Explosive Stress Waves on the Crack Propagation in the Defective Medium Using Strain Gauge Method. KSCE J. Civ. Eng. 2022, 26, 2780–2788. [Google Scholar] [CrossRef]
- Feng, P.; Xu, Y.; Dai, F. Effects of dynamic strain rate on the energy dissipation and fragment characteristics of cross-fissured rocks. Int. J. Rock Mech. Min. Sci. 2021, 138, 104600. [Google Scholar] [CrossRef]
- Zhou, Y.X.; Xia, K.W.; Li, X.B.; Li, H.B.; Ma, G.W.; Zhao, J.; Zhou, Z.; Dai, F. Suggested methods for determining the dynamic strength parameters and mode-I fracture toughness of rock materials. Int. J. Rock Mech. Min. Sci. 2011, 49, 105–112. [Google Scholar] [CrossRef]
- Pan, B.; Qian, K.M.; Xie, H.M.; Asundi1, A. Topical review: Two-dimensional digital image correlation for in-plane displacement and strain measurement: A review. Meas. Sci. Technol. 2009, 20, 152–154. [Google Scholar] [CrossRef]
- Li, X. Fundamentals and Applications of Rock Dynamics; Science Press: Beijing, China, 2014. (In Chinese) [Google Scholar]
- Blaber, J.; Adair, B.; Antoniou, A. Ncorr: Open-Source 2D Digital Image Correlation Matlab Software. Exp. Mech. 2015, 55, 1105–1122. [Google Scholar] [CrossRef]
- Cong, Y.; Yuan, H.; Abi, E.; Han, Y.; Li, H.; Pu, Y. Deformation and acoustic emission characteristics of hard rock under different unloading rates. Alex. Eng. J. 2023, 77, 581–591. [Google Scholar] [CrossRef]
- Huang, P.; Zhang, J.; Damascene, N.J.; Dong, C.; Wang, Z. A fractional order viscoelastic-plastic creep model for coal sample considering initial damage accumulation. Alex. Eng. J. 2021, 60, 3921–3930. [Google Scholar] [CrossRef]
- Tian, W.; Yu, C.; Wang, X.; Wu, P. Study on dynamic mechanical properties and energy dissipation of 3D printed fractured rock mass. Chin. J. Rock Mech. Eng. 2019, 41, 446–456. [Google Scholar]
- Wang, W.; Li, K.; Wang, X.; Jiang, H.; Yan, Z. Mechanical properties of rock-like samples with fractures of different inclination angles under SHPB loading. Sci. Technol. Rev. 2016, 34, 246–250. [Google Scholar]
- Zhang, Z.; Sun, J.; Jia, Y.; Yao, Y.; Jiang, N. Blasting effects of the borehole considering decoupled eccentric charge. Alex. Eng. J. 2024, 88, 116–125. [Google Scholar] [CrossRef]
- Yang, P.; Pang, D.; Liu, J.; Huang, Z.; Xu, W.; Dou, Z. Experiment on deformation and failure characteristics of sandstone at different unloading rates. Alex. Eng. J. 2023, 75, 209–219. [Google Scholar]
- Ma, S.; Liu, K.; Yang, J. Investigation of blast-induced rock fragmentation and fracture characteristics with different decoupled charge structures. Int. J. Impact Eng. 2024, 185, 104855. [Google Scholar] [CrossRef]
- Yin, Q.; Zhu, Q.; Deng, T.; Yu, L.; Li, M.; Liu, H.; Jing, H. Assessment on dynamic mechanical responses and failure behaviors of horizontal/vertical bedded sandstone. Environ. Earth Sci. 2023, 82, 27. [Google Scholar] [CrossRef]
- Riedel, W.; Thoma, K.; Hiermaier, S.; Schmolinske, E. Penetration of reinforced concrete by BETA2B2500 numerical analysis using a new macroscopic concrete model for hydracodes. In Proceedings of the 9th International Symposium, Interaction of the Effects of Munitions with Structures, I13 MAC. Berlin-Strausherg, Germany, 3 May 1999; Volume 315, p. 322. [Google Scholar]
- Wang, Z.; Wang, H.; Wang, J.; Tian, N. Finite element analyses of constitutive models performance in the simulation of blast-induced rock cracks. Comput. Geotech. 2021, 135, 104172. [Google Scholar] [CrossRef]
- Xie, L.X.; Lu, W.B.; Zhang, Q.B.; Jiang, Q.H.; Chen, M.; Zhao, J. Analysis of damage mechanisms and optimization of cut blasting design under high in-situ stresses. Tunn. Undergr. Space Technol. 2017, 66, 19–33. [Google Scholar] [CrossRef]
- Pan, C.; Xie, L.-X.; Li, X.; Liu, K.; Gao, P.-F.; Tian, L.-G. Numerical investigation of effect of eccentric decoupled charge structure on blasting-induced rock damage. J. Cent. South Univ. 2022, 29, 663–679. [Google Scholar] [CrossRef]
- Li, S.; Ling, T.; Liu, D.; Liang, S.; Zhang, R.; Huang, B.; Liu, K. Determination of Rock Mass Parameters for the RHT Model Based on the Hoek–Brown Criterion. Rock Mech. Rock Eng. 2023, 56, 2861–2877. [Google Scholar] [CrossRef]
- Li, H.; Chen, Y.; Liu, D.; Huang, H.; Zhao, L. Sensitivity of main parameters and determination methods of rock RHT model. J. Beijing Inst. Technol. 2018, 38, 779–785. [Google Scholar]
- Tu, Z.G.; Lu, Y. Modifications of RHT material model for improved numerical simulation of dynamic response of concrete. Int. J. Impact Eng. 2010, 37, 1072–1082. [Google Scholar] [CrossRef]
- Herrmann, W. Constitutive Equation for the Dynamic Compaction of Ductile Porous Materials. J. Appl. Phys. 1969, 40, 2490–2499. [Google Scholar] [CrossRef]
- André, M.M. Dynamic Behavior of Materials; John Wiley & Sons, Inc.: Hoboken, NJ, USA, 1994. [Google Scholar]
- Holmquist, T.J.; Johnson, G.R. A Computational Constitutive Model for Glass Subjected to Large Strains, High Strain Rates and High Pressures. J. Appl. Mech. 2011, 78, 051003. [Google Scholar] [CrossRef]
Disclaimer/Publisher’s Note: The statements, opinions and data contained in all publications are solely those of the individual author(s) and contributor(s) and not of MDPI and/or the editor(s). MDPI and/or the editor(s) disclaim responsibility for any injury to people or property resulting from any ideas, methods, instructions or products referred to in the content. |
© 2024 by the authors. Licensee MDPI, Basel, Switzerland. This article is an open access article distributed under the terms and conditions of the Creative Commons Attribution (CC BY) license (https://creativecommons.org/licenses/by/4.0/).