Abstract
The applications of artificial intelligence (AI) and natural language processing (NLP) have significantly empowered the safety and operational efficiency within the aviation sector for safer and more efficient operations. Airlines derive informed decisions to enhance operational efficiency and strategic planning through extensive contextual analysis of customer reviews and feedback from social media, such as Twitter and Facebook. However, this form of analytical endeavor is labor-intensive and time-consuming. Extensive studies have investigated NLP algorithms for sentiment analysis based on textual customer feedback, thereby underscoring the necessity for an in-depth investigation of transformer architecture-based NLP models. In this study, we conducted an exploration of the large language model BERT and three of its derivatives using an airline sentiment tweet dataset for downstream tasks. We further honed this fine-tuning by adjusting the hyperparameters, thus improving the model’s consistency and precision of outcomes. With RoBERTa distinctly emerging as the most precise and overall effective model in both the binary (96.97%) and tri-class (86.89%) sentiment classification tasks and persisting in outperforming others in the balanced dataset for tri-class sentiment classification, our results validate the BERT models’ application in analyzing airline industry customer sentiment. In addition, this study identifies the scope for improvement in future studies, such as investigating more systematic and balanced datasets, applying other large language models, and using novel fine-tuning approaches. Our study serves as a pivotal benchmark for future exploration in customer sentiment analysis, with implications that extend from the airline industry to broader transportation sectors, where customer feedback plays a crucial role.
Keywords:
natural language processing; machine learning; sentiment analysis; airline customer service MSC:
62P25
1. Introduction
Social media platforms play a pivotal role as communication conduits between customers and airlines. Airlines increasingly rely on customer reviews and feedback as valuable inputs for assessing service quality and operational effectiveness. Also, such data provide actionable insights to guide airlines’ strategic decision-making, improve service quality and customer satisfaction, and ultimately increase profitability [1,2,3]. However, the analysis of vast amounts of existing contextual data, coupled with continual daily updates, presents a labor-intensive challenge [4]. The rapid advancements in machine learning technologies, particularly in natural language processing (NLP), have significantly facilitated the big analysis of data in recent years [5,6,7]. Various studies have shown the effectiveness of large language models (LLMs) such as BERT (bidirectional encoder representations from transformers) and GPT (generative pre-trained transformers) in analyzing and classifying the sentimental contextual information of the text [8,9]. However, limited studies focused on the applications of advanced machine learning models in analyzing airline customer sentiment.
In this study, we aimed to explore the uncharted territory of the LLM applications in supporting aviation business and the decision-making process, specifically by a closer examination of how BERT and its variations perform in airline customer-feedback sentiment analysis. With enhanced pre-training and a more intricate algorithmic architecture, BERT is expected to outperform traditional machine learning models in this domain. We hypothesize that specific BERT variants, with proper training approaches or modifications, can perform even better in classifying sentimental information in a corpus of text.
2. Related Works
2.1. Customer Feedback Analysis
Customer reviews and feedback are essential to an airline’s public reputation, operational efficiency, and strategic planning. Several studies concluded that service quality significantly influences US airline’s return on investment (ROI) [1,2,3,10,11,12]. In a recent study by Wu and Gao [13], a support vector machine (SVM) was employed and trained as a binary classifier to predict whether a tweet was positive or negative in its sentimental values. This study used Kaggle’s airline customer sentiment dataset, extracted from Twitter in 2015, excluding instances labeled as ‘Neutral.’ Wu and Gao’s study achieved the highest accuracy (91.86%) among the studies reviewed in Table 1, based on the assumption that all testing data are distinctly polarized, being categorized as either positive or negative.

Table 1.
Summary of existing studies in airline customer review analysis.
In a parallel study, Patel et al. [8] applied BERT to the identical tweet dataset from Kaggle. Incorporating the ‘Neutral’ labels, they transformed it into a three-class multi-classification task and yielded the highest performance at 83% among all tested traditional classifiers. These findings highlight the ongoing shortcomings in research, particularly in developing models capable of high-accuracy multi-class classification and leveraging state-of-the-art transformer-based models in such tasks.
2.2. Natural Language Processing (NLP) and Natural Language Understanding (NLU)
Natural language processing (NLP), a subset of machine learning (ML), facilitates the interpretation of human language by machines. Early algorithms involving online text retrieval, splitting, spell-checking, and word counts have relied on textual representation. Still, NLP aims to release manual labor and reduce the time cost by efficiently analyzing extensive textual data through a higher-level symbolic representation and processing capability, using a statistically based method that uncovers semantic information for language understanding [18]. NLP research started as early as the 1950s, focusing on tasks like translation, information retrieval, content analysis, etc. A wide range of research has been conducted in such areas. Later algorithms that seek a higher-level representation include neural and non-neural methods [19]. Non-neural models focused on a statistical aspect of representation and distribution. One of the key founding works of these models is Brown clustering, which proposed a statistical language model that characterizes words into probabilistic-determined classes to interpolate N-gram probabilities. This approach solved the sparsity issue in traditional language models, leading to a more accurate and robust framework for NLP tasks [19].
Emerging around 2013, neural models eschewed manual feature crafting and rule-based algorithms in favor of self-supervised learning to learn features from data and obtain a more robust and nuanced understanding of language, such as word2vec and GloVe [20,21]. Distinguishing from previous traditional classifier models that are shallow and work with features or outputs that are explicitly definable by mathematical equations, neural models are commonly categorized as ‘Deep Learning’, specifically because of the neural network architecture nature and their multi-layer structure [22].
2.3. BERT
Bidirectional encoder representations from transformers, also known as BERT, first introduced by Devlin et al. [23] from Google, marked a new era in natural language processing.
BERT is a transformer-based machine learning technique for pre-training natural language processing (NLP). Transformer architecture processes all tokens in the input sequence at once and can process correlations of words and sentences in text input from a long range. This feature allows transformers to process and train faster than other models and perform better in context comprehension [23].
The cornerstone of the robust capability of the transformer is the attention mechanism, first introduced by Vaswani [24], which aims to solve the limitation of long-sequence handling for recurrent neural networks (RNN). It calculates attention scores between all elements in the input sequence and the current element and then has the score pass through a Softmax layer, outputting attention weights. The attention weights of all elements are then used to calculate a weighted sum and output a final context vector, allowing transformers to capture both short-range and long-range dependencies in the long corpus of text.
Equation (1) shows the calculation of the attention score.
where Q represents the query matrix, K represents the key matrix, V represents the value matrix, is the dimensionality of the keys (and queries).
2.4. Fine-Tuning
The application of pre-trained transformer models like BERT for sentimental analysis and classification tasks necessitates fine-tuning BERT, a process that presents several challenges. Fine-tuning involves modifying the pre-trained BERT model to align it with the specific requirements of the task in question. This process demands meticulous attention to maintain a balance between the general language comprehension inherent in the pre-trained model and the task-specific functioning requirement.
Sun et al. [25] delved into fine-tuning strategies for BERT in text classification tasks and explored the possibility of using fine-tuned versions of GPT to serve the purpose of text sentimental value classification by extending its existing capability in natural language understanding towards a more thorough representation of the task. In text classification, Softmax layers are utilized to retrieve the probability of class membership for a given data observation by feeding the model with the first token of the sequence’s final hidden state. When applied to a downstream task, BERT can autonomously update its weights and configure the output layer to meet the task-specific requirement. For example, a Softmax layer is used for multi-label classification or a sigmoid layer is used for binary classification.
Equations (2) and (3) show Softmax and sigmoid functions in mathematical terms.
3. Methods
In our study, we used BERT and its variants (DistilBERT, RoBERTa, and ALBERT) to perform a sentimental classification of airline customer reviews and determine the most optimal model based on metrical performance measurements. The performance of these models was gauged using metrics that included accuracy, precision, recall, and the F-1 score.
Kaggle’s Twitter customer feedback sentiment dataset was adopted to test the proposed models for a performance comparison in this study. This dataset has been widely used for model performance testing in several relevant studies [7,8,13].
The overall process is shown in Figure 1. Initially, we processed the text input through the tokenizer tailored for the corresponding model. Subsequently, the encoded text was transformed into a tensor dataset, which served as the input for the classification model. Logits generated by the classification model, then, were converted into classified labels, which were finally assessed by metric performance.

Figure 1.
Methodology overview.
3.1. Model Performance Evaluation
Accuracy, precision, recall, and the F-1 score, which align well with our sentiment analysis and classification, were used to evaluate the model’s performance. The confusion matrix is presented in Figure 2.
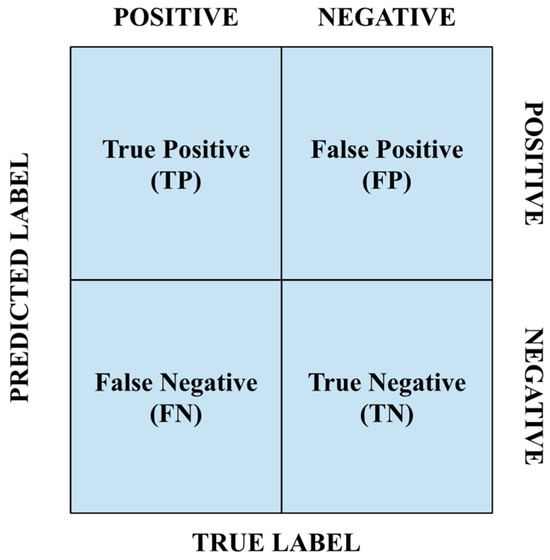
Figure 2.
Confusion matrix.
The mathematical expressions of the evaluation metrics are defined below:
Accuracy is a fundamental measure that provides us with a holistic view of how well the model performs across all classes. Nevertheless, within the context of imbalanced datasets, accuracy might yield an excessively favorable portrayal of the model’s performance. To mitigate this issue, we integrated both precision and recall into our evaluation framework. Precision quantifies the proportion of true ‘positive’ predictions among all ‘positive’ predictions generated by the model. This metric helped us understand how many predicted ‘positive’ sentiments were correct.
Recall measures the proportion of true ‘positive’ predictions relative to the total actual positives, providing us insights into how many total positive sentiments were captured by the model. Finally, the F-1 score balances the trade-off between precision and recall, providing a single metric that encapsulates model performance regarding both aspects. It is useful to achieve a balance between precision and recall while there is an uneven class distribution. Integrative use of the metrics helped us comprehensively evaluate the performance of our models.
Learning curves were employed to visualize the training loss over the epochs. We initiated and trained the models on two downstream tasks: binary and three-class classifications. This process is expected to allow BERT to fine-tune its weights and stabilize its performance. The comparative plots of “training vs. validation loss learning curve” across learning curves are presented in Appendix A Figure A1, Figure A2, Figure A3, Figure A4, Figure A5, Figure A6, Figure A7 and Figure A8.
3.2. Models
Our study aims to evaluate the fundamental BERT (bidirectional encoder representations from transformers) model, a transformer-based approach that uses a bidirectional context for semantic language comprehension. We inspected four different variations of BERT for improvements. All models were trained in two different downstream tasks: binary classification and multi-class classification (k = 3).
3.2.1. Bidirectional Encoder Representations from Transformers
Employing the transformer architecture, BERT demonstrates superior natural language processing capabilities compared to many contemporaneous models. BERT’s distinctive adaptation incorporates a bidirectional encoder, enabling it to process input sequences and comprehensively capture contextual information from both directions of the text. BERT undergoes extensive training on vast corpora and diverse tasks, initially employing the masked language model (MLM) approach. In MLM, random tokens within an input sequence are masked, prompting the model to predict the occluded elements. This method effectively leverages BERT’s bidirectional capabilities, necessitating the consideration of contextual cues from both sides of a masked token, thereby fostering a more comprehensive understanding of language. Such training is instrumental in preparing BERT for fine-tuning downstream tasks. Additionally, BERT undergoes ‘Next Sentence Prediction’ training, where it assesses whether a sentence logically follows a preceding one. This step further refines BERT’s language comprehension ability, enabling it to discern semantic relationships between sentences and achieve a contextual understanding that transcends individual phrases and words [23].
3.2.2. DistilBERT
DistilBERT, a streamlined variant of BERT, retains approximately 95% of BERT’s linguistic performance while being about 60% smaller in size. DistilBERT uses knowledge distillation, which transfers knowledge from a large and complex model (BERT) to a smaller and simpler one (DistillBERT), to learn from BERT’s soft predictions and to keep its strong language understanding capability. This process involves the larger BERT model functioning as the ‘teacher’, generating probability distributions for a dataset, while DistillBERT, the ‘student’, is trained to approximate these probabilities. This architecture renders DistilBERT much faster, more memory-conservative, and able to maintain most of BERT’s performance [26].
3.2.3. RoBERTa
RoBERTa, also known as the robustly optimized BERT approach, is a variant that omits the Next Sentence Prediction component during the pre-training phase. Instead, it focuses on training with larger mini-batches and learning rates. This alteration, coupled with the utilization of an expanded corpus for training, enables RoBERTa to optimize its learning process. Consequently, it demonstrates better performance in certain tasks than BERT. Furthermore, RoBERTa’s training emphasizes enhanced context and sentence packing within the MLM framework. This approach significantly improves its ability to analyze sentiments and contextual correlations within text passages more effectively [27].
3.2.4. ALBERT
ALBERT (A Lite BERT) is another streamlined adaptation of BERT, distinguished by its compact and efficient design. Different from DistillBERT, ALBERT introduces two key innovations of parameter sharing across layers and factorized embedding parametrization. The latter involves employing smaller embeddings relative to the model’s hidden states. These features help reduce the number of model parameters compared to BERT, thus accelerating the training process and mitigating the risk of overfitting, which is a common challenge in complex models. In addition, by addressing overfitting, ALBERT maintains and occasionally outperforms BERT [28].
3.3. Data
This study retrieved training and validation data from Kaggle’s Twitter US Airline Sentiment dataset, comprising Twitter data from February 2015. This dataset is rich in detail, featuring manually encoded labels such as sentiment and confidence values. Contributors were tasked with categorizing tweets as positive, negative, or neutral, as well as further classifying the reasons for negative sentiments (e.g., ‘flight delayed’, ‘rude services’) [29]. The dataset comprises 14, 640 records, each with 15 attributes (tweet_id, airline_sentiment, airline_sentiment_confidence, negative reason, negativereason_confidence, airline, airline_sentiment_gold, name, negativereason_gold, retweet_count, text, tweet_coord, tweet_created, tweet_location, user-timezone). Previous studies have leveraged this dataset to evaluate the machine learning model’s performance in sentiment classification tasks [8,13]. Despite Twitter’s evolution over recent years, this dataset remains pertinent for the current study’s objective: evaluating deep learning models’ proficiency in discerning sentimental labels from textual data. Given its successful application in previous studies and its role in enhancing the model’s performance, this dataset serves as an essential benchmark for model comparison.
3.4. Pre-processing
Given that the BERT model requires a sequence of text as input, our processing primarily focused on the text data, disregarding the other 14 columns in the dataset except for the label column (‘airline_sentiment’). The tokenization process varies depending on the chosen model. BERT and DistilBERT utilized WordPiece tokenization, a method that breaks down text into recognizable subwords or symbols. RoBERTa used byte-pair encoding (BPE), which merges the most frequent pair of bytes in a sequence iteratively. ALBERT adopted the SentencePiece tokenizer, an approach that enables the direct tokenization of raw text without the necessary explicit text formatting [23,25,26,27,28].
3.4.1. Tokenization
The BERT tokenizer is a sub-word tokenization algorithm that begins with a base vocabulary of individual characters. It iteratively expands this vocabulary by adding the most frequent combinations of two subwords from the existing vocabulary. This strategy effectively addresses out-of-vocabulary words by decomposing them into recognizable subwords. For example, the word ‘largest’ might be tokenized into [‘large’, ‘##st’], where ‘##’ denotes a continuation of the previous sub-word. In contrast, the ALBERT tokenizer utilizes the SentencePiece tokenization method. Different from BERT’s approach, SentencePiece tokenization processes raw text sequences directly and allows the model to learn optimal word-splitting and sub-word formations. Regarding RoBERTa, its use of byte-pair encoding (BPE) tokenization is similar to BERT’s method. BPE also merges the most frequently occurring character pairs in the training text, but it has its unique nuances in implementation and application [23,25,26,27,28].
3.4.2. Lower-casing
The BERT tokenizers, specifically the ‘uncased’ versions labeled as ‘bert-base-uncased’ and ‘distilbert-base-uncased’, are trained on the text where all letters are converted to lowercase. This approach means that these models do not differentiate between uppercase and lowercase letters during tokenization and subsequent processing. In contrast, the ALBERT and RoBERTa models are case-sensitive. These two models preserve the case of the input text. This feature allows them to potentially capture more nuanced information, which might be relevant for certain predictive tasks [23,25,26,27,28].
3.4.3. Others
In our tokenization process, stop words are retained across all tokenizer types. This is because stop words play a crucial role in understanding the context of sentences, and their removal could alter the intended meaning. Additionally, traditional NLP techniques, such as stemming, bag-of-words (BoW), and TF-IDF matrices, are not employed in our tokenizers. Stemming, which reduces words to their root form, may strip away vital linguistic information for comprehensive language understanding. Conversely, BoW and TF-IDF do not facilitate contextual understanding while useful in certain contexts. The BERT tokenizer uses contextualized embeddings for each word, preserving both semantic and syntactic information in the tokenized word, which is crucial for capturing nuances of language.
Regarding the processing of labels, we employed sci-kit-learn’s LabelEncoder to convert text labels into numerical representations. This step is crucial, as it enables the models to interpret and learn from the data effectively. In our binary classification task, labels are encoded as 0 and 1 for ‘Negative’ and ‘positive’ sentiments, respectively. For the multi-class classification task (K = 3), the labels ‘Negative’, ‘positive’, and ‘Neutral’ are correspondingly encoded as 0, 1, and 2 [23,25,26,27,28].
3.5. Model Training
In the downstream training phase, the applied models were specifically tailored to the characteristics of the dataset. For BERT, this involved adding one or more task-specific layers, including a Softmax layer, for classification purposes in our study. Initially, the weights of these layers were randomly initialized. During the downstream task training, BERT underwent a process of gradient descent and backpropagation. This fine-tuning step involved adjusting the model’s weights based on the calculated loss, with the objective of minimizing this loss. As a result of this iterative process, the weights were updated, culminating in the development of a finely tuned model optimized for the specific task at hand.
The model training was conducted using Google Colab, utilizing a single Nvidia V100 GPU for computational support with the code implemented using Python3. We recorded the accuracy and training loss at each epoch throughout the training process. To counteract the risk of overfitting, an early stopping technique was employed. The early stopping technique, recognized for its simplicity and computational efficiency, is particularly suitable for training large models. Early stopping halts the training process when there is no further decrease in the model’s loss, thereby preventing overfitting. It helps the model achieve the best result without wasting more resources and time. Compared to other over-fitting-prevention methods, early stopping appears to be the most effective strategy, given the limitations of a single GPU and the constrained runtime on Google Colab; this method strikes a balance between computational resource usage and training efficiency in the context of our study scenario.
4. Results
4.1. Binary Classification Task
In the binary classification task, initial performance metrics revealed minor discrepancies among the models at the first epoch. Notably, ALBERT demonstrated superior performance in terms of training loss (approximately 0.225) compared to its counterparts (greater than 0.275). However, all models except ALBERT showed significantly lower validation losses (<0.20) at epoch 1, with RoBERTa reaching as low as approximately 0.13, whereas ALBERT remained around 0.225. As for the multi-class classification, RoBERTa demonstrated the lowest initial training loss, around 0.39 at epoch one, whereas BERT and DistilBERT exhibited higher losses, exceeding 0.7. Interestingly, RoBERTa, among all models, achieved the lowest training loss in both tasks, reaching approximately 0.125 in four epochs for binary classification and approximately 0.28 in five epochs for multi-class classification. However, RoBERTa exhibited signs of a severe overfitting pattern as its validation loss climbed up to around 0.43 while its training loss continued to decrease. A similar overfitting pattern was also observed in ALBERT’s multi-class classification task learning curve. Conversely, BERT and DistilBERT maintained a more stable learning trajectory with minimal signs of overfitting.
Table 2 provides a more detailed breakdown of the metric performances for the binary classification task. We found that BERT and its variants showed a similar pattern—being able to predict ‘Negative’ classes better than other classes. The pattern is particularly evident in the precision scores: models can range from approximately 0.96 to 0.99 on binary classification for the ‘Negative’ label but perform relatively worse on ‘Positive’, from approximately 0.87 to 0.90. A comparative analysis revealed parallel performances between BERT and DistilBERT in the binary task, with the accuracy and all metrical scores extremely close at a very slight difference of less than 0.002 in the ‘Negative’ class and a difference of less than 0.005 in the ‘Positive’ class.

Table 2.
Performance comparison of applied models on binary classification task.
Our findings reveal significant improvement in accuracy for BERT, DistilBERT, and RoBERTa, with each model exceeding the 95% accuracy benchmark. RoBERTa exhibited superior performance among all evaluated models in the binary classification task, achieving the highest accuracy of approximately 0.9697. The performance of RoBERTa is further underscored by its leading scores in all three metric measurements across both classes, peaking with a precision of approximately 0.9878 for the ‘Negative’ label. Notably, these results not only highlight the robustness of RoBERTa in this task but also call for further investigation into its underlying mechanisms and wider applications. With 124,647,170 trainable parameters, RoBERTa has the largest size of all models, suggesting a potential link between the size of a model and its effectiveness in specific tasks. Such correlation prompts further investigation into how the scale of a model may influence its task-specific performance.
Compared to RoBERTa, ALBERT is only 10% of its size, with only 11,685,122 trainable parameters. ALBERT presented the least effective performance among all the models compared in this research, registering an accuracy of approximately 0.9489 in the binary classification task. Despite its lower accuracy, ALBERT achieved marginally higher recall scores for the ‘Negative’ class compared to BERT and DistilBERT.
4.2. Multi-Class Classification Task (k = 3)
We used the same models under the same initialization for the three-class classification (Table 3).

Table 3.
Performance comparison of applied models on multi-class classification task (k = 3).
Our analysis revealed that all models experienced an approximate 10% reduction in accuracy for the three-class classifications and a much more significant decrease in the ‘Positive’ label metric measurements, with DistilBERT’s precision score significantly decreasing by approximately 18%. A similar pattern was observed in the three-class and binary classification tasks: all models performed better on the ‘Negative’ label prediction. While performance metrics for the ‘Negative’ label ranged from approximately 0.90 to 0.92, the models demonstrated notably weaker performances for the ‘Positive’ (from approximately 0.70 to 0.81) and ‘Neutral’ (from approximately 0.64 to 0.75) labels. We found BERT and its variants performing better in distinguishing the ‘Negative’ class. All models other than DistilBERT encountered difficulties with the ‘Neutral’ classification, with around a 10% decrease in precision for BERT and RoBERTa and an approximately 22% decrease in precision for ALBERT, compared to the ‘Positive’ classification. DistilBERT’s performance was slightly improved in the ‘Neutral’ class compared to ‘Positive’, with around 5%, 15%, and 10% improvement on precision, recall, and the F-1 score.
RoBERTa remains the best-performing model in the multi-class task, achieving the highest accuracy of 0.8689. However, RoBERTa is no longer consistent in yielding the best metrical performance, as it suffers a lower precision in the ‘Negative’ and ‘Positive’ classes than the other models and the lowest recall score (0.6424) in the ‘Neutral’ class.
4.3. Benchmark Comparison Task
Our analysis extended to a comparative evaluation of our models against established machine learning methodologies and prior studies focusing on BERT. For consistency, we used the exact metrical measurements of precision, recall, and the F-1 score, as Patel et al.’s paper selected. Table 4 shows the parallel comparison of model accuracy in separate tasks under the same dataset. SVM (support vector machine) from Wu and Gao [13] was selected as our baseline model for comparison in the binary classification task, and BERT from Patel et al. [8] was selected for the baseline in the multi-class classification task (k = 3).

Table 4.
Performance comparison with existing studies.
Our model shows an improvement from the SVM used by Wu and Gao in 2023 [13], with RoBERTa showing the highest accuracy in the binary classification tasks. As for the three-class classification task, our models present a marginal improvement compared to the BERT used by Patel et al. in 2023 [8], with DistiBERT and ALBERT improving by around 1% and BERT improving by approximately 2.5%. RoBERTa achieved approximately a 3.8% increase in accuracy and an overall higher metric performance across most labels, with the exception of recall in the ‘Negative’ class.
5. Discussion
Based on the benchmark results, this study concludes that BERT and its variants outperformed traditional machine learning models like SVM [13] in the binary classification tasks and yielded superior results than the BERT-only study [8] in three-class classification tasks. Given sufficient computational resources, BERT can process up to 512 tokens per sequence, contributing to its impressive accuracy of up to 95.32%, significantly higher than the reported results in earlier studies. We also found that RoBERTa outperformed the basic BERT on both of our downstream tasks, returning the best accuracy (96.97% and 86.89%) among all models. BERT and its variants excel in sentimental analysis, owing to their contextual understanding and capability to capture subtle linguistic cues, with their bidirectional nature spotting more semantic information than the traditional machine learning models or one-directional NLP models, leading to better performance. Moreover, improvements were demonstrated from BERT on the three-class prediction tasks when comparing the models’ performance from Patel et al. [8]. With a batch size of 16 and a full-length token input of 512 tokens, BERT can reach as high as 95% on binary classification tasks and 85% on three-class classification. Limitations and future directions are discussed in the section.
5.1. Limitations
Based on reported precision, recall, and the F-1 scores, we discovered that all models have the highest performance for the ‘Negative’ class for all metrics in both tasks. These quantitative results show these models are adept at identifying ‘Negative’ sentiments in text, and the high precision of the ‘Negative’ class signifies that the models are reliable in their ‘Negative’ predictions. The following reasons should explain this phenomenon: we believe it is possible that BERT’s architecture can algorithmically distinguish ‘Negative’ tokens and contextual information in its sequences. Specifically, ‘Negative’ tokens may be given higher weights during the pre-training phase, making BERT more sensitive to negative sentiment tokens in its input sequence. Our findings can also be explained by the possibility that the pre-trained data and tasks given to BERT have more ‘Negative’ semantic tokens. With more exposure during the pre-training phase, BERT can become more experienced with these semantic cues and perform better in such situations. On the other hand, the distribution of classes in the applied dataset may lead to such results. In our early exploratory data analysis (EDA) process, we plotted the number of occurrences for each class in the dataset (Figure 3).
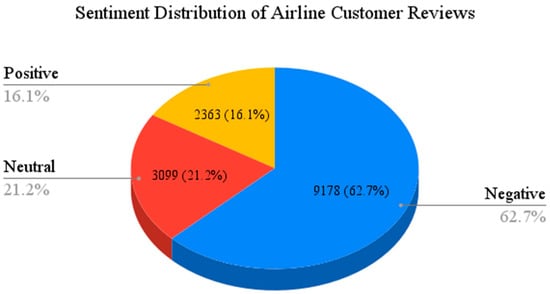
Figure 3.
Class distribution of Applied Airline Sentiment dataset.
As Figure 3 shows, there are significantly more ‘Negative’ cases in the dataset, which might lead to the observed superior ability of our models to distinguish the ‘Negative’ class. However, a common challenge for all models was the ‘Neutral’ class, where they exhibited the lowest scores in precision, recall, and the F-1 score. This result suggests that identifying ‘Neutral’ sentiments is more challenging for these models because of the subtlety and ambiguity often associated with neutral sentiment in languages (source). Finally, we observed that all models performed moderately in the ‘Positive’ class, showing a balanced performance in identifying ‘Positive’ sentiments. These observations can also be caused by the relatively limited size of occurrence in our dataset.
To draw a more precise conclusion about the model performances in each sentiment class, we balanced the original dataset to achieve the same observations across three classes. We randomly sampled 2363 observations from the ‘Negative’ (9178) and ‘Neutral’ classes (3099) with a random seed of 42. The new balanced dataset now has 7089 rows.
As presented in Table 5, removing the large number of ‘Negative’ observations led to a large drop in the models’ performances in the ‘Negative’ class, with around an 8% drop in precision, recall, and the F-1 score. Removing 736 entries from the ‘Neutral’ class did not compromise the models’ abilities to identify neutral sentiments, which instead exhibited a slightly heightened precision. Conversely, the models showed an enhanced capability in distinguishing the ‘Positive’ sentiments, evidenced by a 7.93% boost in recall and a 5.29% enhancement in the F-1 score, alongside a modest improvement in precision.

Table 5.
Overview of the models’ performances on the balanced dataset.
In summary, the original dataset contains more cases in the “Negative” class, boosting the models’ capabilities of negative sentiment prediction. Based on the results from the test on the balanced dataset, it turned out that the performances on both “Positive” and “Neutral” class predictions were improved. In contrast, the overall performance of “Negative” class predictions was downgraded.
Several reasons might lead to such observations: first, BERT-structured large language models (LLMs), like RoBERTa, might have trouble identifying the ‘Neutral’ class, specifically because of the inherent limitations of the pre-training phase. This challenge could be rooted in how BERT and its derivatives are pre-trained, focusing primarily on contexts with clear sentiment polarity (positive or negative) rather than the subtler cues of neutrality. These models are adept at picking up strong sentiment indicators but may fumble regarding less expressive language, often found in neutral statements from airline customer reviews. The pre-training corpora for these models might contain fewer examples of neutral language, leading to a bias towards more emotionally charged expressions. The underrepresentation of neutral language in the training dataset could cause less effective learning of the linguistic patterns that typically signify a neutral stance.
Second, it might be a challenge to define ‘Neutral’ consistently and distinguishably from others, which is more subjective than clear-cut positive or negative sentiments. Because of the comparative nature of our study, the dataset itself might contain biased or subjective neutral data points. Future studies can use a more systematic method to identify textual sentiment to address BERT’s applicability in multi-class sentiment classification.
Last but not least, the limited dataset size may also undermine the effective sentimental information learned by BERT and its variants. As addressed in the Section 4 and Section 5, a decline was found in the accuracy of distinguishing the ‘Negative’ class when we tested the models on the balanced dataset. This indicates that the size of the dataset might lead to a downgrade in performance. When dealing with unbalanced datasets, models like BERT can become adept at recognizing the more frequently occurring classes. However, this can lead to biased learning to identify under-represented classes. Balancing the dataset alters this dynamic, as the model must learn and distinguish between all classes equally. A larger, well-balanced dataset provides a more comprehensive range of examples for each sentiment class, potentially improving the model’s performance. Therefore, future studies may need to focus on expanding the dataset size and ensuring its balanced representation.
Additionally, we generated word clouds to conclude the most frequent appearance of words in the text that our models processed. Figure 4 shows that most comments are associated with airline companies. We also plotted the distribution of user time zones from our dataset in Figure 5, and most airline comments are given from Western countries. This finding indicates a potential bias in our dataset, predominantly comprising Western, educated, industrialized, rich, and democratic (WEIRD), representing only 12% of the world’s population. As a result, there is a potential limitation in applying a deep learning approach to airline customer service analysis, as the unrepresented population of the world may cause confusion in models and lead to diminished performance on sentimental comprehension.

Figure 4.
Word cloud of applied dataset.
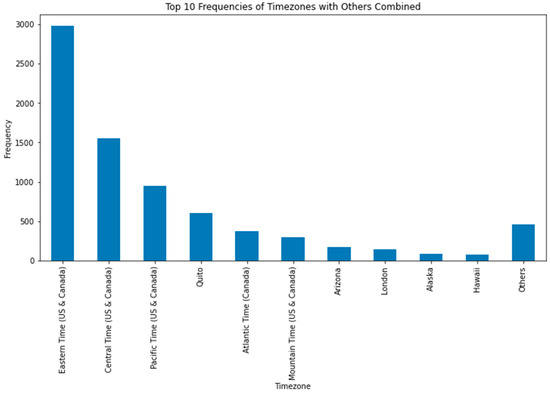
Figure 5.
Distribution of reviewers based on time zone.
5.2. Future Directions
While the notable advancements are demonstrated by BERT and its variants in this study, opportunities for enhancement remain in the realm of semantic interpretation in natural language processing. Despite additional fine-tuning, the performance cap suggests optimizations are needed for both the model and training dataset.
First, BERT and its variants have a limit of 512 tokens, meaning that any sequence input longer than 512 would be cut off in the processing. This limitation could lead to confusion in the specific text input to BERT and its variants if the entire sequence were neutral but twisted to be negative at the very end. Since BERT and its variants were pre-trained mostly over internet texts, it can lead to knowledge gaps in certain text types, such as historical work, or may introduce language biases. The amount of text used in pre-training is far less representative than the human language. As a result, it can give us a high but limited or capped sentimental classification accuracy. It is also worth exploring models that utilize a different underlying architecture than BERT, such as BART (bidirectional and auto-regressive transformers) [30], GPT (generative pre-trained transformers) [31], or XLNet [32].
Second, the size of the Kaggle dataset (comprising only 14,640 records), while serving as a benchmark, may restrict the potential for training improvement due to its limited scope. The random train–test split may not have produced a test set that adequately represents the characteristics of the training set, affecting validation accuracy. Aside from the limited sample size, another issue from this widely used training data is the validity of several attributes, such as customer sentiment confidence [14]. The original dataset from Kaggle needs to provide the authors with details regarding how the contributors annotated the data and computed the confidence matrix, which might affect the validity of relevant studies. For a more comprehensive analysis, incorporating online customer reviews (OCRs) data from diverse platforms such as TripAdvisor and Air Travel Review (ATR) might offer richer and more varied data sources [14,17].
6. Conclusions
This study investigates the efficacy of the transformer-based NLP technique BERT and its variants, focusing on their applications for airline customer reviews sourced from Kaggle [26]. We found that BERT and its derivatives, especially RoBERTa, significantly outperform previous machine learning and deep learning approaches in both original and balanced datasets. Notably, RoBERTa stood out as the most proficient model, showcasing the highest accuracy and metric scores.
In light of these findings, this study proposes several future directions and recommendations. A critical need was identified for a more systematic and balanced customer review dataset, which could further refine sentiment analysis accuracy. Additionally, exploring models with different underlying architectures and experimenting with various fine-tuning techniques could yield further insights into optimizing sentiment analysis. Given RoBERTa’s superior performance in accurately classifying sentiments in airline customer reviews, its application could significantly streamline the labor-intensive process of sentiment analysis. This, in turn, could reduce the operational costs associated with customer service improvement, offering practical benefits to the airline industry.
Author Contributions
Conceptualization, Z.L., C.Y. and C.H.; methodology, Z.L. and C.Y.; software, Z.L.; validation, Z.L.; formal analysis, Z.L. and C.Y.; investigation, Z.L.; resources, C.Y.; data curation, C.Y.; writing—original draft preparation, Z.L., C.Y. and C.H.; writing—review and editing, C.Y. and C.H.; visualization, Z.L.; supervision, C.Y.; project administration, C.Y. and C.H.; funding acquisition, C.Y. All authors have read and agreed to the published version of the manuscript.
Funding
This research was funded by Eastern Michigan University, grant number 003393.
Data Availability Statement
Data are contained within the article.
Conflicts of Interest
The authors declare no conflict of interest.
Appendix A
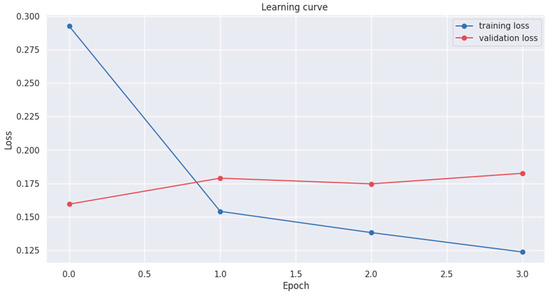
Figure A1.
BERT binary classification task training plot.
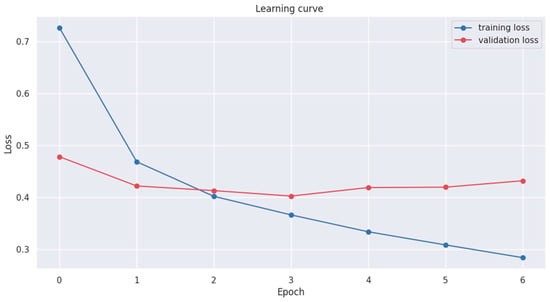
Figure A2.
BERT multi-class (k = 3) classification task training plot.
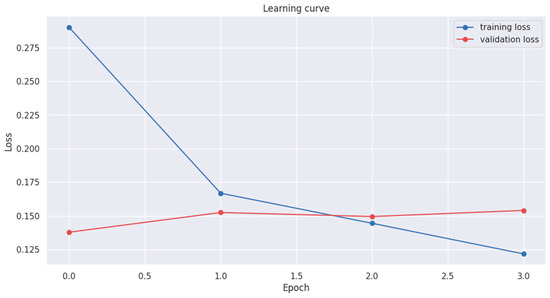
Figure A3.
RoBERTa binary classification task training plot.
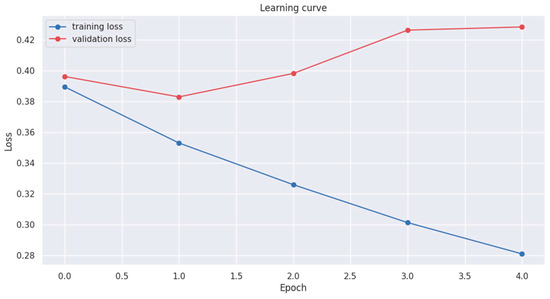
Figure A4.
RoBERTa multi-class (k = 3) classification task training plot.
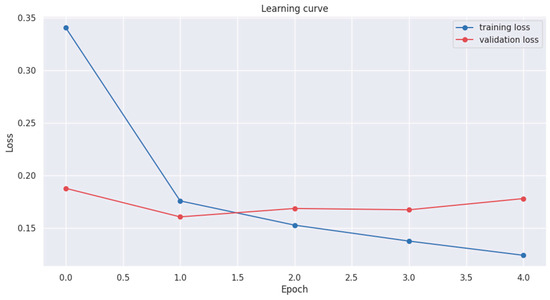
Figure A5.
DistilBERT binary classification task training plot.
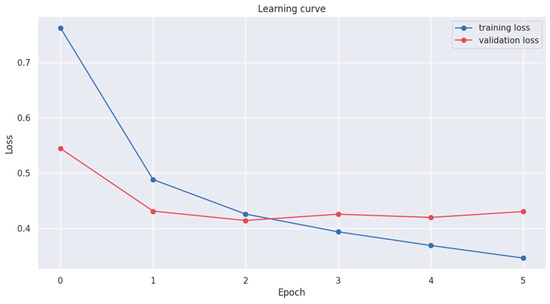
Figure A6.
DistilBERT multi-class (k = 3) classification task training plot.
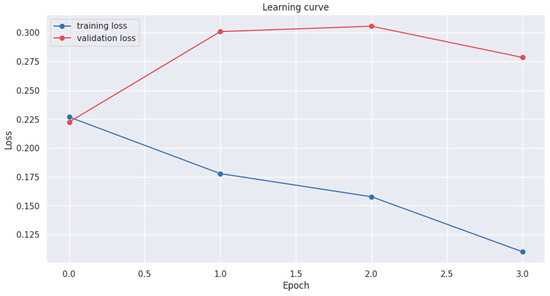
Figure A7.
ALBERT binary classification task training plot.
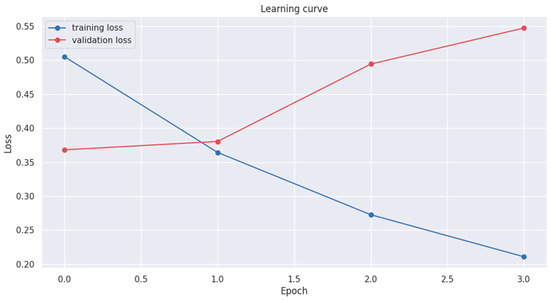
Figure A8.
ALBERT multi-class (k = 3) classification task training plot.
References
- Sandada, M.; Matibiri, B. An investigation into the impact of service quality, frequent flier programs and safety perception on satisfaction and customer loyalty in the airline industry in Southern Africa. South East Eur. J. Econ. Bus. 2016, 11, 41. [Google Scholar] [CrossRef]
- Kalemba, N.; Campa-Planas, F. The quality effect on the profitability of US airline companies. Tour. Econ. 2018, 24, 251–269. [Google Scholar] [CrossRef]
- Ban, H.-J.; Kim, H.-S. Understanding customer experience and satisfaction through airline passengers’ online review. Sustainability 2019, 11, 4066. [Google Scholar] [CrossRef]
- Giachanou, A.; Crestani, F. Like it or not: A survey of twitter sentiment analysis methods. ACM Comput. Surv. CSUR 2016, 49, 1–41. [Google Scholar] [CrossRef]
- Ravi Kumar, G.; Venkata Sheshanna, K.; Anjan Babu, G. Sentiment analysis for airline tweets utilizing machine learning techniques. In International Conference on Mobile Computing and Sustainable Informatics: ICMCSI 2020; Springer: Cham, Switzerland, 2021; pp. 791–799. [Google Scholar]
- Mahurkar, S.; Patil, R. LRG at SemEval-2020 task 7: Assessing the ability of BERT and derivative models to perform short-edits based humor grading. arXiv 2020, arXiv:2006.00607. [Google Scholar]
- Tusar, M.T.H.K.; Islam, M.T. A comparative study of sentiment analysis using NLP and different machine learning techniques on US airline Twitter data. In Proceedings of the 2021 International Conference on Electronics, Communications and Information Technology (ICECIT), Khulna, Banglades, 14–16 September 2021; pp. 1–4. [Google Scholar]
- Patel, A.; Oza, P.; Agrawal, S. Sentiment Analysis of Customer Feedback and Reviews for Airline Services using Language Representation Model. Procedia Comput. Sci. 2023, 218, 2459–2467. [Google Scholar] [CrossRef]
- Yang, C.; Huang, C. Natural Language Processing (NLP) in Aviation Safety: Systematic Review of Research and Outlook into the Future. Aerospace 2023, 10, 600. [Google Scholar] [CrossRef]
- Park, E. The role of satisfaction on customer reuse to airline services: An application of Big Data approaches. J. Retail. Consum. Serv. 2019, 47, 370–374. [Google Scholar] [CrossRef]
- Park, E.; Jang, Y.; Kim, J.; Jeong, N.J.; Bae, K.; Del Pobil, A.P. Determinants of customer satisfaction with airline services: An analysis of customer feedback big data. J. Retail. Consum. Serv. 2019, 51, 186–190. [Google Scholar] [CrossRef]
- Punel, A.; Hassan, L.A.H.; Ermagun, A. Variations in airline passenger expectation of service quality across the globe. Tour. Manag. 2019, 75, 491–508. [Google Scholar] [CrossRef]
- Wu, S.; Gao, Y. Machine Learning Approach to Analyze the Sentiment of Airline Passengers’ Tweets. Transp. Res. Rec. 2023. [Google Scholar] [CrossRef]
- Sezgen, E.; Mason, K.J.; Mayer, R. Voice of airline passenger: A text mining approach to understand customer satisfaction. J. Air Transp. Manag. 2019, 77, 65–74. [Google Scholar] [CrossRef]
- Siering, M.; Deokar, A.V.; Janze, C. Disentangling consumer recommendations: Explaining and predicting airline recommendations based on online reviews. Decis. Support Syst. 2018, 107, 52–63. [Google Scholar] [CrossRef]
- Kumar, S.; Zymbler, M. A machine learning approach to analyze customer satisfaction from airline tweets. J. Big Data 2019, 6, 62. [Google Scholar] [CrossRef]
- Lucini, F.R.; Tonetto, L.M.; Fogliatto, F.S.; Anzanello, M.J. Text mining approach to explore dimensions of airline customer satisfaction using online customer reviews. J. Air Transp. Manag. 2020, 83, 101760. [Google Scholar] [CrossRef]
- Devlin, J.; Chang, M.-W.; Lee, K.; Toutanova, K. Bert: Pre-training of deep bidirectional transformers for language understanding. arXiv 2018, arXiv:1810.04805. [Google Scholar]
- Allen, R.B. Several studies on natural language and back-propagation. In Proceedings of the IEEE First International Conference on Neural Networks, San Diego, CA, USA, 21 June 1987; p. 341. [Google Scholar]
- Cambria, E.; White, B. Jumping NLP curves: A review of natural language processing research. IEEE Comput. Intell. Mag. 2014, 9, 48–57. [Google Scholar] [CrossRef]
- Pennington, J.; Socher, R.; Manning, C.D. Glove: Global vectors for word representation. In Proceedings of the 2014 conference on empirical methods in natural language processing (EMNLP), Doha, Qatar, 25–29 October 2014; pp. 1532–1543. [Google Scholar]
- Mikolov, T.; Chen, K.; Corrado, G.; Dean, J. Efficient estimation of word representations in vector space. arXiv 2013, arXiv:1301.3781. [Google Scholar]
- Wang, H.; Raj, B. On the origin of deep learning. arXiv 2017, arXiv:1702.07800. [Google Scholar]
- Vaswani, A.; Shazeer, N.; Parmar, N.; Uszkoreit, J.; Jones, L.; Gomez, A.N.; Kaiser, Ł.; Polosukhin, I. Attention is all you need. Adv. Neural Inf. Process. Syst. 2017, 30, 5998–6008. [Google Scholar]
- Sun, C.; Qiu, X.; Xu, Y.; Huang, X. How to fine-tune bert for text classification? In Proceedings of the Chinese Computational Linguistics: 18th China National Conference, CCL 2019, Kunming, China, 18–20 October 2019; pp. 194–206. [Google Scholar]
- Sanh, V.; Debut, L.; Chaumond, J.; Wolf, T. DistilBERT, a distilled version of BERT: Smaller, faster, cheaper and lighter. arXiv 2019, arXiv:1910.01108. [Google Scholar]
- Liu, Y.; Ott, M.; Goyal, N.; Du, J.; Joshi, M.; Chen, D.; Levy, O.; Lewis, M.; Zettlemoyer, L.; Stoyanov, V. Roberta: A robustly optimized bert pretraining approach. arXiv 2019, arXiv:1907.11692. [Google Scholar]
- Lan, Z.; Chen, M.; Goodman, S.; Gimpel, K.; Sharma, P.; Soricut, R. Albert: A lite bert for self-supervised learning of language representations. arXiv 2019, arXiv:1909.11942. [Google Scholar]
- Twitter US Airline Sentiment. Kaggle. Available online: https://www.kaggle.com/datasets/crowdflower/twitter-airline-sentiment (accessed on 17 April 2023).
- Lewis, M.; Liu, Y.; Goyal, N.; Ghazvininejad, M.; Mohamed, A.; Levy, O.; Stoyanov, V.; Zettlemoyer, L. Bart: Denoising sequence-to-sequence pre-training for natural language generation, translation, and comprehension. arXiv 2019, arXiv:1910.13461. [Google Scholar]
- Brown, P.F.; Della Pietra, V.J.; Desouza, P.V.; Lai, J.C.; Mercer, R.L. Class-based n-gram models of natural language. Comput. Linguist. 1992, 18, 467–480. [Google Scholar]
- Yang, Z.; Dai, Z.; Yang, Y.; Carbonell, J.; Salakhutdinov, R.R.; Le, Q.V. Xlnet: Generalized autoregressive pretraining for language understanding. arXiv 2019, arXiv:1906.08237. [Google Scholar]
Disclaimer/Publisher’s Note: The statements, opinions and data contained in all publications are solely those of the individual author(s) and contributor(s) and not of MDPI and/or the editor(s). MDPI and/or the editor(s) disclaim responsibility for any injury to people or property resulting from any ideas, methods, instructions or products referred to in the content. |
© 2023 by the authors. Licensee MDPI, Basel, Switzerland. This article is an open access article distributed under the terms and conditions of the Creative Commons Attribution (CC BY) license (https://creativecommons.org/licenses/by/4.0/).
