Abstract
Potato is one of the major cultivated crops and provides occupations and livelihoods for numerous people across the globe. It also contributes to the economic growth of developing and underdeveloped countries. However, potato blight is one of the major destroyers of potato crops worldwide. With the introduction of neural networks to agriculture, many researchers have contributed to the early detection of potato blight using various machine and deep learning algorithms. However, accuracy and computation time remain serious issues. Therefore, considering these challenges, we customised a convolutional neural network (CNN) to improve accuracy with fewer trainable parameters, less computation time, and reduced information loss. We compared the performance of the proposed model with various machine and deep learning algorithms used for potato blight classification. The proposed model outperformed the others with an overall accuracy of 99% using 839,203 trainable parameters in 183 s of training time.
MSC:
68T01
1. Introduction
The agricultural industry is the greatest contributor to food, income, and jobs globally. In India, the industry accounts for 18.0% of the country’s GDP, and 53.3% of its workforce [1], comparable to other low- to middle-income countries. Over the last three years, the percentage of the country’s total GDP contributed by agriculture’s gross value added (GVA) has increased from 17.6% to 20.2% [2,3], supporting India’s economic expansion. Plant illnesses and insect infections may affect agriculture and, thus, the quality of food production, but it is known that preventive drugs are inefficient for preventing epidemic or endemic diseases. Early monitoring and detection of crop diseases with adequate crop protection systems can help prevent production quality losses, and this can be accomplished by monitoring and identifying diseases in crops as early as possible.
Late blight due to the oomycete Phytophthora infestans (henceforth P. infestans) has caused the most damage to potato (Solanum tuberosum L.) crops in recorded history [4]. Many potato types produced in Colombia are susceptible to late blight [5,6], and the disease is difficult to control without using significant amounts of pesticide. The severity of late blight is often evaluated visually by determining what percentage of the crop’s foliage is infected [7,8]. However, visually assessing the severity of a disease is labour intensive, time-consuming, and not highly replicable due to the requirement for professional (subjective) intervention. Infections and bug infestations leave distinct patterns that can be exploited to establish accurate diagnoses [9]. In addition, farmers’ or specialists’ diagnoses of plant diseases may not be accurate [10], potentially leading to inappropriate applications of drugs that may have a detrimental effect on the quality of the crop and eventually damage the environment.
Recent developments in computer imaging have offered solutions to the detection challenges that farmers are currently facing [9]. Since the spots indicating infection first appear as dots and patterns on the leaves, the research community has produced several different approaches for accurately identifying and classifying plant diseases. Conventional image processing, which requires the use of manual methods for tasks, such as feature extraction and segmentation, is still used today [11]. Dubey et al. [12] used a K-means clustering strategy to deliver a multiclass support vector machine (SVM) classification for segregating contaminated leaf sections. Yun et al. [13] used a probabilistic neural network (NN) to extract the statistical and meteorological characteristics of the data. Numerous conventional models, such as the one created by Liu et al. [14], which combines an SVM and K-means clustering with a backpropagation NN, have been developed to identify plant diseases. Since the advent of AI, numerous computer imaging research projects have focused on the use of machine learning (ML) and deep learning (DL) [15,16] models to increase the accuracy of disease recognition.
A study [17] employed CNN architectures, such as AlexNet, GoogLeNet, and ResNet, as basic models for diagnosing disease in tomato leaf samples. Histograms of training and validation accuracy enabled the performance of the model to be visualised. Of the various CNN architectures, ResNet emerged as the model that performed best. LeNet architecture has also been used to identify banana leaf disease, and the model was evaluated in colour and greyscale using the conditional average (CA) and the F1-score [18]. Both colour and greyscale evaluations were performed using these metrics. In [19], a comparison was made between the architectures of five different types of CNNs, referred to by their various names: AlexNet, AlexNetOWTbn, GoogLeNet, Overfeat, and VGG. The research employed many state-of-the-art DL models, including GoogLeNet, ResNet-50, ResNet-101, Inception-v3, InceptionResNetv2, and SqueezeNet. In [20], a modern DL model, known as Inception-v3, was used to diagnose a disease affecting cassava plants.
In the research, the original PlantVillage dataset has been balanced by increasing the healthy potato leaves that were fewer as compared to the rest of the classes in dataset. For unbiased balancing, an algorithm is proposed for random selection of healthy potato leaves and duplicating them. After the detailed study of CNN model, it was realized that reduction in loss of salient features of the images may enhance the accuracy of the model. Therefore, in the proposed model, number of pooling operations has been reduced in comparison to convolutional operation. With multiple experiments, it has been found that the approximate 3:2 ratio of convolution and pooling operations in the model has achieved better performance in comparison with the basic CNN model and other existing works.
Providing a high-accuracy model for detecting potato blight by minimising the loss of salient features due to the pooling layer and enhancing the feature extraction process. The rest of this paper is organised as follows: Section 2 presents the literature review; Section 3 explains the methods and materials, and the data pre-processing and balancing; Section 4 describes the proposed architecture; Section 5 presents the result and discussion; Section 6 outlines the comparative analysis; and Section 7 provides the conclusion and future scope.
2. Literature Review
The powerful recognition and classification capabilities of CNNs, which work by extracting low-level complex information from images, have attracted significant attention. CNNs are preferred to earlier approaches for automatically recognising plant diseases due to the higher performance of CNNs [21]. The CNN-based predictive model described by Sharma et al. [22] can be used to classify paddy plants by applying image processing to the associated images. Asritha et al. [23] also used a CNN in their research to identify diseases in rice paddies. The classification of plants often requires between four and six layers of CNNs to be used by scientists. Mohanty et al. [24] accomplished the classification of plant illnesses, and their identification and segmentation, by employing a CNN trained with a transfer learning methodology. CNNs have been applied to a broad range of investigations, and improved outcomes have been reported in some cases; however, the datasets used in these studies were not truly diverse [25]. Narayanan et al. [26] suggested the use of a hybrid CNN to identify the many diseases that can harm banana trees. They coupled a fusion SVM with a CNN and used a median filter to maintain the standard image dimensions without adjusting the default settings of the raw input image. Jadhav et al. [27] proposed the use of a CNN that had previously been trained to spot illnesses in soybean plants as a means of detecting and identifying plant diseases. However, despite the better results, the model was inadequate in terms of the variety of illnesses it could categorise. Jadhav et al. [28] improved the performance of DL models by first proposing a novel histogram modification technique for synthesising synthetic picture samples from low-quality test-set images.
Following in the footsteps of Olusola et al., Abbas et al. [29] developed a conditional generative adversarial network to construct a library of synthetic pictures of the leaves of tomato plants. In the past, capturing or collecting data in real time was not viable owing to the high costs involved, the scarcity of resources, or both. Today, however, real-time data capture and collection are becoming more practical. For example, Anh et al. [30] presented a multi-leaf classification model that was based on a benchmark dataset using a pre-trained MobileNet CNN model, which they found to be excellent for classification, with an accuracy of 96.58%. In addition, a multilabel CNN was described for the classification of numerous plant diseases based on transfer learning approaches, such as DenseNet, Inception, Xception, ResNet, VGG, and MobileNet [31]. The authors of this study claimed that they were the first to use a multi-label CNN to categorise 28 distinct illnesses that may affect plants. In the context of the article [32], an ensemble classifier was proposed as a method for categorising the diverse illnesses that can affect plants. PlantVillage and Taiwan Tomato Leaves were used in the evaluation process to determine which ensemble classifier performed best. The EfficientNet model, which uses a CNN, was developed by Pradeep et al. [33] to categorise several labels simultaneously. They determined that CNN’s hidden layer network was superior in its ability to detect plant diseases. However, when compared to industry norms, the model did not measure up. The authors of [34] offered a loss-fused, resilient CNN that achieved a classification accuracy of 98.93% based on the freely available PlantVillage benchmark dataset. Later, Enkvetchakul and Surinta [35] introduced a CNN network that used a transfer learning technique to diagnose two plant diseases. Abade et al. [36] evaluated CNN algorithms for the identification of plant diseases. The reviewers considered 121 articles published between 2010 and 2019, concluding that TensorFlow was the most commonly used framework, and PlantVillage was the most widely used dataset. Dhaka et al. [37] provided an overview of the principles underpinning the use of CNN models to identify diseases in leaf samples and examined a selection of CNN models, pre-processing techniques, and foundational frameworks. Another group of researchers, Nagaraju et al. [38], analysed and discussed the best datasets, pre-processing methodologies, and DL algorithms for a variety of plants.
According to Kamilaris et al. [39], DL approaches have the potential to solve multiple issues that arise in the agricultural sector. According to their findings, DL methods performed significantly better than more traditional approaches to image processing. Fernandez Quintanilla et al. [40] conducted research to evaluate weed monitoring systems for agricultural crops. They focused on ground-based and remote-sensing weed monitoring in agricultural areas and concluded that monitoring is necessary for the effective management of weeds. They anticipated that the data obtained by many sensors would be kept in the cloud and used effectively. Lu et al. [41] conducted a review and showed for the first time that plant diseases could be classified through the application of a CNN.
Golhani et al. [42] wrote a review article about the use of hyperspectral data for identifying plant leaf diseases. They reviewed the status of the field, its potential future applications, and NN techniques for accelerating SDI development, Bangari et al. [43] zeroed in on potato blight as the illness of interest. After reviewing the relevant research, the researchers concluded that CNNs are more effective than other methods of disease detection. In addition, they discovered that CNNs performed a significant role in achieving maximum accuracy in disease identification.
Iqbal et al. [44] implemented various ML algorithms using 450 potato leaf images from the PlantVillage dataset. They declared that the random forest (RF) algorithm outperformed the other algorithms. Singh et al. [45] used 300 potato leaf images from the PlantVillage dataset and divided them into three equal classes: early blight, late blight, and healthy. The authors used GLCM to extract the features of dataset images and used these features to classify potato blight using an SVM with an overall accuracy of 96%. Islam et al. [46] segmented potato leaf images extracted from the PlantVillage dataset and used the threshold method to segment the regions of interest (RoI) in the images. They then used the segmented images to train the model using the SVM method and achieved 95% accuracy with 300 samples. Chakraborty et al. [47], using potato leaf images from the PlantVillage dataset, implemented and compared the performance of ResNet 50, VGG 16, MobileNet, and VGG 19 for potato blight classification. The VGG 19 architecture achieved the highest accuracy, at 92.69%. The authors then fine-tuned the VGG 19 architecture and achieved an accuracy of 97.89%. Mahum et al. [48] added extra layers to DenseNet architecture and evaluated the performance of the model by classifying potato blight using potato images from the PlantVillage dataset. The modified DenseNet model achieved a high accuracy of 97.2% compared to the basic DenseNet architecture.
3. Materials and Methods
Data Balancing and Augmentation
To train, validate, and evaluate the proposed model, we acquired photos of potato leaf diseases from the PlantVillage dataset, which is open to the public. The collection included photos of three distinct potato leaf conditions: late blight, early blight, and healthy. Each image in the dataset had a resolution of 256 × 256 pixels. The pictures of early and late blight depicted the two stages of the devastating potato leaf disease, and the images of healthy potato leaves showed leaves in a normal, healthy state. We assigned the values 0, 1, and 2 as indices for the three classes in the dataset. Table 1 demonstrates the distribution of the total number of photos across each category of the dataset. However, we found a much lower number of healthy potato blight photos in the dataset than images of the other two classes of potato blight.

Table 1.
Number of images in each class of PlantVillage dataset.
To balance the data, we increased the number of images of healthy potato leaves by randomly selecting 10 healthy potato leaf images and creating 10 duplicate copies of each. We repeated this process five times. Algorithm 1 shows the balancing process for healthy potato leaf images in the dataset. Table 2 shows the total count of images in each class in the dataset after balancing; there were 1000 images for early and late blight in each class and 652 healthy potato leaf images. Randomly selected sample images for each class are shown in Figure 1 for visualisation.
| Algorithm 1. Data balancing. |
| Input: Healthy potato leave image directory from the PlantVillage dataset. Output: Healthy potato leave image directory with an expanded number of images. 1: i = 0 2: if (i ≤ 4) 3: Select 10 random images 4: Create 10 × 10 copies of each image 5: i = i + 1 6: goto step 2 7: else 8: stop |

Table 2.
Count of images in each class in the dataset after balancing.
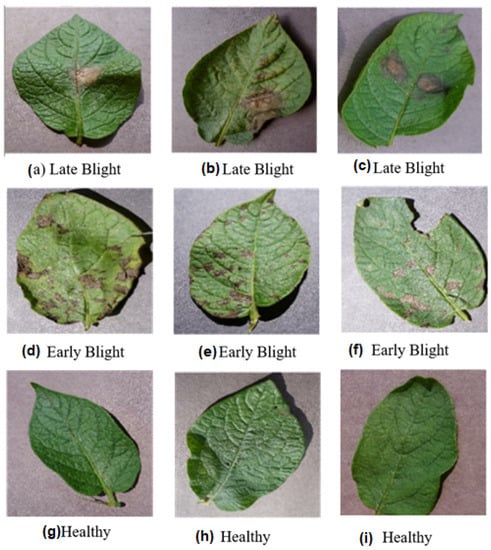
Figure 1.
Randomly selected sample images from each class in the dataset (a–c) Late blight (d–f) Early blight (g–i) Healthy.
To accelerate the computation, we divided the dataset into 83 batches containing 32 images each and placed the remaining images in the last batch. We randomly split the dataset into training, testing, and validation samples with ratios of 0.6, 0.2, and 0.2, respectively, and a shuffle size of 10,000. The distributions of the training, testing, and validation images are shown in Table 3.

Table 3.
Number of images in each training, testing, and validation class.
We normalised the data to enhance the speed of computation and augmented the training data to vigorously train the model and avoid overfitting. For augmentation, the images were horizontally flipped, vertically flipped, rotated between −20 and +20, sheared between −40 and +40, and shifted by width and height within a range of 0.2. A visualisation of the augmentation process is shown in Figure 2.
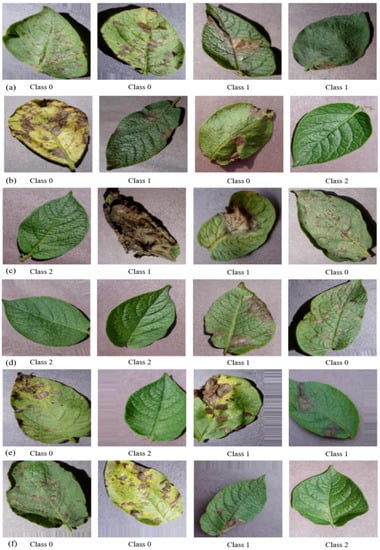
Figure 2.
Visualised augmented images: (a) sheared, (b) rotated, (c) shifted, (d) vertically flipped, (e) horizontally flipped, and (f) height shifted.
4. Proposed Model
We used a customised CNN to accurately detect blight on potato leaves. The potato blight classification process comprised data balancing, augmentation, splitting, training, validation, and testing. A flowchart of the working procedure is shown in Figure 3. The data were shuffled, resized, and distributed into batches. For data pre-processing, the unbalanced data were balanced by increasing the number of healthy potato leaf images. Thereafter, the data were split into training, testing, and validation data; the training data were augmented using various parameters and normalised between 0 and 1, whereas the testing and validation data were normalised between 0 and 1. The training and validation data were used to train the model, and the testing data were used to evaluate its performance.
where D is the dataset and D′ is the shuffled dataset, x_i is the input feature vector for the i-th example in D, y_i is its corresponding label, and the order of the elements (x_i, y_i) in D′ is randomly permuted.
where D′_train is the training dataset and D′_test is the testing dataset, n_train is the number of examples assigned to the training dataset, and n is the total number of examples in D′.
where α is a value between 0 and 1 that represents the proportion of D′ assigned to D′_train.
D′ = {(x_i, y_i) | (x_i, y_i) ∈ D}
D′ = {(x′_i, y′_i) | (x′_i, y′_i) ∈ D′}
D′_train = {(x′_i, y′_i) | i ∈ [1, n_train]}
D′_test = {(x′_i, y′_i) | i ∈ [n_train + 1, n]}
n_train = α n
n_test = (1 − α) n
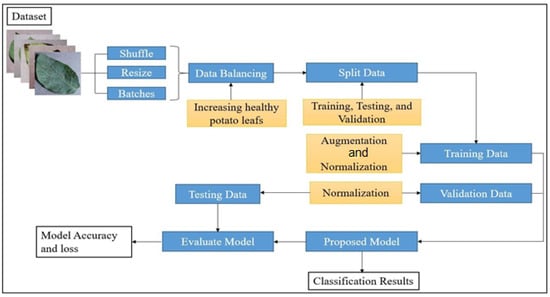
Figure 3.
Flowchart of the potato blight classification process.
The proposed classification model contains two blocks, each of which has a pair of convolution layers followed by a pooling layer. Both blocks are sandwiched between the pair of convolution layers and the pooling layer. The number of blocks can vary according to the application and the dataset. We intentionally reduced the pooling layers compared with the convolutional layers to reduce the loss of salient features, because pooling layers are prone to information loss due to dimensionality reduction [49,50]. We used the ReLU activation function in the convolution process to reduce linearity and vanishing gradient problems, thus restricting all the negative values in the feature maps and only allowing the positive values. The mathematical equation is shown in Equation (1).
A graphical representation of the working procedure of the ReLU activation function is shown in Figure 4, where the red colour is non-linearity and sky blue colour is rectifier.
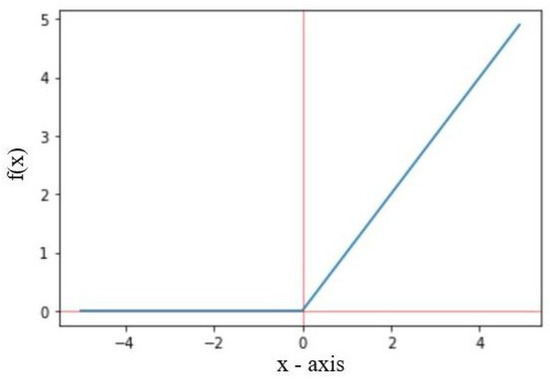
Figure 4.
Graph of the ReLU activation function.
To train the model, we used images with sizes of 256, 256, and 3. In the initial convolution layer of the model, we employed 32 kernels of 3 × 3 size with the ReLU activation function, followed by a pooling layer with a window size of 2 × 2. In the model, the output feature maps of the initial layers are assigned to Block 1, which comprises a pair of convolution layers followed by a max pooling layer. Each convolution layer has 64 kernels of size 3 × 3 and a max pool layer with a 2 × 2 window. The generated Block 1 feature maps are passed as inputs to Block 2, and the composition of Block 2 is the same as Block 1, except for the number of kernels. In Block 2, 128 kernels are used instead of 64 kernels. The output feature maps of Block 2 are further passed as inputs to the last layer of the model, which is the same as the first layer. In the last step, the output of the pooling layers is flattened before being used as an input to a fully connected NN. This network has two hidden layers and an output layer with three neurons, which is equal to the number of classes included in the dataset. To perform multiclass classification, we used SoftMax activation in the output layer. The architecture of the model is shown in Figure 5.
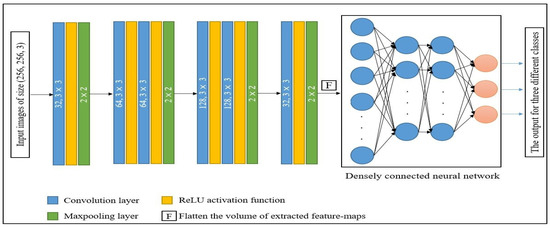
Figure 5.
Architecture of the proposed model.
5. Results
Here, we discuss the experimental setup, model evaluation, performance analysis, and comparison of the model with other existing models.
5.1. Experimental Setup
We used the Kaggle platform rather than a GPU to train and evaluate the proposed model. The model was implemented using TensorFlow version 2.6.4 with a total of 2652 potato leaf images. In the dataset, the images were distributed almost equally across the three classes. We trained the model using 2108 augmented images for 45 epochs and assessed it using 288 actual images. We found that the model had adequate performance, with 839,203 trainable parameters in 183 s of training time. Furthermore, we used an Adam optimiser with a learning rate of 0.001 to adjust the weights of neurons in the NN, as summarised in Table 4.

Table 4.
Broad summary of the model.
5.2. Evaluation Metrics and Performance Analysis
We evaluated the performance of the model using a confusion matrix to represent the classwise performance of the proposed model, as shown in Figure 6. The indices 0, 1, and 2 referred to the corresponding classes (i.e., early blight, late blight, and healthy, respectively). In addition, using a confusion matrix, we calculated the true and false positive and negative values for each class to analyse the performance of the model according to various parameters.
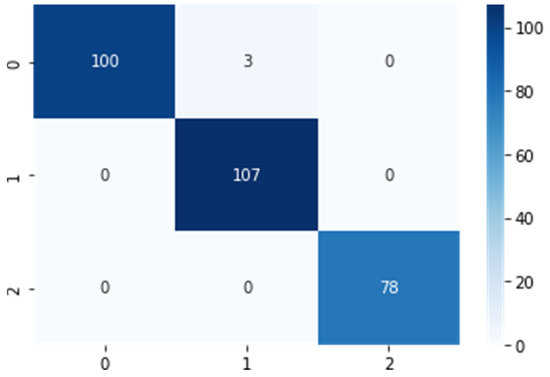
Figure 6.
Confusion matrix for the proposed model.
The term ‘true positive’ (TP) refers to the total number of pictures that were accurately predicted in the positive class, whereas ‘false positive’ (FP) refers to the total number of incorrectly predicted pictures in the positive class. Similarly, ‘true negative’ (TN) reflects the total number of accurately predicted photos in the negative class, whereas ‘false negative’ (FN) reflects the total number of incorrectly predicted images in the negative class. Many additional measures, such as accuracy, precision, recall, and F1-scores, were derived based on the confusion matrix.
Accuracy is the ratio of the TN to the total number of predictions (Equation (2)):
Precision can be defined as the ratio of TP to the total number of positive predicted samples, as shown in Equation (3):
Recall is the ratio of TP to the sum of the TP and FN samples (Equation (4)):
The F1-score can be calculated by taking a harmonic mean of the precision and recall values, as shown in Equation (5):
The class wise values for all the evaluation parameters for the proposed model are summarised in Table 5.

Table 5.
Performance analysis of the proposed model with testing data.
The model achieved an inclusive accuracy of 99%. Figure 7 shows examples of actual and predicted labelled results, along with their confidence values. The training process for the model, represented by accuracy and loss curves, is shown in Figure 8, which reveals a sudden rise and steep fall in accuracy and loss up to the seventeenth epoch but slow progress up to the thirty-fifth epoch and stagnant growth up to the forty-fifth epoch. Prediction = model.Predict(img_array), where img_array is an input image converted to array.
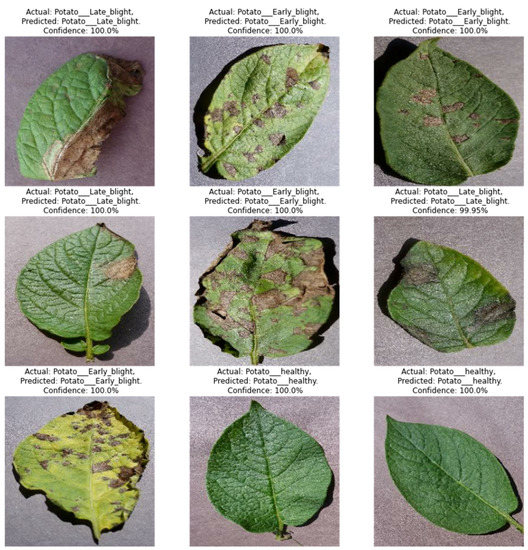
Figure 7.
Sample classification results.
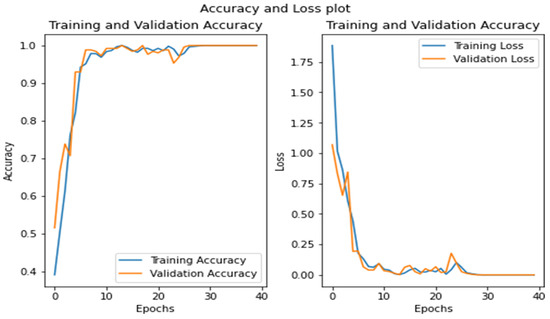
Figure 8.
Accuracy and loss curves for training and validation data.
The k-fold cross-validation approach was utilized to assess the model’s performance. The dataset was partitioned into k = 5 equal folds, with k−1 folds serving as the training set and the remaining fold used as the test set. The proposed model is trained and validated for 10 epochs with each fold of the dataset. This process was repeated k times, with each fold used once as the test set. Table 6 displays the average accuracy, precision, recall, and f1-score for each fold of data obtained through k-fold cross-validation. The mean and standard deviation for every k-fold cross-validation (k = 5) over training, testing, and validation dataset have been shown in Table 7.

Table 6.
The performance metrics of Accuracy, Precision, Recall, and F1-score using the k-fold cross-validation method (k = 5).

Table 7.
Average mean and standard deviation for training, testing, and validation dataset used in k-fold cross validation for k = 5.
6. Comparison with Existing Methods
In this stage of the research, we compared our model with the most recent research on potato blight classification using ML and DL techniques. We evaluated all the strategies using potato blight photos taken from the PlantVillage dataset to facilitate an objective comparison. We also compared the performance of the proposed model with the performance of some standard ML and DL algorithms, including random forest (RF), SVM, grey-level co-occurrence matrix (GLCM), CNN, and visual geometry group (VGG) networks. According to the findings of the comparative study, we determined that the proposed approach worked better than the other methods across all parameters.
Iqbal et al. [44] compared the effectiveness of various conventional ML techniques using potato leaf pictures taken from the PlantVillage dataset. They found that the RF method stood out in terms of accuracy compared to the other algorithms. Singh et al. [45] used GLCM to analyse and extract characteristics from blight photos taken from the PlantVillage collection. Then, the authors used an SVM technique to conduct potato blight classification using the collected characteristics. The PlantVillage dataset gave Islam et al. [46] 300 different potato leaf photos to work with, and they used the threshold approach to segment the pictures and locate RoI. In addition, they recommended training SVM models to classify blight disorders using segmented pictures. Chakraborty et al. [47] evaluated four different DL techniques (VGG 16, VGG 19, MobileNet, and ResNet 50) and compared their respective levels of performance. They classified potato leaf diseases using potato leaf photos taken from the PlantVillage dataset and found that fine-tuned VGG 16 achieved the highest accuracy at 97.8%. Mahum et al. [48] modified the DenseNet architecture by adding extra layers and evaluated the performance of the model using potato leaf images taken from the PlantVillage dataset. The model classified potato blight with an accuracy of 97.2%. Mohamed et al. [49] used potato leaf images from the PlantVillage dataset to train a four-layered CNN model and classified potato blight with an accuracy of 98.3%.
We compared our proposed model with some popular machine and DL algorithms, and with recent studies, as summarised in Table 8. In the proposed architecture, we reduced the pooling layers compared to the convolution layer to minimise the loss of salient features, and we performed more convolution in the middle two layers of the architecture to achieve maximum feature extraction. This novel arrangement of layers in the architecture outperformed all methods in terms of evaluation matrices.

Table 8.
Comparison of the proposed model with other models.
7. Conclusions
In this research, we customised the CNN model architecture to enhance performance with fewer trainable parameters, reduced computation time, and minimal information loss. To minimise the loss of salient features, we purposely reduced the pooling layers in the proposed architecture. The architecture contained two blocks, each of which comprised a pair of convolution layers, followed by a pooling layer. We validated the performance of the proposed model using potato blight images taken from the PlantVillage dataset, and the proposed model outperformed others, with an overall accuracy of 99% compared with similar studies using similar datasets. In the future, the performance of the proposed model should be assessed using a dataset with real-time potato blight images rather than segmented and pre-processed images. Moreover, the trainable parameters of the architecture could be further reduced without affecting the performance of the model or making it prone to overfitting.
Author Contributions
The design, implementation, and the concept of the work is completed by the M.H.A.-A., A.V., T.H.H.A. and D.K. The analysis of data is completed by the T.H.H.A. and D.K. All authors have read and agreed to the published version of the manuscript.
Funding
This research and the APC were funded by Deputyship for Research & Innovation, Ministry of Education in Saudi Arabia for funding this research work through the project number INST088.
Institutional Review Board Statement
Not applicable.
Informed Consent Statement
Not applicable.
Data Availability Statement
The data presented in this study are available here.
Acknowledgments
The authors extend their appreciation to the Deputyship for Research & Innovation, Ministry of Education in Saudi Arabia for funding this research work through the project number INST088.
Conflicts of Interest
The authors declare that they have no conflict of interest.
References
- Alston, J.M.; Pardey, P.G. Agriculture in the Global Economy. J. Econ. Perspect. 2014, 28, 121–146. [Google Scholar] [CrossRef]
- Contribution of Agriculture Sector towards GDP Agriculture Has Been the Bright Spot in the Economy despite COVID-19. Available online: https://www.pib.gov.in/indexd.aspx (accessed on 29 September 2022).
- Li, L.; Zhang, S.; Wang, B. Plant Disease Detection and Classification by Deep Learning—A Review. IEEE Access 2021, 9, 56683–56698. [Google Scholar] [CrossRef]
- Hwang, Y.T.; Wijekoon, C.; Kalischuk, M.; Johnson, D.; Howard, R.; Prüfer, D.; Kawchuk, L. Evolution and Management of the Irish Potato Famine Pathogen Phytophthora infestans in Canada and the United States. Am. J. Potato Res. 2014, 91, 579–593. [Google Scholar] [CrossRef]
- Vargas, A.M.; Ocampo, L.M.Q.; Céspedes, M.C.; Carreño, N.; González, A.; Rojas, A.; Zuluaga, A.P.; Myers, K.; Fry, W.E.; Jiménez, P.; et al. Characterization of Phytophthora infestans populations in Colombia: First report of the A2 mating type. Phytopathology 2009, 99, 82–88. [Google Scholar] [CrossRef] [PubMed]
- Fry, W.E. Phytophthora infestans: New Tools (and Old Ones) Lead to New Understanding and Precision Management. Annu. Rev. Phytopathol. 2016, 54, 529–547. [Google Scholar] [CrossRef] [PubMed]
- European and Mediterranean Plant Protection Organization. Phytophthora infestans on potato. EPPO 2008, 38, 268–271. [Google Scholar]
- Forbes, G.; Perez, W.; Piedra, J.A. Evaluacion de la Resistencia en Genotipos de Papa a Phytophthora infestans Bajo Condiciones de Campo: Guia Para Colaboradores Internacionales; International Potato Center: Lima, Peru, 2014.
- Dawod, R.G.; Dobre, C. Upper and Lower Leaf Side Detection with Machine Learning Methods. Sensors 2022, 22, 2696. [Google Scholar] [CrossRef]
- Khan, M.A.; Akram, T.; Sharif, M.; Javed, K.; Raza, M.; Saba, T. An automated system for cucumber leaf diseased spot detection and classification using improved saliency method and deep features selection. Multimed. Tools Appl. 2020, 79, 18627–18656. [Google Scholar] [CrossRef]
- Scientist, D.; Bengaluru, T.M.; Nadu, T. Rice Plant Disease Identification Using Artificial Intelligence. Int. J. Electr. Eng. Technol. 2020, 11, 392–402. [Google Scholar]
- Dubey, S.R.; Jalal, A.S. Adapted Approach for Fruit Disease Identification using Images. In Image Processing: Concepts, Methodologies, Tools, and Applications; IGI Global: Hershey, PA, USA, 2013; pp. 1395–1409. [Google Scholar]
- Yun, S.; Xianfeng, W.; Shanwen, Z.; Chuanlei, Z. PNN based crop disease recognition with leaf image features and meteorological data. Int. J. Agric. Biol. Eng. 2015, 8, 60–68. [Google Scholar]
- Li, G.; Ma, Z.; Wang, H. Image Recognition of Grape Downy Mildew and Grape. In Proceedings of the International Conference on Computer and Computing Technologies in Agriculture, Beijing, China, 29–31 October 2011; pp. 151–162. [Google Scholar]
- Rauf, H.T.; Saleem, B.A.; Lali, M.I.U.; Khan, M.A.; Sharif, M.; Bukhari, S.A.C. A citrus fruits and leaves dataset for detection and classification of citrus diseases through machine learning. Data Brief 2019, 26, 104340. [Google Scholar] [CrossRef] [PubMed]
- Sujatha, R.; Chatterjee, J.M.; Jhanjhi, N.; Brohi, S.N. Performance of deep learning vs. machine learning in plant leaf disease detection. Microprocess. Microsyst. 2021, 80, 103615. [Google Scholar] [CrossRef]
- Zhang, K.; Wu, Q.; Liu, A.; Meng, X. Can Deep Learning Identify Tomato Leaf Disease? Adv. Multimed. 2018, 2018, 10. [Google Scholar] [CrossRef]
- Amara, J.; Bouaziz, B.; Algergawy, A. A Deep Learning-based Approach for Banana Leaf Diseases Classification. In Proceedings of the BTW (Workshops), Stuttgart, Germany, 6–10 March 2017; pp. 79–88. [Google Scholar]
- Türkoğlu, M.; Hanbay, D. Plant disease and pest detection using deep learning-based features. Turk. J. Electr. Eng. Comput. Sci. 2019, 27, 1636–1651. [Google Scholar] [CrossRef]
- Ramcharan, A.; Baranowski, K.; McCloskey, P.; Ahmed, B.; Legg, J.; Hughes, D.P. Deep learning for image-based cassava disease detection. Front. Plant Sci. 2017, 8, 1852. [Google Scholar] [CrossRef] [PubMed]
- Karthik, R.; Hariharan, M.; Anand, S.; Mathikshara, P.; Johnson, A.; Menaka, R. Attention embedded residual CNN for disease detection in tomato leaves. Appl. Soft Comput. 2019, 86, 105933. [Google Scholar]
- Barbedo, J.G.A. Factors influencing the use of deep learning for plant disease recognition. Biosyst. Eng. 2018, 172, 84–91. [Google Scholar] [CrossRef]
- Vardhini, P.H.; Asritha, S.; Devi, Y.S. Efficient Disease Detection of Paddy Crop using CNN. In Proceedings of the 2020 International Conference on Smart Technologies in Computing, Electrical and Electronics (ICSTCEE), Bengaluru, India, 9–10 October 2020; pp. 116–119. [Google Scholar]
- Mohanty, S.P.; Hughes, D.P.; Salathé, M. Using Deep Learning for Image-Based Plant Disease Detection. Front. Plant Sci. 2016, 7, 1419. [Google Scholar] [CrossRef]
- Panigrahi, K.P.; Sahoo, A.K.; Das, H. A CNN Approach for Corn Leaves Disease Detection to support Digital Agricultural System. In Proceedings of the 4th International Conference on Trends in Electronics and Information, Tirunelveli, India, 15–17 June 2020; pp. 678–683. [Google Scholar]
- Narayanan, K.L.; Krishnan, R.S.; Robinson, Y.H.; Julie, E.G.; Vimal, S.; Saravanan, V.; Kaliappan, M. Banana Plant Disease Classification Using Hybrid Convolutional Neural Network. Comput. Intell. Neurosci. 2022, 2022, 9153699. [Google Scholar] [CrossRef]
- Jadhav, S.B.; Udupi, V.R.; Patil, S.B. Identification of plant diseases using convolutional neural networks. Int. J. Inf. Technol. 2021, 13, 2461–2470. [Google Scholar] [CrossRef]
- Abayomi-Alli, O.O.; Damaševičius, R.; Misra, S.; Maskeliūnas, R. Cassava disease recognition from low-quality images using enhanced data augmentation model and deep learning. Expert Syst. 2021, 38, e12746. [Google Scholar] [CrossRef]
- Abbas, A.; Jain, S.; Gour, M.; Vankudothu, S. Tomato plant disease detection using transfer learning with C-GAN synthetic images. Comput. Electron. Agric. 2021, 187, 106279. [Google Scholar] [CrossRef]
- Anh, P.T.; Duc, H.T.M. A Benchmark of Deep Learning Models for Multi-leaf Diseases for Edge Devices. In Proceedings of the 2021 International Conference on Advanced Technologies for Communications (ATC), Ho Chi Minh City, Vietnam, 14–16 October 2021; pp. 318–323. [Google Scholar]
- Kabir, M.M.; Ohi, A.Q.; Mridha, M.F. A Multi-plant disease diagnosis method using convolutional neural network. arXiv 2020, arXiv:2011.05151. [Google Scholar]
- Astani, M.; Hasheminejad, M.; Vaghefi, M. A diverse ensemble classifier for tomato disease recognition. Comput. Electron. Agric. 2022, 198, 107054. [Google Scholar] [CrossRef]
- Prodeep, A.R.; Hoque, A.M.; Kabir, M.M.; Rahman, M.S.; Mridha, M.F. Plant Disease Identification from Leaf Images using Deep CNN’s EfficientNet. In Proceedings of the 2022 International Conference on Decision Aid Sciences and Applications (DASA), Chiangrai, Thailand, 23–25 March 2022; pp. 523–527. [Google Scholar]
- Gokulnath, B.V. Identifying and classifying plant disease using resilient LF-CNN. Ecol. Inform. 2021, 63, 101283. [Google Scholar]
- Enkvetchakul, P.; Surinta, O. Effective Data Augmentation and Training Techniques for Improving Deep Learning in Plant Leaf Disease Recognition. Appl. Sci. Eng. Prog. 2022, 15, 3810. [Google Scholar] [CrossRef]
- Abade, A.; Ferreira, P.A.; de Barros Vidal, F. Plant diseases recognition on images using convolutional neural networks: A systematic review. Comput. Electron. Agric. 2021, 185, 106125. [Google Scholar] [CrossRef]
- Dhaka, V.S.; Meena, S.V.; Rani, G.; Sinwar, D.; Ijaz, M.F.; Woźniak, M. A survey of deep convolutional neural networks applied for prediction of plant leaf diseases. Sensors 2021, 21, 4749. [Google Scholar] [CrossRef]
- Nagaraju, M.; Chawla, P. Systematic review of deep learning techniques in plant disease detection. Int. J. Syst. Assur. Eng. Manag. 2020, 11, 547–560. [Google Scholar] [CrossRef]
- Kamilaris, A.; Prenafeta-Boldú, F.X. Deep learning in agriculture: A survey. Comput. Electron. Agric. 2018, 147, 70–90. [Google Scholar]
- Fernández-Quintanilla, C.; Peña, J.; Andújar, D.; Dorado, J.; Ribeiro, A.; López-Granados, F. Is the current state of the art of weed monitoring suitable for site-specific weed management in arable crops? Weed Res. 2018, 58, 259–272. [Google Scholar] [CrossRef]
- Lu, J.; Tan, L.; Jiang, H. Review on convolutional neural network (CNN) applied to plant leaf disease classification. Agriculture 2021, 11, 707. [Google Scholar] [CrossRef]
- Golhani, K.; Balasundram, S.K.; Vadamalai, G.; Pradhan, B. A review of neural networks in plant disease detection using hyperspectral data. Inf. Process. Agric. 2018, 5, 354–371. [Google Scholar] [CrossRef]
- Bangari, S.; Rachana, P.; Gupta, N.; Sudi, P.S.; Baniya, K.K. A Survey on Disease Detection of a potato Leaf Using CNN. In Proceedings of the 2nd IEEE International Conference on Artificial Intelligence and Smart Energy (ICAIS), Coimbatore, India, 23–25 February 2022; pp. 144–149. [Google Scholar]
- Iqbal, M.A.; Talukder, K.H. Detection of potato disease using image segmentation and machine learning. In 2020 International Conference on Wireless Communications Signal Processing and Networking (WiSPNET); IEEE: Piscataway, NJ, USA, 2020; pp. 43–47. [Google Scholar]
- Singh, A.; Kaur, H. Potato plant leaves disease detection and classification ussing machine learning methodologies. In IOP Conference Series: Materials Science and Engineering; IOP Publishing: Bristol, UK, 2021; Volume 1022, p. 012121. [Google Scholar]
- Islam, M.; Dinh, A.; Wahid, K.; Bhowmik, P. Detection of potato diseases using image segmentation and multiclass support vector machine. In 2017 IEEE 30th Canadian Conference on Electrical and Computer Engineering (CCECE); IEEE: Piscataway, NJ, USA, 2017; pp. 1–4. [Google Scholar]
- Chakraborty, K.K.; Mukherjee, R.; Chakroborty, C.; Bora, K. Automated recognition of optical image based potato leaf blight diseases using deep learning. Physiol. Mol. Plant Pathol. 2022, 117, 101781. [Google Scholar] [CrossRef]
- Mahum, R.; Munir, H.; Mughal, Z.U.N.; Awais, M.; Sher Khan, F.; Saqlain, M.; Mahamad, S.; Tlili, I. A novel framework for potato leaf disease detection using an efficient deep learning model. Hum. Ecol. Risk Assess. Int. J. 2023, 29, 303–326. [Google Scholar] [CrossRef]
- Aldhyani, T.H.H.; Nair, R.; Alzain, E.; Alkahtani, H.; Koundal, D. Deep Learning Model for the Detection of Real Time Breast Cancer Images Using Improved Dilation-Based Method. Diagnostics 2022, 12, 2505. [Google Scholar] [CrossRef] [PubMed]
- Aldhyani, T.H.H.; Verma, A.; Al-Adhaileh, M.H.; Koundal, D. Multi-Class Skin Lesion Classification Using a Lightweight Dynamic Kernel Deep-Learning-Based Convolutional Neural Network. Diagnostics 2022, 12, 2048. [Google Scholar] [CrossRef]
- Mohamed, S.I. Potato leaf disease diagnosis and detection system based on convolution neural network. Int. J. Recent Technol. Eng. 2020, 9, 254–259. [Google Scholar] [CrossRef]
Disclaimer/Publisher’s Note: The statements, opinions and data contained in all publications are solely those of the individual author(s) and contributor(s) and not of MDPI and/or the editor(s). MDPI and/or the editor(s) disclaim responsibility for any injury to people or property resulting from any ideas, methods, instructions or products referred to in the content. |
© 2023 by the authors. Licensee MDPI, Basel, Switzerland. This article is an open access article distributed under the terms and conditions of the Creative Commons Attribution (CC BY) license (https://creativecommons.org/licenses/by/4.0/).