Article

Implementation of a Collaborative Recommendation System Based on Multi-Clustering

by
Lili Wang
1,2,†,
Sunit Mistry
1,*,†,
Abdulkadir Abdulahi Hasan
1,
Abdiaziz Omar Hassan
3,
Yousuf Islam
4 and
Frimpong Atta Junior Osei
5
1
School of Mathematics and Big Data, Anhui University of Science and Technology, Huainan 232000, China
2
Anhui Province Engineering Laboratory for Big Data Analysis and Early Warning Technology of Coal Mine Safety, Huainan 232001, China
3
International School of Design, Zhejiang University, Ningbo 315100, China
4
School of Physics and Electronics, Central South University, Changsha 410083, China
5
Department of Computer Science, University of Oregon, Eugene, OR 97403, USA
*
Author to whom correspondence should be addressed.
These authors contributed equally to this work.
Mathematics 2023, 11(6), 1346; https://doi.org/10.3390/math11061346
Submission received: 11 February 2023 / Revised: 6 March 2023 / Accepted: 8 March 2023 / Published: 10 March 2023

Abstract

:
The study aims to present an architecture for a recommendation system based on user items that are transformed into narrow categories. In particular, to identify the movies a user will likely watch based on their favorite items. The recommendation system focuses on the shortest connections between item correlations. The degree of attention paid to user-group relationships provides another valuable piece of information obtained by joining the sub-groups. Various relationships have been used to reduce the data sparsity problem. We reformulate the existing data into several groups of items and users. As part of the calculations and containment of activities, we consider Pearson similarity, cosine similarity, Euclidean distance, the Gaussian distribution rule, matrix factorization, EM algorithm, and k-nearest neighbors (KNN). It is also demonstrated that the proposed methods could moderate possible recommendations from diverse perspectives.

1. Introduction

It has become increasingly popular to watch movies online rather than through traditional television experiences. However, this shift also requires adjusting the patterns used to make recommendations in order to keep up with faster consumption rates. While an individual cannot automatically introduce new preferences to the recommendation system based on a set of parameters, it is still challenging to identify how various evidence and procedures can be combined to form recommendations. Typically, users’ preferences are based on previous information gathered from other users with comparable or similar interests. With the availability of user activity datasets from streaming sites, e-commerce sites, and social media networks, it is now easier to analyze what users are interested in [1,2]. The primary purpose of a recommendation system is to provide users with specified item recommendations through information filtering. This has become a commercial platform for recommending the best items to users [3,4,5,6]. In addition to supporting users in various decision-making processes, recommender systems can help with decisions such as “what books to read,” “where to go,” “what news to read,” “what song to play,” “what hotel to book,” and “what movie to watch”. Our study focuses on collaborative filtering, which is content-driven recommendation based on various data types, such as origin, actors, directors, genre, language, country, etc. Most online recommender systems provide no insight into the reasoning behind their recommendations or any validation for their existence. Present recommender systems do not provide users with an easy-to-understand model underlying the numerical methods used. This makes it difficult for the system to clearly explain what factors and procedures led it to make specific recommendations, which, in turn, makes it difficult for users to understand its reasoning [7].
It is possible to acquire opinions for recommendations based on the given requirements. These conditions pose a problem in determining “how to recommend a movie”. We have presented a preference-based choice standard that mixes two events to resolve this challenge. Using the significance of preference standards between rules, we will determine which sequencing preference could easily find the most suitable combination by switching to several filtering-based recommendations of others. By switching the significance of rules, we can mix elements in unexpected circumstances to find similarities between two or more parts.
Several earlier studies implemented the use of the user-item database for the highest recommendations [8,9]. Artificial neural networks (ANN) efficiently find similarities [10], and collaborative filtering determines which users have similar preferences concerning other users [11,12]. It is calculated based on the information available in the dataset and specifies interests among users. The user’s apparent interests can be established by providing the preferences of other users [13,14]. Showing an explicit interest can be challenging because the data is thin, or the information is difficult to obtain. The situation can be improved by designing a metric to estimate the correct category between similar items.
These steps summarize the purpose of the study:
  • The proposed algorithm calculates similarity based on user ratings; the system recommends the most correlated movie list.
  • Recommending appropriate movies based on a user’s characteristics; determine the item type (genre) based on behavioral information.
  • Using item information and user interaction data, we designed a double-end attention mechanism to determine the user’s preferences and social relationships. In this way, we can identify users’ preferences, distinguish the importance of user relationships, and identify neighbors who influence users’ preferences significantly.
The remaining parts of this paper are organized as follows: background study in Section 2; introduction of datasets and several study issues in Section 3; defining problems and outlining the proposed methods in Section 4; experiments and results in Section 5; discussing final recommendations and challenges in Section 6; and conclusion in Section 7.

2. Related Work

The algorithm utilized both singular value decomposition and cosine similarity algorithms to predict which items would be most familiar to the active user. User-item ratings were collected after browsing and obtaining behavior, then converted into input data known as a user-item matrix. This matrix was then reduced according to the latent factors based on the cosine similarity between the user and item. Other studies have explored artificial intelligence (AI) applications in online shopping experiences, including recommender systems used in finance. In this study, we applied collaborative filtering approaches to the IMDb datasets and used the k-nearest neighbors (KNN) and collaborative filter (CF) methods to build a recommendation system [15,16,17,18,19,20]. Our study focused on increasing accuracy by reducing computation time while maintaining precision, as demonstrated in an earlier study [21]. However, we need to address data separation issues to increase the method’s effectiveness. Other studies in computer vision and content-based video retrieval in recommender systems have explored these topics only marginally [10]. Knowledge of recommendation methods can help us analyze community-based networks. Effective recommendation systems for items require the identification of communities within a complex system, as demonstrated in previous works [22,23]. In the context of movie recommendations, this is achieved by predicting a user’s potential rating for a new movie based on their previous ratings and behaviors [12,24].
Several methods are used for different recommendation systems based on the diverse perspectives discussed in this study [25]. Content-based recommendations work well for recommending items with specific attributes or characteristics, and they can make recommendations for new users and items. These recommendations have the difficulty of recommending only similar items without taking into account the users’ broader interests, including content or attributes such as genre, director, actors, and plot to identify patterns and similarities [26,27]. Demographic recommendations can personalize recommendations for different user groups but may stereotype users. Utility-based recommendations can identify items that users have interacted with but may not capture broader interests [28,29,30]. Knowledge-based recommendations can recommend items that meet specific user requirements but may not capture implicit preferences. Hybrid recommendations can combine the strengths of different techniques but may be more complex. Further research is necessary to explore the effectiveness and limitations of each technique in various domains and applications [31]. However, the disadvantages of those recommendation methods are diverse, ranging from limitations in the scope of recommendations to the complexity of possibly needing to consider users’ broader interests [32]. In contrast, demographic recommendations may lead to stereotyping. Knowledge-based recommendations may be limited to explicit knowledge, but hybrid recommendations can provide more accurate results and may require more resources and complexity [33,34,35,36].
In a recent study, author Manzato analyzed movie genres, reviews, and actors to recommend a movie that could be associated with traditional factorization methods [37]. Multi-view recommendations are more challenging than classifying and ranking movies because of their unique characteristics [38]. We focus on predicting and comparing ratings from different viewpoints because the rating values of movies may differ between viewpoints. For example, if a movie receives a rating of 8/10 for its story or best actors, it does not mean that each movie viewpoint evaluates the same perspective [39,40,41]. When there are only a few instances in the training set, we revise item ratings during the co-training process to account for variability. However, Alibaba, Amazon, eBay, and Flipkart are e-commerce websites using recommendation systems extensively [42,43]. Social media, online music, video streaming platforms, and e-learning portals are among the most popular [44,45,46]. Video streaming sites have benefitted from recommendation systems by improving algorithm performance [47] and has also revealed that user engagement has increased significantly since highly efficient recommender algorithms were implemented [48]. Several methods can be used to determine whether the available content is similar to the user’s perception, including Jaccard similarity [49], cosine similarity [50], and Pearson similarity [51].

3. Overview of the Recommendation System

This section presents the abilities of datasets and challenges. We learned that collaborative filtering systems are additionally more accurate than traditional ones because of the combination of several methods that avoid limitations and increase accuracy. Earlier in the development of movie recommendations, they focused exclusively on the apparent scores given to movies by users [52].

3.1. Datasets

The user’s preferred movie genre, such as action, romance, animation, etc., is determined from the IMDb dataset [19], as an example presented in Table 1. We utilized the user’s chosen movie genre from the dataset by examining the user’s past viewing history and filtering out the unfavorable genres for new users, following earlier studies [53,54]. It is the process of multiplying two different types of entities to generate hidden features. The CF matrix factorization application determines related items [55]. The recommendation model endures high computational complexity and low accuracy due to its reliance on user ratings. In contrast, our study categorizes movie attributes such as story, cast, production, etc., and utilizes them to generate recommendations, as shown in Table 2. By focusing on these categories rather than relying solely on user ratings, we are able to achieve higher accuracy in our recommendations (Table 1).

3.2. Performance

A movie list can be assembled by identifying movies associated with a favorite genre by the target user and their related genres. We can identify movies related to the target user’s preferred actors, genre, ratings, story, and production, as mentioned in [53]. We conducted a preliminary survey to select a suitable sample of datasets. Interested in movies and looking for information from the initial survey results, respondents matched most of the above criteria. The user-rated 0 to 10 items were selected from a representative list, and user-groups were determined based on various demographic characteristics following earlier studies [5,56]. We also collected supporting information about how users choose movies, which we prioritized into three categories: items rated higher, lower, and unrated.
The challenges to the methods are the following:
  • Collaborative filtering is necessary to collect and analyze data transactions regarding the user’s actions and backgrounds. Then, predictions are made about which users will become engaged by their similarities to other users.
  • As a basis for our analysis, we considered the “IMDb 5000 movies” and “IMDb 5000 credits” datasets, which totaled 3,315,117 and included votes (0 to 10), resulting in a total of 4804 movies. The details contained budget, genres, movie ID, cast, crew, language, movie names, production, countries, release date, and revenue [19,53].
  • Different levels of combination techniques have been considered, such as statistical summarization [57], and Gaussian mixture models (GMM) [58,59].
  • In addition to parts of tags, a Naive Bayes classification method is used for a semantic approach [54]. We considered the point-wise mutual information difference between an item with a positive connotation and a term with a negative connotation.
  • Coefficients contain similar cluster users for more accurate clusters [59].

4. Proposed Method

This section describes the algorithms used in this experiment to provide a better understanding of how they work. To begin, we need to identify the entities involved in this experiment’s main components for investigating user preferences. The proposed recommendation system illustrated in Figure 1 considered user-based collaborative filtering. Therefore, clustering users or items together applied groups of similar users together based on their behavior or preferences. Users within the same cluster are more likely to have similar preferences and behaviors, so recommendations can be made based on the behavior of other users within the same cluster. After finding similarities in the recommendation system, muti-clustering is used to group similar items together based on their attributes or popularity. Items within the same cluster are more likely to be similar or complementary, so our recommendations can be made based on the behavior of users who have interacted with other items within the same cluster in historical aspect.
To achieve higher performance, the users must explore their past viewing history and filter out unwanted items. Initially, users must express their genre preferences explicitly, and the filtering method uses information from the user’s profile to generate similar recommendations based on their genre preferences. Object representations are not taken into account when recommending movies through collaborative filtering. When users become regular users, they are surveyed based on their demographic characteristics by a similar group of users. The cluster group’s movie categories will most likely be considered when collecting datasets, and the general datasets will be analyzed before filtering begins.
We propose a method for several categorical clustering of users and items so that similar preferences can be combined to predict accurately by considering neighbor-based similarities, as shown in Figure 1. Generally, an algorithm of this type can be divided into two phases. The above operators provide a method by which information can be enriched over time in the population [60,61,62]. When a predetermined number of generations or a fitness threshold is reached, k-means algorithm iterations are terminated.

4.1. Problem Implementation

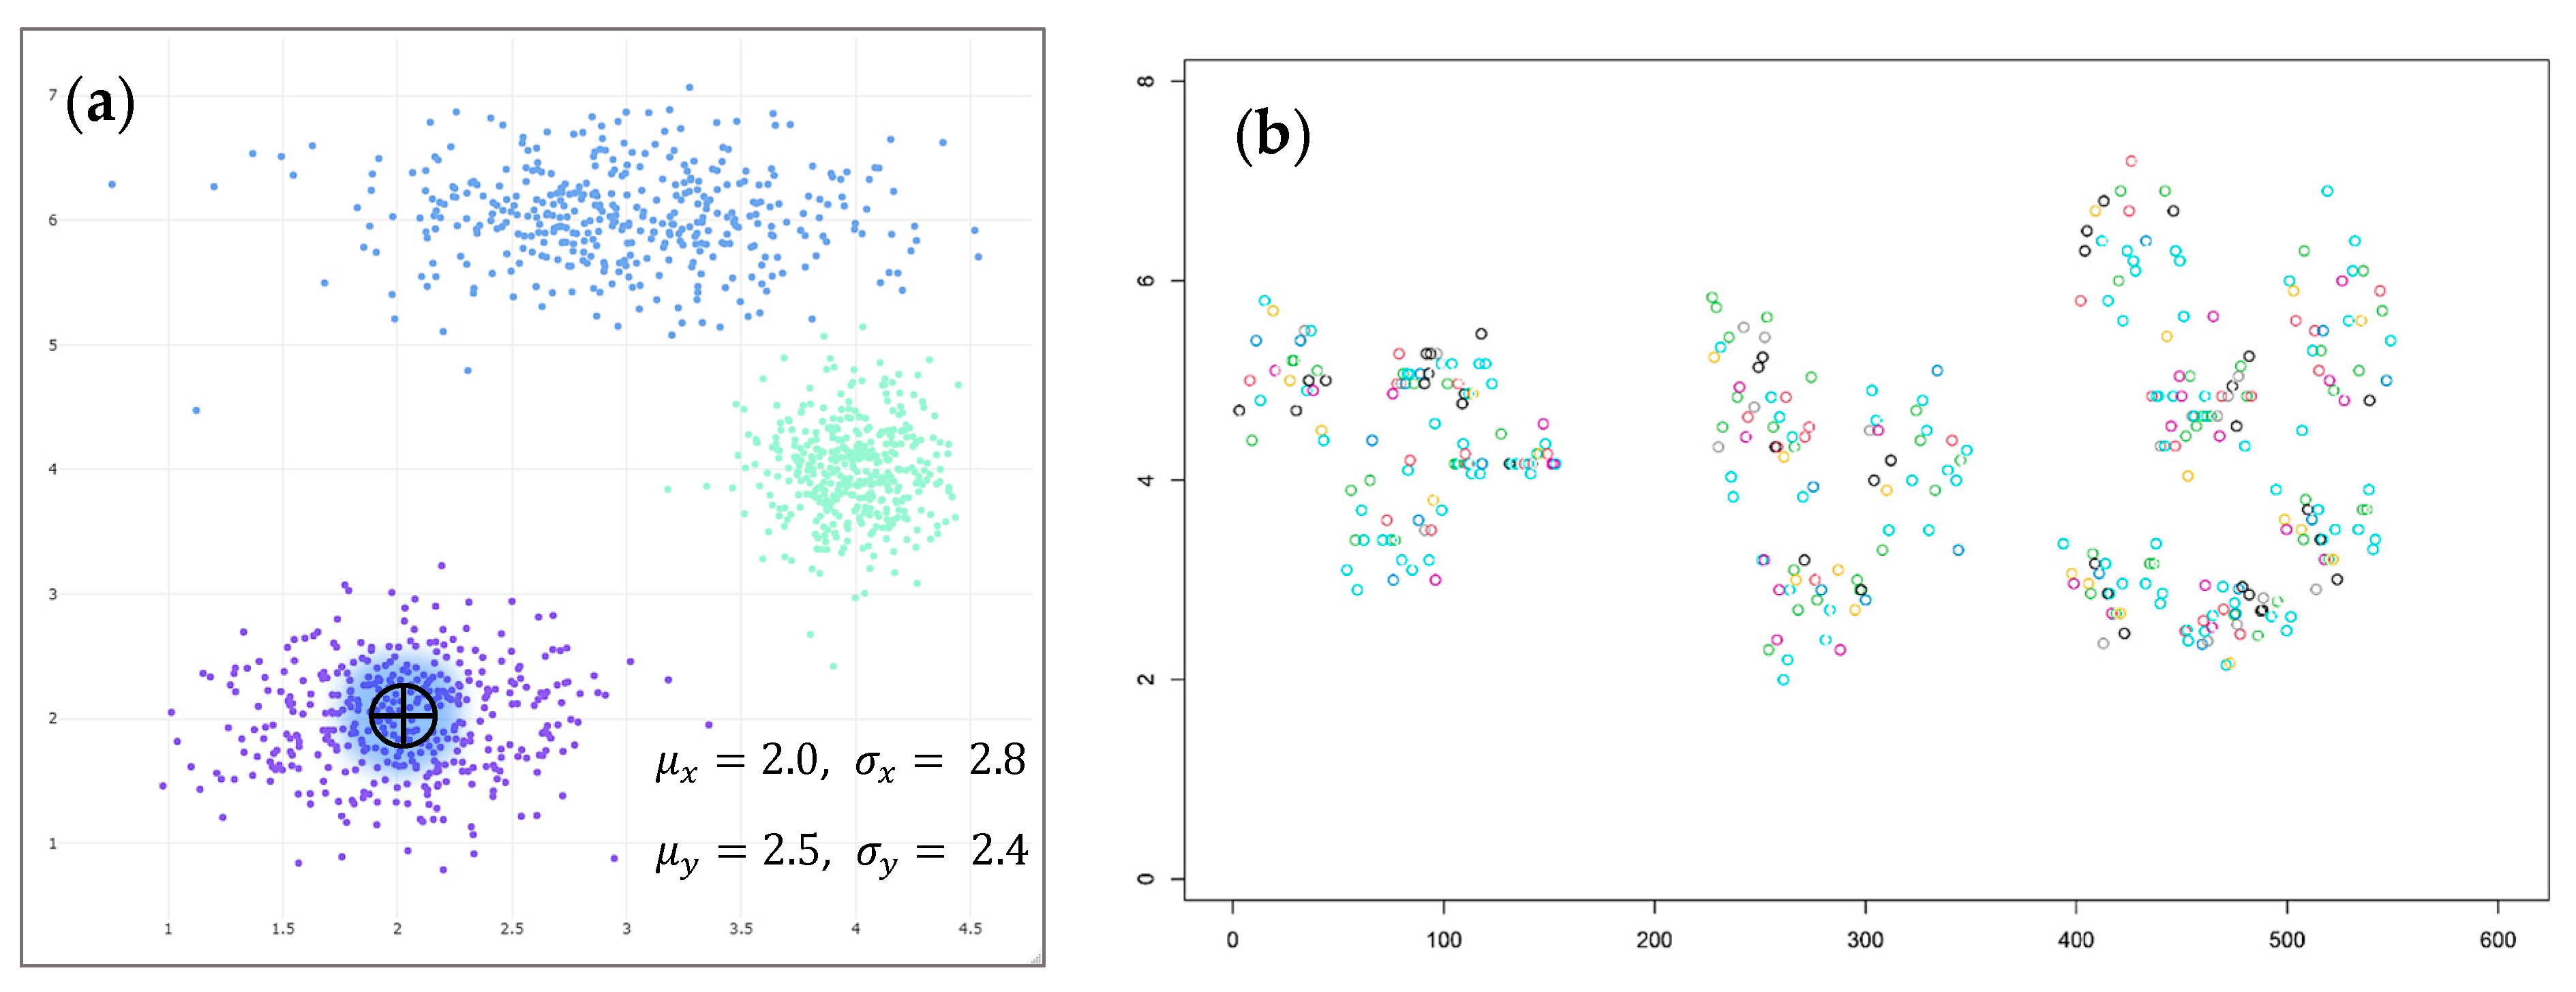
Our first step is determining which genre is most dominant for users. To determine this, we combine the average rating with the items to calculate the ratings of each user. Consider that the relationship constant of items i1… in to each user u1… un is related to the function of raw scores and means. This is achieved by calculating the ratings of each user based on the average ratings of items they have rated. When there is uncertainty about which movies are available in the application, this system can be used to rank items for more accurate recommendations. The distance between two items is calculated based on their attribute values, using probabilities instead of actual space values to find similar items. However, ranked by an expert system for the most accurate recommendation when it is uncertain which movies are available in the application, we consider finding similar items in the users’ historical datasets, and the distance between two items has its own attribute value. Proximity was calculated as presented in Figure 2a, using a probabilistic approach rather than actual space values such as importance, significance, or regularity. However, this method poses a challenge in representing users’ preferences in genres such as “horror” and “adventure” with a distance value, as illustrated in Figure 2b. For example, suppose a user has watched a movie in the “action” category, while two other movies are in the “horror” category. In that case, it may be challenging to determine the user’s preference between the two genres.
Item sets indicate the movies that have been viewed by users. Users who have been watching a targeted movie are specified. For example, consider the case where a user watched a movie. Our system can be integrated with a personal search or recommendation request to suggest movies to users based on their preferences. It is essential to notice that real-world data are always biased. This suggests movies they should watch based on what they “like”, and what the recommendation system believes users will be interested in watching. While recommendation systems could have made a probabilistic approach that ensures filtering algorithms assume that users will see random movies [63]. Without violating the users’ privacy, these recommendation systems learn the hidden characteristics of users and items and provide recommendations based on those characteristics. Users are more likely to fill in user preference attributes that need to be added. Items’ popularity has a profound effect on the probability of being watched. Popular items may be advertised to a larger audience. Accordingly, item popularity can directly impact a user’s experience with the recommendation system.
There have been several dynamical models developed for other methods of movie recommendations. WMF (weighted matrix factorization) [64] is a probability for the user to be visible to an item whose data has confidence in WMF.
x ¯ = w i x i + w j x j + w n x n w j + w j + w n
Definition 1. 
The number of terms is n , and this can be reached by using two weighted averages: w , weighted average, and w i , weight for each of the x values, and the x i data values to be averaged as shown in Figure 2a. Fundamentally, the weighted mean of a non-empty finite tuple of data elements consists of those elements with a large weight, and those with a low weight contributing less to the weighted mean. The weights cannot be negative, or perhaps possibly zero, because zero cannot be divided by zero.

4.2. Computation

According to Equation (2), the similarity component calculates between two items based on the movie’s average rating value. It is a different case of the quantity purpose to measure how much variance in i can be clarified by j .
s i m ( i , j ) = ( m o v i e i a v g R a t e ) × ( m o v i e j a v g R a t e ¯ ) ( a v g R a t e i a v g R a t e ) 2 × ( m o v i e j a v g R a t e ¯ ) 2
Definition 2. 
In this case, following the Gaussian distribution rule [65], we can apply a feature of most miniature square regression models, namely the sample covariance between two samples. s i m i , j 2 is the quantity of adjustment in linear function of x .
d i , j = ( x i 1 x j 1 ) 2 + ( x i 2 x j 2 ) 2 + + x i k x j k 2
Definition 3. 
The distance between two points, d i , j 0 , for example “action”, and “adventure”, where  k is the number of independent variables d i , j d i , k + d j , k , evaluate the user’s highest average votes, we define the cosine triangle similarity [66] equation in this way, and the search space can be pruned by applying transitive bounds to distances.
However, we define a direct path from x to y where the measured path z is the longest path, and any diversion over another point is at least as long. This is met by many distance measures following Euclidean distance [67]. Distance measures convene this property, and, in such situations, we employed the cosine function as x z y z x y x z + y z . When the cosine function is reversed, we can define each parameters’ cosine similarity 1 s i m i x y 1 s i m i x y + 1 s i m i y z assuming that the similarity of a data point s i m i y z is known. This forms of the triangle inequality and is used to limit the minimum and maximum similarity between two data points, s i m i x y < s i m i x y . As a formal distance metric, the normalized angle between data points x and y, referred to as angular distance, can be calculated by computing the cosine similarity 1 s i m i x y < s i m i x y + s i m i y z . To define a function for angular similarity bounded between 0 and 1 , the complement of the angular distance metric can be used in Equation (6) as:
D i s t a n c e   θ = 2 × a r c c o s × c o s i n e   s i m i l a r i t y π = 2 θ π
For each sample, the probability of each badge is calculated, and the badge with the highest probability is output. This system is based on a Gaussian mixtures model [58] to improve performance. As a result of Section 6.2, primarily natural language processing and text analysis applications, this algorithm was an excellent choice for movie analysis.
p ( θ ) = i = 1 K ~ i N ( x μ i ~ , Σ i ~ )
Definition 4. 
The definitions are described as follows: distributions of the data points are i ~ , means are μ i , and covariance matrices are Σ i ~ . An effective way to include Bayesian approximation is to multiply the prior by the distribution, known as p x | θ of the data trained on the limitation in θ to be valued. With this expression, the subsequent distribution p x | θ is also maximizing the likelihood approximation p θ .
μ = 1 m i x i Σ = 1 m i ( x i μ ) T × ( x i μ )
Independently assign models replacement from the dataset X = x 1 , , x N to the element to another element μ ^ i , , μ ^ k . Set all element variance approximations to the variance σ ^ 1 2 σ ^ k 2 = 1 N i = 1 N x i x ¯ 2 , where x ¯ is means x ¯ = 1 N i = 1 N x i , and set all elements prior to calculate the uniform distribution ϕ ^ 1 ϕ ^ k = 1 k , where γ ^ i k is the probability that x i is generated by component C k , when the expectation is:
γ ^ i k = ϕ ^ k N x i μ ^ k , σ ^ k j = 1 k ϕ ^ k × N x i μ ^ j , σ ^ 3
Maximization is obtained using γ ^ i k = ϕ ^ k = i = 1 N γ ^ i k N . When the number of elements K is not known a priori, models are typically fitted to data using the EM algorithm [68] by guessing the number of elements.
a b f x d x = P r a X b b i = b x i = x i b b x i b b + x i a a a i = a x i = 1 b i μ b = b 1 x 1 + b 1 x 2 + + b n x n b 1 + b 2 + + b n μ a = a 1 x 1 + a 1 x 2 + + a n x n a 1 + a 2 + + a n σ b 2 = b 1 x 1 μ b 2 + + b n x n μ b 2 b 1 + b 2 + + b n σ a 2 = a 1 x 1 μ a 2 + + b n x n μ a 2 a 1 + a 2 + + a n Estimate   p b = b 1 + b 2 + + b n n     p a = 1 p b
Definition 5. 
When F x continues at x , a , the random variable X has a density F x where f x is non-negative. Intuitively, one can think of f x d x as being the probability of X falling within the infinitesimal interval, x , x + d x , and a probability that the variate has the value x. For continuous functions, the probability density function (PDF) is used [69]. Continuity distributions are often expressed using an integral between two points since a single point has a zero probability.
In the form of movie recommendation, Algorithm 1 filtering generates a user profile that represents their preferences based on the movies they’ve watched previously and then recommends the top movies from those they haven’t seen. Based on the distance between the content of these movies, the recommendation is derived. However, the method does not take into account evidence about movies the user has not previously seen. Without this data, the user may not care about the movie in question. A negative information container that calculates the distance between each effect can be used to provide more accurate recommendations. Users dislike not having the option to filter out recommendations based on movies they don’t want to see, as this destroys the information provided by the proposals.
Algorithm 1: Similarity
Mathematics 11 01346 i001

5. Experiments and Results

In this section, experiments involved testing different hyperparameter settings, such as using multiple nearest data points, calculating the data point distance, and circulation level distance, as described in Section 5.1. The goal was to determine the optimal locations for each module to improve the overall performance of the proposed recommendation system by using Algorithm 1. For example, using multiple nearest data points can help to increase the accuracy of recommendations, as presented in Section 5.2, while calculating the data points distance can help find similar items more effectively. The circulation level distance is used to determine how often a particular item is recommended to a user, which can affect user satisfaction with the system. By testing different hyperparameter settings, we aimed to identify the best configuration for each module to achieve the highest level of performance in the recommendation system as presented in Section 5.3. The experiments conducted in this section aimed to improve the accuracy and effectiveness of the recommendation system by optimizing each module’s performance through the use of appropriate hyperparameter settings.

5.1. Cluster Analysis

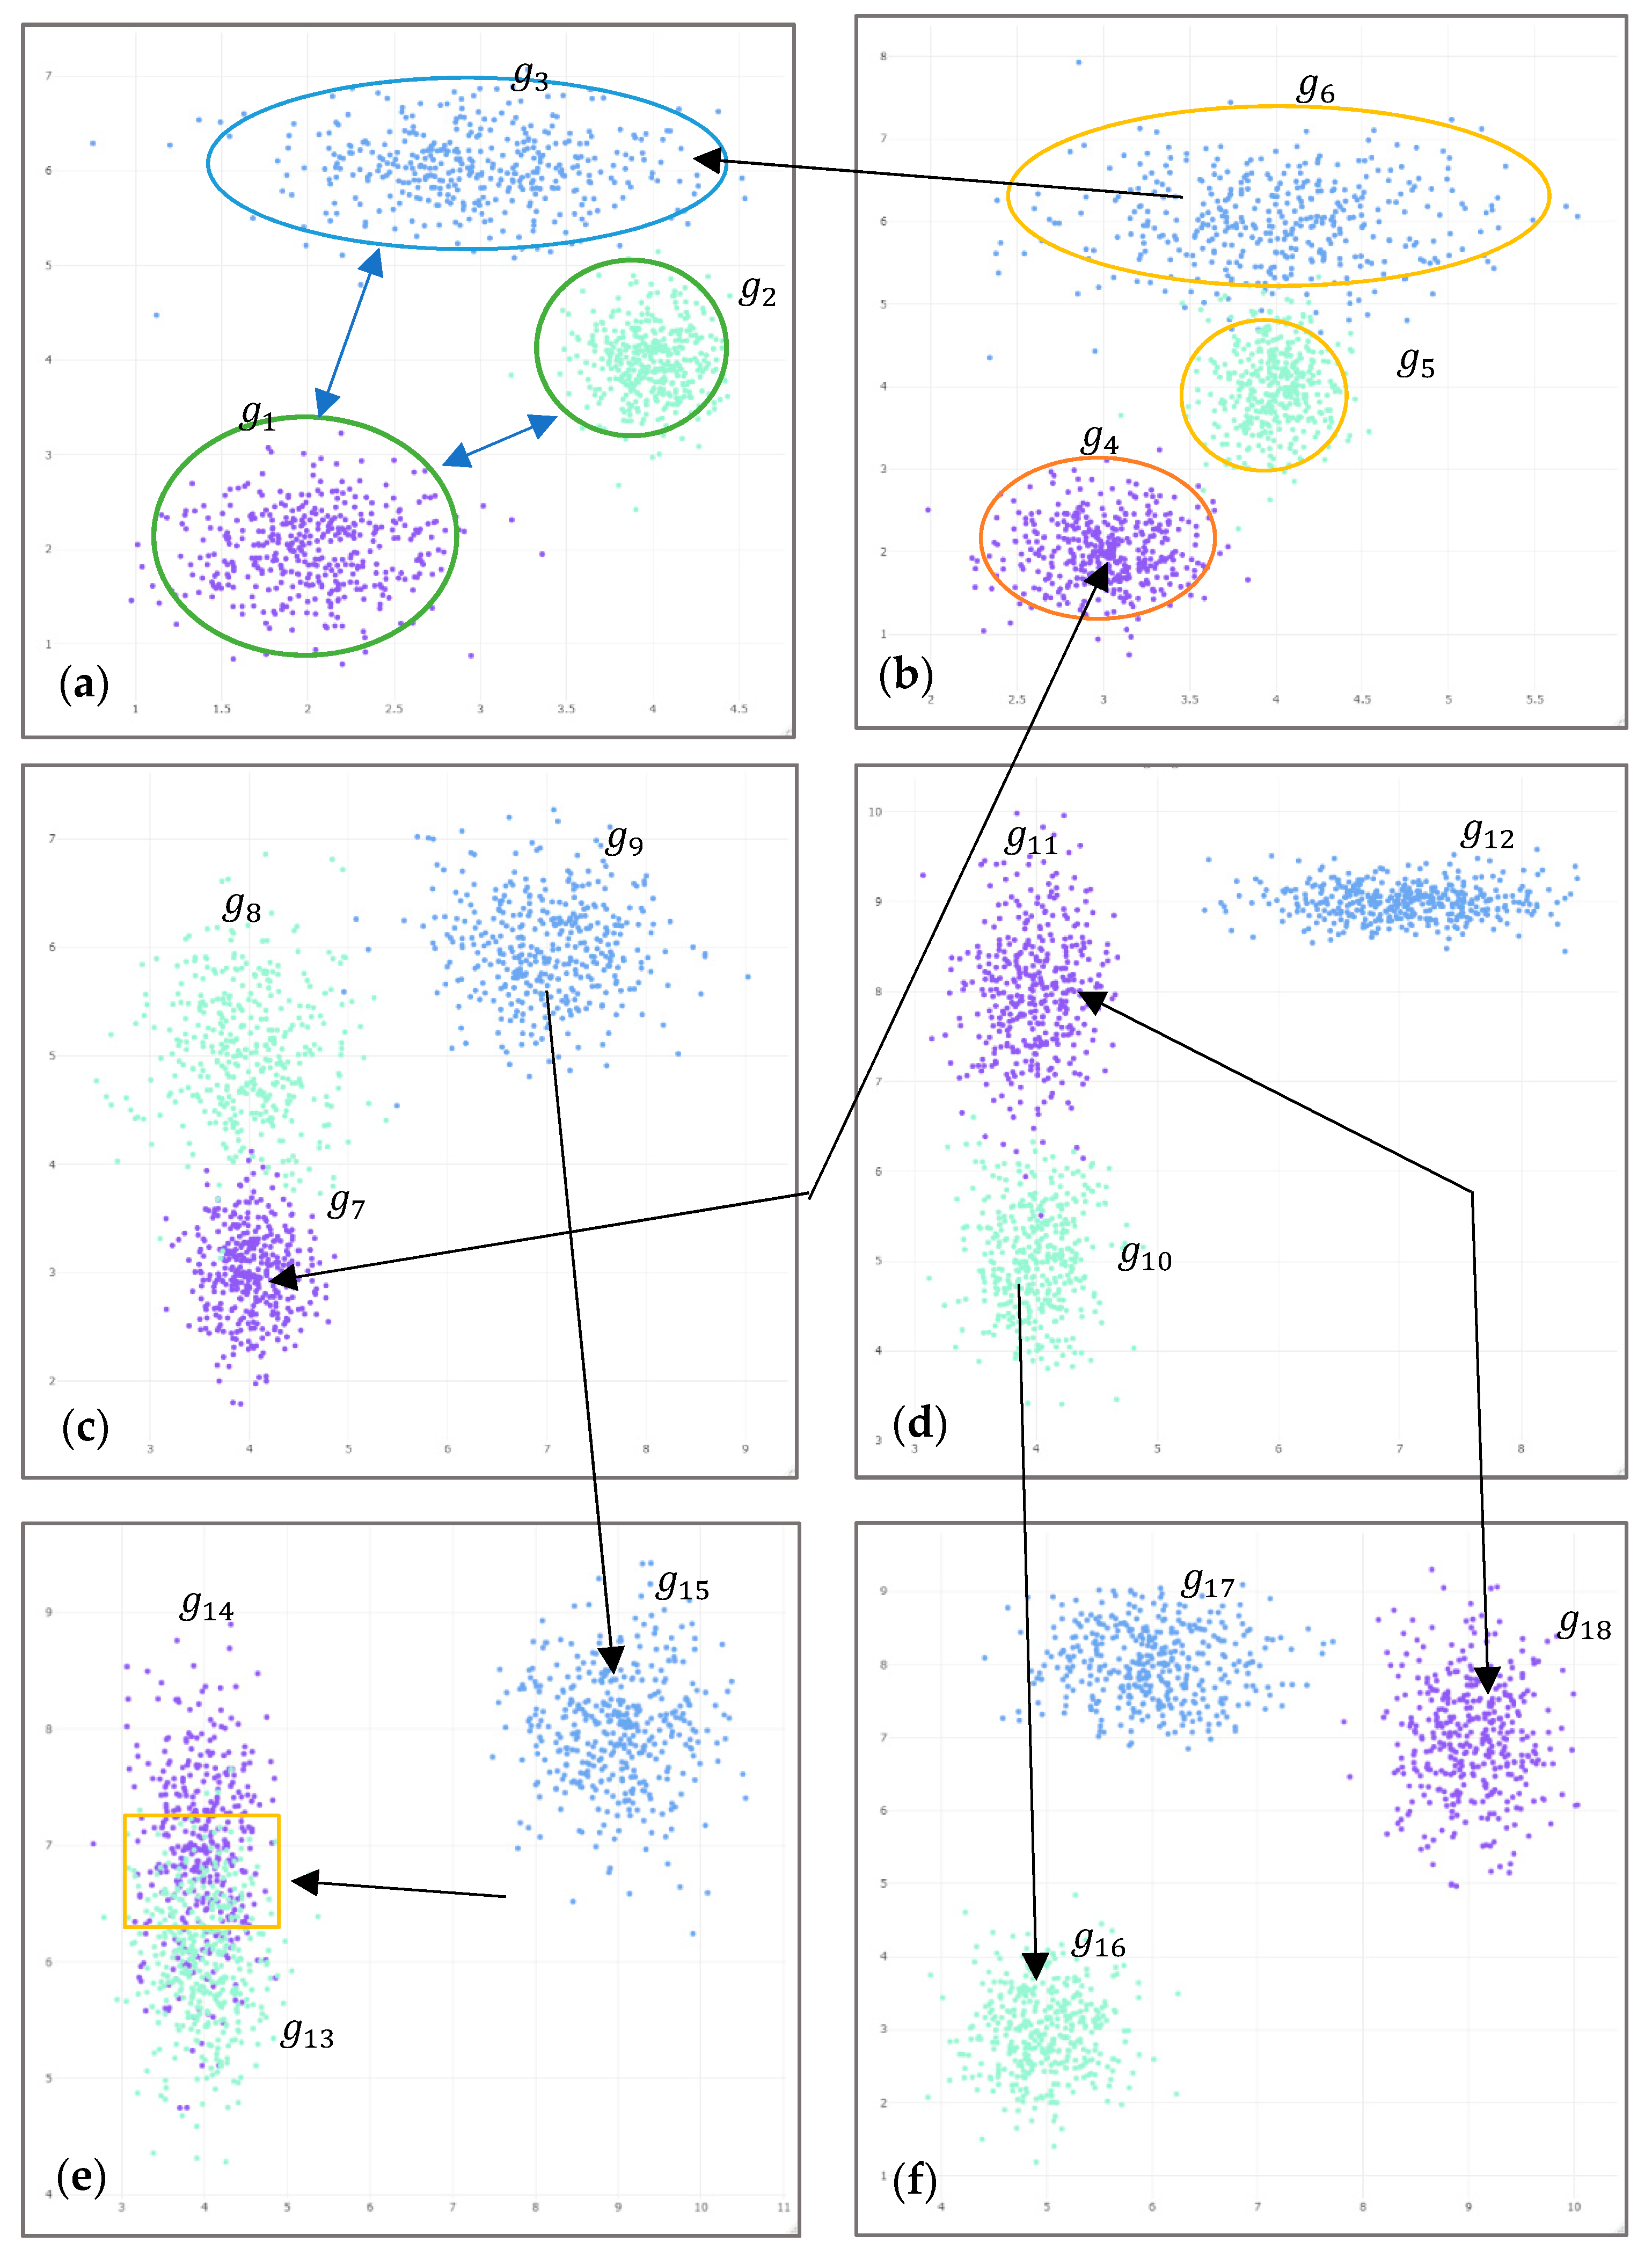
A matrix is decomposed into two smaller matrices to capture the latent features of the user datasets. We used this technique to find clusters of similar objects based on the weighted matrix factorization of the data. This measure is used to calculate the similarity between different user interests and group several groups together based on their cosine triangle similarity scores. For example, weighted matrix factorization is used to decompose the data into smaller matrices that capture the underlying features of the data. Then, the Gaussian distribution is used rule to identify groups of objects that follow a similar distribution and group them together. Finally, we considered cosine triangle similarity to calculate the similarity between different items and group them together based on their similarity scores. By combining these techniques, we can perform more accurate and efficient cluster analysis on the large and complex datasets presented in Figure 3.
The contexts for user items according to user groups and relevant recommendation rules are described, and real-time recommendations can be clustered and partitioned. Based on the user ratings, we determined that the most relevant movies depended on their content, their directors, and their actors, etc. For multi-clustering in proposed recommendation systems by analyzing user-item ratings and clustering them into groups based on similarities in their ratings. We found that 18 groups from diverse perspectives made those groups more effective. Additionally, WMF was used to factorize the user-item ratings matrix and reduce its dimensionality, as shown in Figure 3, while the Gaussian distribution rule was used to model the distribution of ratings within each cluster. Measuring the similarity between user-item vectors and the EM algorithm estimates the parameters of the Gaussian mixture model that represents the clusters following Equation (4). It is possible to approximate the probability distribution of the user item ratings using the PDF. Mixtures model the joint probability distribution of the rating. As a result of these methods, users can receive more personalized and accurate recommendations based on their preferences and behaviors. The system has been evaluated based on the analysis shown in Figure 3 as a result of the time limitations employed by user-item ratings in order to advance predictions.
We used this technique to divide a set of datapoints filtered into groups, more adaptable subsets, or clusters. It involves partitioning data points into different groups based on their similarity or dissimilarity, with each group representing a unique segment of the data, as presented in Figure 3. This process of applied k-means clustering uses an iterative approach to minimize the sum of squared distances between data points and their assigned cluster centroids. Model-driven approaches frequently employ clustering and dimensionality reduction techniques. Scalability is improved for users divided into groups g1–g18 by forming close neighbors rather than searching the entire user gap. A superior level of prediction efficiency and quality is provided compared to recommendation systems that only utilize after principal component analysis transforms user items into corelated user items. However, an optimized clustering algorithm is developed to partition users. The model is trained on relatively low-dimensional data, and users are prepared to be targeted by different groups, as shown in Figure 4 and Figure 5.
Sets are divided into three classes, c = 3 , and the color is independently selected in each group, where colors are similar to each other, as presented in Figure 3a. The closest value is deep blue, while the other two classes are placed at a significant distance. Considering the item j = 1 C , calculate the conditional density, p x w j ~ N μ j , Σ k , by following Equation (8), μ = 1 m i x i , and applied as shown in Figure 4a. The 2-dimensional case is computed when considered in class 1. The standard deviation is in in blue, X x | ω b l u e × X y | ω b l u e , where class is conditional for the X following this expression Σ = 1 m i { ( x i μ ) } T × x i μ , and in Algorithm 2, matching the expression used in all classes for the finalized data in Figure 4b, as presented in Equation (6) to find neighborhood selection in a high dimensional data point d attribute from a Gaussian source c 1 c k . Typically, it is x i source c by following Equation (9).
N x i c = 1 2 π Σ c e x p 1 2 x i μ c T × Σ c 1 x i μ c
Algorithm 2: Expectation-maximization
Mathematics 11 01346 i002
All groups in Figure 4 applied these expressions to obtain the final results presented in Section 6.2, and the Gaussian mixed model is defined as Σ a Σ b x i a μ c a Σ c 1 a b x i b μ c b , as shown Figure 4b. More probable data points were found by applying Bayes rules, where x i is from N x i c = N x i c × N c / Σ c 1 k N x i c × N c . From Equation (8), in the expression to convert them to weights, w i , c = N c | x i / N c | x i + + N c | x n , a particularly important point is the mean attribute a in items assigned to c , μ c a = w c 1 x 1 a + + w c n x n a , and covariance of a and b items from c   Σ c a b = Σ i = 1 n w c i x i a μ c a × x i b μ c b , and prior items assigned to the c expression are defined as 1 n N c | x i + + N c | x n .
Similarity scores between each cluster group and all other cluster groups in the multi-clustering recommendation system are shown in Table 3. It indicates how closely related the clusters are to each other based on the user-item ratings and other relevant features. Data indicating which clusters are most similar to each other are presented in Figure 4. This is in support of the decision-making process in which clusters combine or divide in order to improve the accuracy of the recommendations, as exhibited in Figure 5. It can also provide insight into the user preferences and assistance in identifying patterns or trends in the data.

5.2. Performance Analysis

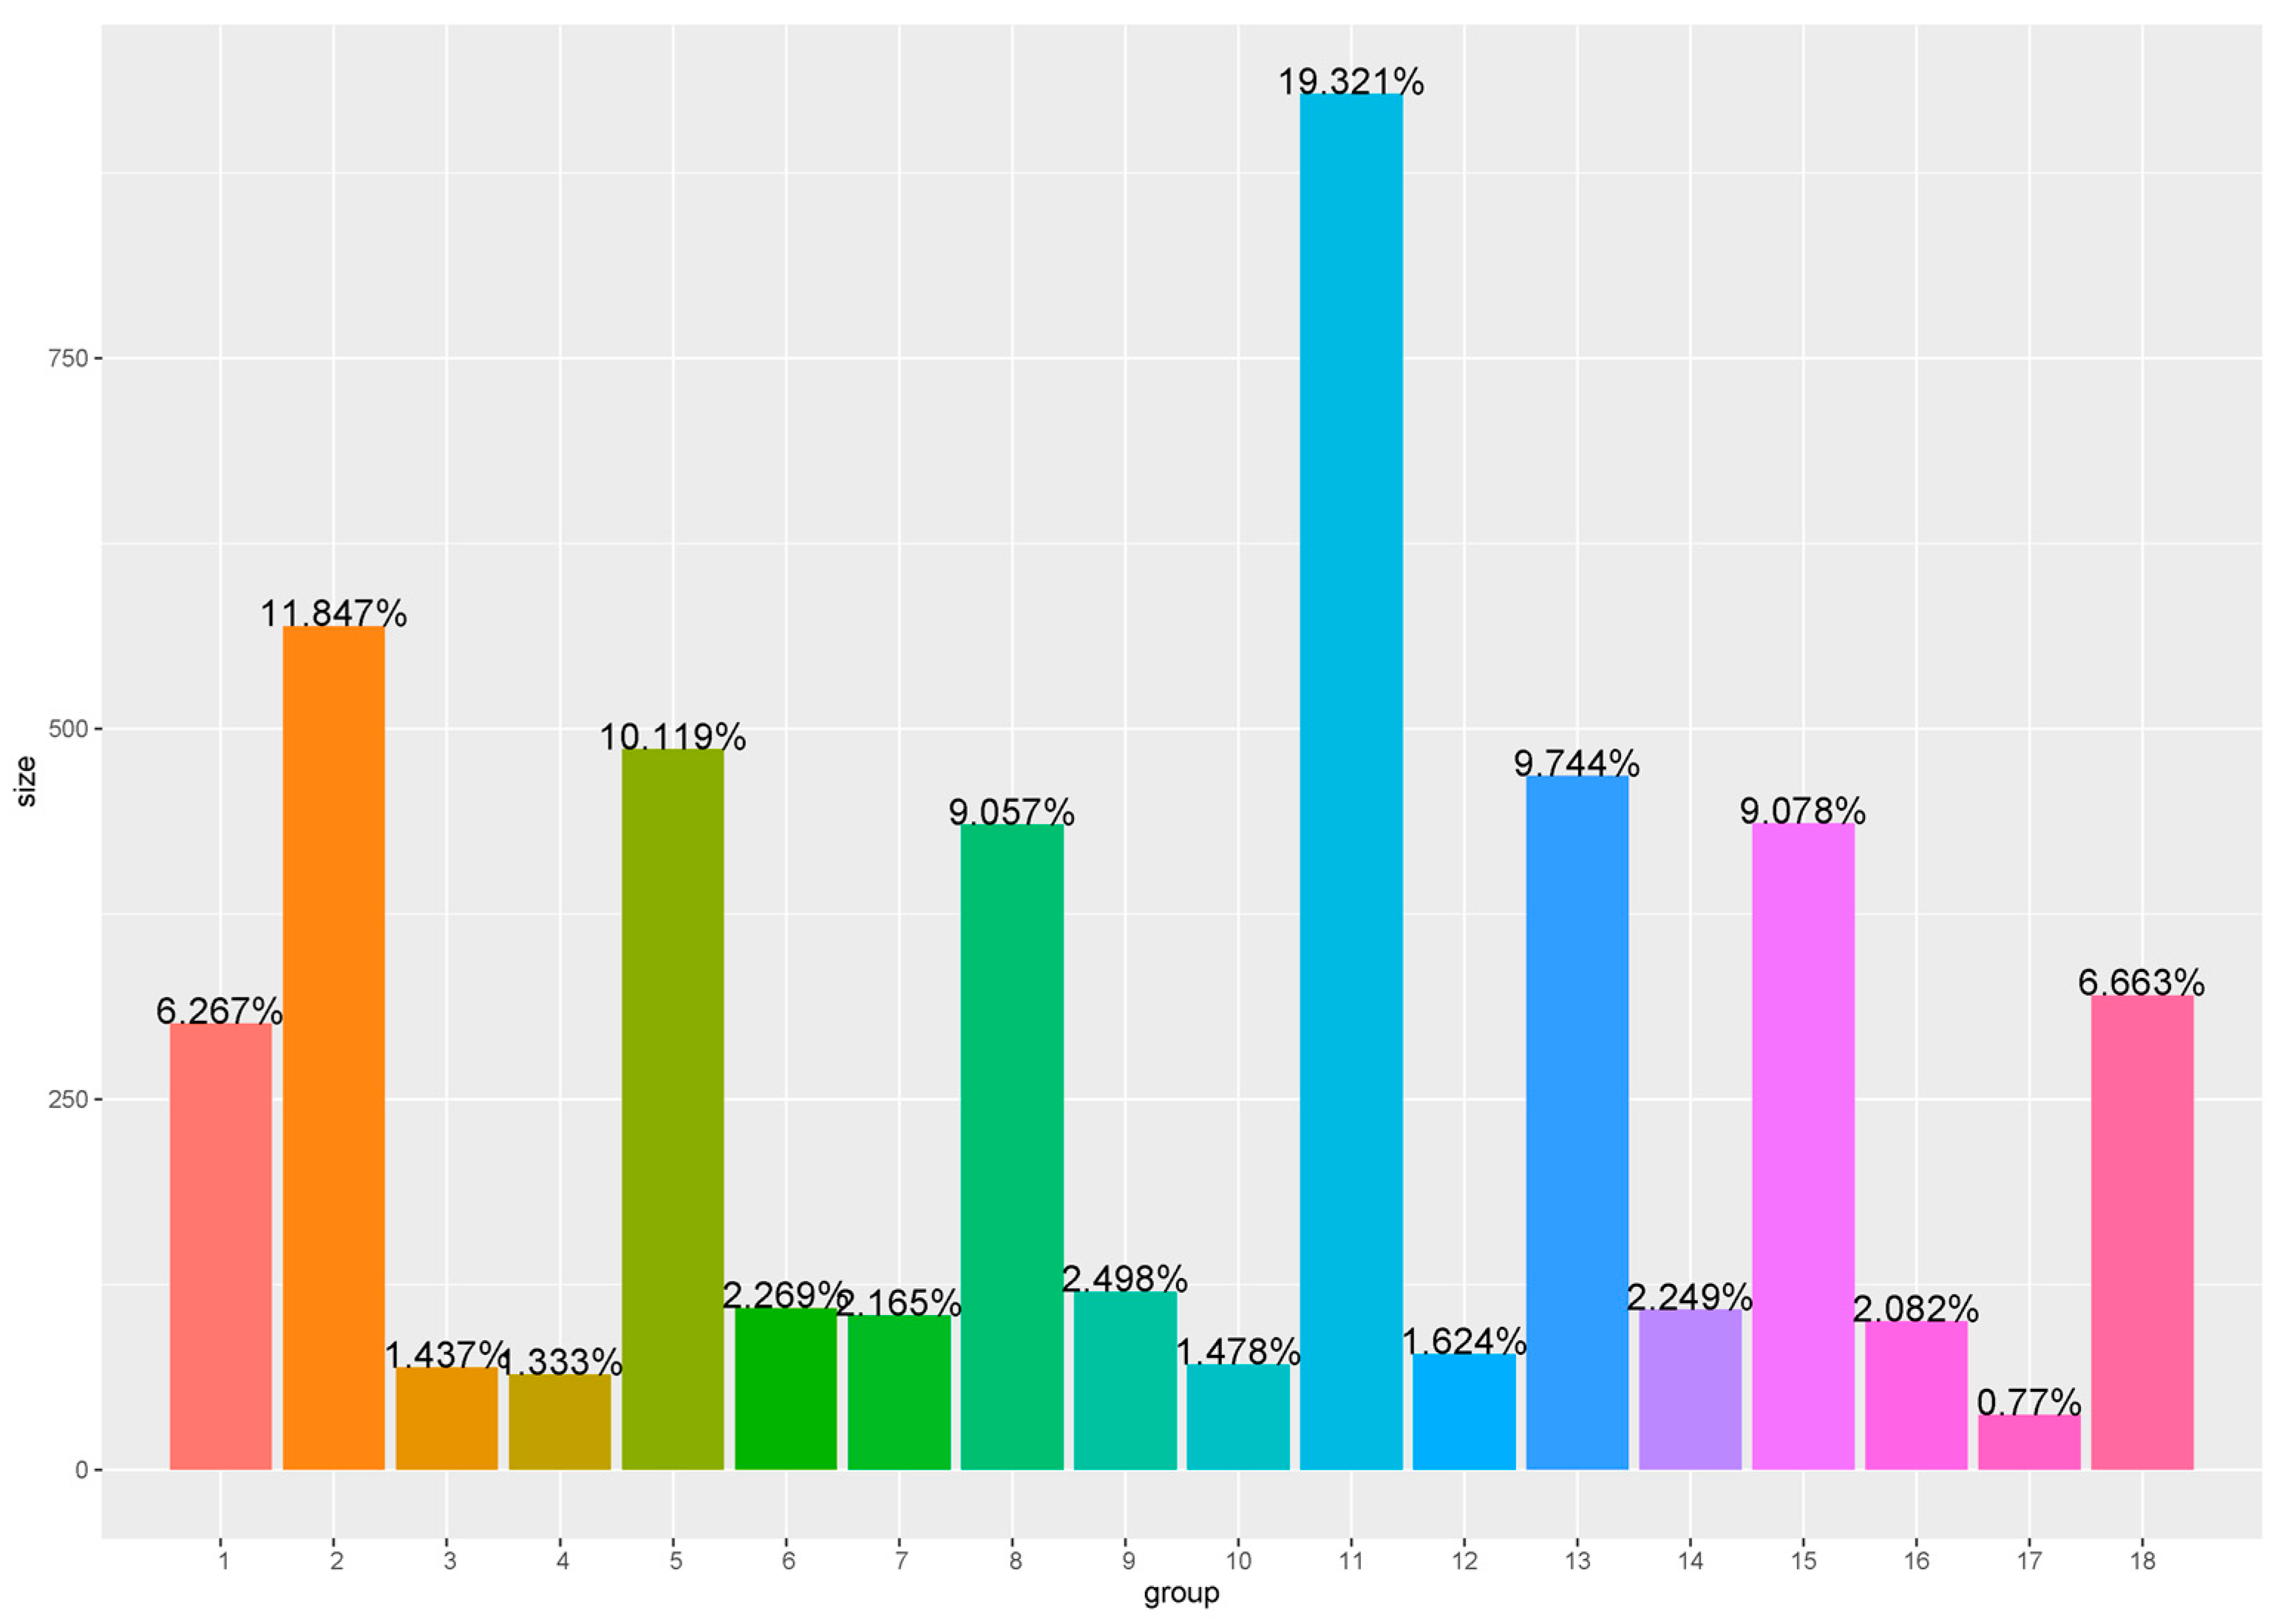
Establishing user-group relationships will mitigate data and provide more efficiency among users as presented in Table 3, and especially among those who are relatively active and more supportive in recommendations for their watch list. Accordingly, of the 18 split groups found in this study that make up the system observed by user-group characteristics and are presented in Figure 6, group 11 has a higher similarity ranking. We can capture high-order information from user interactions and items if user-group connections are integrated into recommendation models, and by integrating user-group characteristics into an offer.
Attention is applied between each point to represent users and items more effectively because users within the same group may also have similar interests, making it suitable to gather information regarding a particular user based on the evidence provided by others. For an accurate representation of users and items, we propose modelling high-order connections between user groups in subgraphs based on their interests to minimize irrelevant and damaging information, as shown in Figure 5. Our analysis used datasets containing user-group relationships to test the model using several matrix factorizations. Therefore, this section describes the performance metrics for evaluating recommender systems, as presented earlier, in Figure 5. Data indicate whether undecided results may influence these metrics, and how this issue will be resolved. Measuring accuracy using this metric is a traditional approach, such as those provided by the recommendation system. The precision measure is determined by comparing the number of items retrieved with all the resources retrieved. It can be viewed as an indicator of a system’s ability to provide quality resources. According to our movie recommendation scenario, precision can be calculated by multiplying the number of movies that are correctly predicted, which are movies the user will enjoy, by the total number of movies that are positively recommended, the sum of true positives and false positives. Since undecided results are not retrieved, undecided results do not affect recommendation precision. Precision relates to quality, whereas recall relates to quantity. Whether a recommendation system is capable of making complete recommendations is indicated by this test. An influential aspect of the ratio is how many relevant resources are retrieved compared to how many relevant resources are retrieved. However, its value can be determined by dividing its total number by the number of correct recommendations. In fact, since undecided answers should influence recall just as much as positive and negative ones, we determined whether undecided answers indicate a recommendation for a movie.

5.3. Evaluation of Results

The performance-analyzing items are percentages of groups predicted by proposed models. Considers the position of correctly recommended items for each user by the indicated items test set. To computing efficiency, we randomly selected movies that users had not given ratings to. We analyzed positive and negative models to rank them into sets.
Several classes were created using a combined method, and users were segmented based on their profiles. We calculated the F-measures of collaborative filtering using k-means on user group attributes in the experiment. Users with the experts’ system have different priorities and calculate the weight of similarities based on the ratings. The similarity weighting values are computed correlation coefficients between the user profile data and the ratings or behavior values of the users.
This issue can be addressed by predicting each user’s rating of an item. The target user’s expected rating value is positive or non-negative. However, if the predicted value of the item is low, the target user might not select it in the first place. Items with a higher forecast rating are considered, while items with a low forecast rating are considered to be replaced. Suppose an item has a high degree of similarity to the preferences of the target user. Consequently, it has a low degree of similarity to the contrary condition of the target user. By analyzing users’ ratings from a unique perspective, the user-based celebrative filtering is able to identify users who are historically similar to the target user. Neighboring ratings are combined to determine a rating or best recommendation for the target user. The Pearson correlation coefficient accurately determines user similarity, and a rating prediction formula is employed to predict preferences.

6. Discussion

The practical recommendation process incorporates user and item information into the recommendation process for users. The proposed method has been tested for performance and accuracy. Since the user element and the item are fully integrated, recommendation accuracy could significantly improve. It is essential to include those various types of real-world information to speed up the mining of user embeddings. To accomplish its ultimate goal, recommendation systems must be efficient for decision-making and to stimulate actions by users.

6.1. Final Recommendation

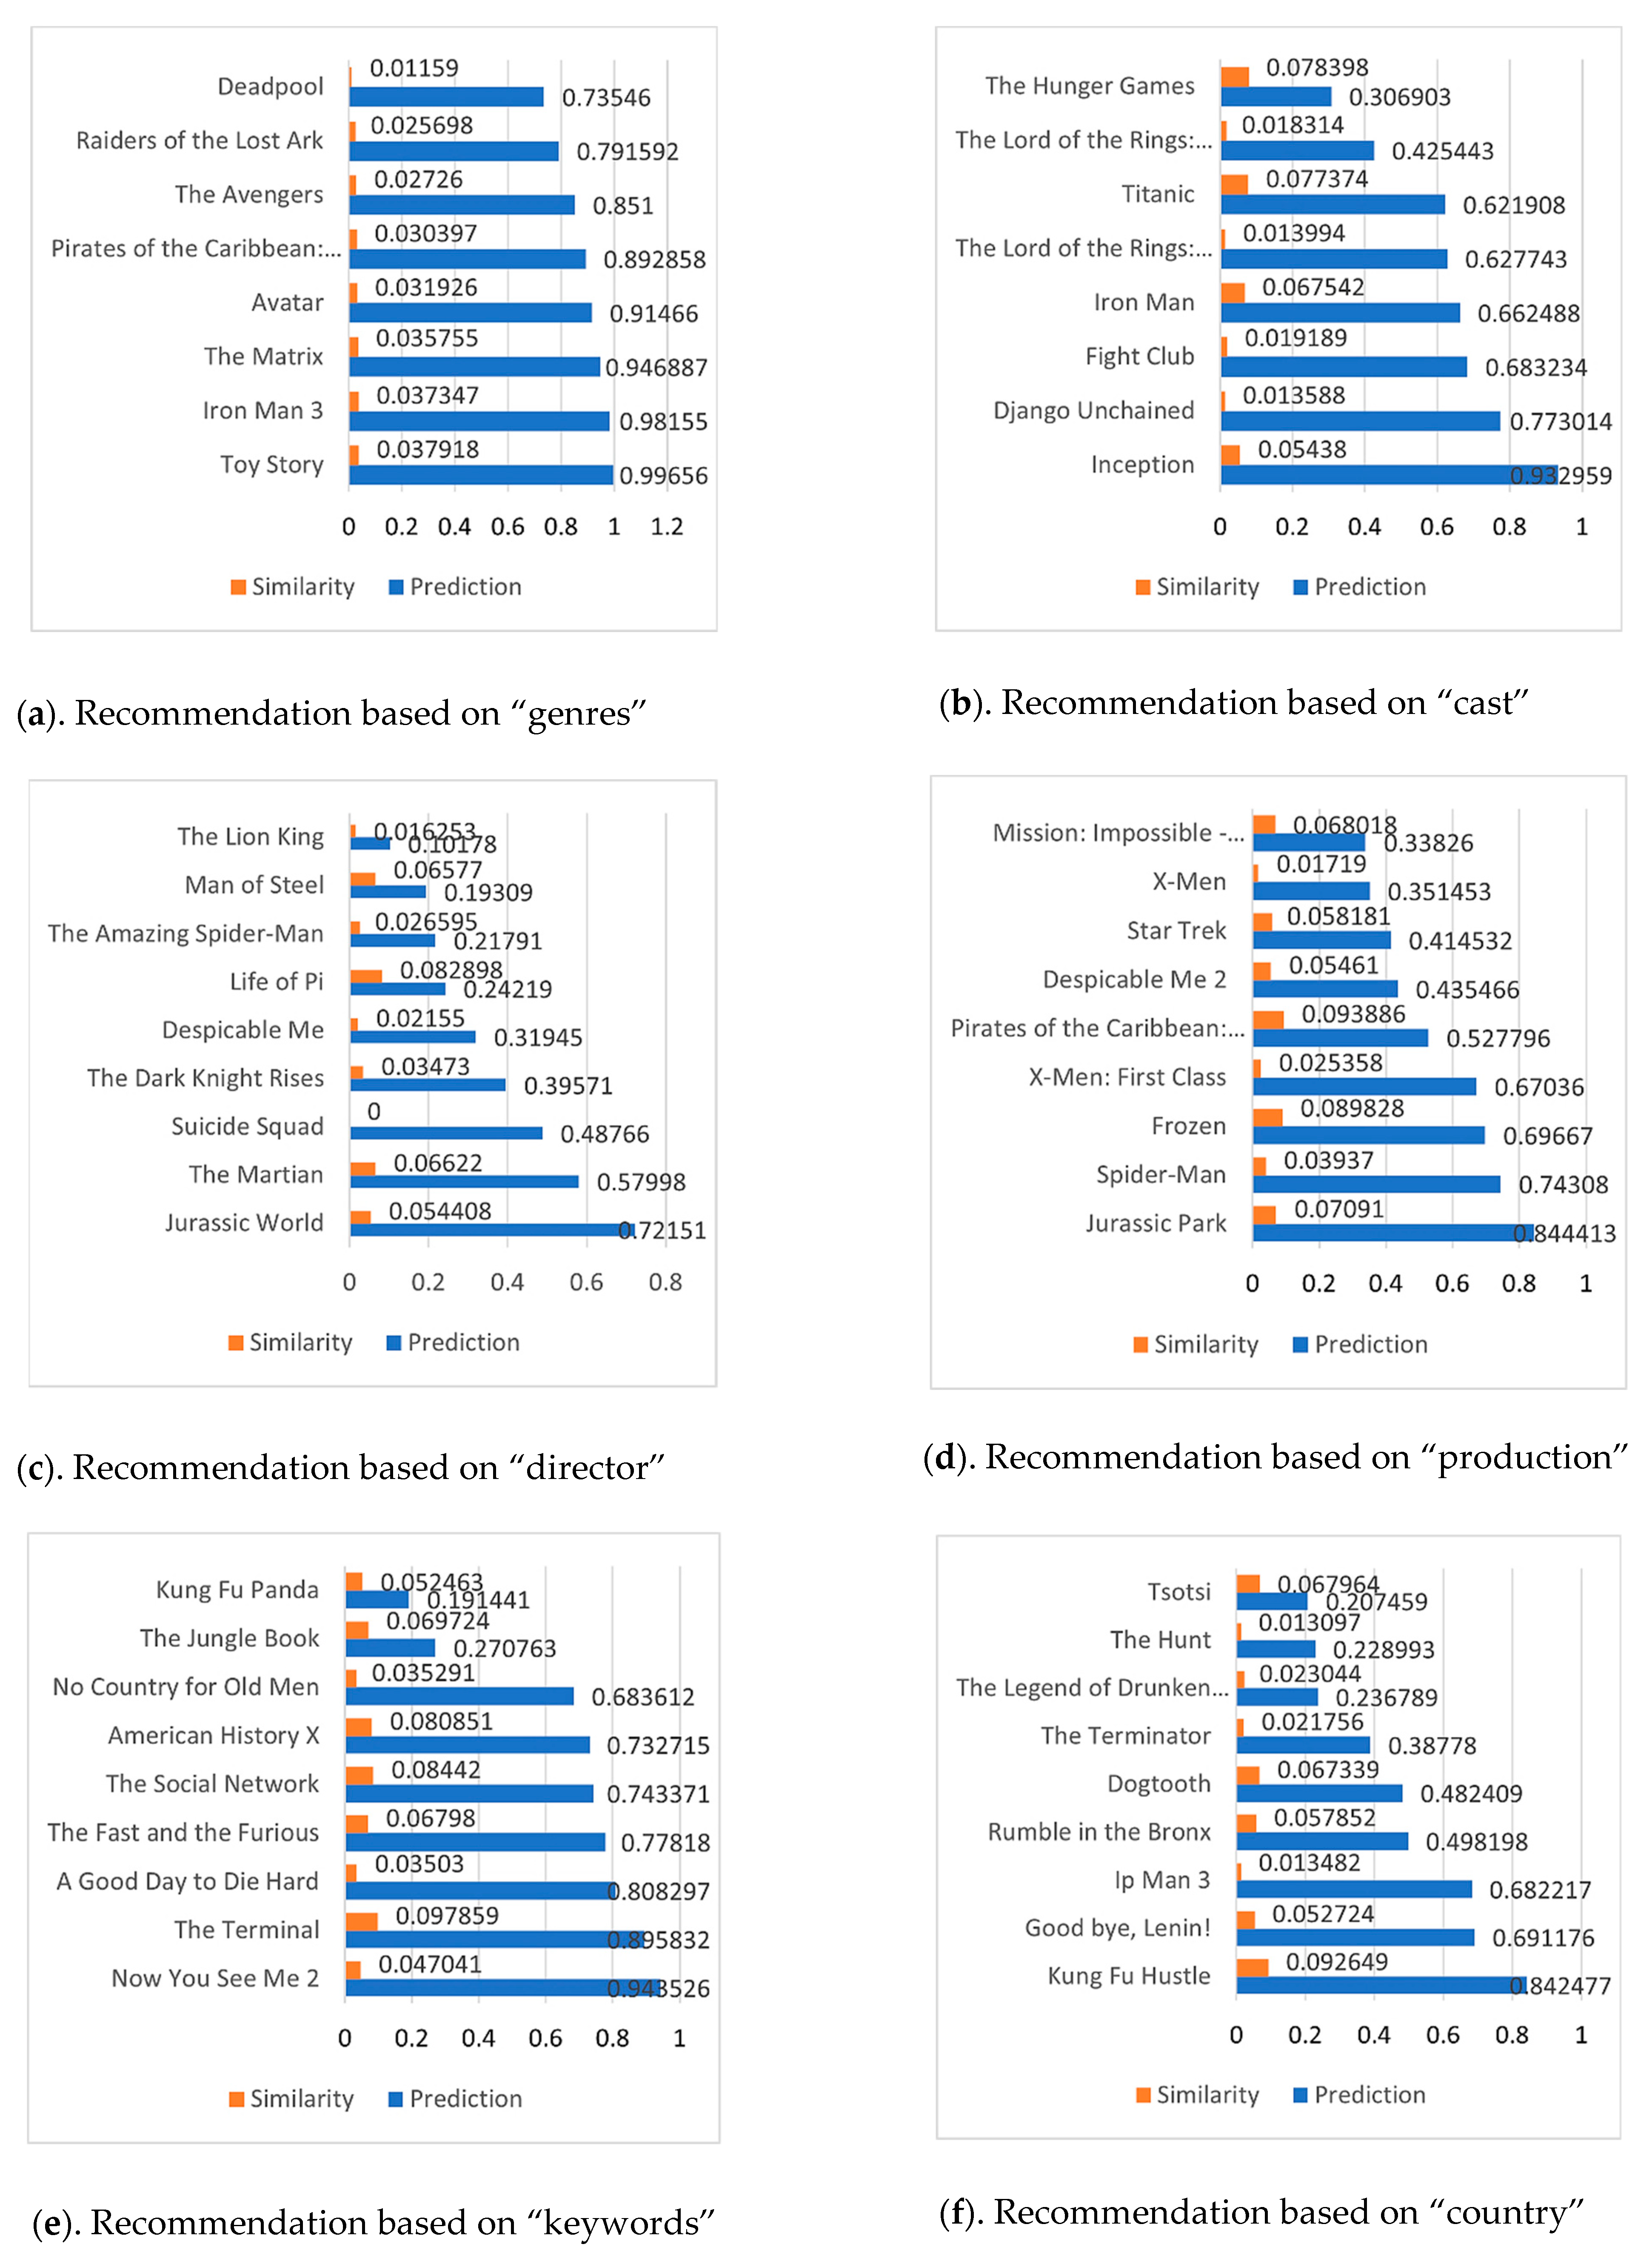
A predicted evaluation of no less than zero is usually calculated when the user provides few ratings. It is required to calculate the highest predicted values in movies (=1) that do not match the user’s preferences. The top 10 movies with final evaluation values between 0 and 1 are included on the final list of each category.
The recommended system is capable of evaluating specific movies and generating a final recommendation list by considering the overall similarity of movies to those that the user has already rated. This list included movies with the highest predicted scores that related to the user’s preferred storylines, cast, production values, and so on. The movies in this category typically belong to the genres that users consider to be their favorites, as shown in Figure 7. Additionally, these movies also have a relatively high predicted value, making them strong recommendations for user.

6.2. Evaluation of Proposed Method

In order to validate the quality of the proposed method, the difference between predicted and actual results for test users must have statistical accuracy. Accuracy can only be defined once the item has been determined in the recommendation system. True positive (TP), false negative (FN), false positive (FP), and true negative (TN) are all terms that represent these situations. In addition to the user-item list with given scores, the training set also contains user and added information regarding the object dataset’s evaluation following Equations (10)–(12).
When an item has a positive rating, the actual and predicted ratings support each other. A false negative rating does not assist the application in meeting expectations. The recommendation system does not benefit from an incorrect rating, whereas an accurate rating does. In that case, an objective rating that does not support the proposal, but a due rating does, it is considered incorrect. A valid negative can be evaluated if both actual and projected ratings do not support the request.
p r e c i s i o n = T P T P + F P
r e c a l l = T P T P + F N
a c c u r a c y = T P + T N T P + T N + F N + F P
In addition to precision and recall, another widely used performance index reflects different degrees of confidence in observing the items with high confidence levels to make competitive recommendations. Optimization of the subsequent estimation allows us to rank positive and low data points from the rating matrix; positive and zero pairs are sampled to learn model parameters.
The performance of the recommendation system is improved when ratings above or below three are considered positive and negative, respectively. However, the error rate remains significantly average compared to the previous implementation, preventing the development of hybrid models. It was determined that the process performed statistically significantly better than the standard filtering method. Filtering with implicit feedback is best achieved with weighted matrix factorization. It also accomplishes excellent results over traditional methods due to matrix factorization [52,56]. This approach assigns weights to observed missing data, which contributes to its effectiveness.

6.3. Limitation

The movie recommendation system, which is fitted to the user’s preferences, is highly accurate, but it does have some limitations. The system is not able to recommend movies that are not in the dataset, and the user cannot enter movie names differently from how they appear in the dataset. Combining preferences often involves linear or non-linear weighted feature combinations. By improving the similarity measure, the developed model can be used to achieve better performance, as it captures similarities between users and characterizes them into subgroups.
The ideal evaluation structure would enable users to make compromised choices based on different features of a particular item, such as recommended movies with favorite actors, which resolves the rating prediction problem from an integrated perspective of correlations; therefore, categorizing “metadata-based,” user-rated movies, such as genre and cast, combined with ratings. Highlights of the key characteristics of each method, such as the type of data it works best with, its computational complexity, and its ability to handle missing data, are presented in Table 4. The similarity between two vectors is calculated by taking the dot product and dividing by the product of the magnitudes of the vectors. This method is useful for comparing the similarity of items or users but may not work well with non-linear relationships. In particular, collaborative filtering recommender systems that rely on databases and knowledge bases for storage have similar issues. It would be supportive if it could be reused and extended in hybrid systems, combining collaborative filtering and context-based approaches, and improve the recommendation system’s response time instead of databases.

7. Conclusions and Future Work

Two significant parts of this paper are addressed. The first discussed the movie recommendation system based on user preferences, and the second discussed data analysis from a different perspective. Both are discussed in complexity, and several critical conclusions are drawn. In our movie recommendation system, we use several algorithms to recommend the most suitable movies related to the subgroups to users. This is based on factors such as genre, overview, cast, and ratings given to the movie. However, cosine similarity has consistently given fair results in recommending the movies accurately despite running several tests. The study compares various similarity measures for different types of data based on user rating preferences to determine the best-performing model. An effective recommendation system can enhance user satisfaction and engagement by suggesting items that align with their interests, thereby improving their overall experience. As discussed earlier, the implementation of several groups helps to mitigate information overload by providing users with a curated set of options based on their preferences and interests. This approach can enhance user experiences by presenting them with relevant choices while avoiding overwhelming them with too many options. Additionally, the insights gained from user preferences and behavior can be leveraged to enhance the system itself.
Future work will improve our approach to high-dimensional issues by studying more effective algorithms coupled with clustering-based methods. The difference in cluster size affects the scalability and reliability of a recommendation system. For this study, algorithms have been used to classify the reviews into positive and negative categories. The main aim of using different methods is to find the most appropriate group of users. Considering the correct classification method for experimental results leads to higher accuracy.

Author Contributions

Methodology, L.W. and S.M.; formal analysis, L.W., S.M. and A.A.H.; investigation, L.W., S.M. and A.A.H.; supervision, L.W.; writing—original draft, L.W. and A.A.H.; funding acquisition, L.W.; conceptualization, S.M.; software, S.M.; visualization, S.M. and A.O.H.; writing—review and editing, A.A.H., A.O.H., Y.I. and F.A.J.O. This study’s design, gathering, analyzing, preparation of the article, and choice to submit it for publication were under the purview of all authors. All authors have read and agreed to the published version of the manuscript.

Funding

This work was supported in part by the National Natural Science Foundation, China (No. 61572035, 61402011), the Leading Backbone Talent Project in Anhui Province, China (No. 2020-1-12), the Natural Science Foundation of Anhui Province, China (No. 2008085QD178), the Anhui Province Academic and Technical Leader Foundation (No. 2019H239), and the Anhui Province College Excellent Young Talents Fund Project of China (No. gxyqZD2020020), the Open Research Fund of the Anhui Province Engineering Laboratory for big data analysis and the early warning technology of coal mine safety (No. CSBD2022-ZD03), and the Scientific Research Foundation for high-level talents of the Anhui University of Science and Technology (No. 2022yjrc87).

Data Availability Statement

The article contains the original contributions made for this study; further questions should be addressed to the corresponding author.

Acknowledgments

We would like to acknowledge IMDb for providing the movie rating dataset used in this study. The availability of this data was crucial in the development and evaluation of the recommendation system presented in this paper.

Conflicts of Interest

The authors declare no conflict of interest.

References

  1. Adeniyi, D.A.; Wei, Z.; Yongquan, Y. Automated web usage data mining and recommendation system using K-Nearest Neighbor (KNN) classification method. Appl. Comput. Inform. 2016, 12, 90–108. [Google Scholar] [CrossRef] [Green Version]
  2. Afoudi, Y.; Lazaar, M.; Achhab, M. Hybrid recommendation system combined content-based filtering and collaborative prediction using artificial neural network. Simul. Model. Pract. Theory 2021, 113, 102375. [Google Scholar] [CrossRef]
  3. Ahsan, M.; Marton, F.; Pintus, R.; Gobbetti, E. Audio–visual annotation graphs for guiding lens-based scene exploration. Comput. Graph. 2022, 105, 131–145. [Google Scholar] [CrossRef]
  4. Bag, S.; Kumar, S.K.; Tiwari, M.K. An efficient recommendation generation using relevant Jaccard similarity. Inf. Sci. 2019, 483, 53–64. [Google Scholar] [CrossRef]
  5. Bai, Y.; Li, H. Mapping the evolution of e-commerce research through co-word analysis: 2001–2020. Electron. Commer. Res. Appl. 2022, 55, 101190. [Google Scholar] [CrossRef]
  6. Bakshi, S.; Jagadev, A.K.; Dehuri, S.; Wang, G.N. Enhancing scalability and accuracy of recommendation systems using unsupervised learning and particle swarm optimization. Appl. Soft Comput. 2014, 15, 21–29. [Google Scholar] [CrossRef]
  7. Bernhardt, P.W.; Zhang, D.; Wang, H.J. A fast EM algorithm for fitting joint models of a binary response and multiple longitudinal covariates subject to detection limits. Comput. Stat. Data Anal. 2015, 85, 37–53. [Google Scholar] [CrossRef] [Green Version]
  8. Wu, C.S.M.; Garg, D.; Bhandary, U. Movie recommendation system using collaborative filtering. In Proceedings of the 2018 IEEE 9th International Conference on Software Engineering and Service Science (ICSESS), Beijing, China, 23–25 November 2018. [Google Scholar] [CrossRef]
  9. Bromberek-Dyzman, K.; Jankowiak, K.; Chełminiak, P. Modality matters: Testing bilingual irony comprehension in the textual, auditory, and audio-visual modality. J. Pragmat. 2021, 180, 219–231. [Google Scholar] [CrossRef]
  10. Chen, Y.L.; Yeh, Y.H.; Ma, M.R. A movie recommendation method based on users’ positive and negative profiles. Inf. Process. Manag. 2021, 58, 102531. [Google Scholar] [CrossRef]
  11. Chou, Y.C.; Chen, C.T.; Huang, S.H. Modeling behavior sequence for personalized fund recommendation with graphical deep collaborative filtering. Expert Syst. Appl. 2022, 192, 116311. [Google Scholar] [CrossRef]
  12. Cui, Z.; Zhao, P.; Hu, Z.; Cai, X.; Zhang, W.; Chen, J. An improved matrix factorization based model for many-objective optimization recommendation. Inf. Sci. 2021, 579, 1–14. [Google Scholar] [CrossRef]
  13. da Silva, D.C.; Manzato, M.G.; Durão, F.A. Exploiting personalized calibration and metrics for fairness recommendation. Expert Syst. Appl. 2021, 181, 115112. [Google Scholar] [CrossRef]
  14. Da’u, A.; Salim, N.; Idris, R. Multi-level attentive deep user-item representation learning for recommendation system. Neurocomputing 2021, 433, 119–130. [Google Scholar]
  15. Dhawan, S.; Singh, K.; Rabaea, A.; Batra, A. ImprovedGCN: An efficient and accurate recommendation system employing lightweight graph convolutional networks in social media. Electron. Commer. Res. Appl. 2022, 55, 101191. [Google Scholar] [CrossRef]
  16. Feng, L.; Liu, W.; Meng, X.; Zhang, Y. Re-weighted multi-view clustering via triplex regularized non-negative matrix factorization. Neurocomputing 2021, 464, 352–363. [Google Scholar] [CrossRef]
  17. Fopa, M.; Gueye, M.; Ndiaye, S.; Naacke, H. A parameter-free KNN for rating prediction. Data Knowl. Eng. 2022, 142, 102095. [Google Scholar] [CrossRef]
  18. Huang, Z.; Ma, H.; Wang, S.; Shen, Y. Accurate Item Recommendation Algorithm of itemrank based on tag and context information. Comput. Commun. 2021, 176, 282–289. [Google Scholar] [CrossRef]
  19. IMDb. Available online: https://www.imdb.com/interfaces (accessed on 12 December 2022).
  20. Iwanaga, J.; Nishimura, N.; Sukegawa, N.; Takano, Y. Improving collaborative filtering recommendations by estimating user preferences from clickstream data. Electron. Commer. Res. Appl. 2019, 37, 100877. [Google Scholar] [CrossRef]
  21. Yager, R.R. Fuzzy logic methods in recommender systems. Fuzzy Sets Syst. 2003, 136, 133–149. [Google Scholar] [CrossRef]
  22. Karthik, R.V.; Ganapathy, S. A fuzzy recommendation system for predicting the customers interests using sentiment analysis and ontology in e-commerce. Appl. Soft Comput. 2021, 108, 107396. [Google Scholar] [CrossRef]
  23. Khojamli, H.; Razmara, J. Survey of similarity functions on neighborhood-based collaborative filtering. Expert Syst. Appl. 2021, 185, 115482. [Google Scholar] [CrossRef]
  24. Kim, H.N.; El Saddik, A. A stochastic approach to group recommendations in social media systems. Inf. Syst. 2015, 50, 76–93. [Google Scholar] [CrossRef]
  25. Park, D.H.; Kim, H.K.; Choi, I.Y.; Kim, J.K. A literature review and classification of recommender systems research. Expert Syst. Appl. 2012, 39, 10059–10072. [Google Scholar] [CrossRef]
  26. Lü, L.; Medo, M.; Yeung, C.H.; Zhang, Y.C.; Zhang, Z.K.; Zhou, T. Recommender systems. Phys. Rep. 2012, 519, 1–49. [Google Scholar] [CrossRef] [Green Version]
  27. Isinkaye, F.O.; Folajimi, Y.O.; Ojokoh, B.A. Recommendation systems: Principles, methods and evaluation. Egypt. Inform. J. 2015, 16, 261–273. [Google Scholar] [CrossRef] [Green Version]
  28. Huang, S.L. Designing utility-based recommender systems for e-commerce: Evaluation of preference-elicitation methods. Electron. Commer. Res. Appl. 2011, 10, 398–407. [Google Scholar] [CrossRef]
  29. Burke, R.D.; Abdollahpouri, H.; Mobasher, B.; Gupta, T. Towards multi-stakeholder utility evaluation of recommender systems. In Proceedings of the User Modeling, Adaptation and Personalization Conference, Halifax, NS, Canada, 13–17 July 2016; Volume 750. [Google Scholar]
  30. Prangl, M.; Szkaliczki, T.; Hellwagner, H. A framework for utility-based multimedia adaptation. IEEE Trans. Circuits Syst. Video Technol. 2007, 17, 719–728. [Google Scholar] [CrossRef]
  31. Lekakos, G.; Caravelas, P. A hybrid approach for movie recommendation. Multimed. Tools Appl. 2008, 36, 55–70. [Google Scholar] [CrossRef]
  32. Grant, S.; McCalla, G.I. A hybrid approach to making recommendations and its application to the movie domain. In Proceedings of the Advances in Artificial Intelligence: 14th Biennial Conference of the Canadian Society for Computational Studies of Intelligence, Ottawa, ON, Canada, 7–9 June 2001. [Google Scholar]
  33. Nguyen, N.T.; Rakowski, M.; Rusin, M.; Sobecki, J.; Jain, L.C. Hybrid filtering methods applied in web-based movie recommendation system. In Proceedings of the Knowledge-Based Intelligent Information and Engineering Systems: 11th International Conference, KES 2007, XVII Italian Workshop on Neural Networks, Vietri sul Mare, Italy, 2–14 September 2007. [Google Scholar]
  34. Carrer-Neto, W.; Hernández-Alcaraz, M.L.; Valencia-García, R.; García-Sánchez, F. Social knowledge-based recommender system. Application to the movies domain. Expert Syst. Appl. 2012, 39, 10990–11000. [Google Scholar] [CrossRef] [Green Version]
  35. Walek, B.; Fojtik, V. A hybrid recommender system for recommending relevant movies using an expert system. Expert Syst. Appl. 2020, 158, 113452. [Google Scholar] [CrossRef]
  36. Moreno, M.N.; Segrera, S.; López, V.F.; Muñoz, M.D.; Sánchez, Á.L. Web mining based framework for solving usual problems in recommender systems. A case study for movies’ recommendation. Neurocomputing 2016, 176, 72–80. [Google Scholar] [CrossRef]
  37. Koren, Y.; Bell, R.; Volinsky, C. Matrix factorization techniques for recommender systems. Computer 2009, 42, 30–37. [Google Scholar] [CrossRef]
  38. Krzywicki, A.; Wobcke, W.; Kim, Y.S.; Cai, X.; Bain, M.; Mahidadia, A.; Compton, P. Collaborative Filtering for people-to-people recommendation in online dating: Data analysis and user trial. Int. J. Hum.-Comput. Stud. 2009, 76, 50–66. [Google Scholar] [CrossRef]
  39. Liang, Y.; Wu, C.; Zhang, M.; Ji, X.; Shen, Y.; He, J.; Zhang, Z. Statistical modelling of the joint probability density function of air density and wind speed for wind resource assessment: A case study from China. Energy Convers. Manag. 2022, 268, 116054. [Google Scholar] [CrossRef]
  40. Lin, B.; Fang, B.; Yang, W.; Qian, J. Human action recognition based on spatio-temporal three-dimensional scattering transform descriptor and an improved VLAD feature encoding algorithm. Neurocomputing 2019, 348, 145–157. [Google Scholar] [CrossRef]
  41. Linke, A.C.; Mash, L.E.; Fong, C.H.; Kinnear, M.K.; Kohli, J.S.; Wilkinson, M.; Tung, R.; Jao Keehn, R.J.; Carper, R.A.; Fishman, I.; et al. Dynamic time warping outperforms Pearson correlation in detecting atypical functional connectivity in autism spectrum disorders. NeuroImage 2020, 223, 117383. [Google Scholar] [CrossRef]
  42. Liu, D.; Li, J.; Wu, J.; Du, B.; Chang, J.; Li, X. Interest Evolution-driven Gated Neighborhood aggregation representation for dynamic recommendation in e-commerce. Inf. Process. Manag. 2022, 59, 102982. [Google Scholar] [CrossRef]
  43. Michaela Denise Gonzales, R.; Hargreaves, C.A. How can we use artificial intelligence for stock recommendation and risk management? A proposed decision support system. Int. J. Inf. Manag. Data Insights 2022, 2, 100130. [Google Scholar] [CrossRef]
  44. Montero, D.; Aginako, N.; Sierra, B.; Nieto, M. Efficient large-scale face clustering using an online Mixture of Gaussians. Eng. Appl. Artif. Intell. 2022, 114, 105079. [Google Scholar] [CrossRef]
  45. Mu, C.; Chen, W.; Liu, Y.; Lei, D.; Liu, R. Virtual information core optimization for collaborative filtering recommendation based on clustering and evolutionary algorithms. Appl. Soft Comput. 2022, 116, 108355. [Google Scholar] [CrossRef]
  46. Nam, L.N.H. Towards comprehensive approaches for the rating prediction phase in memory-based collaborative filtering recommender systems. Inf. Sci. 2022, 589, 878–910. [Google Scholar] [CrossRef]
  47. Narwal, P.; Duhan, N.; Kumar Bhatia, K. A comprehensive survey and mathematical insights towards video summarization. J. Vis. Commun. Image Represent. 2022, 89, 103670. [Google Scholar] [CrossRef]
  48. Ni, X.; Lu, Y.; Quan, X.; Wenyin, L.; Hua, B. User interest modeling and its application for question recommendation in user-interactive question answering systems. Inf. Process. Manag. 2012, 48, 218–233. [Google Scholar] [CrossRef]
  49. Ortega, F.; Hernando, A.; Bobadilla, J.; Kang, J.H. Recommending items to group of users using Matrix Factorization based Collaborative Filtering. Inf. Sci. 2016, 345, 313–324. [Google Scholar] [CrossRef]
  50. Park, J.; Lee, Y.C.; Kim, S.W. Effective and efficient negative sampling in metric learning based recommendation. Inf. Sci. 2022, 605, 351–365. [Google Scholar] [CrossRef]
  51. Parveen, R.; Varma, N.S. Friend’s recommendation on social media using different algorithms of machine learning. Glob. Transit. Proc. 2021, 2, 273–281. [Google Scholar] [CrossRef]
  52. Rahman, A.; Hossen, M.S. Sentiment Analysis on Movie Review Data Using Machine Learning Approach. In Proceedings of the 2019 International Conference on Bangla Speech and Language Processing, Sylhet, Bangladesh, 27–28 September 2019. [Google Scholar]
  53. Rahmani, H.A.; Deldjoo, Y.; di Noia, T. The role of context fusion on accuracy, beyond-accuracy, and fairness of point-of-interest recommendation systems. Expert Syst. Appl. 2022, 205, 117700. [Google Scholar] [CrossRef]
  54. Singh, P.; Srivastava, R.; Rana, K.P.S.; Kumar, V. A multimodal hierarchical approach to speech emotion recognition from audio and text. Knowl.-Based Syst. 2021, 229, 107316. [Google Scholar] [CrossRef]
  55. Slater, S.; Baker, P.; Lawrence, M. An analysis of the transformative potential of major food system report recommendations. Glob. Food Secur. 2022, 32, 100610. [Google Scholar] [CrossRef]
  56. Soubraylu, S.; Rajalakshmi, R. Hybrid convolutional bidirectional recurrent neural network based sentiment analysis on movie reviews. Comput. Intell. 2021, 37, 735–757. [Google Scholar] [CrossRef]
  57. Sundari, P.S.; Subaji, M. An improved hidden behavioral pattern mining approach to enhance the performance of recommendation system in a big data environment. J. King Saud Univ. Comput. Inf. Sci. 2020, 34, 8390–8400. [Google Scholar] [CrossRef]
  58. Wang, K.; Zhang, T.; Xue, T.; Lu, Y.; Na, S.G. E-commerce personalized recommendation analysis by deeply-learned clustering. J. Vis. Commun. Image Represent. 2020, 71, 102735. [Google Scholar] [CrossRef]
  59. Chen, H. Personalized recommendation system of e-commerce based on big data analysis. J. Interdiscip. Math. 2018, 21, 1243–1247. [Google Scholar] [CrossRef]
  60. Wijaya, I.W.R. Mudjahidin Development of conceptual model to increase customer interest using recommendation system in e-commerce. Procedia Comput. Sci. 2021, 197, 727–733. [Google Scholar] [CrossRef]
  61. Wu, B.; Zhong, L.; Li, H.; Ye, Y. Efficient complementary graph convolutional network without negative sampling for item recommendation. Knowl.-Based Syst. 2022, 256, 109758. [Google Scholar] [CrossRef]
  62. Xu, H.; Yang, B.; Liu, X.; Fan, W.; Li, Q. Category-aware Multi-relation Heterogeneous Graph Neural Networks for session-based recommendation. Knowl.-Based Syst. 2022, 251, 109246. [Google Scholar] [CrossRef]
  63. Yasen, M.; Tedmori, S. Movies reviews sentiment analysis and classification. In Proceedings of the 2019 IEEE Jordan International Joint Conference on Electrical Engineering and Information Technology, JEEIT 2019 Proceedings, Amman, Jordan, 9–11 April 2019. [Google Scholar]
  64. Yin, J.; Sun, S. Incomplete multi-view clustering with cosine similarity. Pattern Recognit. 2022, 123, 108371. [Google Scholar] [CrossRef]
  65. Zamanzadeh Darban, Z.; Valipour, M.H. GHRS: Graph-based hybrid recommendation system with application to movie recommendation. Expert Syst. Appl. 2022, 200, 116850. [Google Scholar] [CrossRef]
  66. Zeng, J.; Hu, Z. Automated operational modal analysis using variational Gaussian mixture model. Eng. Struct. 2022, 273, 115139. [Google Scholar] [CrossRef]
  67. Zhang, C.; Duan, X.; Liu, F.; Li, X.; Liu, S. Three-way Naive Bayesian collaborative filtering recommendation model for smart city. Sustain. Cities Soc. 2022, 76, 103373. [Google Scholar] [CrossRef]
  68. Zhang, L.; Thalhammer, A.; Rettinger, A.; Färber, M.; Mogadala, A.; Denaux, R. The xLiMe system: Cross-lingual and cross-modal semantic annotation, search and recommendation over live-TV, news and social media streams. J. Web Semant. 2017, 46–47, 20–30. [Google Scholar] [CrossRef]
  69. Zhou, Q.; Zhuang, W.; Ren, H.; Chen, Y.; Yu, B.; Lou, J.; Wang, Y. Hybrid collaborative filtering model for consumer dynamic service recommendation based on mobile cloud information system. Inf. Process. Manag. 2022, 59, 102871. [Google Scholar] [CrossRef]
  70. Dong, X.; Yu, L.; Wu, Z.; Sun, Y.; Yuan, L.; Zhang, F. A hybrid collaborative filtering model with deep structure for recommender systems. In Proceedings of the AAAI Conference on Artificial Intelligence, San Francisco, CA, USA, 4–9 February 2017. [Google Scholar]
  71. Zhu, X.; Ying, C.; Wang, J.; Li, J.; Lai, X.; Wang, G. Ensemble of ML-KNN for classification algorithm recommendation. Knowl.-Based Syst. 2021, 221, 106933. [Google Scholar] [CrossRef]
  72. Zhu, Z.; Wang, S.; Wang, F.; Tu, Z. Recommendation networks of homogeneous products on an E-commerce platform: Measurement and competition effects. Expert Syst. Appl. 2022, 201, 117128. [Google Scholar] [CrossRef]
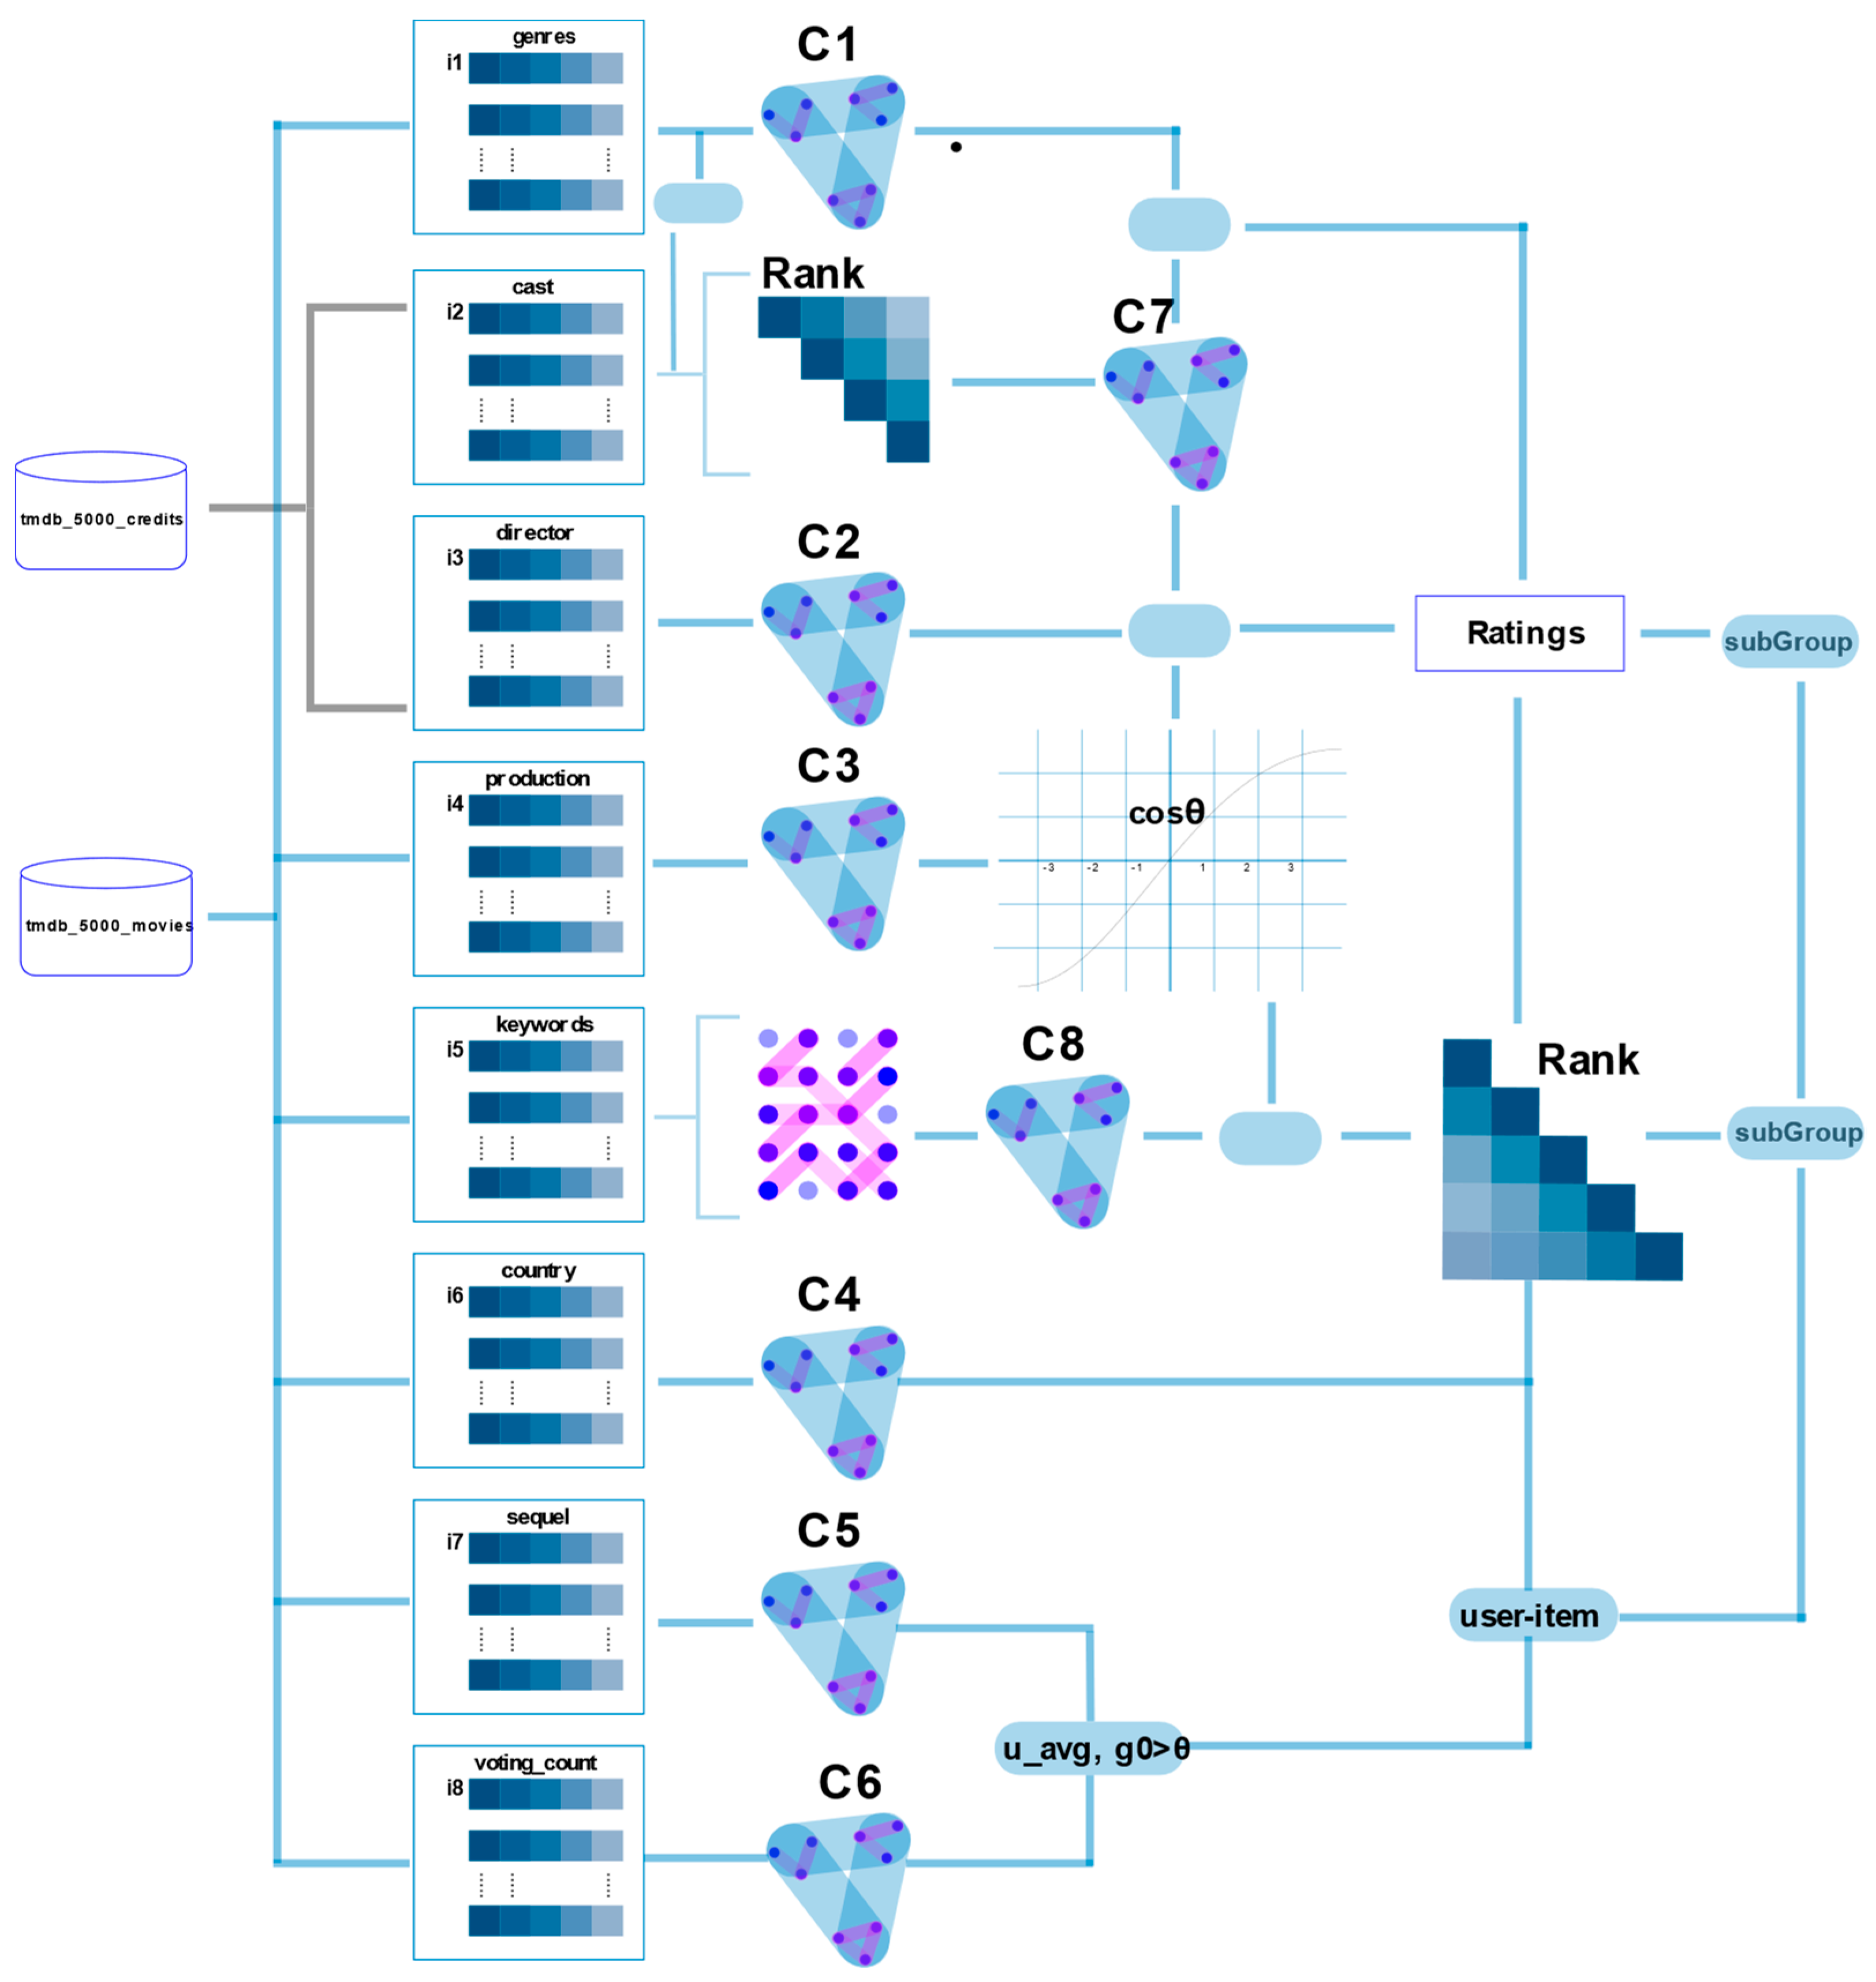
Figure 1. Illustration of the proposed system framework.
Mathematics 11 01346 g001
Figure 2. (a) Presented correlation between two or more items; and (b) clustering users group based on genres.
Mathematics 11 01346 g002
Figure 3. (af) Correlation of each group.
Mathematics 11 01346 g003
Figure 4. (a) Presented targeted point in class 1, and (b) all adjusted targeted data points.
Mathematics 11 01346 g004
Figure 5. (a) Overall performance and (b) precision-recall curve.
Mathematics 11 01346 g005
Figure 6. Cross-checked groups having the most similar items.
Mathematics 11 01346 g006
Figure 7. Movie list with higher predicted evaluations.
Mathematics 11 01346 g007aMathematics 11 01346 g007b
Table 1. Overview of genre datasets.
Original TitleActionAdventureFantasyScience FictionComedy
Avatar11110
Pirates of the Caribbean: At World’s End01110
Iron Man 311010
Men in Black 310011
The Avengers11010
Spider-Man 311100
Table 2. Similarities of each cluster group.
GroupsDistanceSimilaritiesPredictionMovies
110.0153310.9776350.866442319
20.0565970.8019540.729645293
50.1399420.7519640.626604256
130.2408420.7286480.618448249
150.2685730.7155890.415094245
80.4579140.6985040.353295215
180.3163970.5702550.131934210
10.5696030.5548710.135821204
90.5868250.5397150.139084186
60.6654980.5339180.148434165
140.6914480.5024310.151520151
70.7240350.3317110.177439144
160.8017470.3254160.131843142
120.8090870.2939860.317141118
100.8106190.2079950.283613104
30.8321630.1253940.24388777
40.9329470.1108210.13193461
170.9368390.088630.03958759
Table 3. Comparison with existing methods.
AlgorithmAccuracyPrecisionRecallAUC
Proposed 0.88310.89540.85250.9218
Bernoulli’s Naive Bayes [70]0.8750.8840.86330.8735
Multinomial NB [70]0.8850.92940.83330.8787
SVM [70]0.87330.8590.89330.8753
NB [71]0.81830.840.790.82
SVM [71]0.87450.870.880.88
Random forest [71]0.96010.9310.96
CNN [72]0.89150.82590.82460.8253
LSTM [72]0.9550.90870.82280.8636
Table 4. Comparison of key characteristics of methods.
MethodInputOutputType of AlgorithmHandles Missing Data?InterpretabilityScalabilityRequires Labeled Data?
Weighted matrix factorizationUser-item ratings matrixPrediction matrixCollaborative filteringNoLowHighNo
Gaussian distribution ruleUser-item ratings matrixProbability density matrixContent-based filteringYesMediumLowNo
Cosine triangle similarityUser-item ratings matrixSimilarity matrixCollaborative filteringNoLowHighNo
EM algorithmUser-item ratings matrixProbability density matrixClusteringNoLowMediumNo
Probability density functionUser-item ratings matrixProbability density matrixClusteringNoLowMediumNo
Gaussian mixtures modelUser-item ratings matrixProbability density matrixClusteringNoLowMediumNo
Disclaimer/Publisher’s Note: The statements, opinions and data contained in all publications are solely those of the individual author(s) and contributor(s) and not of MDPI and/or the editor(s). MDPI and/or the editor(s) disclaim responsibility for any injury to people or property resulting from any ideas, methods, instructions or products referred to in the content.