Article

Application of Optimized ORB Algorithm in Design AR Augmented Reality Technology Based on Visualization

1
School of Design and Art, Changsha University of Science & Technology, Changsha 410114, China
2
Library, Hunan Normal University, Changsha 410081, China
*
Author to whom correspondence should be addressed.
Mathematics 2023, 11(6), 1278; https://doi.org/10.3390/math11061278
Submission received: 17 January 2023 / Revised: 24 February 2023 / Accepted: 27 February 2023 / Published: 7 March 2023
(This article belongs to the Section E1: Mathematics and Computer Science)

Abstract

:
The current media digitization and artistic strength are more powerful than the previous application. Using its advanced information display methods and technologies, this paper proposed a digital museum built by integrating digital media art with AR technology, which was helpful to analyze and solve the objective problems of current museums’ ecological imbalance and single-system function. Based on the principles and laws of augmented reality technology, the museum guide system is optimized. In the system evaluation experiment, firstly, the cultural relics of six kinds of materials are used as the target image to extract and identify the features of the image. In experiments, the recognition performance of three feature algorithms, Binary Robust Invariant Scalable Keypoints (BRISK), organizational retaliatory behavior (ORB), and Accelerated-KAZE (AKAZE), is compared. Among them, the ORB algorithm is superior to other algorithms in feature richness and recognition speed but is inferior to the other two algorithms in recognition accuracy. Therefore, this paper optimized the ORB algorithm based on the characteristics of the ORB algorithm. The ORB algorithm must calculate the orientation of the feature points before constructing the feature descriptor. After optimizing the parameters, the improved ORB algorithm not only has advantages in feature richness and recognition time but also improves the recognition accuracy up to 98.3%, which is 16% higher than the traditional ORB algorithm. Therefore, the application prospects of AR technology in digital media design are very important.

1. Introduction

The development of science and technology has led to new forms of art. Digital media art is an art involving multiple disciplines and fields. It is a combination of artistic innovation and technology. Technological progress has provided artists with a new stage and space, greatly enriched the expression of art, and promoted the development of art. It is to promote the development of emerging art fields such as digital newspapers, digital films, three-dimensional virtual space, and mobile digital media with the support of new technologies. Digital media is a kind of digital media art that integrates special art forms and language methods with cross-media communication and is gradually being recognized and used by people. With the rapid development of science and technology, digital media has become increasingly popular China. As a new art form and technology, digital media has huge development prospects and market appeal in the field of art. Under such a large environment, this paper takes digital media art as the research object and uses augmented reality as a means to conduct an in-depth discussion on the application of AR in new media art.
New media art design is a new way of disseminating art, and the research on new media technology abroad has been relatively in-depth. Song et al. proposed a wireless cooperative routing algorithm based on minimum energy consumption to solve the real-time transmission of communication data and the network lifetime optimization [1]. Based on Internet technology, Zhu et al. analyzed the setting of the digital media curriculum system, then analyzed the reasons for the curriculum reform, and finally discussed the planning and implementation of the curriculum reform, hoping that big data can help the teaching of digital media majors [2]. Based on digital technology, Zinman et al. analyzed the teaching of media art and designed a new teaching method through the display of movies [3]. Sayre discussed hip-hop music based on digital media technology [4]. The Cleveland Archives of Art has a collection of more than 120,000 photographic negatives in various sizes and formats documenting museum exhibits, events, buildings, objects, and people from 1914 to the early 2000s. Hernandez digitized it based on digital media technology [5]. Although many foreign scholars have conducted in-depth research on applications in various fields, research on China is in its early stages and insufficiently deep.
AR has been applied in film, television, and games, and there are numerous studies on this subject. Erwinsah et al. introduced the application of AR in teaching. He believed that the current teaching methods were outdated. The combination of AR increased the interest in classroom teaching [6]. Almquist et al. analyzed the principles of AR technology and designed an industrial-based AR eye so that workers can intuitively see the working conditions of the equipment in industrial operations and optimize the display interface of AR glasses [7]. Gao et al. presented the current advances in mobile augmented reality technology and the results achieved in applying AR to data visualization. He also discussed the feasibility of AR application in data visualization by analyzing multiple cases [8]. Qiu et al. analyzed the key technologies and applications of AR in digital assembly and pointed out that digital twin technology is the future development trend of intelligent assembly research [9]. Wang et al. designed the cylindrical lens waveguide grating technology based on the principle of holographic waveguide grating and optimized the AR glasses for users with poor eyes [10]. However, the application of AR in design is not deep enough, and the role of AR in design is not fully explained.
The innovative aspect of this paper is to discuss the application of AR technology in Chinese museums. In addition, this paper also discusses the problems encountered with the exhibition design and the future relationship between digital media and exhibition design. This topic has not yet been discussed by current scholars. This can provide a solid foundation for the application prospects of AR technology in digital media design.

2. AR and Digital Art Media

2.1. Digital Art Media

With the popularization of digital media technology, people’s display methods have also changed, and there have been great improvements. People are more willing to actively participate in the display than in the static viewing displays of the past. Today’s exhibitions use modern technology, and the effects presented are more and more abundant. The interaction of games is added to the exhibition design, giving people a feeling of being in the real world. There are great breakthroughs in both vision and scenes, which basically satisfy the curiosity of the audience [11].
Digital multimedia technology has been widely used in museums, making full use of its advantages. For example, in the exhibition hall of the Capital Museum digital technology is used to maximize the use of museum collections. Through various forms of multimedia display (including projection, augmented reality, and virtual reality), people can better appreciate the charm of cultural relics. This digital display method breaks the previous furnishings, transforming the presentation of artworks from boring to interesting. Artwork exhibitions combined with modern technology encourage more interaction [12].
Augmented reality technology is based on the relevant information provided by the computer to enhance the user’s understanding of the real world. By collecting relevant data, a virtual object and scene are formed on the computer, and these data are superimposed in the form of images and 3D models to achieve the effect of augmented reality. AR technology is a virtual reality-based technology update. Often, AR coats the real world with technology, making the displayed items “live”, as shown in Figure 1.

2.2. Digital Image Recognition Algorithms

2.2.1. BRISK Algorithm

(1) Feature point detection
The detection of the BRISK algorithm relies on the FAST (features from accelerated segment test) detector. As mentioned above, this BRISK algorithm has no additional data, so BRISK also uses the structure of the scale space to enhance the robustness of the algorithm. Similar to the commonly used pyramid construction principle, the BRISK algorithm obtains the scale space by multiplying the input data by the scale factor [13].
(2) Feature point description
After the final solution on the spatial scale is obtained, the detected points are described. The BRISK algorithm employs the Gaussian filtering technique to sample concentric circles, with pixels serving as the center and multiple concentric circles of different sizes as the outer circle. The candidate points are obtained by an equidistant sampling method on each circumference and compensated by a Gaussian filter [14].
Since there are a total of N (60 in BRISK) sampling points, these points are combined in pairs during the local gradient calculation. There are N (N − 1)/2 combination methods [15,16]. g is used to represent the set and the corresponding feature points are p i and p j :
g ( p i , p j ) = ( p j p i ) · I ( p j , σ j ) I ( p i , σ i ) p j p i 2
Let the size of the space corresponding to this point be t, and set the two thresholds to be 9.75 t and 13.67 t, and follow the following formula to calculate the set of short-distance point pairs and long-distance point pairs:
S = { ( p i , p j ) A | p j p i < δ max } A
L = { ( p i , p j ) A | p j p i > δ min } A
Next, the long-distance set is used in combination with the following formula to calculate the required principal direction of the feature descriptor:
g = ( g x g y ) = 1 L · ( p i , p j ) L g ( p i , p j )
Next, in order to make the algorithm rotation invariant, brisk rotates its sampling area by α degrees on the feature points using the following formula:
α = arctan 2 ( g y , g x )
Since the sampling method is the same, it is still N (N − 1)/2 point pairs, that is, two corresponding point pairs.
b = { 1 , I ( p j α , σ j ) > I ( p i α , σ i ) 0 , o t h e r w i s e
From this, a string with a length of 64 bytes is obtained, which is the final descriptor, which is called BRISK64.

2.2.2. ORB Algorithm

ORB (Oriented FAST and Rotated BRIEF) is far faster than other algorithms in terms of operation speed. The fundamental reason is the corner point method, and the corresponding improved descriptor is used to improve the robustness of the algorithm [17].
(1) The OFAST (Oriented FAST) feature detector in ORB has eight spatial scales, corresponding to a scale of 1.2. The feature points in each image are roughly extracted by FAST9-16; the corresponding Harris response is obtained by roughly calculating the Harris of each point, and finally the largest N feature points are obtained.
R = det M α ( t r a c e M ) 2
R is the center of mass within the radius, F is the center of the circle, and alpha is a constant.
The corresponding parameters are defined from the perspective of a geometric relationship. If I(x, y) is used to represent the corresponding value after calculating the gray level, then the m value can be determined by the geometric formula:
m p q = x , y x p y q I ( x , y )
I is the intensity value of the pixel.
Since the center of mass Q does not change with rotation within a certain radius, the final principal direction can be obtained by the following formula:
θ = arctan ( m 01 , m 10 )
In addition, under the premise of ensuring the calculation’s accuracy, it must be ensured that the corresponding coordinates x , y [ r , r ] can be found in each area.
(2) Binary Robust Independent Elementary Features (BRIEF) feature descriptor
In ORB, BRIEF is selected as the descriptor, which improves its relevance and dissimilarity. First, the method converts a node pair into a binary sequence with n near a certain node according to a certain rule [18].
The BRIEF algorithm mentioned above does not have rotation invariance. A commonly used method is called “Steered BREIF”, which can add a rotation angle θ to the selected feature points. Assuming that there are always n point pairs, S corresponds to the points including the point pairs, which can be described as follows:
S = ( x 1 x 2 x 2 n y 1 y 2 y 2 n )
S θ = R θ S
R θ = [ cos θ sin θ sin θ cos θ ]
b i n A r r a y = [ p 1 , p 2 , , p M ] , p i { 0 , 1 }
Finally, 256 high-quality and well-associated point pairs were obtained using the above method, a process called rBRIEF.

2.2.3. AKAZE Algorithm

AKAZE is an accelerated version of KAZE, and many scholars have proposed to use nonlinear filters to achieve image edge information and to adapt at all levels of the pyramid [19].
In the AKAZE algorithm, the equations established are usually used to solve the corresponding partial differential equations. The basic nonlinear diffusion formula in image processing is given below, where L represents the corresponding luminance value, div represents the divergence solution, and represents the gradient solution:
L t = d i v [ c ( x , y , t ) L ]
The process of constructing the formula requires the introduction of a function, which is the conduction function:
c ( x , y , t ) = g ( | L σ ( x , y , t ) | )
Based on the following, it is determined whether the boundary regions of each level in the scale space are preserved and strengthened, thus controlling the expansion of the function:
g 2 = 1 / ( 1 + | L σ | 2 / λ 2 )
The concept of KAZE itself is to combine explicit theory with semi-implicit theory. Its basic steps are to obtain the initial step size through the factorization of the box filter and then obtain the subsequent step size according to the explicit principle. Then, the next step size is calculated by the explicit principle, and then the diffusion is carried out according to the step size determined by the explicit principle, where τ max is the maximum step size threshold [20].
τ j = τ max / [ 2 cos 2 ( π ( 2 j + 1 ) / 4 n + 2 ) ]
( L ( i + 1 ) L i ) / τ = A ( L i ) L i
L ( i + 1 , j + 1 ) = ( 1 + τ j A ( L i ) ) L ( i + 1 , j ) | j = 0 , 1 , , n 1
σ i ( o , s ) = 2 ( o + s / S )
o [ 0 , 1 , , O 1 ] , s [ 0 , , S 1 ] , i [ 0 , , M 1 ]
t i = 1 / 2 σ i 2 , i = 0 , , M
Modified-local difference binary (M-LDB) descriptor.
M-LDB is a study based on the LDB descriptor, which mainly analyzes the average intensity and spatial gradient information of the feature point neighborhood to improve the robustness and differences of the descriptor. At the same time, the Adaboost algorithm is used in combination with grids of different sizes. Based on this method, AKAZE adopts the feature of point-based principal direction to rotate the LDB grid, thereby improving the rotational stability of the descriptor. During sampling, grid pixel sampling is used to replace the original grid segmentation, and the average approximation method is used to obtain better average results, thereby improving the robustness of the descriptor scale [21,22].
At the same time, because M-LDB itself has the problem that the average Boolean value cannot contradict itself when calculating information such as the intensity and gradient of the feature point neighborhood, a sampling method is proposed. One can choose to occupy a smaller subset, reduce the size of the description subset, or use other methods.

3. Improved ORB Algorithm

ORB algorithm ORB (Oriented FAST and Rotated BRIEF) is a fast algorithm for feature point extraction and description. It uses the FAST algorithm to detect feature points quickly when extracting feature points. The feature points are detected by comparing the gray levels of a certain pixel with the gray levels of enough pixels in its neighborhood. When the absolute value of the difference between the gray level of this point and other points is greater than the set threshold, it can be regarded as a feature corner. In order to make the ORB feature descriptor rotation invariant, it is necessary to assign a direction to the feature point. The main direction is selected by using the gray centroid method; that is, the pixel moment of the neighborhood of the feature point is determined, and the vector from the feature point to the centroid is used to represent its main direction.
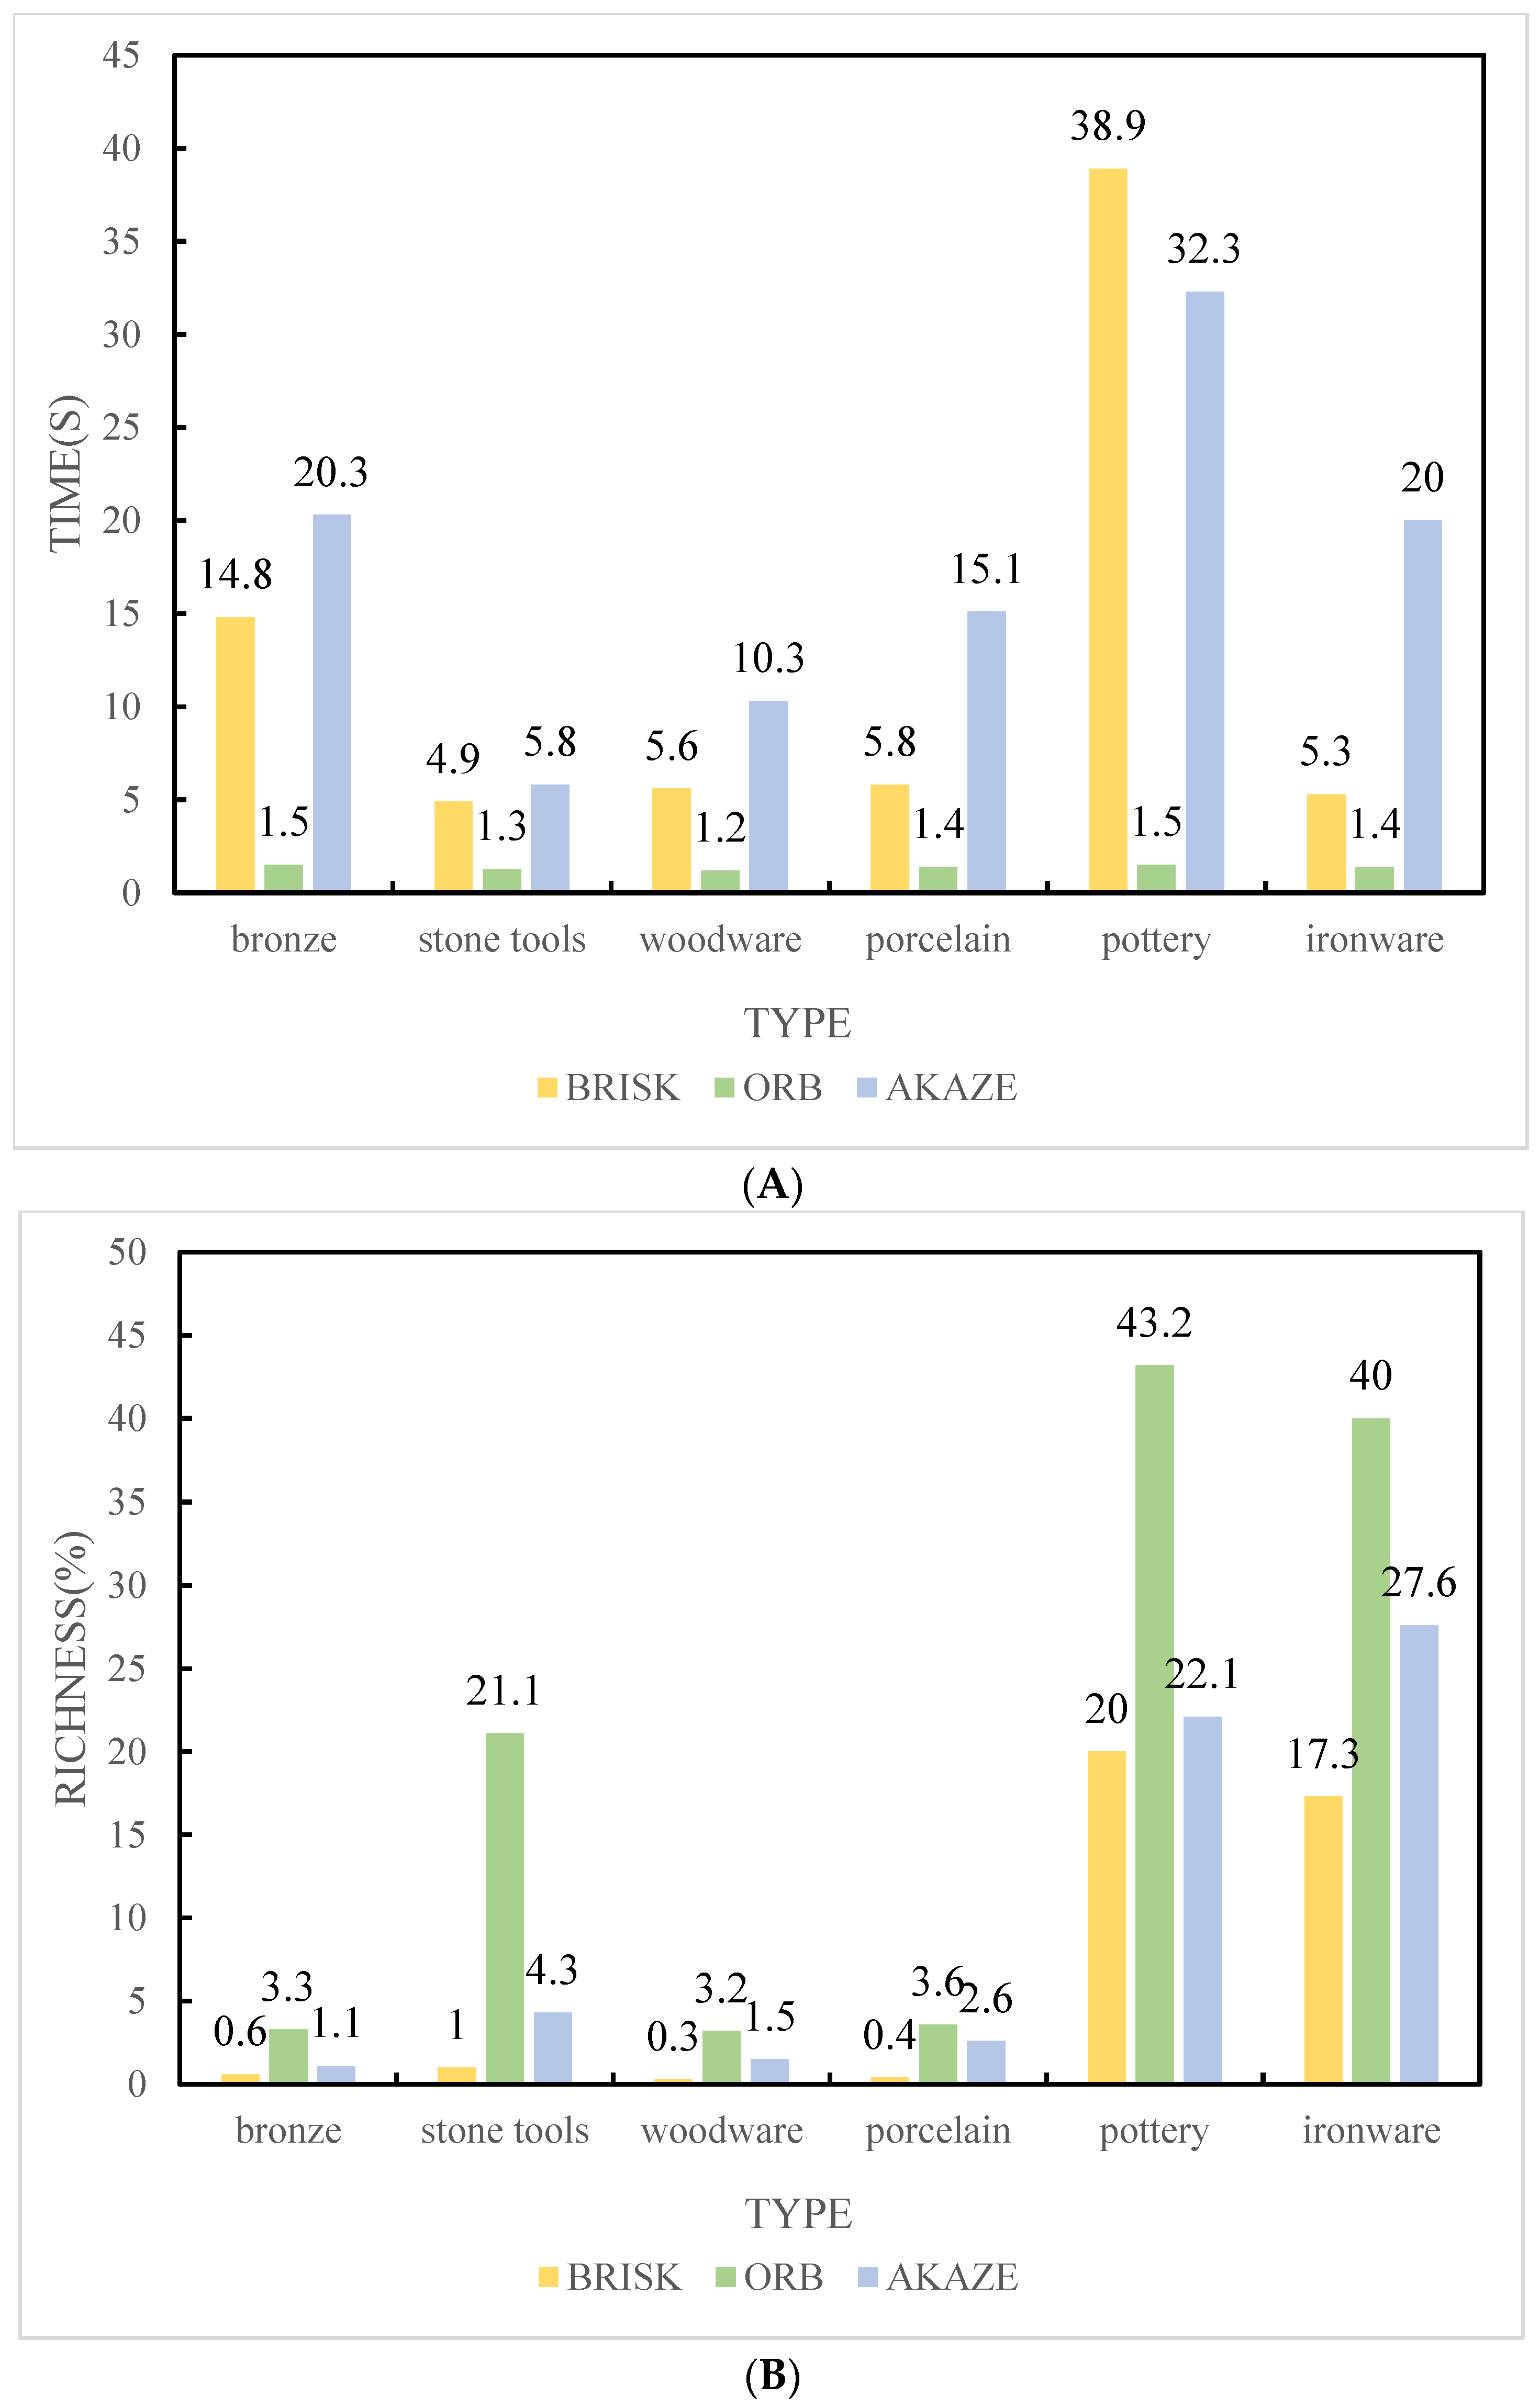
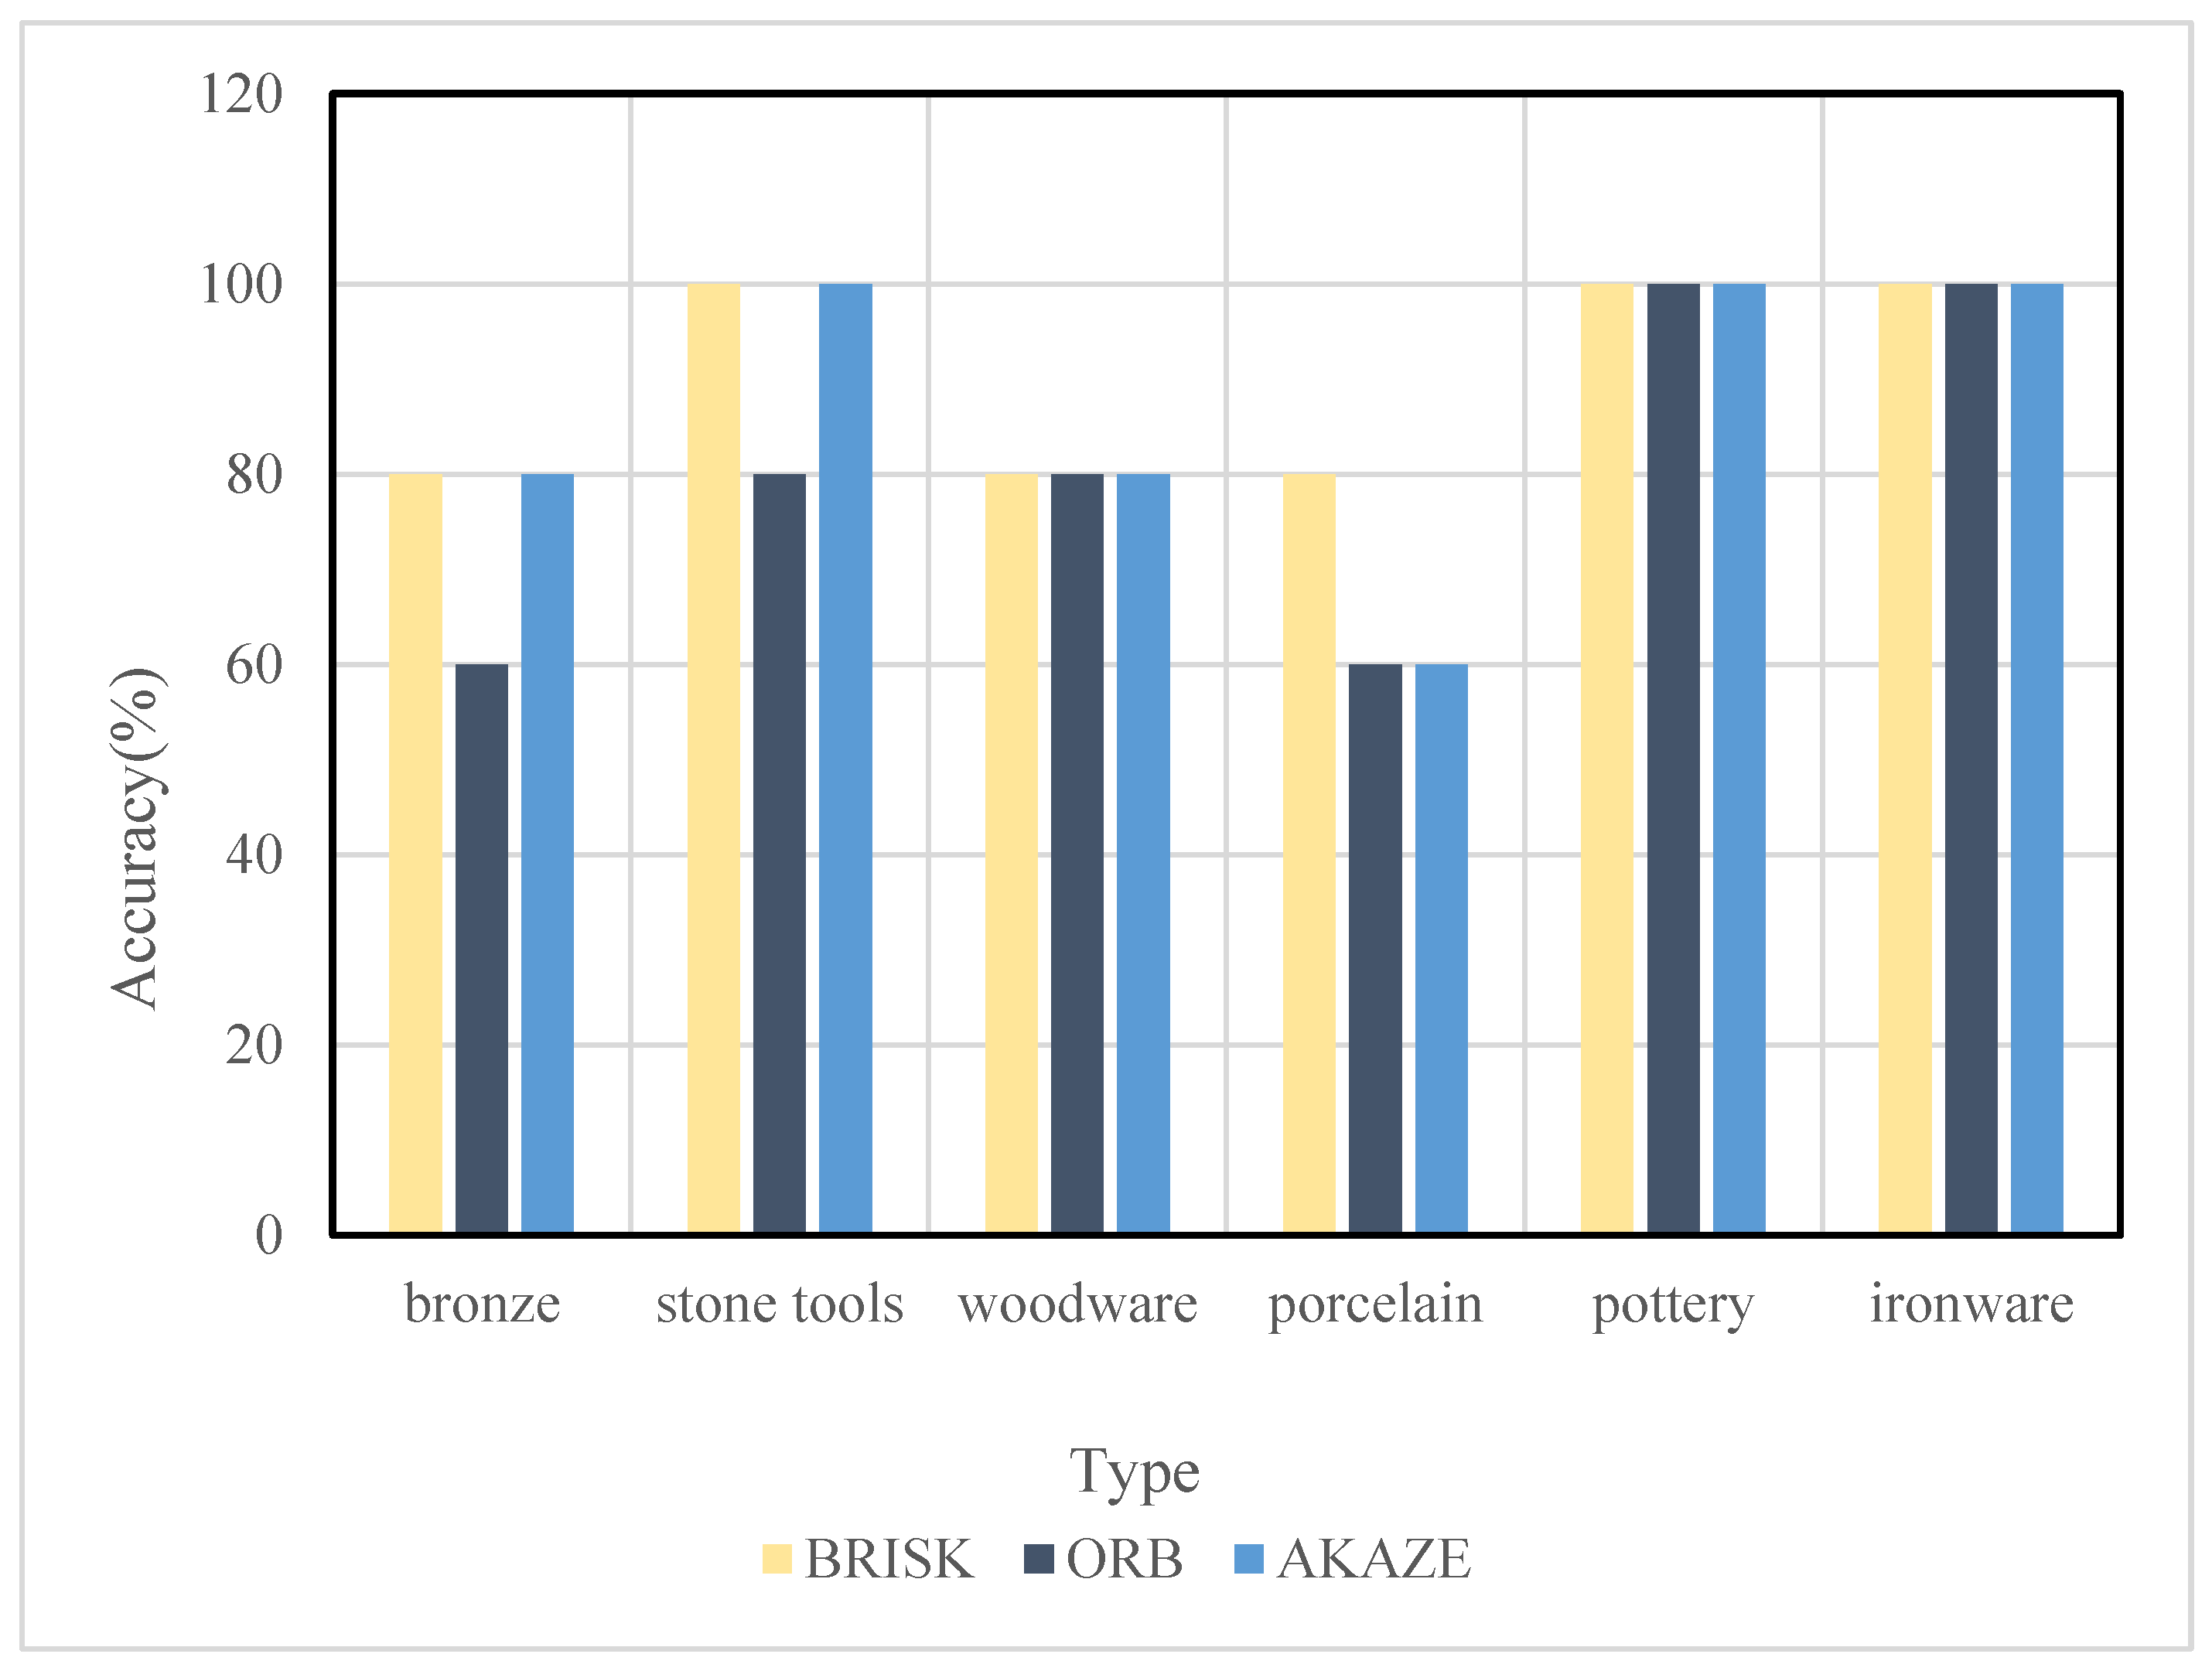
This paper compares and analyzes the performance of the above three methods. In this experiment, time, feature point abundance, and success rate are the three major indicators that affect the performance of the mobile augmented reality system. In the experiment, 6 groups of photos of different cultural relics were randomly selected, and each group of photos contained 11 photos. The average of time, feature point richness and success rate were calculated by comparing the 2–11 photos to the first photo. The experimental results are shown in Figure 2 and Figure 3.
In the Figure 2A, different algorithms are compared in terms of calculation time. On bronze, stone, wood, porcelain, pottery, and iron, BRISK’s calculation time is 14.8 s, 4.9 s, 5.6 s, 5.8 s, 38.9 s, and 5.3 s, respectively; BRB’s calculation time for bronze, stone, wood, porcelain, pottery, and iron is 1.5 s, 1.3 s, 1.2 s, 1.4 s, 1.5 s, and 1.4 s, respectively. The calculation time of AKAZE in bronze, stone, wood, porcelain, pottery, and iron is 20.3 s, 5.8 s, 10.3 s, 15.1 s, 32.3 s, and 20 s, respectively. Figure 2B shows the comparison of the feature richness of different algorithms. On bronze, stone, wood, porcelain, pottery, and iron, BRISK’s characteristic richness is 0.6%, 1%, 0.3%, 0.4%, 20%, and 17.3%, respectively. The characteristic richness of BRB in bronze, stone, wood, porcelain, pottery, and iron is 3.3%, 21.1%, 3.2%, 3.6%, 43.2%, and 40%, respectively. The characteristic richness of AKAZE in bronze, stone, wood, porcelain, pottery, and iron is 1.1%, 4.3%, 1.5%, 2.6%, 22.1%, and 27.6%, respectively.
From Figure 2A, it can be seen that ORB is much better than other methods in terms of timing. It can be seen from Figure 2B that ORB is also better than other methods in terms of the richness of feature points. The mobile augmented reality environment has very high requirements for real-time and stability, so feature detectors and descriptions must be extracted as quickly as possible. This shows that ORB can keep more feature points in the case of similar matching and can better adapt to different feature point richness. It can be seen from Figure 3 that the ORB algorithm is not as good as the other two in terms of accuracy.
According to the FAST common values, the three different filter models have values of 12, 9, 6, 0, and the common values of n3 are 5, 4, 3, 0. In each configuration combination, the optimal value of the m value is different. At the same time, according to the working principle of the amplifier, the test results are analyzed and compared. On this basis, based on three different experiments (n1, n2, and n3), the performance of ORB is improved on the premise that the number of FASTs meets the basic requirements.
The various characteristics of the filter described by the various classification methods reflect the need for comprehensive consideration of the filter requirements in practical engineering applications. That is to say, when designing the user requirements, the user needs need to be considered comprehensively.
When selecting filters, the first thing to be determined is whether low-pass, high-pass, band-pass, or band-stop filters should be used. This paper uses low-pass, high-pass, band-pass, or band-stop filters.
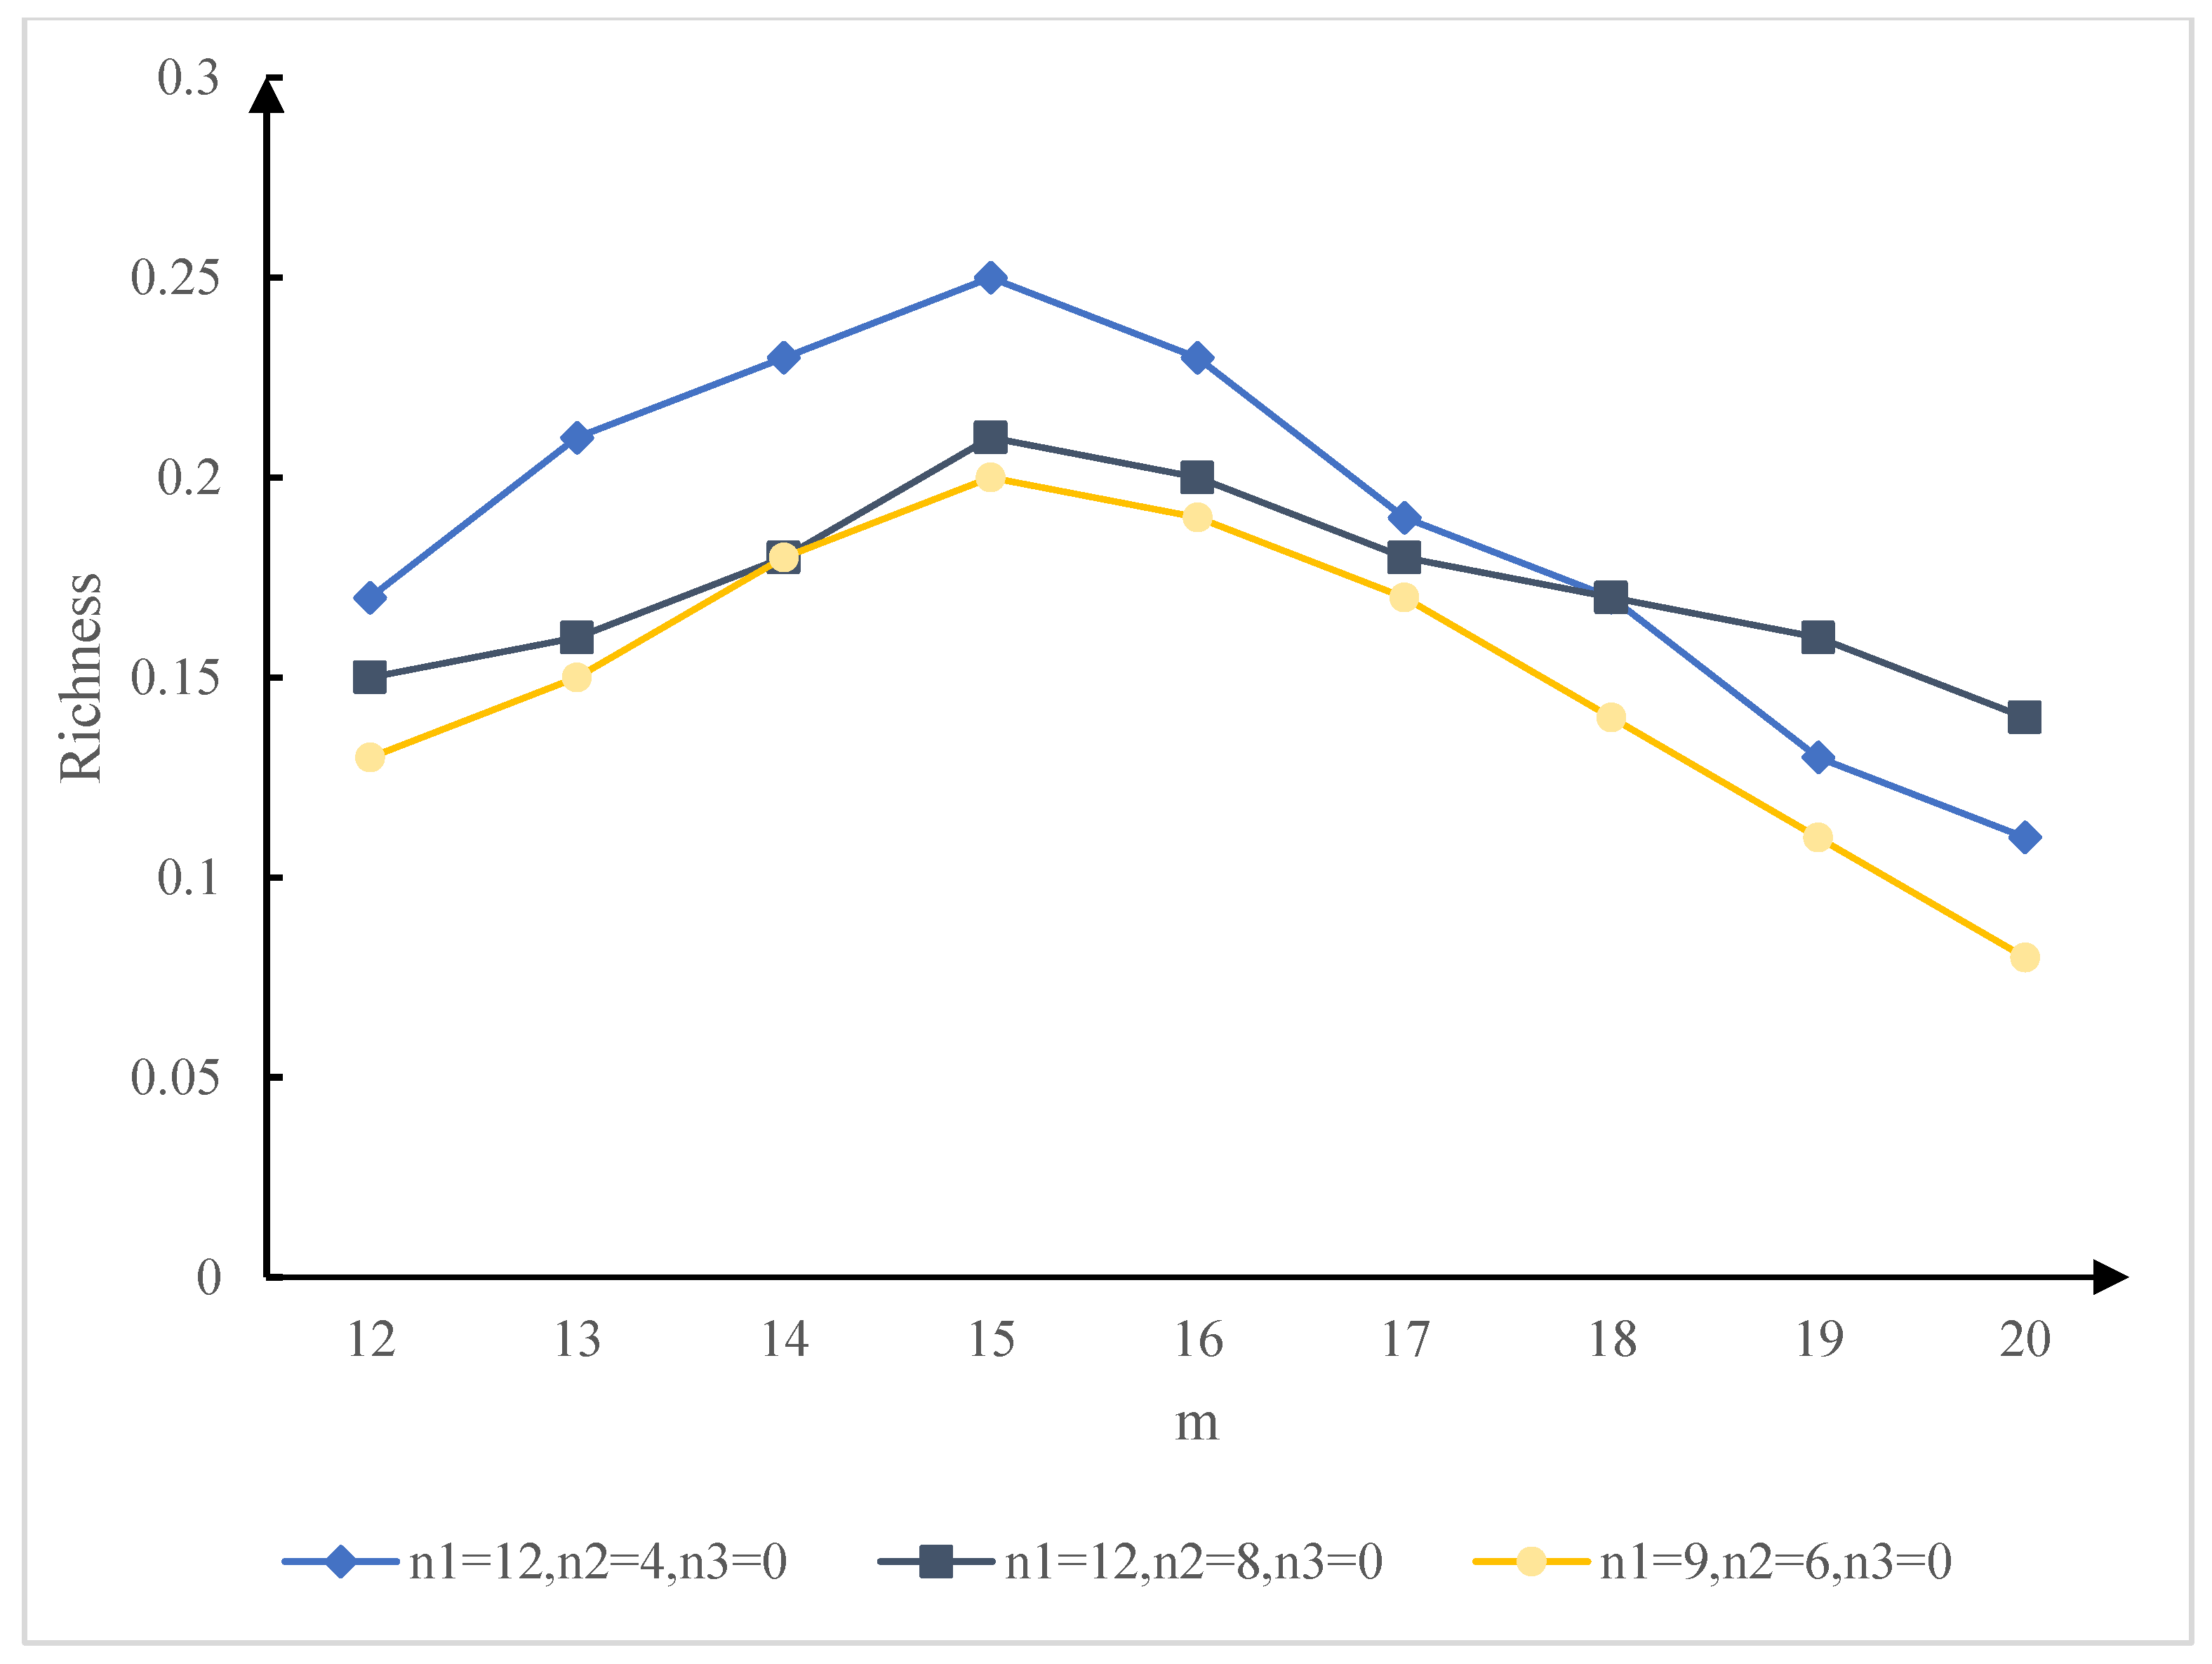
The test used 40 sets of images from the University of Oxford. These tests were carried out under different combinations, and the optimal m is obtained in three cases of n1, n2, and n3. The results are shown in Figure 4. Finally, the performance of the improved ORB algorithm is recorded and analyzed, including time, feature point richness, success rate, etc. The results are shown in Figure 5.
Figure 4 shows the effect of parameter m on abundance under different parameters. When n1 = 12, n2 = 4, n3 = 0, m equals to 12, 12, 14, 15, 16, 17, 18, 19, and 20, and the abundance equals to 0.17, 0.21, 0.23, 0.25, 0.23, 0.19, 0.17, 0.13, 0.11, respectively. When n1 = 12, n2 = 8 and n3 = 0, the abundance equals to 0.15, 0.16, 0.18, 0.21, 0.20, 0.18, 0.17, 0.16, and 0.14, respectively. When n1 = 9, n2 = 6, and n3 = 0, the abundance equals to 0.13, 0.15, 0.18, 0.2, 0.19, 0.17, 0.14, 0.11, and 0.08, respectively.
From the experimental results, the ORB algorithm based on oFAST is the best in terms of success rate and richness of feature points. Compared with the original ORB algorithm, the speed of feature points is improved when n1 = 12, n2 = 4, n3 = 0, and m = 15. The success rate is increased by 16%, while improving the feature point richness by 0.7%.

4. Overall Design of the Augmented Reality Digital Museum System

4.1. Overall System Architecture Design

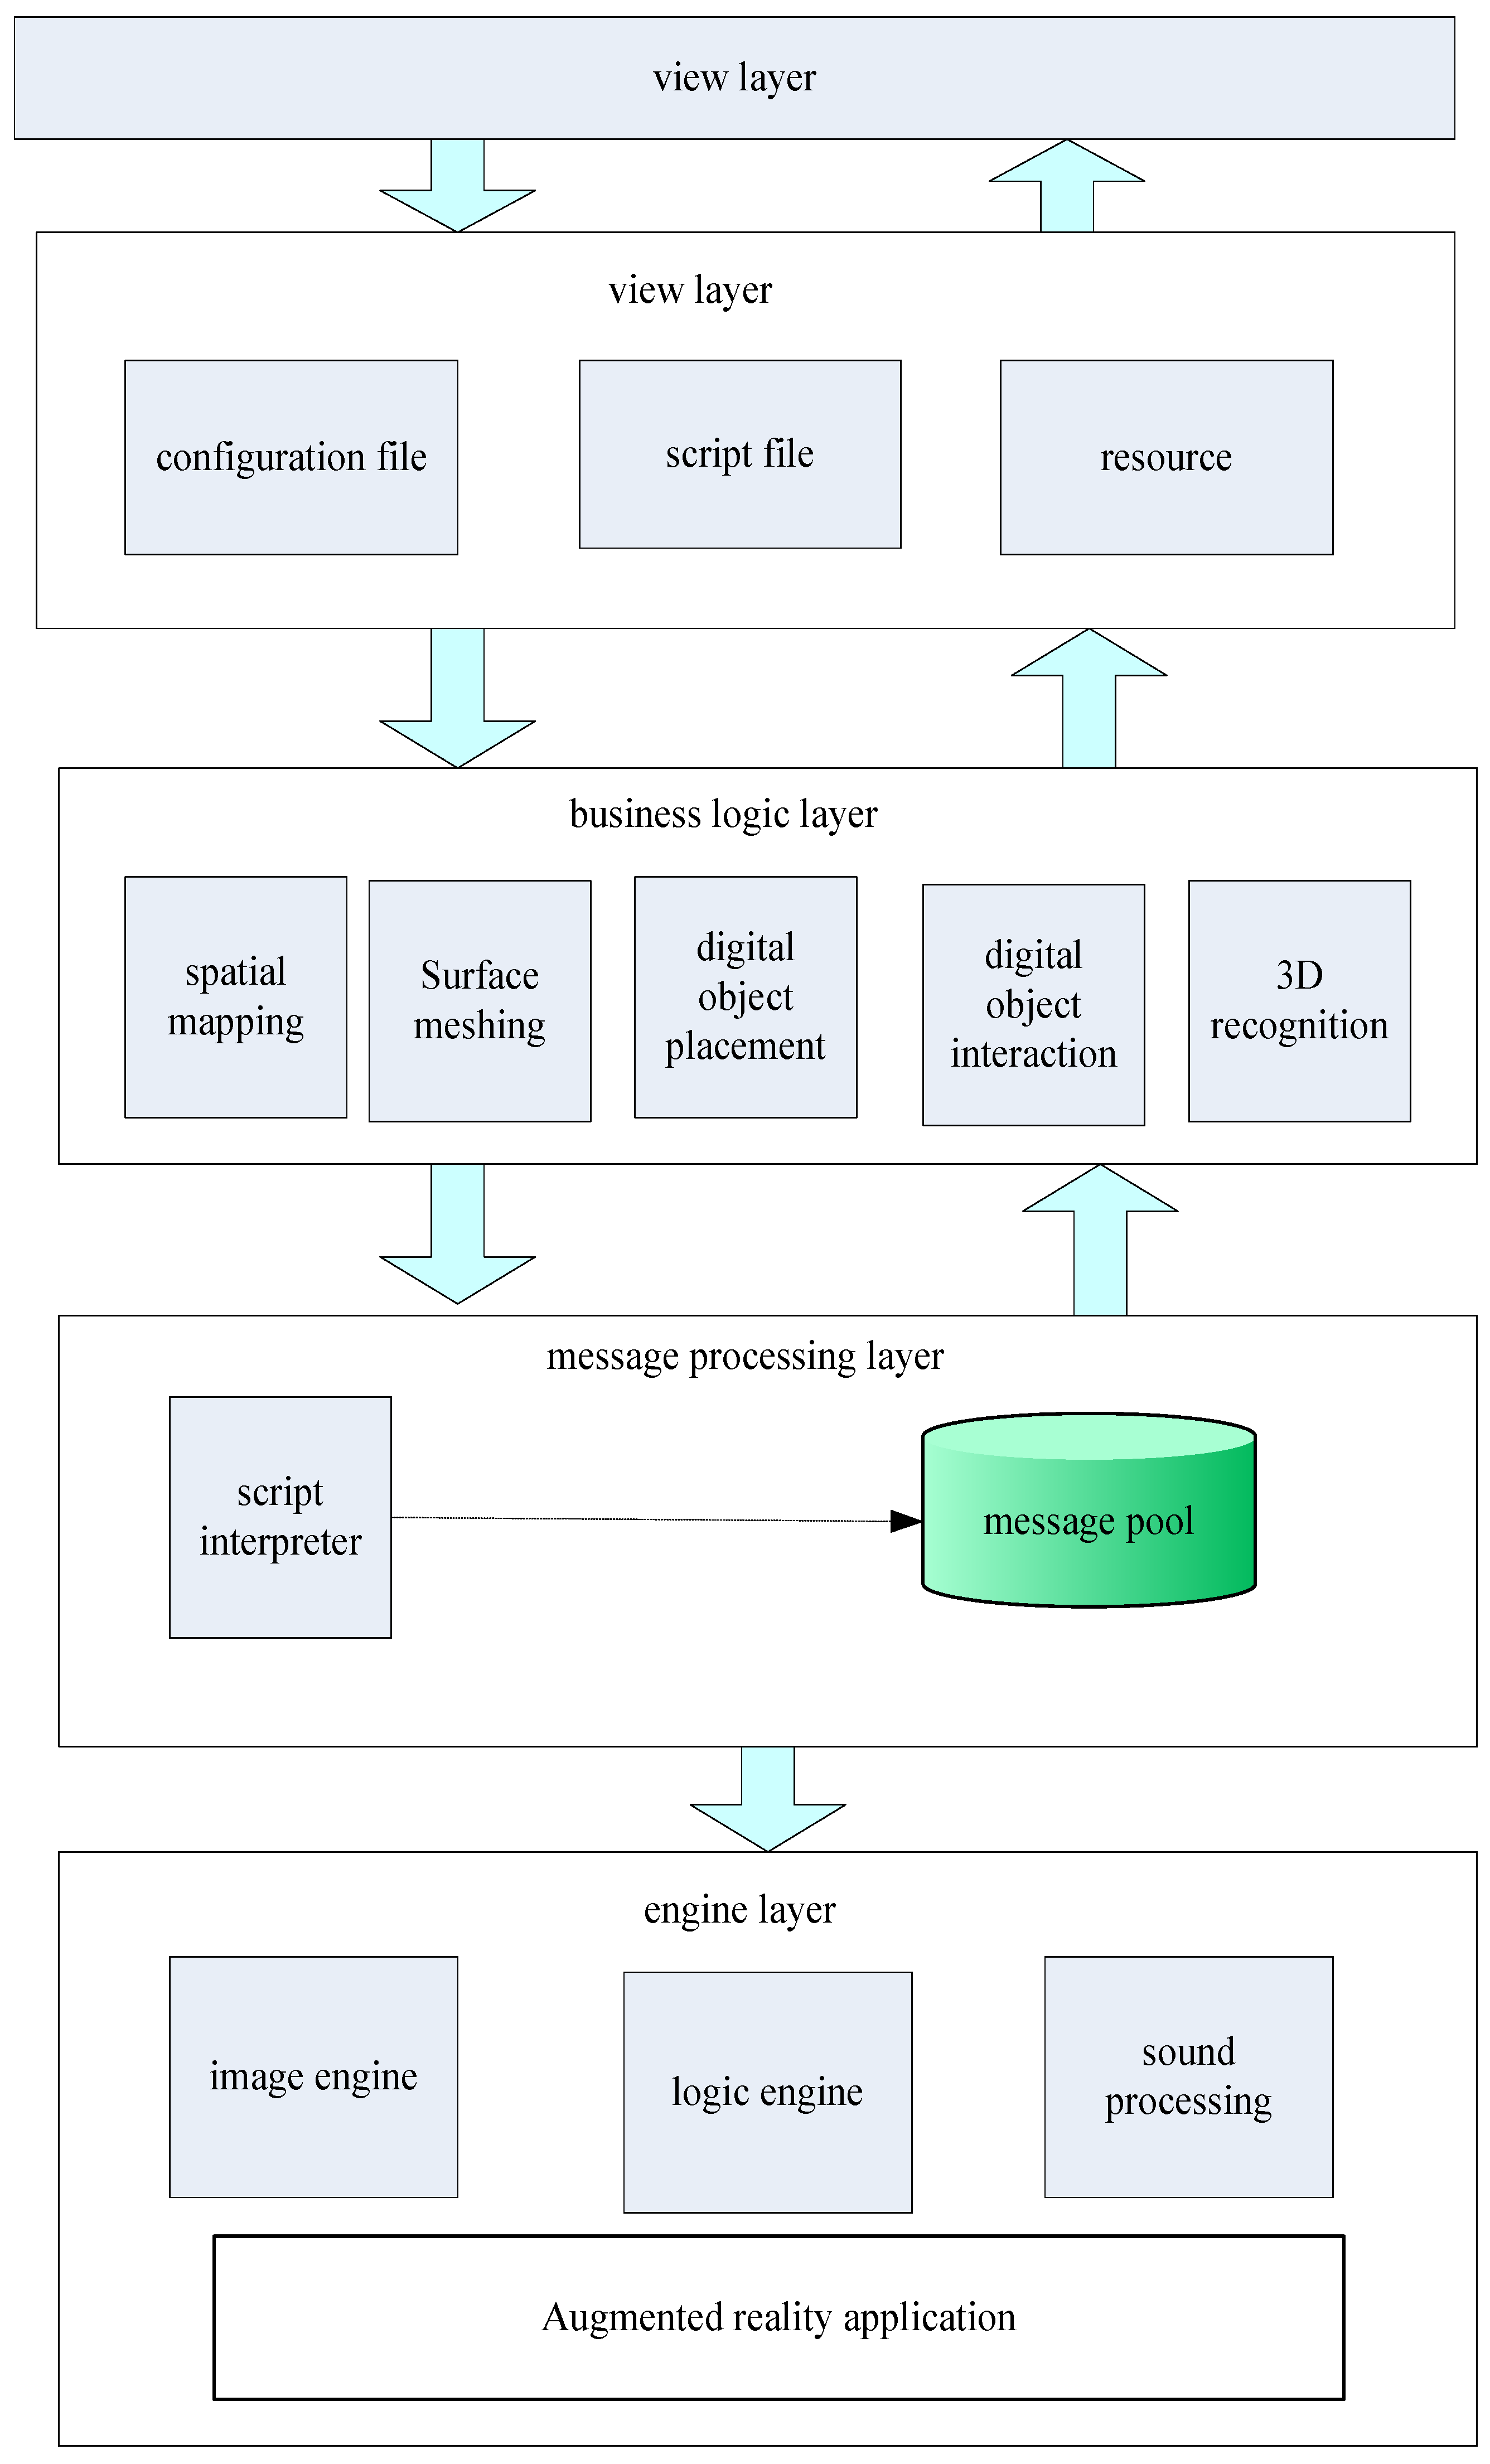
The Augmented Reality Digital Museum is software that runs on Hololens devices. The overall structure of the digital museum system is shown in Figure 6.
As shown in Figure 6, the specific design is as follows: (1) The engine layer includes an image engine, a logic engine, a sound engine, and the development of augmented reality applications. (2) The message processing layer has a text interpreter and a message pool. In the system, a message is issued when a user executes input and output commands. Whether it is a script message or a command message, it would be transmitted to the message pool and then processed by the message processor. (3) The service logic layer includes system space mapping and 3D recognition, in which space mapping includes functions such as surface mesh processing, material rendering, and intelligent placement of digital objects. The above parts constitute the business logic of the system. (4) The function of the control layer is to call the corresponding service processing target according to the user’s requirements and different requirements to realize the service module. It selects the appropriate view component based on the current state and business logic.

4.2. System Function Module Design

A digital museum system based on virtual reality technology was proposed, which divided users’ demands into three aspects. One was to scan the scene inside the museum, map the shape and material of the surface of the scene, and then use the space mapping technology. Display content, such as digital cultural relics, was directly placed in real space to realize physical space positioning and the integration of virtual and reality. The second requirement module was to identify the objects in the museum in 3D and provide digital cultural relics display information so that users can easily browse and learn the historical and cultural knowledge of cultural relics. The third interactive module required the visual interaction of digital cultural relic objects to gain historical knowledge about cultural relics. Converting the three main requirement modules into concrete requirements can be divided into four aspects. The visual effect of the developed virtual museum is shown in Figure 7.
The first is the spatial map. It can preprocess the spatial scene using techniques such as planarization, digital mapping, etc. Using Simultaneous Localization and Mapping (SLAM) and Spatial Mapping technology, it can scan the spatial scene in real time and generate a 3D surface mesh [23,24]. In the functional development of this system, the device is required to be able to recognize the real-space scene and use the space anchor point to store the position of the virtual object to ensure its position. The second function is the intelligent placement of cultural relics. Its function is to place the cultural relics intelligently. For example, the cultural relics on the ground would be generated on the ground. On the wall, the actual cultural relics would be displayed according to the maximum wall area and the spatial position of the user’s camera. Then, based on the largest area and the spatial position of the user’s camera, the cultural relics are displayed in a real spatial environment. The third part is the 3D cultural relic identification module, which mainly uses the AR recognition camera for 3D stereo identification and uses the 3D object feature point recognition technology to directly identify the cultural relics with the camera to improve the digital information level related to the cultural relics. The fourth part is the interactive part, in which the interactive part mainly conducts specific interactions with the digital objects in the scene. Different interaction modes can be adopted for different data objects, including gestures and sounds.

4.3. System 3D Model Design

The modeling of cultural relics requires high technical requirements, while the establishment of 3D models requires manual technology that is time-consuming and inefficient. If a large number of 3D models are to be built, a high-reduction 3D modeling method must be adopted [25,26,27].
There are many kinds of data resources required by the system: the first is the cultural relic model; the second is the text introduction about the cultural relics; the third is the related knowledge introduction; and the fourth is the video introduction. The textual description of the cultural relics is provided by the National Museum, and the 3D model of the cultural relic is based on the hand-held 3D laser scanner. Secondly, the method has good measurement accuracy, which can reach a range of 0.05–0.1 mm, which can well guarantee the quality of the obtained model. It does not need a robotic arm or other tracking devices and can realize automatic positioning of target positions, fast processing of STL (Stereo Lithography) format data, and automatic generation of STL triangular meshes. It is small and effortless, and the operator can work for a long time. The evaluation of the accuracy of different keypoint descriptors has been evaluated in other works.
The cultural relics can be scanned with a laser scanner, and the protection of the cultural relics can be carried out according to the following steps. Firstly, geometric and radiometric corrections are performed using the scanner to determine the relative orientation of the two digital cameras, in order to detect slight movements of instrument parts during handling, or due to changes in environmental conditions. The extent of the scan is determined by geometric corrections to the reference of the photogrammetric system. Radiation correction is implemented to improve the photographic parameters of the two photographic lenses and the laser intensity of the laser tracking. After the scanner is calibrated the cultural relics are scanned. The surveyor is responsible for detecting the distance between the scanner and the target and uses the three-dimensional (3D) model presented in real time on the laptop to control the scanning process. After the scanning is completed, the data can be used as the coordinates of the target point to scan the data of the target point cloud and the 3D model of the STL.

4.4. System Testing and Experience Evaluation

4.4.1. The Function of a Digital Museum Based on Spatial Mapping

The content of the test includes space scanning, grid planarization, intelligent space layout, etc. Users must wear Hololens to open the system’s application. In a relatively open area, including walls, floors, and ceilings, the space is brightly lit, without black walls and mirrors. Table 1 shows the functional testing process and results of the digital museum based on spatial mapping.

4.4.2. Recognition Function Based on Vuforia3D

Vuforia’s 3D cultural relic recognition function is mainly there to allow Hololens to identify real objects. When a user gazes at a real artwork while wearing Hololens, an invisible, detectable digital artifact is created. It is accurately covered where the cultural relics are, and the user can visually scan the object according to the shape of the object. Table 2 shows the process and results of the test:

4.4.3. User Experience Evaluation

To examine the application value of augmented reality technology in digital museums, we invited 20 experts to interact with and use it. Among them, five are museum staff, ten are young ordinary users aged 15–35, and five are middle-aged users over 35 years old. Among them, museum staff are very familiar with the construction of the museum and can be used based on their feedback to evaluate the usability and feasibility of the museum. Ordinary users would understand and accept new technologies according to their own preferences and different age groups.
The evaluation process of this system consists of two parts. The first part is to introduce the function and usage of the system to the subjects. The second was a questionnaire survey of the system after subjects completed their own experiences. During the use phase of the observer, we track the feedback of the observer’s user. It was found that in the process of creating a digital environment for spatial maps, users were generally surprised. In terms of UI (User Interface) interaction and click interaction, users generally believed that the effect of direct clicking on cultural relics was better, and the UI interaction cursor was more difficult to stare at the button. In the functional module of digital chime voice interaction that can play chime sound effects, the user’s response is very good. Users, on the other hand, hope that the Chinese pronunciation will be more friendly if it is English pronunciation. Table 3 is the user’s evaluation of the experience of using the augmented reality museum. In general, the user has a high level of acceptance for the technology and is optimistic about its future development.

5. Conclusions

The focus of this paper is on the digital display of design and the application of digital technology. Furthermore, this paper also summarizes the definitions and characteristics of digital and virtualization technology. Combined with practical examples, it expounds the specific application of digital media in display design, the new methods and new features of display design, and the change in design’s visual language. This paper discusses the application of AR technology in Chinese museums from the perspective of augmented reality digital museums and discusses the problems encountered in exhibition design and the future relationship between digital media and exhibition design.

Author Contributions

H.Y., J.W. and P.Z. designed and performed the experiment and prepared this manuscript. All authors have read and agreed to the published version of the manuscript.

Funding

This work is the result of the Hunan Educational Science Planning Project. Subject title: The research on the practical path of Ideological and political education teaching in the professional curriculum of design science. Subject number: XJK22CTW006.

Data Availability Statement

The data that support the findings of this study are available from the corresponding author upon reasonable request.

Conflicts of Interest

The authors declare no conflict of interest.

References

  1. Song, S.; Sun, G. Digital Media Art Communication Based on Wireless Cooperative Routing with Minimum Energy Consumption. J. Sens. 2021, 2021 Pt 11, 6800470. [Google Scholar] [CrossRef]
  2. Zhu, T. The Reform of Digital Media Art Professional Curriculum System Based on Internet Technology. J. Phys. Conf. Ser. 2021, 1992, 032121–032125. [Google Scholar] [CrossRef]
  3. Zinman, G. Nam June Paik’s Etude 1 and the Indeterminate origins of Digital Media Art. October 2018, 164, 3–28. [Google Scholar] [CrossRef]
  4. Sayre, L. The Art of Hip-Hop in Digital Media. Writ. Waves 2019, 1, 17. [Google Scholar]
  5. Hernandez, S. Case study: Digitising Cleveland Museum of Art history one negative at a time. J. Digit. Media Manag. 2018, 6, 327–338. [Google Scholar]
  6. Erwinsah, R.; Aria, M.; Yusup, Y. Application of augmented reality technology in biological learning. J. Phys. Conf. Ser. 2019, 1402, 066090. [Google Scholar] [CrossRef]
  7. Almquist, E.G. Augmented Reality. Iron Steel Technol. 2022, 19, 38–41. [Google Scholar]
  8. Gao, X.; Hui, A.; Chen, W.; Pan, Z.; Amp, D.M. A Survey on Mobile Augmented Reality Visualization. Jisuanji Fuzhu Sheji Yu Tuxingxue Xuebao/J. Comput. Aided Des. Comput. Graph. 2018, 30, 1–9. [Google Scholar] [CrossRef]
  9. Qiu, C.; Zhou, S.; Liu, Z.; Gao, Q.; Tan, J. Digital assembly technology based on augmented reality and digital twins: A review. Virtual Real. Smart Hardw. 2019, 1, 597–610. [Google Scholar] [CrossRef]
  10. Wang, S.; Kaikai, D.U.; Song, N.; Zhao, D.; Feng, D.; Tu, Z. Study on the adaptability of augmented reality smartglasses for astigmatism based on holographic waveguide grating. Virtual Real. Smart Hardw. 2020, 2, 79–85. [Google Scholar] [CrossRef]
  11. Bakri, F.; Pratiwi, S.; Muliyati, D. Student worksheet with augmented reality technology: Media to construct higher order thinking skills of high school students in elasticity topic. J. Phys. Conf. Ser. 2020, 1521, 022033. [Google Scholar] [CrossRef]
  12. Hutahaean, H.D.; Rahman, S.; Mendoza, M.D. Development of interactive learning media in computer network using augmented reality technology. J. Phys. Conf. Ser. 2022, 2193, 012072. [Google Scholar] [CrossRef]
  13. Sucihati, R.; Malyan, A.; Cofriyanti, E. Augmented Reality in the Registration Flow for Enterance Eximination at State Polytechnic of Sriwijaya Based on Android. J. Phys. Conf. Ser. 2020, 1500, 012128. [Google Scholar] [CrossRef]
  14. Wilujeng, S.; Chamidah, D.; Wahyuningtyas, E. Learning development model biological material “flowers wijaya kusuma (Epiphyllum anguliger)” by using augmented reality media to facilitate independent learning students. IOP Conf. Ser. Mater. Sci. Eng. 2018, 434, 012101. [Google Scholar] [CrossRef]
  15. Yussof, F.M.; Salleh, S.M.; Ahmad, A.L. Factors of augmented reality technology adoption in influencing attitude and purchasing intention: A review on advertising context. Int. J. Adv. Sci. Technol. 2019, 28, 321–328. [Google Scholar]
  16. Linse, C.; Alshazly, H.; Martinetz, T. A walk in the black-box: 3D visualization of large neural networks in virtual reality. Neural Comput. Appl. 2022, 34, 21237–21252. [Google Scholar] [CrossRef]
  17. Liono, R.A.; Amanda, N.; Pratiwi, A.; Gunawan, A. A Systematic Literature Review: Learning with Visual by The Help of Augmented Reality Helps Students Learn Better. Procedia Comput. Sci. 2021, 179, 144–152. [Google Scholar] [CrossRef]
  18. Dubey, V. FinTech Innovations in Digital Banking. Int. J. Eng. Technol. Res. 2019, 8, 597–610. [Google Scholar]
  19. Mager, A.; Katzenbach, C.; Liao, T.; Iliadis, A. A future so close: Mapping 10 years of promises and futures across the augmented reality development cycle. New Media Soc. 2021, 23, 258–283. [Google Scholar]
  20. Ignatyev, V.I. Ontology of Augmented Reality. Discourse 2020, 6, 80–96. [Google Scholar] [CrossRef]
  21. Jun, G. Virtual Reality Church as a New Mission Frontier in the Metaverse: Exploring Theological Controversies and Missional Potential of Virtual Reality Church. Transform. Int. J. Holist. Mission Stud. 2020, 37, 297–305. [Google Scholar] [CrossRef]
  22. Lindner, C.; Rienow, A.; Juergens, C. Augmented Reality applications as digital experiments for education—An example in the Earth-Moon System. Acta Astronaut. 2019, 161, 66–74. [Google Scholar] [CrossRef]
  23. Makowski, M.; Pitek, P.; Grynkiewicz, M. Projection of holographic images in volumetric fluorescent fluids for near-eye displays. Photon. Lett. Pol. 2019, 11, 99–103. [Google Scholar] [CrossRef]
  24. Zheng, X.; Kamruzzaman, M.M.; Shi, J. Method of generating face image based on text description of generating adversarial network. J. Electron. Imaging 2022, 31, 051411. [Google Scholar]
  25. Nurhasanah, Y.; Putri, D.A. Pengembangan Media Pembelajaran Digital Berbasis Augmented Reality Pada Topik Klasifikasi Hewan Berdasarkan Habitatnya. Multinetics 2020, 6, 86–98. [Google Scholar] [CrossRef]
  26. Mikolajczyk, K.; Schmid, C. A performance evaluation of local descriptors. IEEE Trans. Pattern Anal. Mach. Intell. 2005, 27, 1615–1630. [Google Scholar] [CrossRef] [Green Version]
  27. Bojanić, D.; Bartol, K.; Pribanić, T.; Petković, T.; Donoso, Y.D.; Mas, J.S. On the Comparison of Classic and Deep Keypoint Detector and Descriptor Methods. In Proceedings of the 2019 11th International Symposium on Image and Signal Processing and Analysis (ISPA), Dubrovnik, Croatia, 23–25 September 2019; pp. 64–69. [Google Scholar] [CrossRef]
Figure 1. “ARART” application.
Mathematics 11 01278 g001
Figure 2. Comparison of the computing performance of the three algorithms. (A) Computational time comparison. (B) Feature richness comparison.
Mathematics 11 01278 g002
Figure 3. Comparison of the accuracy of the three algorithms.
Mathematics 11 01278 g003
Figure 4. The influence of parameter m on richness under different parameters.
Mathematics 11 01278 g004
Figure 5. Performance comparison of the improved ORB algorithm.
Mathematics 11 01278 g005
Figure 6. System Design Architecture.
Mathematics 11 01278 g006
Figure 7. Visual effect of a virtual museum.
Mathematics 11 01278 g007
Table 1. Spatial mapping test cases.
Functional ModuleSerial NumberThe Construction of a Digital Museum Based on Spatial Mapping
Test Conditions1The tester wears Holoens in a relatively empty indoor environment.
2The indoor environment requires walls, floors, and ceilings.
3The indoor environment is relatively bright, without pure black large surfaces and reflective surfaces.
4The tester starts the spatial mapping scan thread.
Use case steps1Tester turns on space mapping.
2The tester walks slowly in the environment, moving and scanning walls, floors, and ceilings.
3Scan time expires; testers can view digital artifacts.
Expected outcome1The scan time is 10 s, and the tester can see the generated surface mesh.
2When the scan time expires, the scene intelligently generates a museum scene, and there are cultural relics on the ground and walls.
3The cultural relics on the wall and the ground are more suitable for the tester, which is about 2 m away.
Actual results1The spatial scanning function is normal, and the meshing processing and plane generation are as expected.
2Flat map as expected.
3The artifacts that are intelligently generated on the wall are on the largest wall closest to the user.
4The artifacts generated intelligently on the ground are on the largest ground closest to the user.
Table 2. 3D cultural relic recognition test cases.
Functional Module Serial Number3D Recognition of Real Cultural Relics Based on Vuforia
Test conditions1Test object: real cultural relics with feature point scanning and project configuration in advance.
2The tester wears Holoens and stands in front of the configured Pixiu.
3Start the AR (augmented reality) recognition thread.
Use case steps1Testers wear Hololens to open the AR cultural relic identification thread.
2Annotated cultural relics Pixiu.
3Pixiu body. Gaze cursor feedback appears on the body, and testers can click.
Expected results1If the recognition is successful, the cursor feedback will appear on the Pixiu, which can be clicked with gestures.
Actual results1The recognition is normal, the cursor feedback appears on the Pixiu, and the gesture-click interaction is possible.
2The tester needs to continuously annotate the cultural relics (5 m) at a close distance (less than 0.5 m) in order to succeed.
Table 3. Statistical results of the user experience (full score is 10 points).
Evaluation ParametersHighest ScoreLowest ScoreAverage
Innovation1069.3
Ease of use847.6
Interactivity1088.7
Performance operation8.567.9
Functionality9.578.6
Stimulate interest1089.3
Satisfaction1068.2
Disclaimer/Publisher’s Note: The statements, opinions and data contained in all publications are solely those of the individual author(s) and contributor(s) and not of MDPI and/or the editor(s). MDPI and/or the editor(s) disclaim responsibility for any injury to people or property resulting from any ideas, methods, instructions or products referred to in the content.