Abstract
Today, e-commerce allows consumers access to a wide range of products on the global market, quick and convenient selection, purchase, ordering, and payment of products. Consumers expect to receive the products they bought online, very quickly, at favorable prices and delivery conditions. However, it is often not possible, because global supply chains are realized over large geographical distances, with a whole range of disruptions and challenges that need to be successfully overcome. With the aim of efficiently delivering products and meeting consumer expectations, retailers often leave this job to specialized and resilient logistics companies better known as fourth-party logistics (4PL) providers. On this occasion, it is necessary to conduct a very thorough evaluation of the logistics provider based on appropriate scientific approaches and models. In this paper, a new hybrid approach for the evaluation of resilient 4PLs was proposed, with the aim of providing appropriate support for the decision-making system on product delivery in e-commerce. The hybrid approach is based on the fuzzy full consistency method (FUCOM), evidence theory (ET), rule-based transformation (RBT), and weighted aggregated sum product assessment (WASPAS) methods. The proposed model was tested and applied to an example of an online retailer, which sells and delivers products originating from China and the countries of the Far East to the market of the Western Balkans and Southeastern Europe. Five 4PL providers were evaluated and ranked according to 10 criteria. According to the results, the most important criterion was IT capabilities, while the least important was cooperation. Additionally, sensitivity analysis was carried out to determine whether the final ranking will change. The obtained results showed that the proposed methodology represents a valuable decision support tool that can be used for solving not only the problem described in this paper but also similar problems.
MSC:
90B06
1. Introduction
In recent years, e-commerce has become an increasingly important sales channel for both products and services. It is estimated that e-commerce in the total retail sales on the global market participates between 20–25% and that in the coming years, the growth of online sales will be around 10% per year [1]. The reasons for this are numerous, and some of the advantages of international e-commerce that lead to this are reflected in easier expansion into foreign markets, shorter B2B sales cycles, lower barriers to entry to the foreign market, the quicker building of international presence, and so on [1]. E-commerce enables consumers to purchase products worldwide with minimal costs, time, and effort. In addition, the advantages of e-commerce are numerous and are reflected in the availability of products 24/7 on the global market, the speed, and the comfort of shopping from the armchair with one click [2]. What cannot be realized so quickly and comfortably is the delivery of products, which often leads to dissatisfaction of end consumers. That is, products ordered online must physically go through very complex supply chains, where logistics processes require a certain amount of time, generate costs, employ different resources, and encounter numerous risks and disruptions [3].
E-commerce constantly poses new challenges and demands to logistics, such as reliable delivery of products in the shortest possible time, favorable prices and delivery conditions, high quality of products and services, high frequency of delivery of smaller shipments, and products return. It is rightly argued that logistics and product delivery are key and critical factors in successful e-commerce [4]. Online sellers are looking for different solutions to efficiently deliver products and meet the increased expectations of consumers. One of the approaches is the engagement of logistics service providers (LSP), who have the necessary knowledge, experience, and resources and are qualified to offer and provide full logistics service in the domain of designing, planning, and managing supply chains and product delivery processes. There is a large offer of providers on the global market, who offer logistics services in e-commerce, and on this occasion, it is very important to hire the right one.
The decision process follows a series of questions, which come from the domain of e-commerce and global supply chains. First of all, extremely high uncertainty, indeterminacy, unpredictability, and impreciseness are present in terms of market requirements, but also parameters related to logistics and accompanying processes. The processes are realized by a large number of participants, in different environments, and in different geographical areas. Insufficiently reliable input parameters and information that are incomplete and in different forms and formats further complicate the decision-making process. In addition to all that, global supply chains, in recent years, have been accompanied by very strong disruptions and challenges, such as the COVID-19 pandemic, trade and real wars, energy and economic crises, strikes, congestion of world ports, airports, and main logistics routes. This brings to the fore the resilience of logistics providers and all participants in the supply chain. However, the aforementioned disorders are very difficult to predict and include in traditional decision-making models. During the management of the supply chain in e-commerce, it is required to make decisions in a significantly shorter period of time, compared with traditional trade, which further complicates the entire decision-making process.
All of the above clearly indicate the limited application of traditional and standard decision-making models and point out the need for the development and application of new integrated approaches that adequately treat this issue. It is evident that such approaches and models are missing in the available literature, especially in practical applications. The main motivation for writing this paper was to fill the perceived gap, where the authors tried to propose a new hybrid approach and model for evaluating a resilient 4PL provider for e-commerce needs, based on fuzzy FUCOM-ET-RBT-WASPAS methods. The first method was used to obtain criteria weights, while ET and RBT were used to construct the initial decision-making matrix used in the WASPAS method. The model was tested on a concrete example for the evaluation of five global 4PL providers based on 10 criteria. The proposed and applied hybrid approach, on a concrete example, represents the main scientific contribution of this paper. In addition, a significant contribution of this paper is reflected in the fact that it connects very current and important aspects of the global supply chain, such as e-commerce, resilience, and the possibility of improving the delivery of online ordered products by 4PL providers.
The paper is organized as follows: After the introduction, a review of the literature is presented. Based on the literature review, the criteria observed in this paper were determined and defined in the Section 2. The methodology of the paper is presented in the Section 3, as well as the implementation steps for each method used in this paper. Based on the implementation of the proposed methodology, the obtained results are then presented in the Section 4. In the Section 5, sensitivity analysis, as well as managerial implications and discussion, is provided. At the very end of the paper, concluding remarks and directions for future research are outlined.
2. Literature Review and Criteria Definition
2.1. Literature Review
In accordance with the goal set, in the following sections, a literature review related to e-commerce and logistics services, resilience in global supply chains, and evaluation and selection of logistics service providers is given.
2.1.1. The Role of Logistics in E-Commerce
When it comes to logistics and logistics service providers in e-commerce, four main aspects appear in the literature: supply chain and network design, outbound and reverse logistics strategies, warehousing activities, and e-commerce IT and data from the logistics aspect [5]. A very important question is how to reach customers in the most efficient way: multichannel, omnichannel, or pure e-commerce. Different methodologies and models are used for SC configuration in the e-commerce context [6]. Numerous papers deal with facility location [7].
The next very important issue of logistics and e-commerce is outbound logistics. Outbound logistics in e-commerce refers to the movement and storage of products from a business to its customers. There are several main research subjects in this area, which can be grouped into the following categories: last-mile logistics, vehicle routing problem (VRP), outsourcing issue related to third-party logistics (3PLs), logistics pooling phenomenon, environmental impact of transports, new trends and technologies, and packaging process [5].
Reverse logistics is the process of managing the return of goods from consumers to the seller or manufacturer. This can include the transportation, storage, and disposal of returned products. Reverse logistics is an important aspect of the supply chain, as it can affect the costs and efficiency of a business. A study by Stock et al. [8] found that effectively managing product returns can have a positive impact on a business’s profitability and competitiveness. This can be achieved through cost reduction, higher product recovery rates, and higher customer service levels.
Warehousing is a key component of the supply chain and involves the intermediate storage of goods between two successive stages, such as between the manufacturer and the retailer. Warehousing plays a crucial role in ensuring the smooth flow of goods throughout the supply chain. Warehouse design and management play a crucial role in the efficiency and effectiveness of logistics operations. An effective warehouse design can help to streamline processes, reduce employee fatigue, and improve customer service levels. The most important issues in the e-commerce literature are order picking strategies, level of automation, and warehouse performance [9,10].
E-commerce IT and data management (E-IT) refers to the use of information technology and data management to support e-commerce operations. E-IT can provide a number of benefits for businesses, including increased competition, lower prices of goods and services, the ability to compare products from different vendors, and easy access to a wide range of vendors anytime and anywhere [11]. The growth of e-commerce has led to an increase in the importance of logistics information systems (LIS) and supply chain information systems. These systems are used to manage and optimize the flow of information within logistics operations and throughout the supply chain. The integration of LIS and supply chain information systems can help logistics organizations to improve the efficiency and effectiveness of their operations by providing real-time data on inventory levels, transportation schedules, and other key logistics processes.
Apart from the mentioned, the aspect of service quality and user satisfaction is also very important [12]. Vasić et al. [13] examined the impact of logistics service dimensions on consumer satisfaction in e-commerce. Abdirad and Krishnan [14] examined the impact of the e-supply chain on service quality (SQ) and customer satisfaction (CS). Based on the obtained results, the authors concluded that e-supply chain management (E-SCM) has a direct impact on customer satisfaction, while a positive and significant relationship was also identified between E-SCM and CS, E-SCM and SQ, and SQ and CS. Ngah et al. [15] in their paper identified the factors influencing the satisfaction and reuse intention of 3PL services among online sellers in Malaysia using the stimulus-organism-response (SOR) theory.
Sustainability dimensions (economic, social, and environmental) in e-commerce and logistics are recognized in the literature as well. Authors [16] also identified related trends, such as technological developments, including electric vehicles and specialized software; crowd shipping; operation modes, such as collection and delivery points, parcel lockers, and microdepots; and policymaking.
2.1.2. Resilience of the Global Supply Chains
Different interpretations of the concept of resilience can be found in the literature. Certain authors define resilience as the system’s ability to recover from disturbances and disruptive events [17] in an acceptable time [18]. Another definition is that resilience means the ability of a company to withstand disruptions and recover successfully [19]. The third expanded interpretation states that it is the ability of the company to withstand disturbances and return to its original state when the disturbances pass [20] or transition to a new desired state [21]. Recent research states that response and recovery require restructuring, adaptation, or reconfiguration of the supply chain network [22,23]. Data envelopment analysis (DEA) was used by [24] for evaluating the resilience of supply chain networks (SCN). Um and Han [25] explored the relationships among global supply chain risks, supply chain resilience, and mitigating strategies in their paper.
Zhang et al. [26] state that in recent years, significant results have been achieved in the study of product supply chain resilience, but they did not include the supply aspect of logistics services. They state that the supply of logistics services is capacity based and is quite different from the supply of products, which significantly affects the establishment and strengthening of cooperation in the supply chain. The authors used a tripartite asymmetric model of government, manufacturer, and integrator and used evolutionary game theory to analyze the resilient decision making of participants to achieve optimal returns under bounded rationality. Delic et al. [27] examined the impact of supply chain resilience on supply chain performance. In order to design a resilient supply chain under price competition and facility disruption, a Stackelberg game approach was used by [28]. A game-theoretic model of public–private emergency collaborations was developed by [29].
Wieland and Durach [30] used an interdisciplinary approach to understanding supply chain resilience by introducing two perspectives of resilience: engineering and socioecological. From the first perspective, the supply chain is observed as a closed engineering system, where optimization, quick response to disruptions, and the shortest possible recovery time are sought. Another perspective observes the supply chain as an open system with major influences from the environment, which changes over time and tends to transform and adapt. Novak et al. [31] observed the supply chain as a complex system with a large number of participants that directly affect resilience.
From the perspective of this research, the papers dealing with the resilience of logistics service providers (LSPs), as key creators of the supply chain, are especially important. For example, it is pointed out that LSPs play an important role in resilience, through their integration and cooperation along the global supply chain [32]. On the other hand, supply chain disruptions have a significant impact on LSP resilience and operations [33]. Chen et al. [34] emphasize the importance of modeling and improving resiliency in the area of delivery of express shipments, which are the most sensitive to deadlines. A mixed-integer linear programming (MILP) model for analyzing the efficiency of different delivery modes affecting the resilience of the entire supply chain was proposed by Shoja et al. [35]. Carvalho et al. [36] discuss the impact of a port strike on the resilience and performance of LSPs. Iyengar et al. [37] investigated the resilience of small entrepreneurs at the bottom of the pyramid. Herold et al. [38] discuss how LSPs managed to maintain supply chain resilience in the face of COVID-19. These authors argue that supply chain resilience directly depends on LSP resilience. LSP has a significant impact in eliminating or reducing risks arising from unstable demand, supply, or demand for urgent deliveries [39]. Liu and Lee [40] argue that the integration of participants, provided by 3PL providers, significantly enhances supply chain resilience. Based on the literature review, it was determined that only limited research exists that investigates specifically how LSPs can help to maintain or build resilience in and for supply chains, especially regarding the COVID-19 pandemic. Recently, a vulnerability in logistics outsourcing and the security design of LSPs was investigated [39,40]. This was an additional motivation for the authors to conduct this research and contribute to the current literature.
2.1.3. Evaluation and Selection of Logistics Service Providers
In this paragraph, a review of the literature regarding the selection and evaluation of 4PL was carried out. As already mentioned, there are a small number of papers dealing with the described problem. Aydin et al. [41] in their paper proposed a neutrosophic MCDM method for the assessment of 4PL providers’ performance. The authors defined the neutrosophic language scale that was used by experts in order to evaluate the performance of 4PL providers. Bhatti et al. [42] used Taguchi’s loss function to propose a model for 3PL selection by 4PLs. Caglar and Aydin [43] in their paper examined the role and capabilities of 4PL in supply chain agility and firm performance. Based on the results, it was concluded that firms can benefit greatly if they have a partnership with 4PL. Buyukozkan et al. [44] proposed an analytical MCDM approach to evaluate 4PL operating models. This approach was based on the 2-additive Choquet integral, which is used in a situation when, for example, two criteria are simultaneously satisfied. Yang et al. [45] considered the problem of logistics partner selection. The aim of the paper was to propose an optimization model of the logistics partner selection based on comparing the strength of each logistics enterprise and compartmentalizing the logistics demand by region. For this purpose, the authors developed a model based on a genetic algorithm (GA) by using the methods of binary encoding, larger population size, and smaller crossover probability. On the other hand, Zhang et al. [46] developed a novel mixed-integer nonlinear programming model to design the multiperiod distribution network from a 4PL perspective. There are a small number of papers that research 4PL resilience, and the ones present are mainly dealing with defining network design. Thus, Huang et al. [47] considered a 4PL network construction problem that takes uncertain disruptions into account. The authors developed an optimization model based on resilience and used the particle swarm optimization (PSO) method to solve problems regarding the selection of facilities and 3PL vendors. Li et al. [48] also considered the problem of network design of 4PL. In their paper, the authors proposed an optimization model that minimizes the total costs subjective to resilience constraints and optimizes the forward and reverse network simultaneously under multiple operations periods.
On the other hand, Yazdi et al. [49] examined the critical success factors for supply chain resilience regarding the selection of transportation service providers. Additionally, they proposed an approach based on the best-worst method (BWM) and multi-attributive border approximation area comparison (MABAC) to rank resilience-related critical success factors for transportation service providers in uncertain environments using hesitant fuzzy sets (HFS). Naseem et al. [50] developed an approach based on a combination of grey relational analysis (GRA) and the technique for order preference by similarity to the ideal solution (TOPSIS) for choosing the best logistics service provider for e-commerce companies.
2.2. Defining 4PL Evaluation Criteria
After the literature review, it was established that there are a large number of criteria used in this area. In accordance with the topic, it was investigated which criteria are most often used to solve the following problems: selection and assessment of 3PL or 4PL providers, selection of a resilient provider, and selection of 3PL/4PL providers in electronic commerce. Based on this literature review, 10 criteria were selected that were used in this paper for the evaluation and selection of 4PL e-commerce providers.
The following criteria were selected: service price (C1), service time (C2), service quality (C3), IT capabilities (C4), supply chain design (C5), safety stock inventory (C6), flexibility (C7), cooperation (C8), redundancy (C9), and risk management (C10). When it comes to the delivery of goods, especially in e-commerce, the first three criteria are very important, considering that service price, time, and quality directly affect competitiveness. Service price is defined as the price a company needs to pay for the services provided by the 4PL providers. Service time is the time it takes to deliver goods (observed from the moment of ordering until the moment of delivery to the end consumer). Service quality is described through three dimensions—percentage of errors, cost of damage, and on-time delivery—considering that service quality can be observed from several aspects. Each of the dimensions is evaluated separately on a defined scale (1–5). The values for each of the dimensions are shown in Table 1.

Table 1.
Assessment scale for service quality dimensions.
The next criterion observed in this paper is IT capabilities. This criterion was taken into account since visibility in the supply chain as well as timely information is a very important factor, especially when taking into account resilience. Based on the timely information, it is possible to properly manage all processes in the entire supply chain. Supply chain design is significant and directly affects the speed of delivery, and in this paper, was observed through two dimensions: the number of offices in the world a certain 4PL has and the number of countries in which 4PL operates. Safety stock inventory represents the total capacity that the 4PL has (including the capacities of the 3PL providers with whom the observed 4PL works together). It is important to point out that it does not represent the amount of stock that needs to be held, but rather, it represents the maximum capacity that the 4PL can provide for stock storage in case of disruption in the supply chain. Flexibility, like service quality, is observed and evaluated through the following dimensions: the number of different types of goods a 4PL can ship, response time, and resource capacity. This criterion is very important when talking about supply chains, considering that response time and resource capacity can directly affect the possibility and the speed of delivery of goods. A scale (1–4) was used to evaluate this criterion (Table 2).
Table 2.
Assessment scale for flexibility dimensions.
Cooperation is an often used criterion when evaluating and selecting providers, considering that a higher degree of cooperation affects the better business of both, the provider and the company that outsources its services. In this paper, this criterion was evaluated through two dimensions: cooperation quality and the number of years working with a 4PL provider. When talking about cooperation quality, four types of cooperation were determined and observed in this paper, which are described below. Information sharing refers to the open sharing and exchange of strategic technical information. Flexibility refers to the willingness of each partner to conform to changes in the environment. Harmony reflects forbearance from opportunism by partners in a business relationship. Joint working refers to joint or mutual decision making and problem solving [51]. Redundancy was observed as the number of 3PL companies a certain 4PL is working with, while risk management as the number of standards that a certain 4PL has implemented. Given that there are a large number of papers that used various criteria, below is a description of the criteria that were used in this paper, as well as some of the references in which those criteria were used (Table 3).
Table 3.
Criteria description.
3. Methodology
As already mentioned, the aim of this paper is to propose an approach based on fuzzy FUCOM, evidence theory, and rule-based transformation and WASPAS methods for the evaluation and selection of resilient 4PL providers from the perspective of an e-commerce company. The Fuzzy FUCOM method was applied for determining criteria weights. That is, after determining the criteria that will be used in this paper, the criteria were presented to the experts in order to evaluate them. During the evaluation, it was easier for experts to use linguistic scales, and for that reason, this method was applied in a fuzzy environment. Given that there is a certain amount of uncertainty when evaluating 4PL providers, the combination of ET and RBT methods was used to construct the initial decision-making matrix. The advantage of applying ET is reflected in the fact that it considers belief functions instead of probability functions. Based on this, a decision maker can express a degree of belief, which can be either an individual answer or a set of possible answers, or even both. Additionally, the application of ET enables incomplete assessment, which is present especially when dealing with providers with whom cooperation is just beginning and some information is not available, which traditional MCDM methods do not allow. In order to obtain the crisp values needed to define the initial decision matrix, the RBT method was used. This technique was developed to transform various forms of assessment information into crisp values, like a normalization process in traditional MCDM. Finally, the WASPAS method was used since it is characterized by high reliability with the process parameter settings, without the need for additional evaluations by the decision makers. This method was used in this paper in order to determine the final rank of the alternatives. The implementation steps of the proposed methodology are presented in Figure 1.
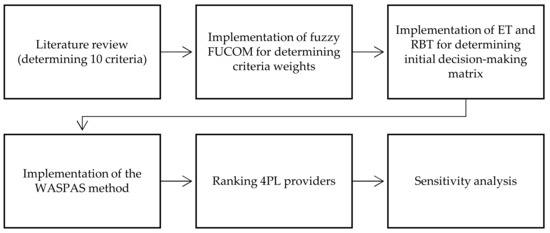
Figure 1.
Methodology.
3.1. Fuzzy FUCOM
In order to obtain criteria weights, a fuzzy FUCOM method was applied. The implementation of this method includes the following steps (adapted from [67]).
Step 1—Determine and rank the decision criteria. In accordance with the literature review, define the criteria that will be used for evaluation. After that, experts should determine the rank of criteria in accordance with the significance of the criteria. The first criterion is the most significant and, therefore, should have the highest weight coefficient. The last criterion should be the least significant. This can be written using Equation (1):
where k represents the rank of the observed criterion.
Cj(1) > Cj(2) > … > Cj(k)
Step 2—Comparison of the criteria. The comparison is made with respect to the most significant criterion using fuzzy linguistic expressions from a previously defined scale. After comparison, a fuzzy criterion significance ϖ Cj(k) is obtained. A fuzzy comparative significance can then be determined using Equation (2).
After that, a fuzzy vector of the comparative significance of the evaluation criteria is obtained by using Equation (3):
where φk/(k+1) represents the significance that the criterion of the Cj(k) rank has compared with the criterion of the Cj(k+1) rank.
Φ = (φ1/2, φ2/3, …, φk/(k+1))
Step 3—Calculate the optimal fuzzy weights. In this step, fuzzy weights of observed criteria are determined (w1, w2, …, wn)T. When determining criteria weights, two conditions need to be met, Equations (4) and (5).
Having all those previously mentioned in mind, a fuzzy linear model can be defined, with the objective of minimizing the deviation from the maximum consistency (χ), which was used in order to obtain the weights, Equations (6)–(12):
s.t.
where and .
Min χ
Step 4—Defuzzification in order to obtain crisp values. The final step includes defuzzification of the obtained values , Equation (13), in order to obtain crisp values, which will be later used in order to obtain a weighted decision matrix in the WASPAS method. For defuzzification, the graded mean integration representation (GMIR) method was used [68].
3.2. Evidence Theory and Rule-Based Transformation
3.2.1. Evidence Theory
Evidence theory, also known as the Dempster-Shafer theory, or D-S theory, represents a generalization of traditional probability theory. It considers belief functions instead of probability functions. That is, a decision maker can express a degree of belief in either an individual answer in the space or a set of possible answers or both [60]. When a decision maker gives a set of answers, it implies that there is no sufficient information to precisely give the single answer. It is important to note that after considering all pieces of evidence, the degrees of belief do not necessarily sum to 1 (can be less than that). In order to apply this theory to MCDM problems, Yang [69] propose a generalized decision matrix. When considering a problem with an M number of alternatives al (l = 1, …, M) and an L number of criteria ei (i = 1, …, L), each criterion is assessed using a set of evaluation grades Hn (n = 1, …, N) called a frame of discernment. Each grade Hn is considered to be an individual answer, while each criterion ei is considered to be a source of information. A set of N grades can be defined by:
where Hn+1 is preferred to Hn, which means that Hn and H1 are the best and the worst grades, respectively. After assessing an alternative al with respect to the criterion ei, a generalized belief structure S(ei(al)) is formed, Equation (15):
where represents a degree of belief when an alternative al is assessed with respect to the criterion ei, where and . When , then the assessment is considered complete; otherwise, it is incomplete. Additionally, a case of complete ignorance is possible if . On the other hand, represents the degree of global ignorance, which means that an alternative al can be assessed as any grade in the set H (when assessing with respect to the criterion ei) due to the lack of supporting evidence. Two conditions that are applied on that occasion are and .
When assessing certain alternatives with respect to a certain criterion, eight possible assessment forms can be defined, which were used in this paper (Table 4). As presented in the table, assessment forms differ whether it is the qualitative or quantitative criterion. When observing qualitative assessment, represents a belief structure, which is the assessment result of an alternative al for the criterion ei using a set of evaluation grades , which is not in the form of the general grades yet. A degree of belief in which an alternative al is assessed as grade when considering criterion ei is denoted as . On the other hand, when observing quantitative assessment, represents a belief structure that is the assessment result of an alternative al for the criterion ei in the form of numerical values or , and is the degree of belief that an alternative al is assessed to a value for the criterion ei.
Table 4.
Original forms of the assessment results [60].
3.2.2. Rule-Based Transformation
In order to transform various forms of assessment information into a unified format, Yang [69] introduced a rule-based information technique. This technique is similar to a normalization process in traditional MCDM. In order to transform the assessment, the decision maker must construct rules of equivalence based on his or her knowledge and experience. The procedure for transformation differs depending on the criterion type, that is, whether it is qualitative or quantitative. The explanation of the rule-based transformation technique is given below for both qualitative and quantitative assessment [60].
Rule-Based Transformation Technique for Qualitative Assessment
Each qualitative criterion ei is assessed using its own set of grades . After that, the original assessment of an alternative al for criterion ei, or , can be defined using Equation (16):
where . After that, each grade can be transformed into any grade in the general set H, where based on their equivalence, which is determined by the form of rules. If both sets have an equal number of grades (Ni = N), and each grade is equal to a grade Hn in H, then can be easily transformed into a generalized belief structure using Equation (17).
In some cases, sets do not have the same number of grades (Ni ≠ N) and a grade does not exactly mean a single grade Hn in H, but a number of grades in H. In that case, only for qualitative assessment, the generalized belief structure from Equation (17) can be transformed into Equation (18).
Therefore, let in Hi be equivalent to grade Hk in H to a degree , where 0 ≤ ≤ 1 and . Then, the equivalence rules can be defined, using the symbol to represent the equivalence, using Equation (19).
After all the rules for equivalence are determined, the original assessment can be transformed into the generalized belief structure , and can be calculated using Equation (20).
Rule-Based Transformation Technique for Quantitative Assessment
In order to transform numerical (quantitative) values into the generalized belief structure in the form of a general set of grades H = {Hn, n = 1, …, N}, let be the numerical value equivalent to the general grade Hn, as shown in Equation (21).
Now, assume that the value represents the value after the assessment of an alternative al with respect to the criterion ei with a belief degree of , then the original assessment can be defined using Equation (22):
where and . During the assessment, two cases may arise. The first is when there is only one , and in that case, is equal to 1. In the second case, the value of can be between the values of and . In this case, Equations (23)–(25) are used.
Additionally, when the assessment is uncertain, or when the number of is equal to J, and each holds a belief degree equal to , then can be calculated using Equation (26).
In the end, based on previous equations, a generalized belief structure can be obtained by applying Equation (27).
After applying rule-based transformation techniques, the original assessment shown in Table 4 can be transformed into the generalized belief structure shown in Table 5. It should be noted that represents the degree of global ignorance that exists when an alternative al could be assessed to any grades in the set H, which is a consequence of either unavailable or incomplete information.
Table 5.
Generalized belief structures after rule-based transformation [60].
Finally, after constructing a generalized belief structure and after transformation, the generalized decision matrix can be constructed. For this purpose, Yang [69] suggest a comparison of alternatives based on their utility (u(Hn)), which is a function between 0 and 1, where u(Hn+1) > u(Hn). After determining the utility of all grades, the expected utility of an alternative al for the criterion ei can be defined using Equation (28).
If we have a case where the assessment is not complete, then the maximum and minimum utility can be set by assuming that is equal to either the best grade (HN) or the worst (H1). Based on this, the maximum and minimum utility of each alternative can be determined using Equations (29) and (30).
It is important to notice that if all assessments are complete or , then the maximum and minimum utility are equal. In order to obtain a single value that will then be used for constructing the initial decision matrix used in the WASPAS method, the average value of each alternative’s maximum and minimum utility was calculated using Equation (31).
3.3. WASPAS Method
The implementation of the WASPAS method includes the following steps [70].
Step 1—Defining initial decision matrix X. In this paper, an initial decision matrix was obtained by implementing previously described methods.
Step 2—Normalization of the decision matrix. Depending on the type of criteria, it is necessary to normalize the matrix using Equation (32) for beneficial criteria and Equation (33) for nonbeneficial criteria:
where represents the normalized value of the ith alternative with respect to the jth criterion.
Step 3—Determining the total relative importance based on WSM. The total relative importance is determined for every alternative by applying Equation (34).
Step 4—Determining the total relative importance based on WPM. The total relative importance is determined for every alternative by applying Equation (35).
Step 5—Determining the total relative importance (Qi) of an alternative. In order to determine Qi, the decision maker must define the value of λ, which can be between 0 and 1. In the end, alternatives are ranked according to the value of Q, where the best alternative has the highest value, Equation (36).
4. Results
The proposed methodology was tested and applied to the example of a global online retailer, which sells and delivers products to the market of the Western Balkans and Southeastern Europe, which originate from China and the countries of the Far East. This company uses the services of several different logistics providers from the global and local markets. For a long time, the company has been working on a project related to the engagement of a 4PL provider, who would, through the process of logistics outsourcing, take over complete activities related to planning, designing, and managing the supply chain and delivery of products to end consumers, with full logistics service. For these reasons, the company is interested in this research and the application of the proposed methodology. The evaluation included five alternatives (A1–A5), that is, five global 4PL providers, whose services are used in other markets and are the most serious candidates for engagement in these supply chains as well. In the following sections, the procedure and results of the conducted evaluation are presented.
4.1. Determining Criteria Weights Using Fuzzy FUCOM
Given that the fuzzy FUCOM method was applied in a fuzzy environment, it is necessary to define the fuzzy linguistic scale and the triangular fuzzy membership functions that were used in this paper (Table 6).
Table 6.
Fuzzy linguistic scale [67].
After defining the linguistic terms, experts were hired to evaluate the criteria. That is, in the first step of the application, the order of the criteria (from the most significant to the least significant) was defined, which is shown in Table 7. Based on that, five experts with more than 15 years of experience in logistics and more than 5 years in e-commerce performed an evaluation using linguistic terms. The average values of the experts’ evaluations are shown in Table 7, which were then transformed into TFN using the scale defined in Table 6.
Table 7.
Linguistic evaluations of criteria.
By applying Equation (2), the comparative significance of the criteria is defined and shown below.
Based on the values presented above, the vector of comparative significance was defined Ф = ((1,1,1), (1,1,1), (0.67,1,1.5), (0.45,1,2.24), (0.45,1,2.24), (1,2,3.73), (1,1.5,2.33), (1,1.33,1.8), (0.78,1,1.29)). In order to define the fuzzy FUCOM model, Equation (5) was applied next in order to obtain the second set of constraints.
After calculating both sets of constraints, a model was defined as shown below, which was solved using the LINGO software.
s.t.
Min χ
Solving the presented model, the optimum local values of the weight coefficients with a deviation from the maximum consistency were obtained:
Since these are fuzzy weights and in order to proceed with other methods, a crisp value is needed, and the GMIR method (Equation (13)) was used. After implementing this equation, a final crisp value of criteria weights was obtained, which were then used in the WASPAS method.
4.2. Determining Initial Decision-Making Matrix Using ET and RBT
The next step in the proposed methodology was to determine the initial decision-making matrix, which is necessary for the WASPAS method. In order to obtain this matrix, ET and RBT were applied. Based on the defined criteria that were used in this paper, an interview with five experts in the field of e-commerce was conducted in order to define the assessment scales for each criterion and to define equivalence rules. Based on the information obtained from them, assessment scales were defined (Table 8). As already mentioned, some of the criteria were evaluated based on several subcriteria. In order to set the final rules, all possible combinations of subcriteria that occur the most were defined.
Table 8.
Criteria assessment scales.
Since the next step was to define equivalence rules for each criterion, a set of general grades was defined: . Based on the information obtained from the interview, the equivalence rules, for both quantitative and quantitative criteria, were defined (Table 9).
Table 9.
Equivalence rules for each criterion.
Original assessment results for every alternative (Table 10) were constructed in accordance with the values presented in Table 8.
Table 10.
Original assessment results.
Table 11 represents the transformed assessment results that were obtained based on the rule-based transformation (values presented in Table 10). For an example, service price (qualitative criterion) for alternative 1 was calculated using Equation (20) as follows:
Table 11.
Transformed assessment results.
On the other hand, for quantitative criteria (for example, risk management), the value for alternative 2 was obtained by applying Equations (23)–(26), as shown below:
The final step in order to obtain the initial decision-making matrix that is used in the WASPAS method was to convert the generalized belief structures into utility intervals using Equations (29) and (30). In order to convert values, the utility of each of the general grades was estimated as a linear function as follows [60]: u(Very poor) = 0, u(Poor) = 0.25, u(Fair) = 0.5, u(Good) = 0.75, and u(Excellent) = 1. Examples of the calculation are presented below for A1’s service price (Table 12). The procedure is the same for all other alternatives and criteria except for A4’s service quality (based on the values presented in Table 10, it can be seen that the sum is not equal to 1 as all other values, but is equal to 0.9). This is a so-called incomplete assessment, and the reason for this is reflected in the fact that this 4PL had one shipment less than others. For this reason, it was not possible to have a complete assessment.
Table 12.
Utility intervals.
4.3. Final Ranking of the Alternatives Using WASPAS
In order to obtain the initial decision-making matrix, Equation (31) was applied to the values presented in Table 12. In this way, the average utility value of every alternative was taken into account (Table 13). Given that the next step when applying this method is normalization, the type of each criterion (whether it is min or max) was determined. After that, weights were assigned to each criterion, which were obtained by applying the fuzzy FUCOM method.
Table 13.
Initial decision-making matrix.
After implementing Equations (32) and (33), a normalized decision-making matrix was obtained (Table 14).
Table 14.
Normalized decision-making matrix.
In order to determine the total relative importance based on WSM and the total relative importance based on WPM, Equations (34) and (35) were applied (Table 15). These values were then used in Equation (36) to obtain a final ranking of alternatives (Table 16). The value of the λ coefficient, which is used in the WASPAS method to rank the alternatives, in this paper was taken as λ = 0.5. Since this coefficient can take a value between 0 and 1, in the next section of this paper, a sensitivity analysis was performed to see whether the final rank of alternatives will change.
Table 15.
Determining the total relative importance based on WSM and WPM.
Table 16.
Final ranking of the alternatives for λ = 0.5.
Based on the implementation of the proposed methodology in this paper, it can be concluded, based on the results presented in Table 16, that alternative (4PL) 3 has the highest value, followed by alternatives 2 and 1, while alternatives 5 and 4 have the lowest values. The final ranking of the alternatives can be presented as follows: A3 > A2 > A1 > A5 > A4. The obtained results and proposed methodology close the gap established in the introduction of this paper.
5. Sensitivity Analysis and Discussion
5.1. Sensitivity Analysis
In order to see whether the change in the value of λ will affect the final ranking of the 4PL providers, a sensitivity analysis was performed. On that occasion, all possible values of this coefficient were taken into account, that is, from 0 to 1. The results of the sensitivity analysis are shown in Table 17. As can be seen, the rank of alternatives is as follows for all λ values up to 0.3: A3 > A2 > A5 > A1 > A4. One specific case occurs when the λ value is 0.4, considering that in that case, the two alternatives (A1 and A5) have the same values and therefore share the same place. For λ values from 0.5 to 0.9, the ranking does not change and looks like this: A3 > A2 > A1 > A5 > A4. In the last case, that is, when λ has a value of 1, the order is almost the same as in the previous case, with the only difference being that alternatives 4 and 5 have switched places. Based on the obtained results, it can be said that the obtained solution is quite stable, especially if alternatives A2, A3, and A4 are considered. Changing the value of the coefficient affects only alternatives A1 and A5, where there are differences in ranking depending on the value of λ.
Table 17.
Sensitivity analysis.
5.2. Managerial Implications and Discussion
The results from the previous section show a great possibility of applying the proposed methodology to various problems. In this paper, a hybrid approach was applied for the evaluation of 4PL providers for an e-commerce company. The applied model can help the decision maker (managers) when hiring a suitable 4PL provider, as a decision support tool. In addition, it can help managers to better understand the possibilities of improving the delivery of products ordered online through the engagement of resilient 4PL providers. In this way, it is possible to increase the reliability and quality of delivery, which will result in a higher degree of customer satisfaction, bearing in mind that timely and quality delivery is one of the most important factors of competitiveness in e-commerce. Besides improving delivery, the proposed methodology can be used to understand the connections between e-commerce, resilience, and logistics service providers. Based on this, companies can more easily overcome the problems of uncertainty during delivery by hiring resilient 4PL providers. Finally, the proposed methodology can help to better understand the mutual relations between the criteria and the importance of certain criteria that influence the evaluation and selection process.
Since the proposed methodology is novel and in a hybrid form, it was hard to compare the results with other researches. Due to the fact that there are no papers dealing with the evaluation of resilient 4PL providers for e-commerce, the results were compared with papers dealing with similar problems. The obtained results were compared with the results in [44], and it was determined that in both papers, the IT criteria were determined as the most important. A similar situation was determined when comparing obtained results with [41]. Unlike [49], in this paper, redundancy was taken into account as the criterion since the authors believed that it is important when evaluating resilience.
Given that there is a lot of uncertainty in logistics and in various processes and activities, the advantage of the described methodology is reflected in the possibility of applying it in exactly these situations. That is, evidence theory makes it possible to perform an assessment even when not all information is known. On that occasion, an incomplete assessment appears. Other, traditional MCDM methods do not support this way of evaluation, and for this reason, the application of ET stands out as an advantage. In addition, the decision maker can take a closer look at each criterion and determine how the evaluation will be carried out by setting rules in order to perform the rule-based transformation. The goal of applying the methodology in this paper was to evaluate 4PL providers; however, the described methodology can be applied to various logistics problems and in different subsystems, such as, when choosing a 4PL provider, 3PL provider, supplier, and distribution channels. In those situations, it is only necessary to adjust the criteria and the rules.
6. Conclusions
Based on everything previously mentioned, it can be concluded how important the choice of an adequate 4PL provider is. Many companies do not have enough capacity to meet the demands of customers, especially when it comes to e-commerce. For this reason, these companies choose to outsource these services. That is, hiring a 4PL provider in the process of planning and organization of product delivery in global e-commerce provides a number of advantages and opportunities to improve the delivery service. In times of pronounced risks and disruptions in global supply chains, it is of particular importance that the engaged provider is resilient and can successfully respond to all challenges and obstacles. The decision to hire a 4PL provider in an uncertain and unpredictable environment is not easy to make, and it is necessary to use scientific approaches and methods that adequately treat very complex issues in global supply chains. For this reason, when evaluating and selecting a 4PL provider, in addition to the standard criteria that need to be considered, such as price, service quality, and implementation time. it is necessary to take into account the criteria related to resilience as well. Having the aforementioned in mind, the following criteria were taken into account in this paper: service price, service time, service quality, IT capabilities, supply chain design, safety stock inventory, flexibility, cooperation, redundancy, and risk management. The resilience of a 4PL provider and the entire supply chain enables uninterrupted delivery even in some unforeseen circumstances that may affect the supply chain. For this reason, the resilience criteria were also observed in order to define an approach for the evaluation of a resilient 4PL provider based on the application of the fuzzy FUCOM, evidence theory, rule-based transformation, and WASPAS methods.
The hybrid approach and methods applied in this paper allow a successful evaluation of 4PL providers in e-commerce. In order to confirm the stability of the obtained result, a sensitivity analysis was carried out, which showed that the obtained solution is quite stable; that is, there are no major changes in the final ranking. Based on the results obtained by applying the described methodology, it can be concluded that the proposed approach represents a significant decision-support tool for solving the problem and that it is applicable to real problems. The contribution of this paper is reflected in the fact that its aim was to close the existing gap in the literature by proposing a hybrid approach for the evaluation of resilient 4PL providers for e-commerce. The developed model is open for upgrades and can be easily applied to different decision-making problems by only changing the criteria and alternatives. The limitation of the paper is reflected in the fact that it does not consider other methods for determining the criteria weights or methods for the final ranking of the alternatives. The main reason for the aforementioned limitation is the complexity of the proposed methodology. The application of the described methodology to other problems in logistics, especially to those where uncertainty is present, stands out as one of the directions of future research. Additionally, the application of other MCDM methods in combination with ET and RBT is also highlighted as another direction of future research in order to see whether there will be a significant change in the results. Finally, the definition of the methodology for the evaluation and selection of distribution channels in e-commerce stands out as the third direction of future research.
Author Contributions
Conceptualization, V.P., M.K. and M.A.; methodology, V.P. and M.A.; software, V.P.; validation, V.P., M.K. and M.A.; formal analysis, V.P. and M.A.; writing—original draft preparation, V.P., M.K. and M.A.; writing—review and editing, V.P. and M.A. All authors have read and agreed to the published version of the manuscript.
Funding
This research received no external funding.
Data Availability Statement
Not applicable.
Acknowledgments
This paper was supported by the Ministry of Education, Science, and Technological Development of the Republic of Serbia through the project TR 36006.
Conflicts of Interest
The authors declare no conflict of interest.
References
- Keenan, M. Global Ecommerce Explained: Stats and Trends to Watch in 2022. 2022. Available online: https://www.shopify.com/enterprise/global-ecommerce-statistics (accessed on 10 December 2022).
- Gurãu, C.; Ranchhod, A.; Hackney, R. Internet transactions and physical logistics: Conflict or complementarity? Logist. Inf. Manag. 2001, 14, 33–43. [Google Scholar] [CrossRef]
- Delfmann, W.; Albers, S.; Gehring, M. The impact of electronic commerce on logistics service providers. Int. J. Phys. Distrib. Logist. Manag. 2002, 32, 203–222. [Google Scholar] [CrossRef]
- Bhattacharjya, J.; Ellison, A.; Tripathi, S. An exploration of logistics-related customer service provision on Twitter: The case of e-retailers. Int. J. Phys. Distrib. Logist. Manag. 2016, 46, 659–680. [Google Scholar] [CrossRef]
- Zennaro, I.; Finco, S.; Calzavara, M.; Persona, A. Implementing E-Commerce from Logistic Perspective: Literature Review and Methodological Framework. Sustainability 2022, 14, 911. [Google Scholar] [CrossRef]
- Govindarajan, A.; Sinha, A.; Uichanco, J. Joint inventory and fulfillment decisions for omnichannel retail networks. Nav. Res. Logist. 2021, 68, 779–794. [Google Scholar] [CrossRef]
- Baglio, M.; Perotti, S.; Dallari, F.; Garagiola, E.R. Benchmarking logistics facilities: A rating model to assess building quality and functionality. Benchmarking Int. J. 2019, 27, 1239–1260. [Google Scholar] [CrossRef]
- Stock, J.R.; Mulki, J.P. Product Returns Processing: An Examination of Practices of Manufacturers, Wholesalers/Distributors, and Retailers. J. Bus. Logist. 2009, 30, 33–62. [Google Scholar] [CrossRef]
- Melacini, M.; Perotti, S.; Rasini, M.; Tappia, E. E-fulfilment and distribution in omni-channel retailing: A systematic literature review. Int. J. Phys. Distrib. Logist. Manag. 2018, 48, 391–414. [Google Scholar] [CrossRef]
- De Koster, R.; Johnson, A.L.; Roy, D. Warehouse design and management. Int. J. Prod. Res. 2017, 55, 6327–6330. [Google Scholar] [CrossRef]
- White, G.R.T.; Afolayan, A.; Plant, E. Challenges to the Adoption of E-commerce Technology for Supply Chain Management in a Developing Economy: A Focus on Nigerian SMEs. In E-Commerce Platform Acceptance; Lacka, E., Chan, H., Yip, N., Eds.; Springer: Cham, Switzerland, 2014; pp. 23–39. [Google Scholar]
- Kilibarda, M.; Andrejić, M.; Popović, V. Research in logistics service quality: A systematic literature review. Transport 2020, 35, 224–235. [Google Scholar]
- Vasić, N.; Kilibarda, M.; Andrejić, M.; Jović, S. Satisfaction is a function of users of logistics services in e-commerce. Technol. Anal. Strateg. Manag. 2020, 33, 813–828. [Google Scholar] [CrossRef]
- Abdirad, M.; Krishnan, K. Examining the impact of E-supply chain on service quality and customer satisfaction: A case study. Int. J. Qual. Serv. Sci. 2022, 14, 274–290. [Google Scholar] [CrossRef]
- Ngah, A.H.; Anuar, M.M.; Rozar, N.N.; Ariza-Montes, A.; Araya-Castillo, L.; Kim, J.J.; Han, H. Online Sellers’ Reuse Behaviour for Third-Party Logistics Services: An Innovative Model Development and E-Commerce. Sustainability 2021, 13, 7679. [Google Scholar] [CrossRef]
- Cano, J.A.; Londoño-Pineda, A.; Rodas, C. Sustainable Logistics for E-Commerce: A Literature Review and Bibliometric Analysis. Sustainability 2022, 14, 12247. [Google Scholar] [CrossRef]
- Blackhurst, J.; Dunn, K.S.; Craighead, C.W. An Empirically Derived Framework of Global Supply Resiliency. J. Bus. Logist. 2011, 32, 374–391. [Google Scholar] [CrossRef]
- Ralston, P.; Blackhurst, J. Industry 4.0 and resilience in the supply chain: A driver of capability enhancement or capability loss? Int. J. Prod. Res. 2020, 58, 5006–5019. [Google Scholar] [CrossRef]
- Park, Y.W.; Blackhurst, J.; Paul, C.; Scheibe, K.P. An analysis of the ripple effect for disruptions occurring in circular flows of a supply chain network. Int. J. Prod. Res. 2022, 60, 4693–4711. [Google Scholar] [CrossRef]
- Sheffi, Y.; Rice, J.B., Jr. A Supply Chain View of the Resilient Enterprise. MIT Sloan Manag. Rev. 2005, 47, 41–48. [Google Scholar]
- Hohenstein, N.O.; Feisel, E.; Hartmann, E.; Giunipero, L. Research on the phenomenon of supply chain resilience: A systematic review and paths for further investigation. Int. J. Phys. Distrib. Logist. Manag. 2015, 45, 90–117. [Google Scholar] [CrossRef]
- Zhao, K.; Zuo, Z.; Blackhurst, J. Modelling supply chain adaptation for disruptions: An empirically grounded complex adaptive systems approach. J. Oper. Manag. 2019, 65, 190–212. [Google Scholar] [CrossRef]
- Dolgui, A.; Ivanov, D.; Sokolov, B. Ripple effect in the supply chain: An analysis and recent literature. Int. J. Prod. Res. 2018, 56, 414–430. [Google Scholar] [CrossRef]
- Pourhejazy, P.; Kwon, O.K.; Chang, Y.-T.; Park, H. Evaluating Resiliency of Supply Chain Network: A Data Envelopment Analysis Approach. Sustainability 2017, 9, 255. [Google Scholar] [CrossRef]
- Um, J.; Han, N. Understanding the relationships between global supply chain risk and supply chain resilience: The role of mitigating strategies. Supply Chain. Manag. Int. J. 2020, 26, 240–255. [Google Scholar] [CrossRef]
- Zhang, G.; Wang, X.; Wang, Y.; Kang, J. Research on the Resilient Evolutionary Game of Logistics Service Supply Chain with Government Participation. Mathematics 2022, 10, 630. [Google Scholar] [CrossRef]
- Delic, M.; Eyers, D.R. The effect of additive manufacturing adoption on supply chain flexibility and performance: An empirical analysis from the automotive industry. Int. J. Prod. Econ. 2020, 228, 107689. [Google Scholar] [CrossRef]
- Taleizadeh, A.A.; Ghavamifar, A.; Khosrojerdi, A. Resilient network design of two supply chains under price competition: Game theoretic and decomposition algorithm approach. Oper. Res. 2020, 4, 1–33. [Google Scholar] [CrossRef]
- Diehlmann, F.; Lüttenberg, M.; Verdonck, L.; Wiens, M.; Zienau, A.; Schultmann, F. Public-private collaborations in emergency logistics: A framework based on logistical and game-theoretical concepts. Saf. Sci. 2021, 141, 105301. [Google Scholar] [CrossRef]
- Wieland, A.; Durach, C.F. Two perspectives on supply chain resilience. J. Bus. Logist. 2021, 42, 315–322. [Google Scholar] [CrossRef]
- Novak, D.C.; Wu, Z.; Dooley, K.J. Whose resilience matters? Addressing issues of scale in supply chain resilience. J. Bus. Logist. 2021, 42, 323–335. [Google Scholar] [CrossRef]
- Panayides, P.M.; So, M. Logistics service provider–client relationships. Transp. Res. E Logist. Transp. Rev. 2005, 41, 179–200. [Google Scholar] [CrossRef]
- Wilson, G. How COVID-19 Has Transformed the Logistics and 3PL Industry. Supply Chain, 2020. Available online: www.supplychaindigital.com/logistics/how-covid-19-has-transformedlogistics-and-3pl-industry (accessed on 8 December 2022).
- Chen, C.C.; Feng, C.M.; Tsai, Y.H.; Wu, P.J. Modeling Resilience Enhancement Strategies for International Express Logistics. Transp. Res. Rec. 2013, 2378, 92–98. [Google Scholar] [CrossRef]
- Shoja, A.; Molla-Alizadeh-Zavardehi, S.; Niroomand, S. Adaptive meta-heuristic algorithms for flexible supply chain network design problem with different delivery modes. Comput. Ind. Eng. 2019, 138, 106107. [Google Scholar] [CrossRef]
- Carvalho, H.; Machado, V.H.; Barroso, A.; Azevedo, S.G.; Cruz-Machado, V. Resilience of Logistics Service Providers Facing a Port Strike: A Case Study. In Proceedings of the International Conference on Industrial Engineering and Operations Management, Bandung, Indonesia, 6–8 March 2018. [Google Scholar]
- Iyengar, D.; Nilakantan, R.; Rao, S. On Entrepreneurial Resilience among Micro-entrepreneurs in the Face of Economic Disruptions…A Little Help from Friends. J. Bus. Logist. 2021, 42, 360–380. [Google Scholar] [CrossRef]
- Herold, D.M.; Nowicka, K.; Pluta-Zaremba, A.; Kummer, S. COVID-19 and the pursuit of supply chain resilience: Reactions and “lessons learned” from logistics service providers (LSPs). Supply Chain. Manag. 2021, 26, 702–714. [Google Scholar] [CrossRef]
- König, A.; Spinler, S. The effect of logistics outsourcing on the supply chain vulnerability of shippers: Development of a conceptual risk management framework. Int. J. Logist. Manag. 2016, 27, 122–141. [Google Scholar] [CrossRef]
- Liu, C.L.; Lee, M.Y. Integration, supply chain resilience, and service performance in third-party logistics providers. Int. J. Logist. Manag. 2018, 29, 5–21. [Google Scholar] [CrossRef]
- Aydin, S.; Yorukoglu, M.; Kabak, M. Fourth party logistics firm assessment using a novel neutrosophic MCDM. J. Intell. Fuzzy Syst. 2022, 42, 529–539. [Google Scholar] [CrossRef]
- Bhatti, R.S.; Kumar, P.; Kumar, D. A loss function based decision support model for 3PL selection by 4PLs. Int. J. Integr. Supply Manag. 2010, 5, 365–375. [Google Scholar] [CrossRef]
- Caglar, B.; Aydin, K. The role of 4PL provider as a mediation and supply chain agility. Mod. Supply Chain Res. Appl. 2020, 2, 99–111. [Google Scholar] [CrossRef]
- Buyukozkan, G.; Feyzioglu, O.; Ersoy, M.S. Evaluation of 4PL operating models: A decision-making approach based on 2-additive Choquet integral. Int. J. Prod. Econ. 2009, 121, 112–120. [Google Scholar] [CrossRef]
- Yang, S.; Yanqing, W.; Songtao, Z. The study of logistics partner selection under the 4PL model. In Proceedings of the International Conference on Logistics Systems and Intelligent Management (ICLSIM), Harbin, China, 9–10 January 2010; pp. 954–959. [Google Scholar]
- Zhang, Y.; Gao, Z.; Huang, M.; Jiang, S.; Yin, M.; Fang, S.C. Multi-period distribution network design with boundedly rational customers for the service-oriented manufacturing supply chain: A 4PL perspective. Int. J. Prod. Res. 2022, 60, 1–20. [Google Scholar] [CrossRef]
- Huang, M.; Li, R.; Wang, X. Network construction for fourth-party logistics based on resilience with using Particle Swarm Optimization. In Proceedings of the Chinese Control and Decision Conference (CCDC), Kunming, China, 22–24 May 2011; pp. 3924–3929. [Google Scholar]
- Li, R.; Huang, M.; Wang, X. Model and algorithm for multi-period resilient integrated forward/reverse network design of fourth-party logistics. Syst. Eng. Theory Pract. 2015, 35, 892–903. [Google Scholar]
- Yazdi, A.K.; Mehdiabadi, A.; Wanke, P.F.; Monajemzadeh, N.; Correa, H.L.; Tan, Y. Developing supply chain resilience: A robust multi-criteria decision analysis method for transportation service provider selection under uncertainty. Int. J. Manag. Sci. Eng. Manag. 2022, 17, 1–14. [Google Scholar] [CrossRef]
- Naseem, M.H.; Yang, J.; Xiang, Z. Selection of Logistics Service Provider for the E-Commerce Companies in Pakistan Based on Integrated GRA-TOPSIS Approach. Axioms 2021, 10, 208. [Google Scholar] [CrossRef]
- Wilson, E.J.; Nielson, C.C. Cooperation and Continuity in Strategic Business Relationships. J. Bus.-to-Bus. Mark. 2001, 8, 1–24. [Google Scholar] [CrossRef]
- Nuengphasuk, M.; Samanchuen, T. Selection of logistics service provider for e-commerce using AHP and TOPSIS: A case study of SMEs in Thailand. In Proceedings of the 2019 4th Technology Innovation Management and Engineering Science International Conference (TIMES-iCON), Bangkok, Thailand, 11–13 December 2019; pp. 1–5. [Google Scholar]
- Adalı, E.; Isık, A. Integration of DEMATEL, ANP and DEA methods for third party logistics providers’ selection. Manag. Sci. Lett. 2016, 6, 325–340. [Google Scholar] [CrossRef]
- Memari, A.; Dargi, A.; Jokar, M.R.A.; Ahmad, R.; Rahim, A.R. Sustainable supplier selection: A multi-criteria intuitionistic fuzzy TOPSIS method. J. Manuf. Syst. 2019, 50, 9–24. [Google Scholar] [CrossRef]
- Aggarwal, R. Third-party logistics service providers selection using AHP-DEAHP approach. Int. J. Integr. Supply Manag. 2019, 12, 259–284. [Google Scholar] [CrossRef]
- Wang, C.N.; Dang, T.T.; Nguyen, N.-A. Outsourcing reverse logistics for e-commerce retailers: A two-stage fuzzy optimization approach. Axioms 2021, 10, 34. [Google Scholar] [CrossRef]
- Datta, S.; Samantra, C.; Mahapatra, S.S.; Mandal, G.; Majumdar, G. Appraisement and selection of third party logistics service providers in fuzzy environment. Benchmarking Int. J. 2013, 20, 537–548. [Google Scholar] [CrossRef]
- Sałabun, W.; Urbaniak, K. A new coefficient of rankings similarity in decision-making problems. In Proceedings of the International Conference on Computational Science, Amsterdam, The Netherlands, 3–5 June 2020; Springer: Cham, Switzerland, 2020; pp. 632–645. [Google Scholar]
- Sureeyatanapas, P.; Waleekhajornlert, N.; Arunyanart, S.; Niyamosoth, T. Resilient Supplier Selection in Electronic Components Procurement: An Integration of Evidence Theory and Rule-Based Transformation into TOPSIS to Tackle Uncertain and Incomplete Information. Symmetry 2020, 12, 1109. [Google Scholar] [CrossRef]
- Singh, C.S.; Soni, G.; Badhotiya, G.K. Performance indicators for supply chain resilience: Review and conceptual framework. J. Ind. Eng. Int. 2019, 15, 105–117. [Google Scholar] [CrossRef]
- Karl, A.A.; Micheluzzi, J.; Leite, L.R.; Pereira, C.R. Supply chain resilience and key performance indicators: A systematic literature review. Production 2018, 28, 1–27. [Google Scholar] [CrossRef]
- Hosseini, S.; Khaled, A.A. A hybrid ensemble and AHP approach for resilient supplier selection. J. Intell. Manuf. 2019, 30, 207–228. [Google Scholar] [CrossRef]
- Hasan, M.M.; Jiang, D.; Ullah, A.M.M.S.; Noor-E-Alam, M. Resilient supplier selection in logistics 4.0 with heterogeneous information. Expert Syst. Appl. 2020, 139, 112799. [Google Scholar] [CrossRef]
- Pramanik, D.; Haldar, A.; Mondal, S.C.; Naskar, S.K.; Ray, A. Resilient supplier selection using AHPTOPSIS-QFD under a fuzzy environment. Int. J. Manag. Sci. Eng. Manag. 2017, 12, 45–54. [Google Scholar]
- Mohammed, A.; Yazdani, M.; Oukil, A.; Santibanez Gonzalez, E.D.R. A Hybrid MCDM Approach towards Resilient Sourcing. Sustainability 2021, 13, 2695. [Google Scholar] [CrossRef]
- Kamalahmadi, M.; Parast, M.M. A review of the literature on the principles of enterprise and supply chain resilience: Major findings and directions for future research. Int. J. Prod. Econ. 2016, 171, 116–133. [Google Scholar] [CrossRef]
- Pamucar, D.; Ecer, F. Prioritizing the Weights of The Evaluation Criteria under Fuzziness: The Fuzzy Full Consistency Method-Fucom-F. Facta Univ. Ser. Mech. Eng. 2020, 18, 419–437. [Google Scholar] [CrossRef]
- Tiwari, A.; Vats, A.K. Analyzing the Concept of Graded K-Preference Integration Representation Method. Turk. J. Comp. Math. Ed. 2021, 12, 866–869. [Google Scholar]
- Yang, J.B. Rule and utility based evidential reasoning approach for multiple attribute decision analysis under uncertainty. Eur. J. Oper. Res. 2001, 131, 31–61. [Google Scholar] [CrossRef]
- Tus, A.; Adali, E.A. The new combination with CRITIC and WASPAS methods for the time and attendance software selection problem. Opsearch 2019, 56, 528–538. [Google Scholar] [CrossRef]

Disclaimer/Publisher’s Note: The statements, opinions and data contained in all publications are solely those of the individual author(s) and contributor(s) and not of MDPI and/or the editor(s). MDPI and/or the editor(s) disclaim responsibility for any injury to people or property resulting from any ideas, methods, instructions or products referred to in the content. |
© 2023 by the authors. Licensee MDPI, Basel, Switzerland. This article is an open access article distributed under the terms and conditions of the Creative Commons Attribution (CC BY) license (https://creativecommons.org/licenses/by/4.0/).