1. Introduction
In a functional context, certain gene interactions can give rise to the development of complex diseases with a non-independent associated probability, expressed as:
From an epistatic perspective, this non-independence stems from symbiotic gene interactions [
1]. Such symbiosis can be attributed, for instance, to the effects of mutations on encoded proteins. In the realm of complex diseases, it is well-established how proteins exhibit low susceptibility to modifications and how single nucleotide polymorphisms (SNPs) can exert influence on transcription. The interplay between SNPs of multiple genes and cis/trans correlation rates is also well-documented across the genome [
2].
With a thorough analysis of this information, we are capable of identifying the epistatic SNPs linked to variations in gene expression within a specific context. This intricate scenario is composed of a group of SNPs in an up-regulated state and a second group displaying down-regulation of their expressed genes. The fundamental question we aim to address is whether the biological function of a module that models a complex disease is solely determined by a top-down genetic mechanism that governs the module’s function.
The landscape shaped by the abstraction of genotype-phenotype modeling of complex diseases into functional biological modules [
3,
4,
5,
6] necessitates a top-down approach. Therefore, an additional functional correlation must exist between genes to enable a module to effectively fulfill its role within the cell. In other words, the expression rate of a module should not be solely determined by the actions of SNPs. Instead, SNPs should serve as regulators of the permissibility of the module’s state. This aligns well with the existing literature that underscores the role of epigenetic landmarks [
7,
8,
9,
10]. In this context, it becomes evident that the state of a module modeling a disease cannot be simplified to a straightforward relationship between the expression rate of a gene and its genotype.
In this work, we posit that two genes belonging to the same module that models a complex disease are influenced by an additional driving force that is stronger than what one would expect by chance.
Bell’s Inequalities (BIs) [
11] provide a potent method to address the hypothesis of an extra-correlation, meaning that the global state influences other local states, between any pair of entities [
12,
13] involved in a higher functional system.
In a Bell test, two elementary radiation particles are emitted in opposite directions randomly. If we wish to measure how many times these particles cross an axis x based on their source, we would calculate a sharp correlation between measurements. This correlation can transition from a more deterministic state to a noisier one as we progressively introduce an angle between the measurements. Consequently, the results of a Bell test are confined in a deterministic and quantifiable manner.
This method has already been successfully employed to demonstrate the non-separability of two measurements at any scale [
13]. Furthermore, these measurements can also be generalized to
N items and
M complex relationships between measurement settings. Therefore, we present a non-linear model of pairwise gene interactions where the Bell test is violated. In this model, the measurements are defined by SNPs, and the expression rate corresponds to the essence of SNP interactions [
14,
15,
16,
17]. As a result, we contend that this model setting furnishes, at the very least, a modest proof demonstrating the existence of a connection between genes beyond what is determined by the genotype in the modeling of complex diseases.
In this introductory section, we have set the stage by presenting the overarching goal of our research: unraveling the complex interplay between genetic variations and disease activation within functional biological modules. To provide a roadmap for the reader, we offer a concise preview of the content covered in the subsequent sections.
The data preprocessing and denoising section delves into the crucial steps of data preprocessing and denoising. We employ advanced techniques, including [specific algorithmic technique], to enhance the quality of our genomic data. The integration of this methodology ensures that our subsequent analyses are based on accurate and reliable information. Building on the preprocessed data, we introduce a novel approach to stratify samples based on functional modules. The exploration of genotype features leads to the identification of disease-relevant communities within specific modules. Inspired by Bell’s Inequalities, this section introduces a non-linear model to assess extra correlations in genetic interactions. We apply the Bell test to pairwise gene interactions, revealing violations of Bell’s Inequalities and indicating the presence of non-local correlations. To validate our findings, we propose a quantitative framework based on the likelihood matrix. This section provides insights into the robustness of our observed correlations, addressing potential biases and uncertainties. In the final section, we extend our analysis to explore disease-permitting states within functional biological modules. By investigating the intricate relationship between genetic variations and module states, we gain deeper insights into the activation mechanisms of complex diseases. This section offers a fresh perspective on disease modeling beyond traditional genotype-phenotype approaches.
With this structured overview, we aim to guide the reader through our research journey, showcasing the methodological innovations and key findings presented in each section.
2. Materials and Methods
Our methodology for data selection aimed to ensure a robust foundation for investigating the interplay between genetic polymorphisms and gene expression in the context of complex diseases. The selection criteria for both SNPs and gene expression data were meticulously designed to facilitate replication.
2.1. Data and Samples
The datasets utilized in this manuscript were generously provided by the Gabriel consortium and pertain to genome-wide association studies conducted on asthma disease [
18]. This paper is based on a cohort consisting of 384 children, encompassing both normal and asthma-susceptible individuals. The expression dataset is freely accessible, while the genotype information corresponds to the MCRA family panel with accession number EGAS00000000137. This dataset comprises a comprehensive map of global gene expression, with approximately 400,000 SNPs and 50,000 transcripts across 400 sibling pairs. In particular, our focus centers on an Illumina whole-genome expression array with 100,000 SNPs, configured in the Affymetrix GeneChip Human Genome U133 Plus 2.0 for gene expression analysis. Consequently, we leverage the gene expression profiles of lymphoblastoid cell lines reported in [
18]. By investigating non-linear interaction models of susceptibility alleles within these genes, we aim to gain a deeper understanding of the critical inflammatory events associated with the disease.
2.1.1. Selection Criteria for SNPs
We sourced SNPs from a comprehensive Genome-Wide Association Study (GWAS) dataset tailored to the specific complex disease under investigation. To prevent a dominant effect that could obscure subtle disease modulation, our focus was on SNPs within a 100 kb range of the corresponding genes. This ensured proximity without direct association. The selection of non-associated SNPs was a deliberate choice, emphasizing diversity in genotypes, including both homozygous and heterozygous states. Biological relevance played a crucial role in our SNP selection, with an extensive literature review guiding the identification of SNPs known to be biologically relevant to the studied disease.
2.1.2. Selection Criteria for Gene Expression Data
Our approach to gene expression data involved an Expression Quantitative Trait Loci (e-QTL) analysis to identify SNPs significantly influencing gene expression within specific functional modules. Genes were organized into functional modules representing key aspects of disease pathophysiology. The stratification of data based on gene expression levels within each functional module allowed for the identification of distinct clusters and patterns, providing valuable insights into the interplay between genetic variants and gene expression.
These criteria collectively form a comprehensive and transparent framework, ensuring the integrity and replicability of our study. The selected data not only reflects the genetic diversity within the studied population but also aligns with established biological knowledge of the disease. The following section elaborates on how this curated dataset was utilized in subsequent analyses to unravel the complexities of genetic interactions within functional modules.
2.2. Motivation
Asthma stands out as one of the most prevalent complex genetic disorders affecting children. To date, more than 77 susceptibility alleles have been identified for this disease (refer to OMIM [
19] entry
and [
20]). However, unraveling the complex interplay between genetic predisposition and co-morbidity remains an open question. Moreover, none of the susceptibility genes in isolation can fully explain the disease, as they often exhibit low odds ratios. Indeed, the collective impact of at-risk alleles plays a limited role in predicting disease prognosis. Additionally, epistatic effects and the presence of numerous polymorphisms across the genome contribute to the complexity of individual outcomes [
20].
2.3. Non-Linear Gene Correlations Model
In the realm of computational biology, an organism is frequently conceptualized as a network of functional modules, which can be likened to biological pathways or functions like innate immunity or autophagy. These modules tend to maintain a steady state in the majority of individuals, and this stability is disrupted only when these modules collectively switch to a disease-permissive state. On the contrary, for an individual to remain healthy, it is sufficient for a module to maintain a protective state. The propensity of a given module to transition into a disease-permissive state depends on genetic and environmental risk factors. Hence, the functional state of a module is influenced not only by these factors but also by stochastic events [
21,
22,
23]. Thus, the crucial question that arises is how to adapt this abstraction to real data for modeling complex diseases.
We propose to model a dominant co-expression scenario that encompasses the potential (anti-)correlations arising from the expression of two genes, denoted as A and B, across the entire genome. It is important to note that these genes need not be on the same chromosome.
The measurements must simultaneously consider the four parameters of each individual, as reported in [
18]. The genotypes are akin to the mechanisms used to measure SNP interactions, and they dictate the expression rates of genes
A and
B. The SNP genotypes are
A if homozygous, and
a otherwise (likewise for
B and
b), impacting the transcription of genes
A and
B. We compute the correlation between the expression rates of these two genes for the four possible cases, denoted by
. The first three cases are associated with correlation, while the last one exhibits anti-correlation. In this setup, each individual reported by [
18] contributes a unique and independent measurement. Unlike genes
A and
B, which can be located anywhere across the genome, genes
and
belong to the same topological domain (TAD) and interact physically in cis (refer to
Figure 1) with SNP variants
and
. We assume that the probability of interaction is
p for the pairs
and
, while the probability of interaction for
is
. Therefore, when
, the expression of genes
A and
B is correlated for the first three variants in
and anti-correlated for the last variant, which has the potential to violate their Bell’s test.
2.4. Data Stratification and Quantitative Trait Analysis
One of the key aspects of our methodology is the identification of functional units or modules within the gene interaction network. This process is fundamental for understanding how genes collaborate within specific biological pathways or functional groups.
We employ a graph-based representation of gene interactions, where nodes correspond to genes and edges signify interactions. To identify functional modules, we leverage graph clustering algorithms, such as Multi Dimensional Scaling (MDS). This algorithm aims to group genes that exhibit strong correlations in their interactions, thus forming cohesive modules.
The identification of functional modules is crucial for delineating distinct biological pathways or processes relevant to the studied complex diseases. The output of our clustering algorithm provides a partitioning of genes into modules, each representing a potential functional unit within the larger gene interaction network (see
Figure 2).
Our primary interest lies in characterizing the genetic makeup and state of a functional module that models a complex disease, accounting for individual genotypes potentially influenced by environmental or stochastic events [
24]. Therefore, we need to consider the genetic features in terms of SNPs across three categories: homozygous
a, heterozygous
, and homozygous
. To conform to the classical Bell theory, we conduct two distinct tests, each associated with two binary variables, specifically, the presence or absence of
a and the presence or absence of
A.
By introducing upper and lower mean thresholds, we transform gene expression data into a qualitative measurement. Initially, we preprocess the dataset by scaling the GWAS feature vectors of each individual with respect to the mean and standard deviation. Subsequently, we calculate correlations using the covariance matrix. We employ multidimensional scaling (MDS) to infer the covariance among all patients. Finally, by applying k-means clustering on the resulting centroid with respect to the first and second discriminant functions, we achieve effective separation between patients based on the two defined genetic feature classes.
In the initial phase, we compile a list of genes involved in susceptibility-related functions by searching within the Gene Ontology (GO) categories, utilizing keywords provided by [
25], such as autophagy, DNA repair, fatty acid beta-oxidation, and response to toxic substance genes.
We then analyze the distribution of gene expression for the identified genes and explore correlations between gene expressions and asthma susceptibility alleles, integrating an expression quantitative trait loci (e-QTL) analysis [
26]. We focus on the most promising SNPs within genetic regions associated with asthma.
Subsequently, we conduct aggregated association analyses within the predefined genetic regions to assess the impact of the entire set of asthma-associated SNPs on gene expression profiles, aiming to uncover potential epistatic interactions. This approach enables us to elucidate the interactive network of SNPs that influence the expression of genes contributing to the same biological functions.
2.5. The Bell’s Inequalities as a Method to Capture Complex Correlations in the Genome
Bell’s Inequalities (BIs) establish bounds on the statistics of measurements carried out on spatially separated entities within the framework of local hidden variable (LHV) theories. In essence, if one were to choose different measurements “randomly” in a systematic experiment, various outcomes would result. After repeating such experiments numerous times and computing statistics, these would be confined by Bell’s Inequalities in an LHV space [
27]. However, in a quantum universe, these BIs can be violated [
28]. We will specifically focus on the simplest type of Bell experiment, known as the Clauser-Horne-Shimony-Holt (CHSH) scenario, within the context of local realism.
In the CHSH inequality, each measurement has two settings and two outcomes that depend deterministically on the setting and hidden variables (h). Notably, h can be viewed as a stochastic variable with an unknown list of possible values. We will utilize the locality condition to determine each outcome independently of the setting of the other measurement. This foundational theory can be extended to explore the range of correlations between two general entities, much like our proposed gene variant interaction model in this work.
In the classical CHSH inequality, we investigate the statistics of the parity of two opposite measurement outcomes (i.e., settings
and measurements
) through the following quantity:
We find it convenient to redefine this correlation
in terms of conditional probabilities as follows:
These conditional probabilities, denoted as , can be combined to form a real vector within the conditional probability space. For example, . Each set of conditional probabilities corresponds to a point in a unit hypercube.
In a Local Hidden Variable (LHV) model, we assume that the outcomes depend deterministically on the settings and a shared hidden variable
h. For any given value of
h, we can define
. By treating
h stochastically, we can create a convex combination or hull, as determined by:
This implies that all LHV correlations lie within the convex hull of the fixed-
h correlations. This shape is commonly referred to as a polytope, where all Bell’s Inequalities (BIs) are represented for a given setup
L. In particular, a vertex of this hull describes the deterministic correlation defined by
), while a facet corresponds to a Bell inequality. For further details on this representation, refer to the
Supplementary Information text.
Finally, the range of correlations between two measurements is constrained by the following Bell score:
In a biological context, this theory implies that each cell clone should describe at any given time the four genotypic parameters, i.e., genotypes , , , and . Subsequently, these genotypes can be associated with the physical polarities defined in the Bell test, enabling the measurement of gene expression rates for any pair of genes A and B. We then calculate a correlation that links the gene expression rates of genes A and B with respect to their four possible configurations, accounting for their respective presence or absence in the datasets. As a result, each cell line becomes a unique and independent measurement.
3. Results
Our methodology introduces several novel contributions that significantly enhance the landscape of genomic analysis and disease modeling. These unique elements set our approach apart from existing methods, offering advanced capabilities and insights in the study of complex diseases. Unlike conventional approaches, our methodology employs a functional module stratification strategy. This unique method allows for the classification of samples into distinct communities based on genotype features. The elucidation of disease-relevant communities within specific functional modules provides a nuanced understanding of disease mechanisms, a novel aspect in our methodology. We present a non-linear model inspired by Bell’s Inequalities. This model serves to evaluate the extra correlation in genetic interactions beyond what is determined by genotype alone. By applying the Bell test to pairwise gene interactions, we demonstrate a violation of Bell’s Inequalities, indicating the presence of non-local correlations. This application of Bell’s Inequalities in the context of genomics is a novel contribution to the field. To ensure the reliability of our findings, we introduce a quantitative validation framework. This framework, based on the likelihood matrix, provides a robust validation process for the observed correlations. The quantitative validation enhances the credibility of our results, addressing concerns related to potential biases and uncertainties. Our methodology goes beyond traditional genotype-phenotype models by exploring disease-permitting states within functional biological modules. By investigating the interplay between genetic variations and module states, we reveal a deeper understanding of disease activation mechanisms. This innovative perspective on disease-permitting states offers a fresh outlook on the intricate relationship between genetics and disease. These contributions collectively position our methodology as a pioneering approach in the field of genomic analysis, offering a comprehensive toolkit for researchers investigating complex diseases across various organisms and functional modules.
The reference dataset comprised 384 fully genotyped individuals out of a total of 395 samples from the cohort. After data denoising, scaling, and covariance estimation for each functional group, we observed the clear stratification of all samples into two distinct communities. As previously mentioned, these clusters are primarily determined by the presence or absence of ‘
a’ and ‘
A’ alleles in the genotypes (refer to
Figure 3). However, our model suggests that exploring the genotype-by-environment interaction (
) should be conducted at lower levels of complexity, specifically at the gene expression level of genes involved in relevant functions [
29,
30]. Consequently, our current goal is to define the interaction between the expressions of genes within a specific function concerning at-risk genetic polymorphisms.
3.1. The Data Stratification Splits the Cohort into Two Distinct Classes of Genotyped Samples
Our e-QTL analysis revealed that SNPs interactions within the autophagy module are significantly associated with at-risk alleles of the disease (see
Figure 4). In particular, the presence of the ‘
A’ allele is prominently displayed in
Figure 4 for the majority of the selected GO functional module in type I samples, while a much stronger presence of the ‘
a’ allele is observed in type II samples (also depicted in
Figure S7A,B). This further supports our hypothesis of segregation due to extra genetic correlations induced by functional modeling of complex diseases. For additional details on other disease-relevant communities, we refer the reader to the
SI text (Figures S8–S10).
3.2. A Potential Model of Extra Variation to Evaluate the Bell Test in Inflammatory Disorders
From the individual genotype and e-QTL datasets, we identified the gene
as a strong polymorphism associated with quantitative traits related to asthma. The interplay between its genetic variants holds promise for fitting the Bell test within the selected functional modules. The
variant is characterized by either arginine or proline, and it is known to associate with two promoters,
or
, alternatively. These findings align with previous literature (Chen et al. [
31]). Additionally, the
promoter exhibits a polymorphism that influences gene expression (Sun et al., Fan et al., Thun et al., Huszno et al., Elshazli et al. [
32,
33,
34,
35,
36]).
is a physical interactor of
, making the application of Bell’s experiment to the
target genes in relation to
and
polymorphisms a promising model for assessing our hypothesis (refer to
Table 1).
3.3. Our Model Adequately Describes a CHSH Setup
The association between genetic polymorphism and gene expression levels can be gleaned from genome-wide association (GWAS) and expression studies. However, these associations are often at risk of experiencing a strong dominant effect, which may hinder the proper modulation of disease by other genes. As a result, we focus on SNPs that are not directly associated but are located within a range of approximately 100 kb of the corresponding gene.
We conducted an analysis of gene expression distributions for
p21 and
Bax based on their genotypes across the entire set of individuals within a specific functional module (refer to
Figure 5). The observed variance in most genotypes suggests a substantial global correlation effect. Consequently, our model, consisting of SNPs (
,
) and genes (
,
), aligns with a
LHV polytope within the CHSH setup. For more detailed information on this configuration, including the
facets, please refer to
Table 1 and the blue polyhedron in
Figure 6.
Now, we want to estimate the Bell score as defined in our methods. To do so, we capture the rate expression of and calculate the correlation between them and their four possible genotypic variables. Subsequently, the conditional probabilities are computed by tallying the presence-absence of genotypes.
Upon initial inspection,
Figure 5 appears to exhibit significantly skewed distributions, implying that using the standard mean may not be an appropriate statistical measure in this case. Specifically, these are right-skewed distributions, with the exception of
in type I samples. To mitigate the risk of overestimating counts, we perform a mean test [
37] for
genes and variants as follows:
where
is the mean of distribution
X as random variable.
In accordance with the test estimators, we observe that
is roughly equal to
(see Equation (
5)). This result unequivocally indicates the imbalance-skewness of our gene expression distributions. Therefore, we opt to use the geometric mean to calculate the parity probabilities of
RNA level and
SNPs correlation (see
Table S1).
From
Figure 7, we seamlessly proceed with the Bell test and compute the score as follows:
Consequently, Bell’s Inequalities are violated, and as a consequence, our Bell polygon
L is non-local (see
Figure 6). We assert that this non-locality provides further evidence of the existence of a global correlation that enables
to work together in the same functional module. Furthermore, such a correlation must necessarily be situated at a higher level of expression than the genotype.
4. Discussion
The strategy presented here to discriminate GWAS features between sample outcomes, along with the Bell non-linear model of gene interactions, can unveil the existence of an overriding association of epistatic variations. This global interaction is useful for characterizing different states of disease-permissiveness in functional modules. In the long term, this “on-off” switch threatens to disturb the steady correlation achieved by genes within the same functional modules since their initial establishment. However, this promising scenario oversimplifies the intricate interplay carried out by gene variations and differential expression linked to specific biological functions.
The interpretation of our results offers a logical understanding of the interplay between genetic polymorphisms and gene expression within specific functional modules associated with the studied complex disease. However, we recognize the importance of delving deeper into the biological implications of our findings, particularly concerning their relevance to disease mechanisms.
In the context of disease mechanisms, our study sheds light on the intricate dynamics of gene interactions within functional modules. The identification of bi-functional modules, contingent upon (anti)correlation with specific functional states, provides a nuanced perspective on the underlying genetic architecture of complex diseases. The delineation of a disease by a finite number of discernible modules implies a modular organization of genetic factors contributing to disease susceptibility.
Within each module, the presence of allelic variants as genetic risk factors adds a layer of complexity to disease progression. Our findings suggest that these risk factors precipitate a permissive state within a module. Crucially, this permissive state, when aligned across multiple modules, can act as a precursor to the onset of the disease in an individual. This modular view of disease mechanisms challenges traditional linear models, emphasizing the need for a comprehensive understanding of the genetic transmission of these factors.
The observed variations in SNP interactions concerning disease risk prompt an exploration of the role of gene expression in disease activation. Our non-linear model, inspired by Bell’s Inequalities, provides a framework to elucidate the variances in SNP interactions. This model suggests that the biological function of a module is not solely determined by a top-down genetic mechanism but involves an additional driving force.
The violation of Bell’s Inequalities in our model indicates an extra-correlation between genes beyond what is determined by the genotype. This finding has profound implications for understanding how genes within the same module collaborate to mediate disease activation. The existence of a connection between genes beyond genotype-driven interactions challenges conventional models and highlights the necessity of considering higher-order correlations in disease modeling.
In the epistatic context, our study identifies SNPs linked to variations in gene expression within specific modules. The presence of a group of SNPs in an up-regulated state and another group displaying down-regulation suggests a complex regulatory network. The question of whether the biological function of a module is solely determined by a top-down genetic mechanism or if additional driving forces govern the module’s function becomes paramount.
The landscape shaped by the abstraction of genotype-phenotype modeling into functional biological modules necessitates a top-down approach. While SNPs serve as regulators of the permissibility of the module’s state, the expression rate of a module is not solely dictated by SNP actions. This intricate interplay challenges the simplistic view of the relationship between gene expression and genotype, emphasizing the role of additional factors in disease mechanisms.
On the other hand, the scarcity of replication and imbalance in the data could limit the efficacy of our study, which could possibly be improved by adding some form of goodness measurement to the B-score (type II statistical error analysis). Additionally, the analyzed dataset contains certain related individuals, giving rise to dependent fluctuations that need to be accounted for. Despite these challenges, the model aligns well with existing literature and predicts global correlation when communities are well defined. Thus, the model demonstrates itself to be sufficiently conclusive in supporting the original hypothesis. In the near future, an essential improvement to the model’s capabilities would be its adaptation to any number of gene interactions. This would necessitate the use of systematic gene expression denoising methods, such as the utilization of deep count auto-encoders [
38,
39], to gain insights into the vast multiparametric CHSH probabilistic space.
In evaluating the efficacy of our non-linear model for understanding genetic transmission, it is essential to consider the available methods for comparing gene interaction models. Existing approaches, such as the well-established Weighted Gene Co-expression Network Analysis (WGCNA), often vary in their ability to capture complex relationships between genes and their impact on disease modules.
One common benchmarking strategy involves assessing the performance of gene interaction models against curated datasets or simulated scenarios. Metrics such as precision, recall, and F1-score are commonly employed to quantify the accuracy and completeness of identified gene interactions.
While our current focus is on establishing the theoretical foundations of our model, future work could involve rigorous comparisons with WGCNA or others. This would enable a more nuanced understanding of how our approach performs in different scenarios and its potential advantages in capturing extra-correlations within disease-related modules. For instance, the suggestion to extend our approach to dynamic networks presents a promising avenue. Incorporating temporal aspects allows us to model how gene interactions evolve over time or in response to specific perturbations. Employing dynamic network approaches, such as dynamic Bayesian networks or recurrent neural networks, offers a valuable opportunity to capture the evolving relationships between genes and their implications in complex diseases.
As we navigate the complex landscape of genetic interactions and disease mechanisms, our study opens avenues for future research and implications for precision medicine. Understanding the modular organization of genetic factors influencing disease susceptibility provides a foundation for targeted interventions. The identification of key modules and their associated risk factors can guide personalized therapeutic strategies, moving beyond a one-size-fits-all approach.
5. Conclusions
In this study, we provide at least a “weak” proof of how two genes sharing a module representation can exhibit extra correlation beyond the genotype in the modeling of complex diseases. The variance displayed by SNP interactions in the region comprising the coupling of variants places our model within the so-called quantum region. Consequently, this non-local behavior appears to violate one of the CHSH Bell’s Inequalities! As a result, our Bell polygon is also expected to be non-local, confirming our hypothesis that these two genes work together within the same module to mediate disease activation in a patient.
Supplementary Materials
The following supporting information can be downloaded at
https://www.mdpi.com/article/10.3390/math11244916/s1, Figure S1: Interquartile range (IQR) vs Means plot of MRCA dataset; Figure S2: Impact on the MRCA dataset cleaning of different levels of background correction.; Figure S3: Correlation densities of parameter choices; Figure S4: Relative log expression (RLE) plots comparing different values of
for a given
k = 3; Figure S5: RLE plots to remove the variation of known source in MRCA gene expression profiles; Figure S6: Genotype distribution per sample and GO functional module after cleaning process; Figure S7: Genotypic variables abundance after counting samples in MRCA dataset in the e-QTL analyses; Figure S8: Stratification of individuals at low levels of expression (Autophagy); Figure S9: Stratification of individuals at low levels of expression (DNA repair); Figure S10: Stratification of individuals at low levels of expression (Response to toxic substance); Figure S11: Graphical representation of our model. Figure S12: Samples counting after geometric mean correction. References [
40,
41,
42] are cited in the Supplementary Materials.
Author Contributions
Conceptualization, I.M.; Methodology, A.K.K.; Software, K.L.V.-D.; Validation, A.K.K.; Formal analysis, K.L.V.-D.; Data curation, A.K.K.; Writing—review & editing, I.M.; Supervision, I.M. All authors have read and agreed to the published version of the manuscript.
Funding
We gratefully acknowledge funding from the National Research Association (ANR) (Inflamex renewal 10-LABX-0017 to I Morilla), Consejería de Universidades, Ciencias y Desarrollo, fondos FEDER de la Junta de Andalucía (ProyExec_0499 to I Morilla).
Institutional Review Board Statement
This study received approval from the Partners Human Research Committee, which granted a waiver for the necessity of informed consent regarding the collection and analysis of samples.
Informed Consent Statement
Informed consent was obtained from all subjects involved in this study. Written informed consent has been obtained from the patients to publish this paper.
Data Availability Statement
All the data utilized in this study is provided within the article and
Supplementary Materials. Furthermore, the R code required for executing the inference procedures, together with the resulting inferences and guidelines on how to generate the figures presented in this paper, can be accessed on our GitHub page at
https://github.com/MorillaLab/GENETIC-BELL (accessed on 10 December 2023).
Acknowledgments
We want to acknowledge Gabriel consortium for providing the data and the members of the CRI from Bichat Hospital for their invaluable discussions.
Conflicts of Interest
The authors declare no conflict of interest. The funders had no role in the design of the study, in the collection, analyses, or interpretation of data, in the writing of the manuscript, or in the decision to publish the results.
Abbreviations
The following abbreviations are used in this manuscript:
| SNP | Single Nucleotide Polymorphism |
| GWAS | Genome-Wide Association Study |
| BIs | Bell’s Inequalities |
| CHSH | Clauser-Horne-Shimony-Holt |
| LHV | Local Hidden Variable |
| RNA | Ribonucleic Acid |
| QTL | Quantitative Trait Locus |
References
- Johnson, M.; Reddy, G.; Desai, M. Epistasis and evolution: Recent advances and an outlook for prediction. BMC Biol. 2023, 120, 1585–1597. [Google Scholar] [CrossRef] [PubMed]
- Huang, J.; Chen, J.; Esparza, J.; Ding, J.; Elder, J.T.; Abecasis, G.R.; Lee, Y.A.; Lathrop, M.G.; Moffatt, M.F.; Cookson, W.O.C.; et al. eQTL mapping identifies insertion- and deletion-specific eQTLs in multiple tissues. Nat. Commun. 2015, 6, 6821. [Google Scholar] [CrossRef] [PubMed]
- Morilla, I.; Lees, J.G.; Reid, A.J.; Orengo, C.A.; Ranea, J.A. Assessment of protein domain fusions in human protein interaction networks prediction: Application to the human kinetochore model. New Biotechnol. 2010, 27, 755–765. [Google Scholar] [CrossRef] [PubMed]
- Morilla, I.; Ranea, J.A. Mathematical deconvolution uncovers the genetic regulatory signal of cancer cellular heterogeneity on resistance to paclitaxel. Mol. Genet. Genom. 2017, 292, 857–869. [Google Scholar] [CrossRef]
- Ding, Y.P.; Ladeiro, Y.; Morilla, I.; Bouhnik, Y.; Marah, A.; Zaag, H.; Cazals-Hatem, D.; Seksik, P.; Daniel, F.; Hugot, J.P.; et al. Integrative Network-based Analysis of Colonic Detoxification Gene Expression in Ulcerative Colitis According to Smoking Status. J. Crohn’s Colitis 2016, 11, 474–484. [Google Scholar] [CrossRef]
- Schweizer, G.; Wagner, A. Genotype networks of 80 quantitative Arabidopsis thaliana phenotypes reveal phenotypic evolvability despite pervasive epistasis. PLoS Comput. Biol. 2020, 16, 14–17. [Google Scholar] [CrossRef]
- Wu, Y.-L.; Lin, Z.-J.; Li, C.-C.; Lin, X.; Shan, S.-K.; Guo, B.; Zheng, M.-H.; Li, F.; Yuan, L.-Q.; Li, Z.-L. Epigenetic regulation in metabolic diseases: Mechanisms and advances in clinical study. Signal Transduct. Target. Ther. 2023, 98, 145–157. [Google Scholar] [CrossRef]
- Boskovic, C. Exploring the role of epigenetic modifications in gene expression regulation. J. Genet. Mol. Biol. 2023, 3, 141–147. [Google Scholar]
- Hornschuh, M.; Wirthgen, E.; Wolfien, M.; Singh, K.; Wolkenhauer, O.; Däbritz, J. The role of epigenetic modifications for the pathogenesis of Crohn’s disease. Clin. Epigenetic 2021, 108, 105–112. [Google Scholar] [CrossRef]
- Shi, Y.; Zhang, H.; Huang, S.; Yin, L.; Wang, F.; Luo, P.; Huang, H. Epigenetic regulation in cardiovascular diseases: Mechanisms and advances in clinical trials. Signal Transduct. Target. Ther. 2022, 200, 125–132. [Google Scholar] [CrossRef]
- Bell, J.S. On the Einstein-Podolsky-Rosen Paradox; Cambridge University Press: Cambridge, UK, 1964; pp. 14–21. [Google Scholar]
- Gilder, L. The Age of Entanglement: When Quantum Physics Was Reborn; Alfred A. Knopf: New York, NY, USA, 2008. [Google Scholar]
- Bonsack, F. L’inégalité de Bell: Démonstration intuitive et commentaires. Dialectica 1985, 39, 111–125. [Google Scholar] [CrossRef]
- Sitinjak, B.; Murray, N.; Rahman, T.; Zakiyah, N.; Barliana, M. The Potential of Single Nucleotide Polymorphisms (SNPs) as Biomarkers and Their Association with the Increased Risk of Coronary Heart Disease: A Systematic Review. Vasc. Health Risk Manag. 2023, 19, 289–301. [Google Scholar] [CrossRef]
- Zhou, X.; Chen, Y.; Lp, F. Deep learning-based polygenic risk analysis for Alzheimer’s disease prediction. Commun. Med. 2023, 3, 139–147. [Google Scholar] [CrossRef] [PubMed]
- Weedon, M.; Jackson, L.; Harrison, J.; Ruth, K.; Tyrrell, J.; Hattersley, A.; Wright, C. Use of SNP chips to detect rare pathogenic variants: Retrospective, population based diagnostic evaluation. BMJ 2021, 372, n214. [Google Scholar] [CrossRef]
- Slunecka, J.; van den Zee, M.; Beck, J.J.; Johnson, B.N.; Finnicum, C.T.; Pool, R.; Hottenga, J.-J.; de Geus, E.J.C.; Ehli, E.A. Implementation and implications for polygenic risk scores in healthcare. Hum. Genom. 2021, 15, 46. [Google Scholar] [CrossRef] [PubMed]
- Liang, L.; Morar, N.; Dixon, A.L.; Lathrop, G.M.; Abecasis, G.R.; Moffatt, M.F.; Cookson, W.O.C. A cross-platform analysis of 14,177 expression quantitative trait loci derived from lymphoblastoid cell lines. Genom. Res. 2003, 23, 716–726. [Google Scholar] [CrossRef]
- OMIM. OMIM Database. Available online: https://omim.org/about (accessed on 27 July 2023).
- Hernandez-Pacheco, N.; Pino-Yanes, M.; Flores, C. Genomic predictors of asthma phenotypes and treatment response. Front. Pediatr. 2019, 7, 6. [Google Scholar] [CrossRef]
- Leier, H.C.; Weinstein, J.B.; Kyle, J.E.; Bramer, L.M.; Stratton, K.G.; Kempthorne, D.; Navratil, A.R.; Tafesse, E.G.; Hornemann, T.; Messer, W.B.; et al. A global lipid map defines a network essential for Zika virus replication. Nat. Commun. 2020, 11, 3652–3667. [Google Scholar] [CrossRef]
- Barabasi, A.L.; Gulbahce, N.; Loscalzo, J. Network medicine: A network-based approach to human disease. Nat. Rev. Genet. 2011, 12, 56–68. [Google Scholar] [CrossRef]
- Papin, J.A.; Hunter, T.; Palsson, B.O.; Subramaniam, S. Reconstruction of cellular signalling networks and analysis of their properties. Nat. Rev. Mol. Cell Biol. 2005, 6, 99–111. [Google Scholar] [CrossRef]
- Feinberg, A.P.; Irizarry, R.A. Stochastic epigenetic variation as a driving force of development, evolutionary adaptation, and disease. Proc. Natl. Acad. Sci. USA 2010, 107, 1757–1764. [Google Scholar] [CrossRef]
- Erle, D.J.; Sheppard, D. The cell biology of asthma. J. Cell Biol. 2014, 205, 621–631. [Google Scholar] [CrossRef] [PubMed]
- Rockman, M.V.; Kruglyak, L. Genetics of global gene expression. Nat. Rev. Genet. 2006, 7, 862–872. [Google Scholar] [CrossRef] [PubMed]
- Tsirelson, B.S. Quantum generalizations of Bell’s inequality. Lett. Math. Phys. 1980, 4, 93–100. [Google Scholar] [CrossRef]
- Popescu, S.; Rohrlich, D. Quantum nonlocality as an axiom. Lett. Math. Phys. 1994, 24, 379–385. [Google Scholar] [CrossRef]
- Li, X.; Guo, T.; Mu, Q.; Li, X.; Yu, J. Genomic and environmental determinants and their interplay underlying phenotypic plasticity. Proc. Natl. Acad. Sci. USA 2018, 115, 6679–6684. [Google Scholar] [CrossRef] [PubMed]
- Sae-Lin, P.; Komen, H.; Kause, A.; Mulder, H.A. Identifying environmental variables explaining genotype-by-environment interaction for body weight of rainbow trout (Onchorynchus mykiss): Reaction norm and factor analytic models. Genet. Sel. Evol. 2014, 46, 20–27. [Google Scholar]
- Chen, R.; Liu, S.; Ye, H.; Li, J.; Du, Y.; Chen, L.; Liu, X.; Ding, Y.; Li, Q.; Mao, Y.; et al. Association of p53 rs1042522, MDM2 rs2279744 and p21 rs1801270 polymorphisms with retinoblastoma risk and invasion in a Chinese population. Sci. Rep. 2015, 5, 13300. [Google Scholar] [CrossRef]
- Sun, Z.; Gao, W.; Cui, J.T. Effect of TP53 rs1042522 on the susceptibility of patients to oral squamous cell carcinoma and oral leukoplakia: A meta-analysis. BMC Oral Health 2018, 18, 452–459. [Google Scholar] [CrossRef]
- Fan, C.; Wei, J.; Yuan, C.; Wang, X.; Jiang, C.; Zhou, C.; Yang, M. The Functional TP53 rs1042522 and MDM4 rs4245739 Genetic Variants Contribute to Non-Hodgkin Lymphoma Risk. PLoS ONE 2014, 9, e107047. [Google Scholar] [CrossRef]
- Thun, G.A.; Imboden, M.; Berger, W.; Rochat, T.; Probst-Hensch, N.M. The association of a variant in the cell cycle control gene CCND1 and obesity on the development of asthma in the Swiss SAPALDIA study. J. Asthma. 2013, 50, 7–15. [Google Scholar] [CrossRef] [PubMed]
- Huszno, J.; Grzybowska, E. TP53 mutations and SNPs as prognostic and predictive factors in patients with breast cancer. Oncol. Lett. 2018, 16, 210–224. [Google Scholar] [CrossRef] [PubMed]
- Elshazli, R.M.; Toraih, E.A.; Elgaml, A.; Kandil, E.; Fawzy, M.S. Genetic polymorphisms of TP53 (rs1042522) and MDM2 (rs2279744) and colorectal cancer risk: An updated meta-analysis based on 59 case-control studies. Gene 2020, 734, 144391. [Google Scholar] [CrossRef] [PubMed]
- Ullah, I.; Paul, S.; Hong, Z.; Wang, Y.G. Significance tests for analyzing gene expression data with small sample sizes. Bioinformatics 2019, 35, 3996–4003. [Google Scholar] [CrossRef] [PubMed]
- Morilla, I.; Uzzan, M.; Laharie, D.; Cazals-Hatem, D.; Denost, Q.; Daniel, F.; Belleannee, G.; Bouhnik, Y.; Wainrib, G.; Panis, Y.; et al. Colonic MicroRNA Profiles, Identified by a Deep Learning Algorithm, That Predict Responses to Therapy of Patients With Acute Severe Ulcerative Colitis. Clin. Gastroenterol. Hepatol. 2019, 17, 905–913. [Google Scholar] [CrossRef]
- Eraslan, G.; Simon, L.; Mircea, M.; Mueller, N.; Theis, F. Single-cell RNA-seq demonising using a deep count autoencoder. Nat. Commun. 2020, 10, 14–20. [Google Scholar] [CrossRef]
- Freytag, S. RUVcorr: Removal of Unwanted Variation for Gene-Gene Correlations and Related Analysis; R Package Version 1.20.0; Bioconductor: Vienna, Austria, 2020. [Google Scholar]
- Freytag, S. Simulating and Cleaning Gene Expression Data Using RUVcorr in the Context of Inferring Gene Co-Expression; R Package Version 1.0.1; Bioconductor: Vienna, Austria, 2015. [Google Scholar]
- Freytag, S.; Gagnon-Bartsch, J.; Speed, T.P.; Bahlo, M. Systematic noise degrades gene co-expression signals but can be corrected. BMC Bioinform. 2015, 16, 309. [Google Scholar] [CrossRef]
Figure 1.
Non-linear correlation model of two genes. (A) An example of a synthetic biological network modeling a complex disease and clustered by communities, wherein diverse hues signify distinct community affiliations. (B) The correlation model of any two nodes in the same community, affected by potential environmental, stochastic, or genetic variations. A sequence, such as a transcription factor, in cis with gene A, produces a sharp phenotype that interacts with gene B. A variant in the gene A promoter (PR) can impede the full phenotypical interaction, leading to a potential disease-permissive state.
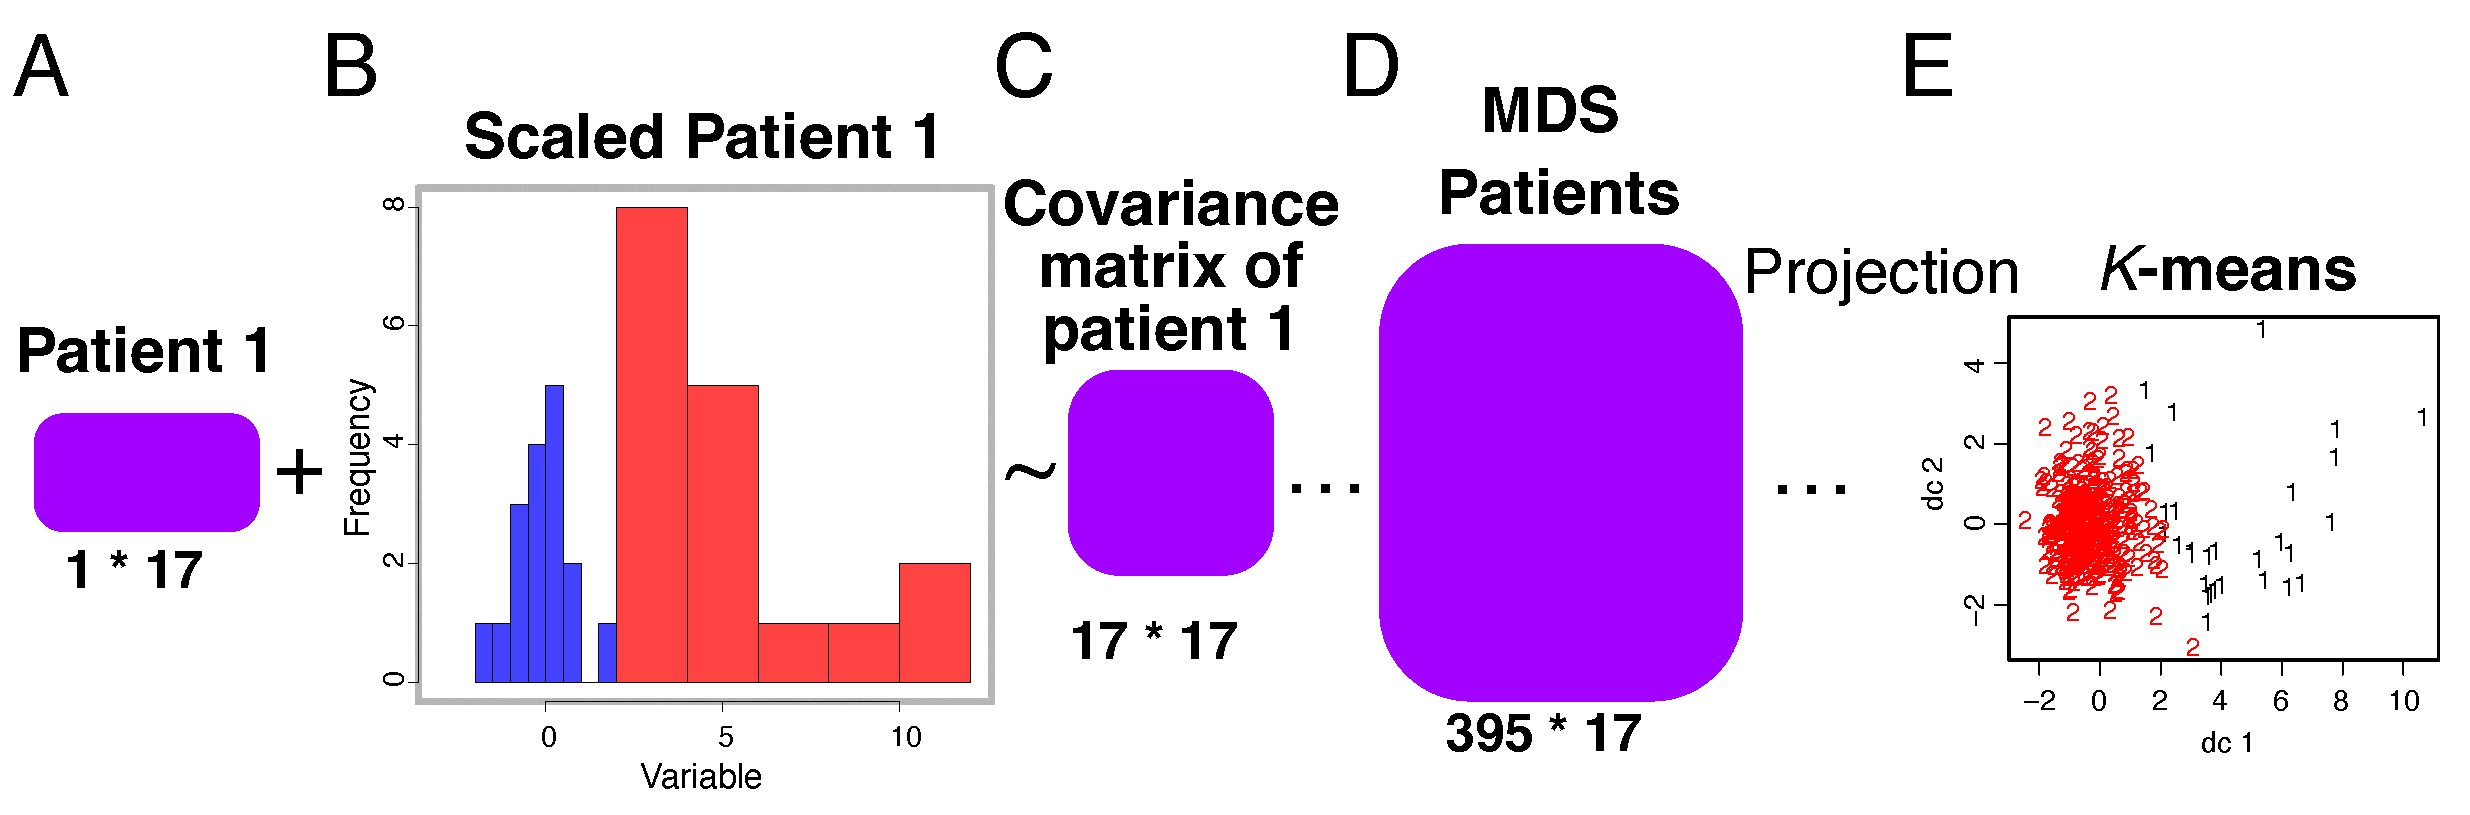
Figure 2.
Genotype versus phenotype co-expression analysis by individual modules and groups. (A) Matrix of individual’s GWAS features. (B) Standard scaling methods of a patient matrix, wherein blue and red bars stand for upper and lower threshold of choice respectively. (C) Calculation of the covariance matrix to be subsequently used in data reduction methods. (D) Multidimensional scaling to infer an all-in patient-features matrix. (E) Application of the classic k-means method to separate individuals into two clusters per GO function. Numbers indicate belonging to each cluster.
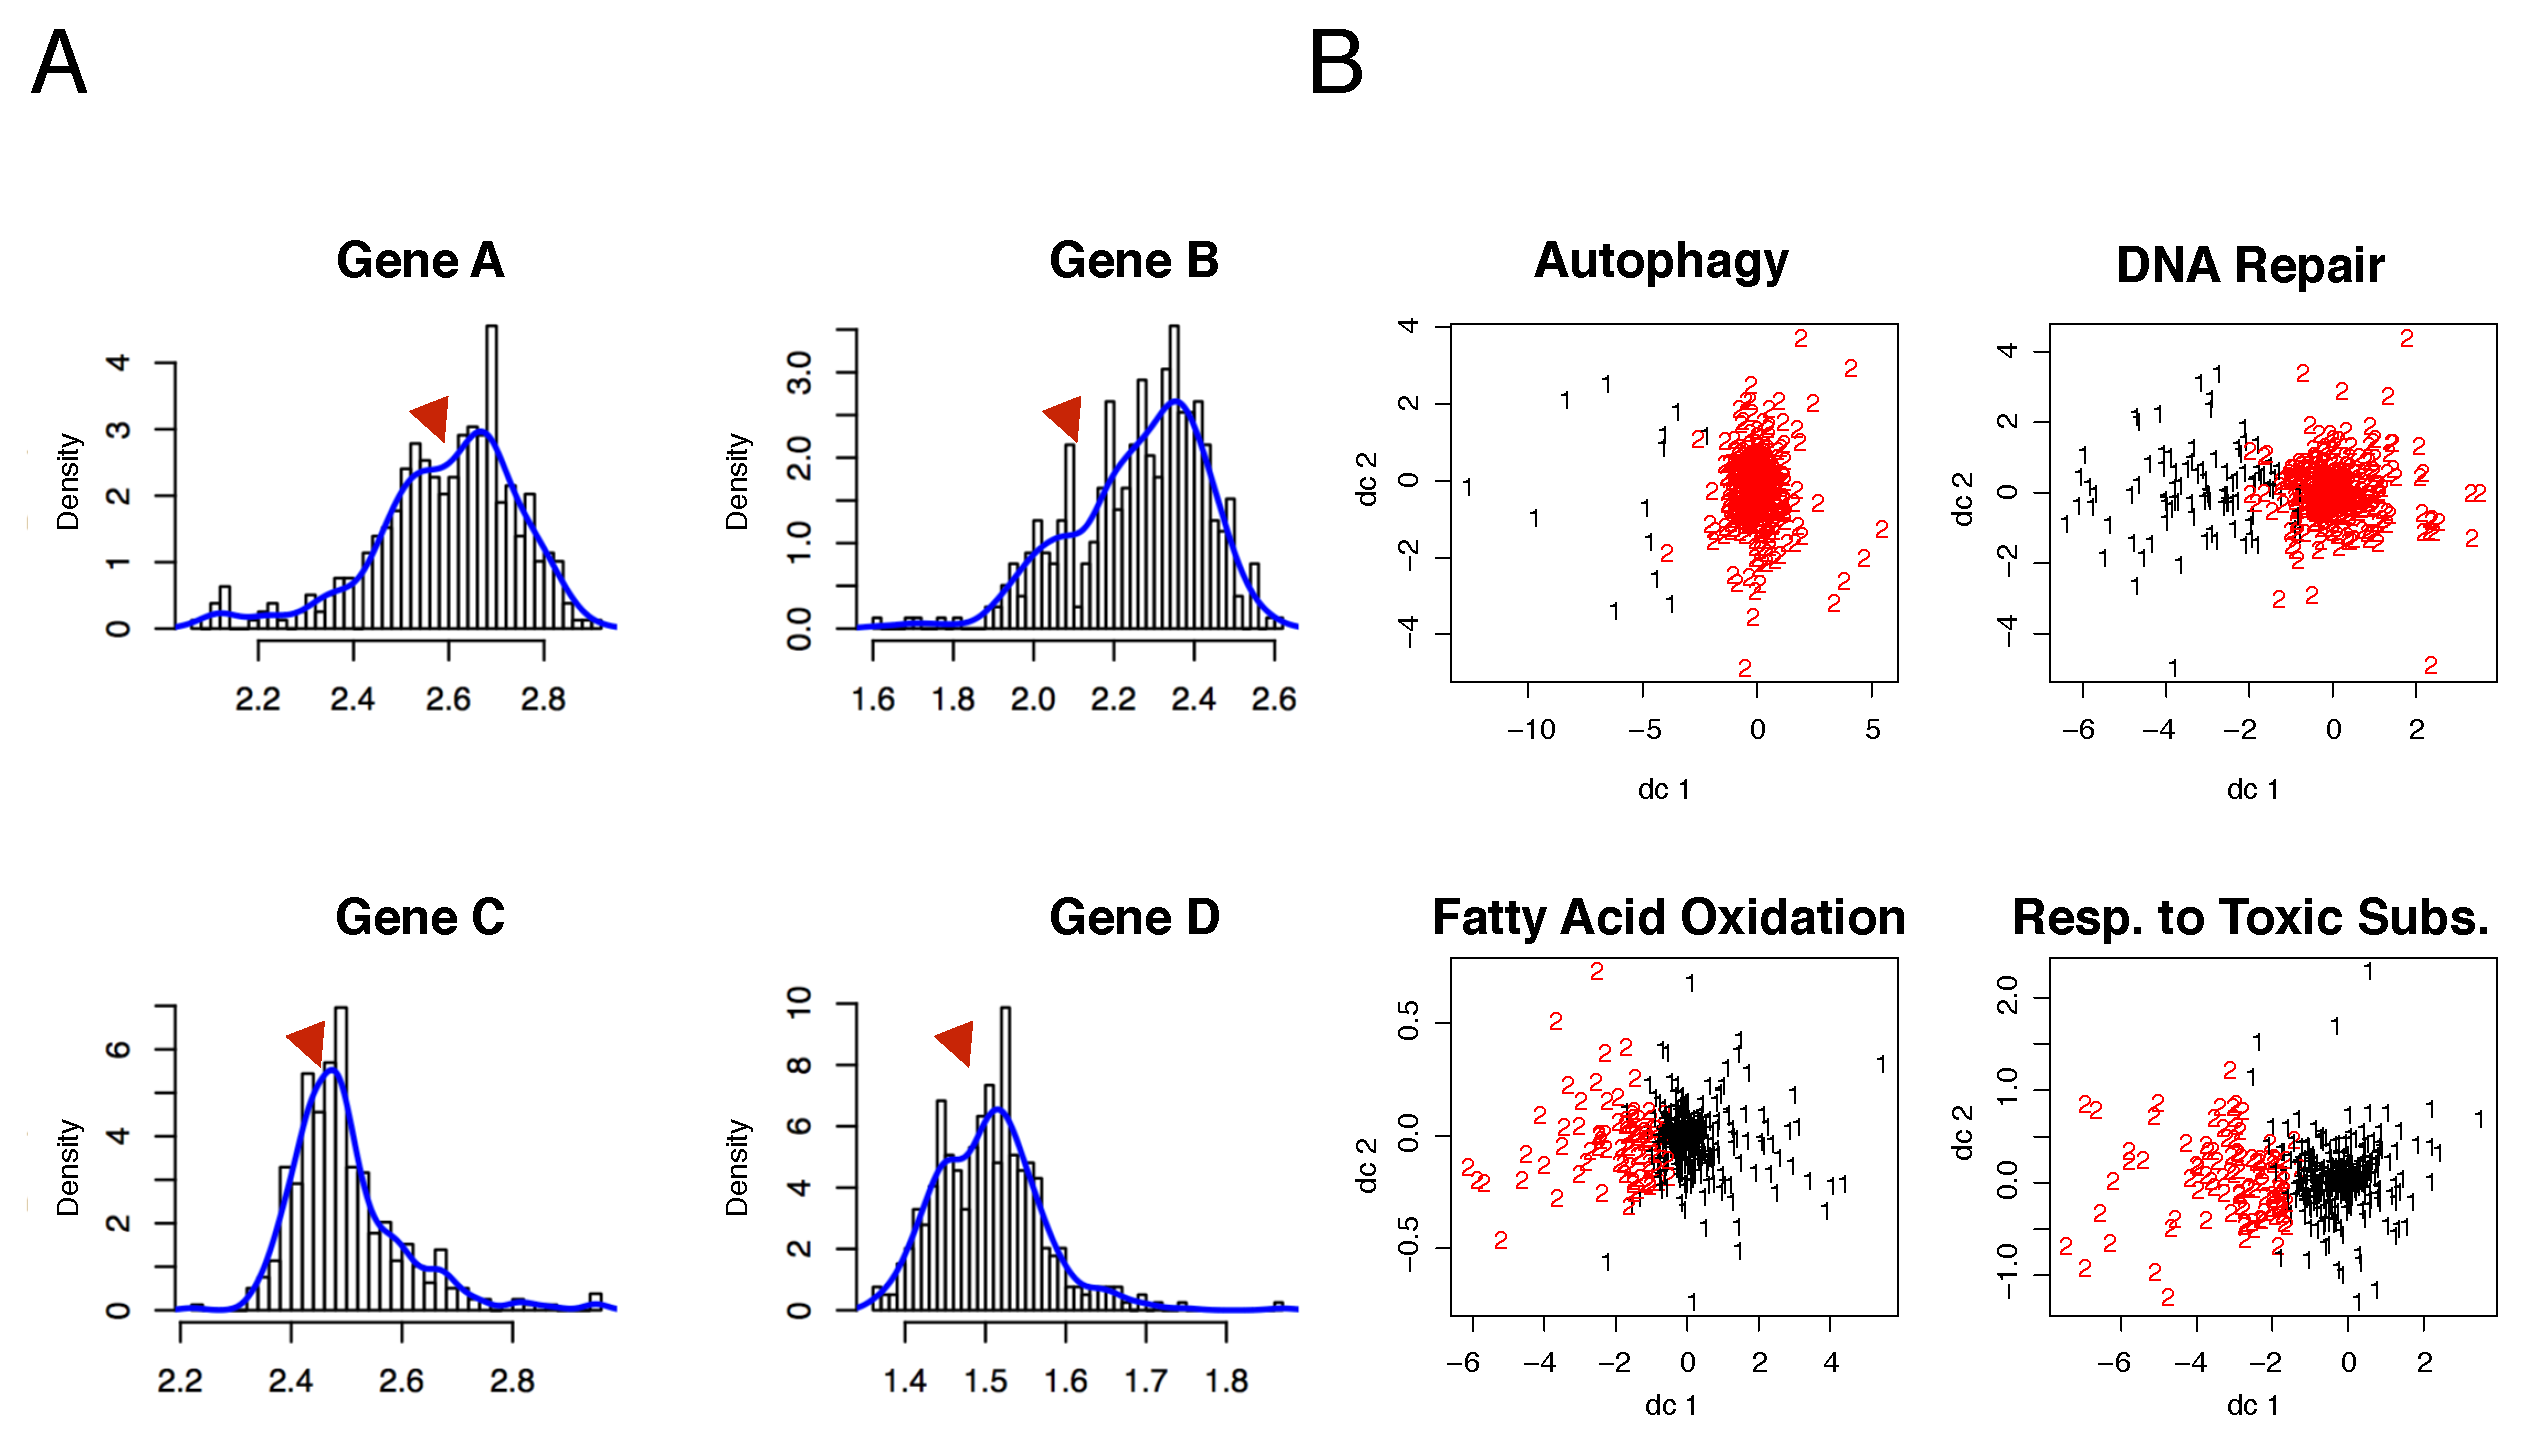
Figure 3.
Data stratification based on the selected GO function. (A) A variety of gene behaviors depending on data stratification and functional modules. Red triangles highlight points of potential Gaussian mixture. (B) Clockwise from the top-left: sample clusters for each functional module, such as autophagy, DNA repair GO function, response to toxic substances, and fatty acid oxidation. Clusters are 2D projections based on the first and second most informative components of the two-means method. Black points represent type I samples, while red points indicate type II samples.
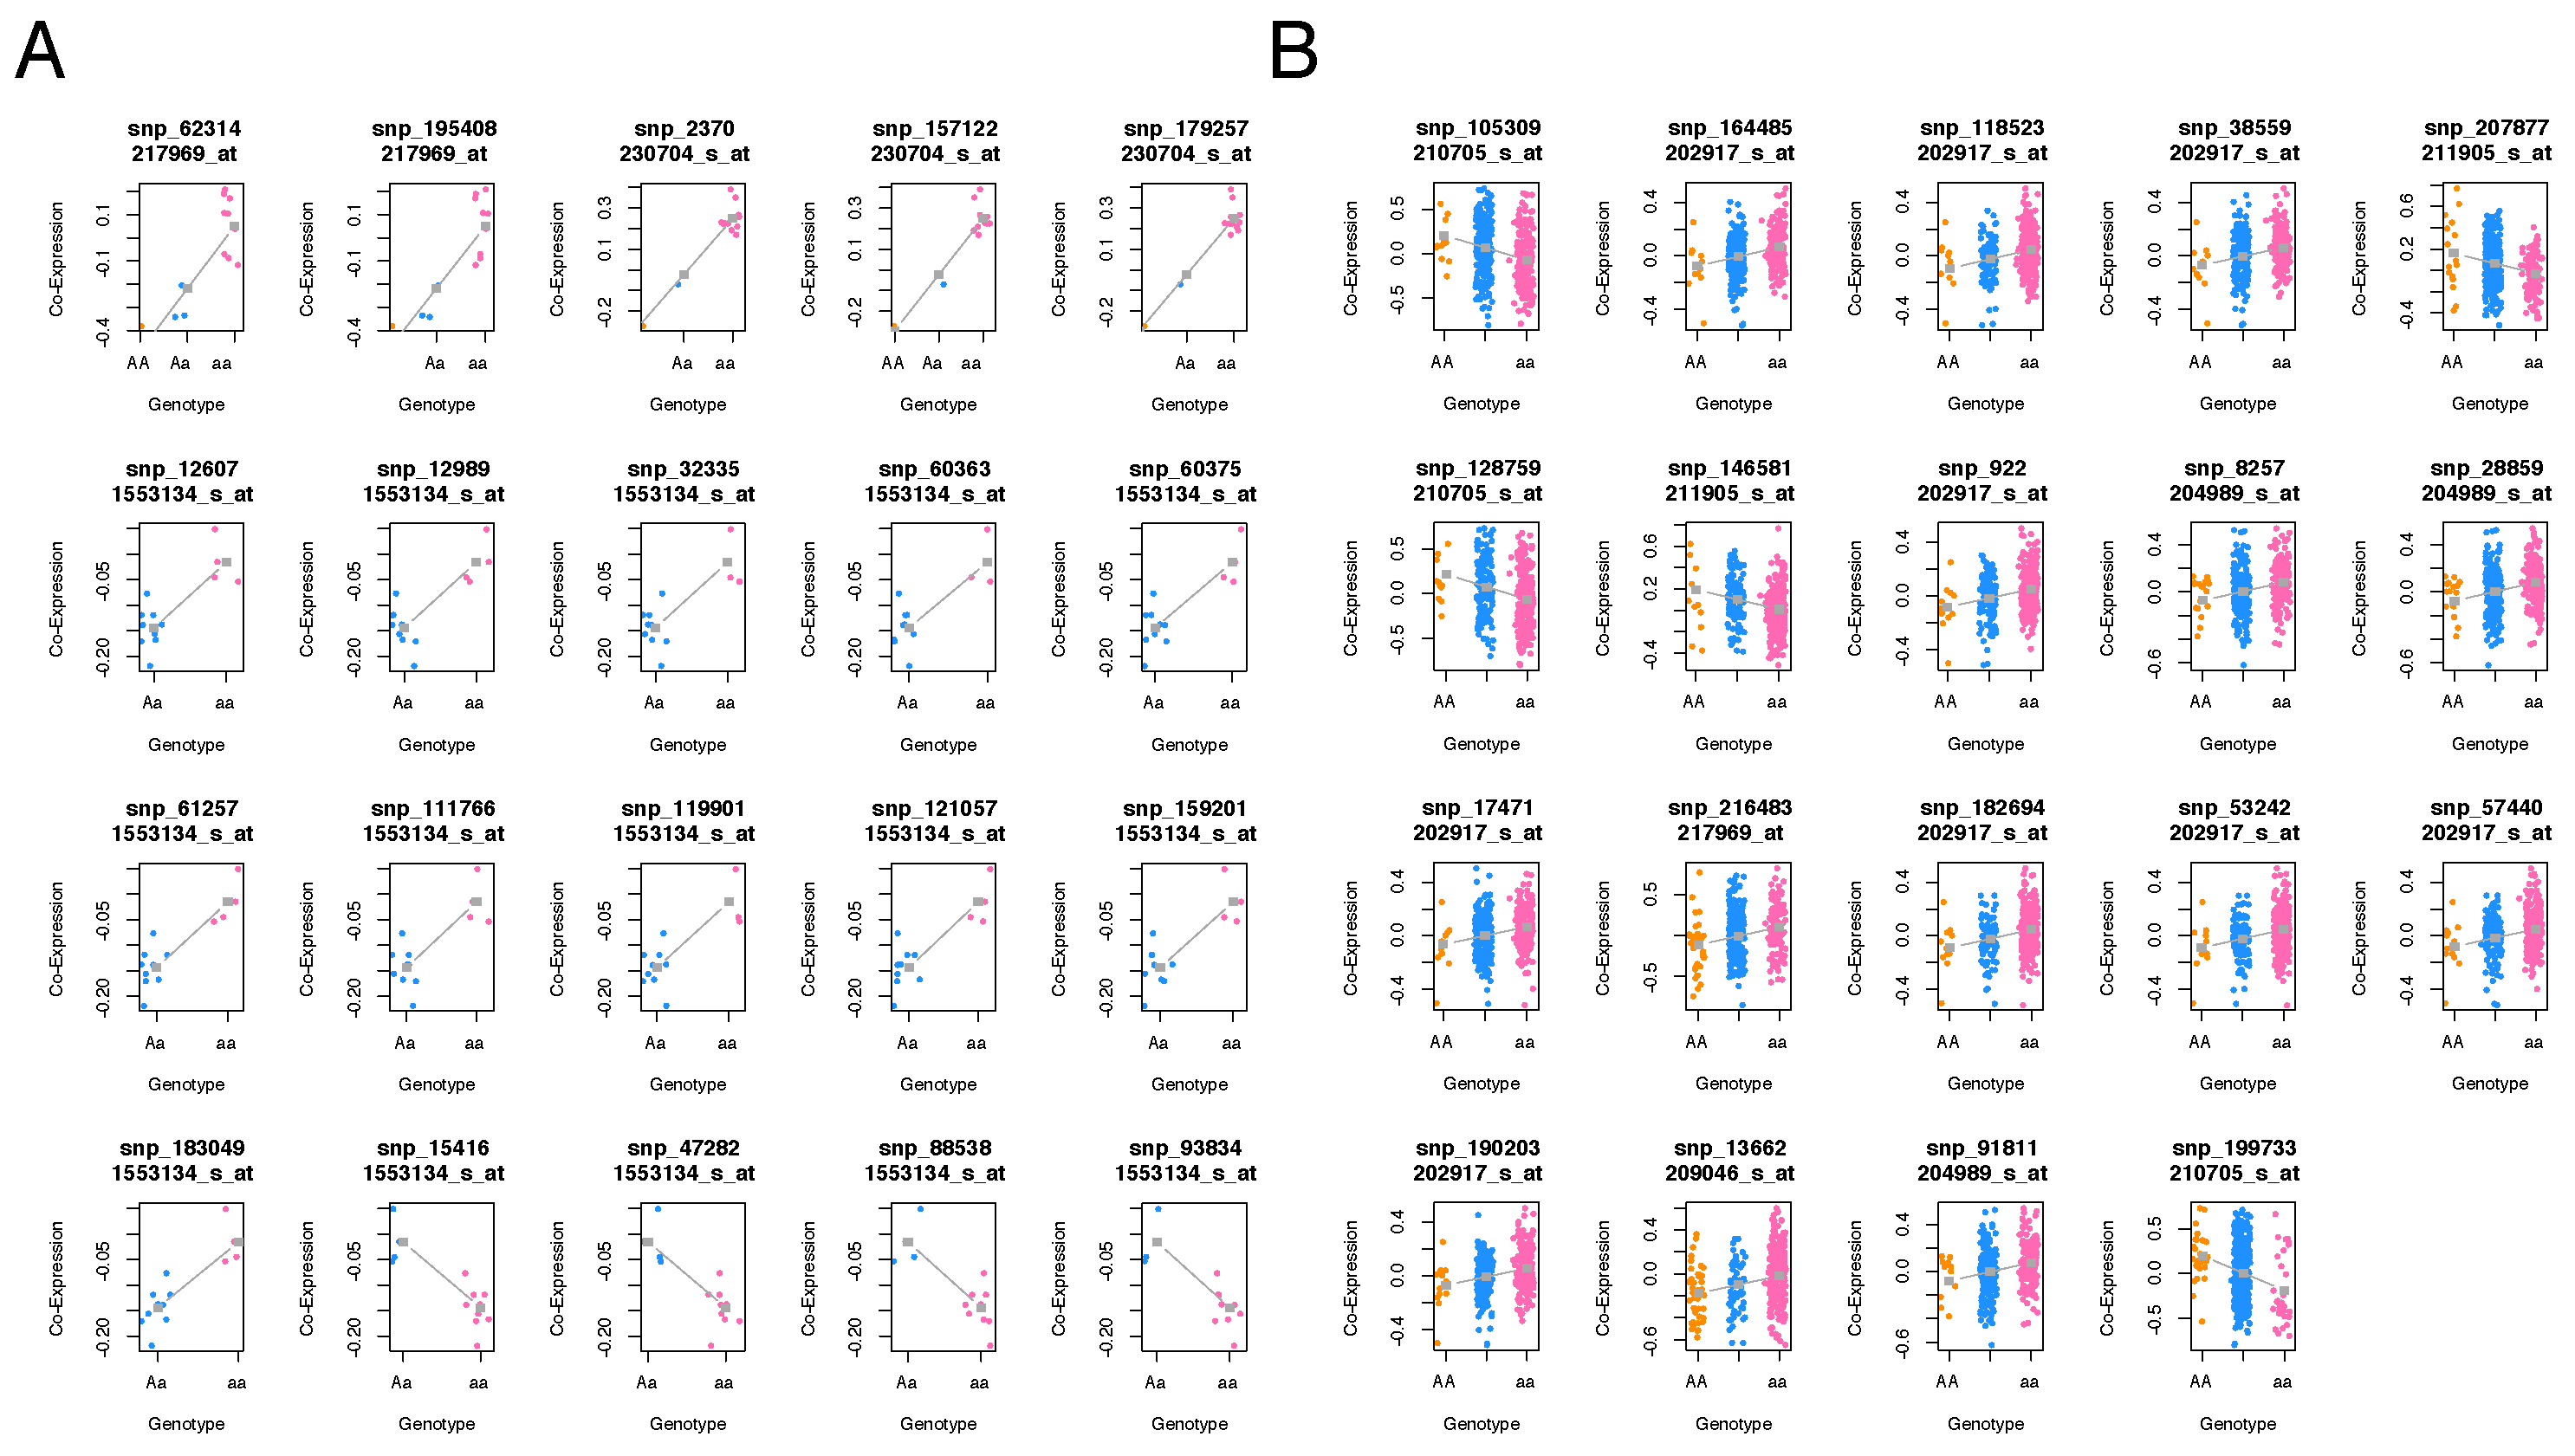
Figure 4.
Stratification of individuals at lower levels of co-expression. (A) e-QTL analysis of the class I community concerning the autophagy functional module. (B) Co-expression analysis of the autophagy module in class II samples. Colors indicate genotypes: orange for , blue for , and pink for aa genotypes.
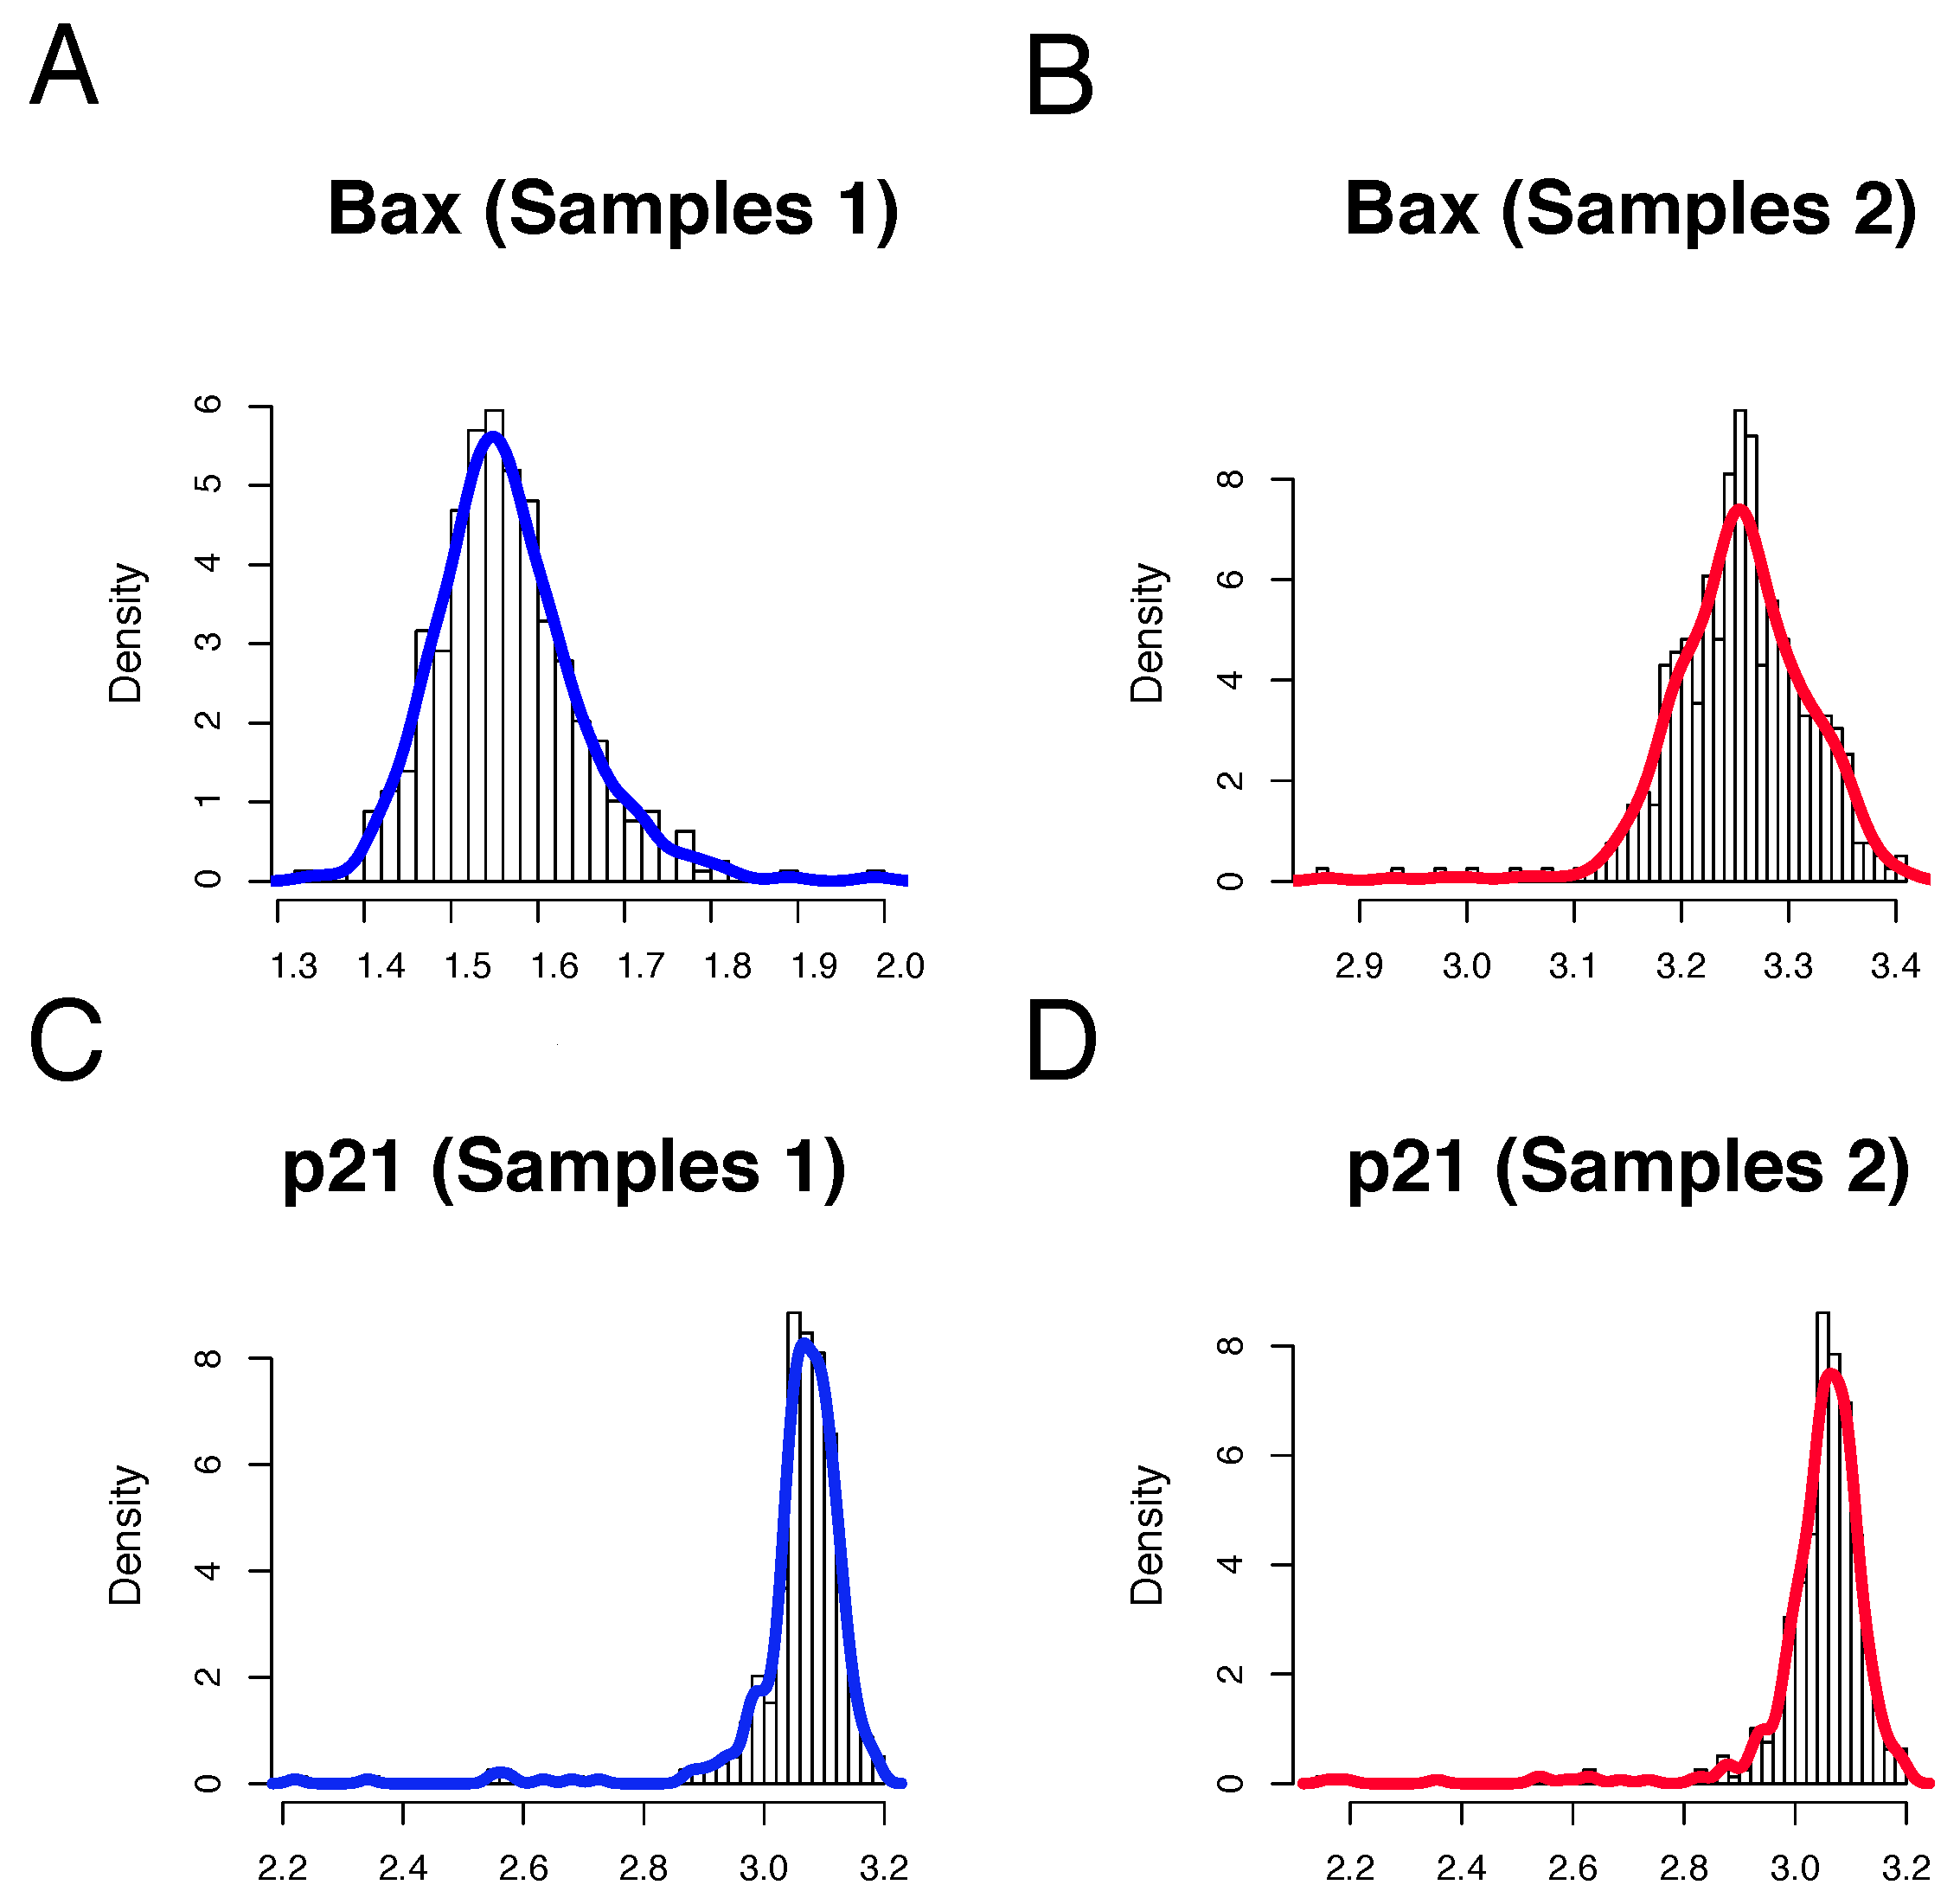
Figure 5.
Lognormal-like distributions of the model. (A,B) histograms of samples type I and II. Color corresponding to the status of the patients: blue: type I outcomes, red: type II individuals. (C,D) histograms and distributions. The same color palette is used.
Figure 5.
Lognormal-like distributions of the model. (A,B) histograms of samples type I and II. Color corresponding to the status of the patients: blue: type I outcomes, red: type II individuals. (C,D) histograms and distributions. The same color palette is used.
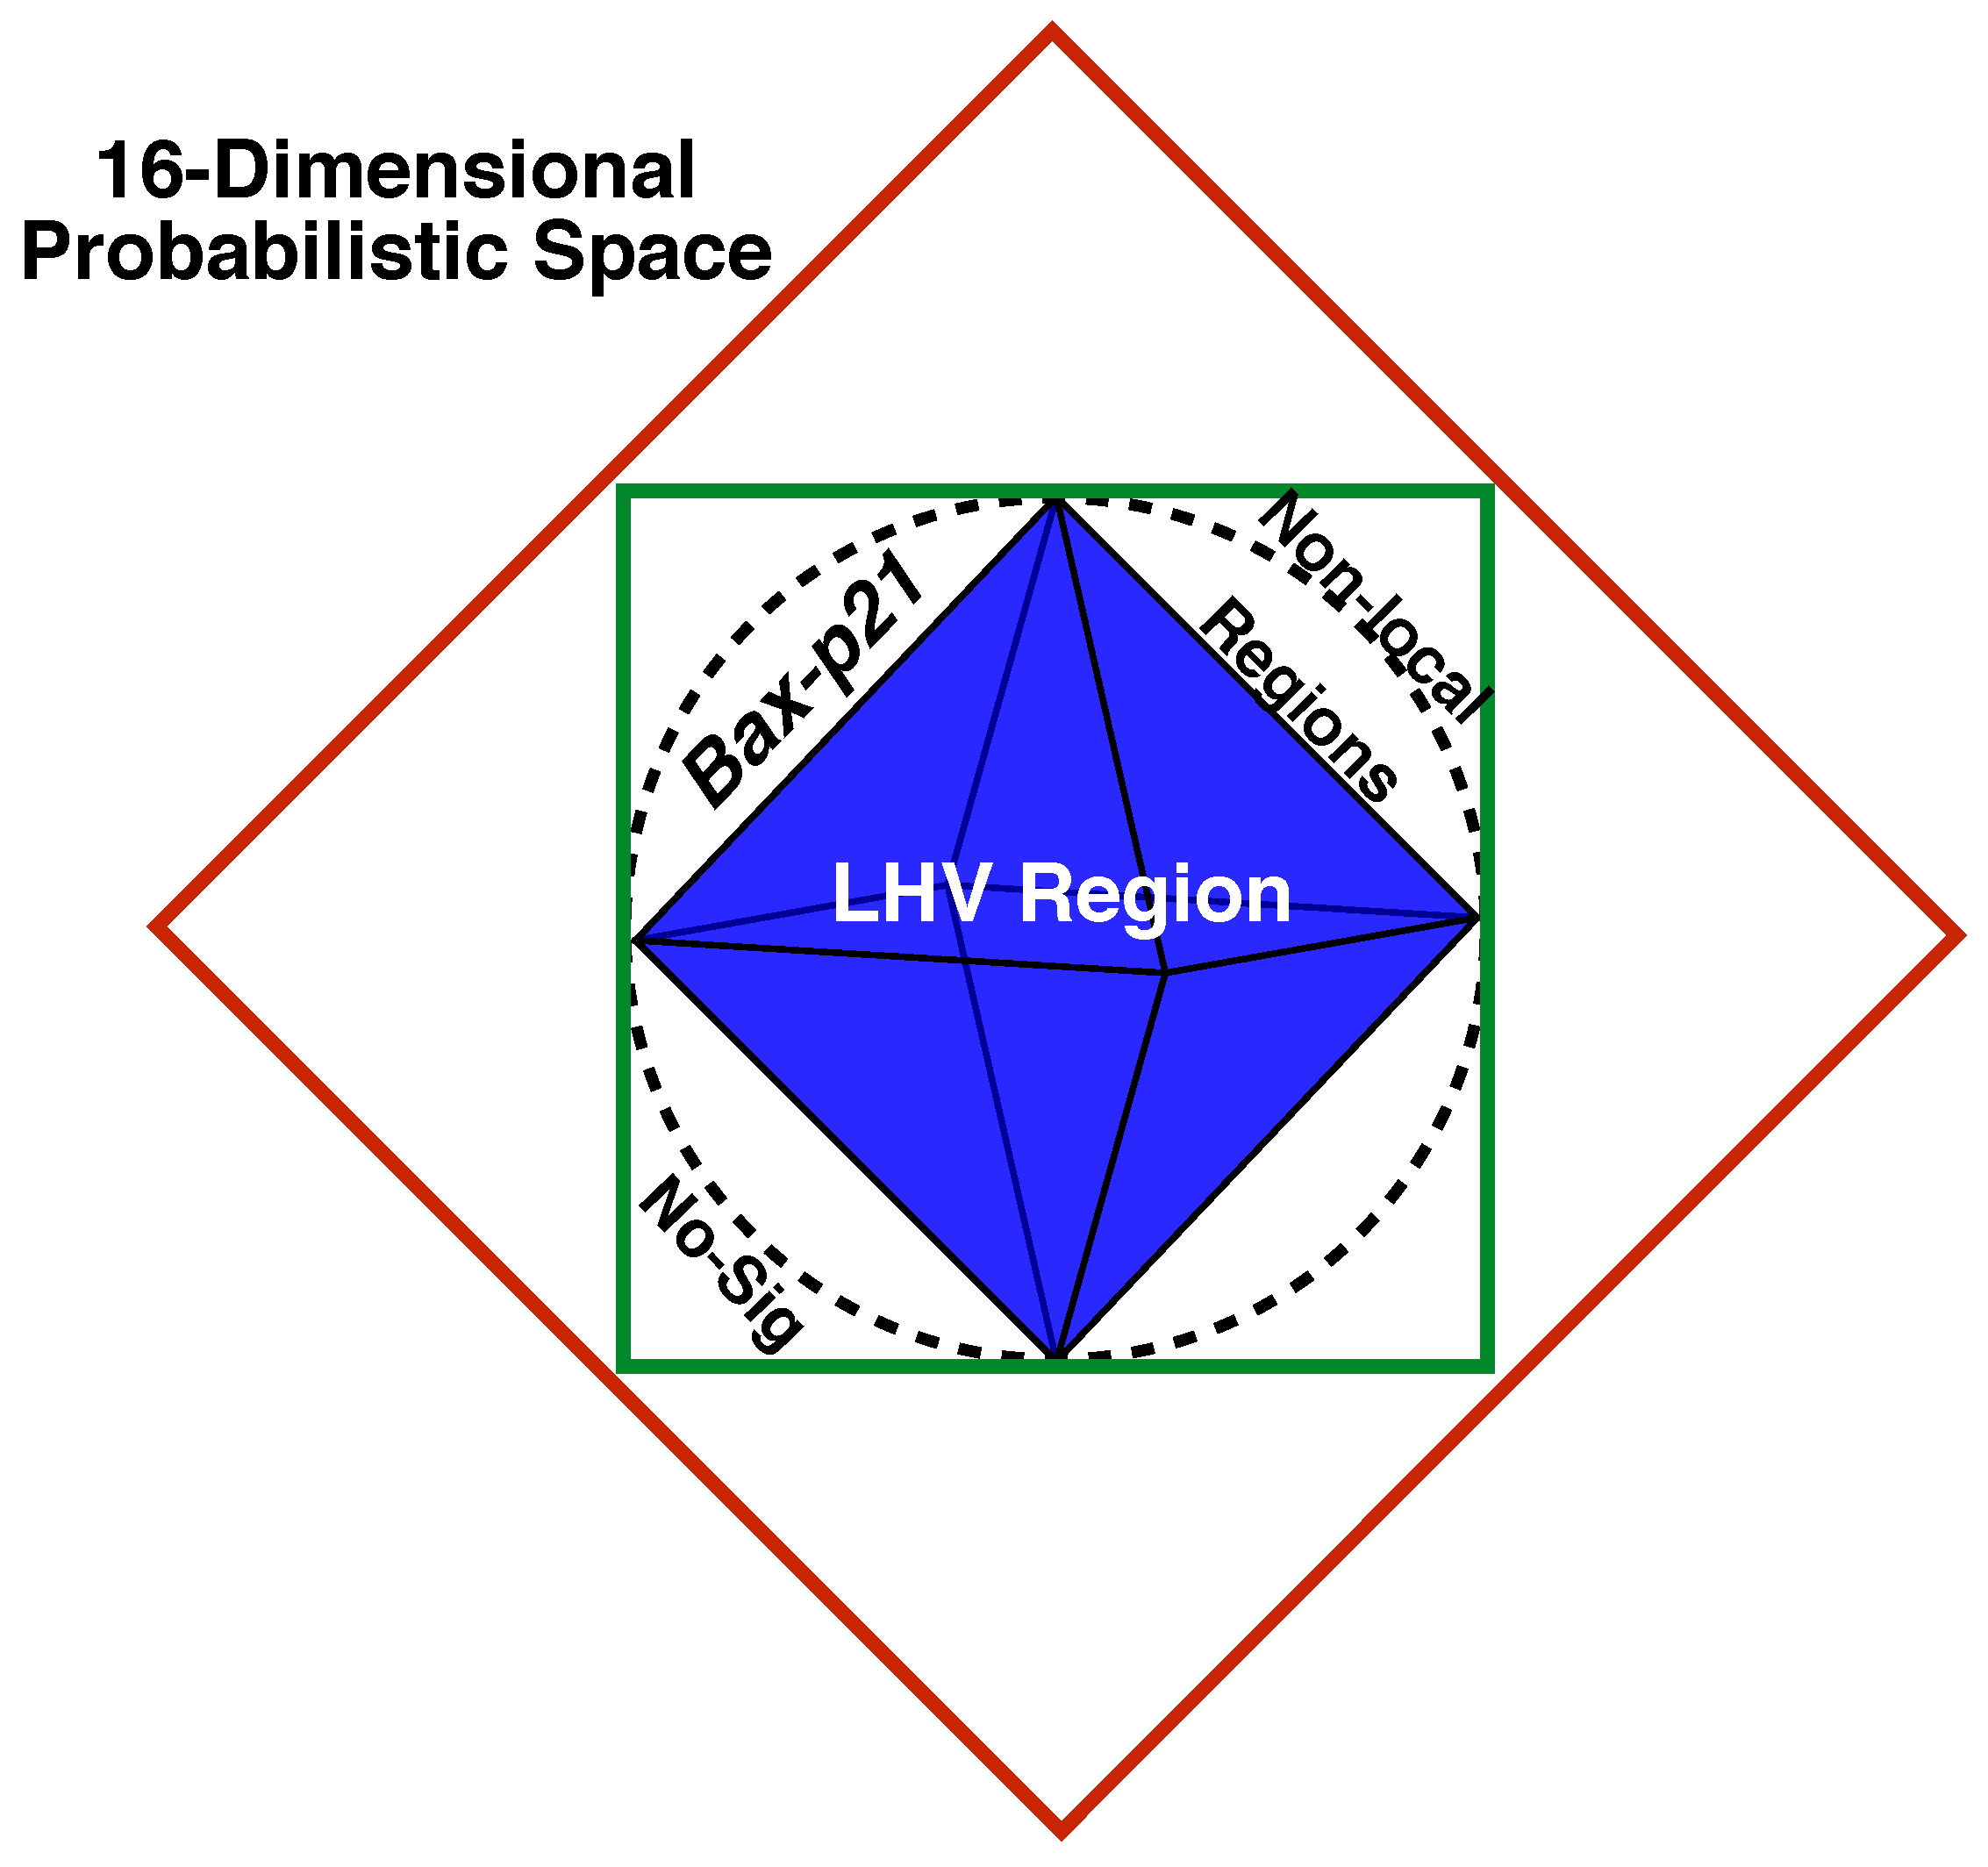
Figure 6.
Geometric Bell’s Inequalities of our results. The red facets correspond to the dimensional probabilistic CHSH-space of two gene interactions. The green square denotes the potential interaction subspace of . The LHV region is described by the blue polyhedron. The proven global correlation of in functional modules, as applied in modeling complex diseases, places our model in the top-left region between the LHV region and the interactions subspace. Lastly, the non-local and no-signaling regions are indicated at the top-right and bottom-left vertices, respectively.
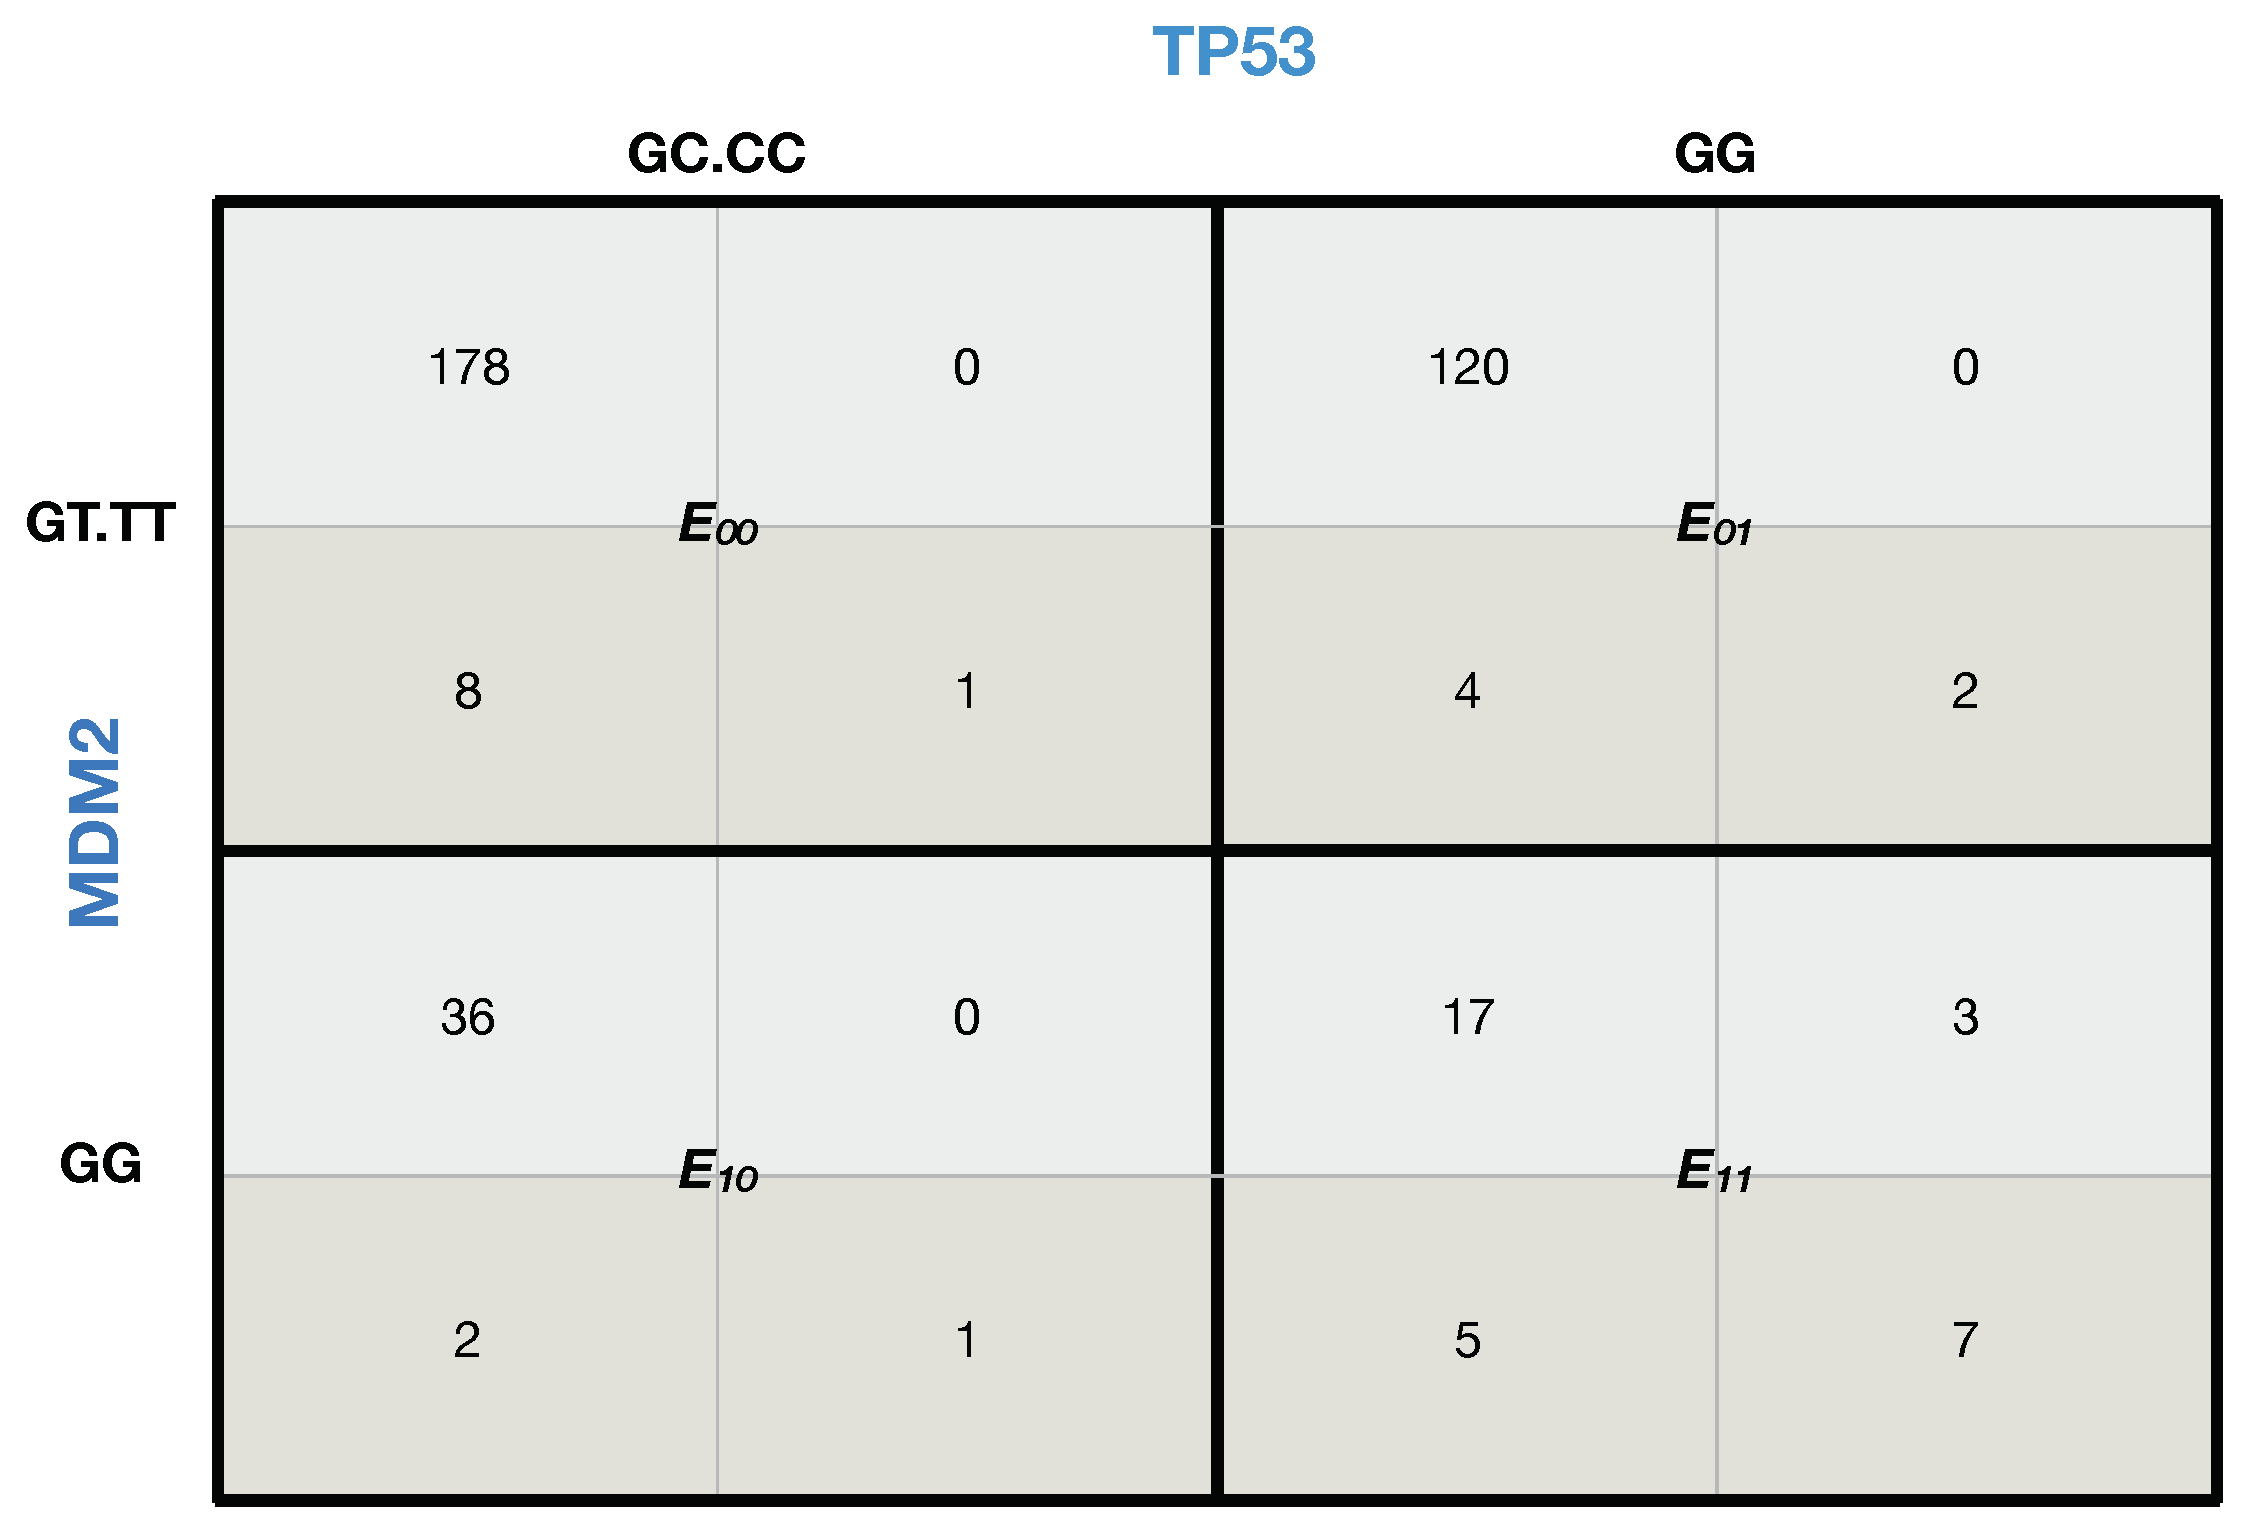
Figure 7.
Likelihood matrix for and . The final configuration of our polytope: and are the selected SNPs of the genes and . The observed genotypes for them are , , and . This corresponds to the correlation between gene expression (RNA level) and SNPs in and in , with and in . Note that the “up-down” notation represents differential gene expression concerning the geometric mean.
Table 1.
Final configuration of our genetic variants model describing a CHSH setup.
Table 1.
Final configuration of our genetic variants model describing a CHSH setup.
| Gene Interaction | SNP Pair | Genotype | Correlation |
|---|
| - | - | High |
| - | - | Moderate |
| - | - | Low |
| Disclaimer/Publisher’s Note: The statements, opinions and data contained in all publications are solely those of the individual author(s) and contributor(s) and not of MDPI and/or the editor(s). MDPI and/or the editor(s) disclaim responsibility for any injury to people or property resulting from any ideas, methods, instructions or products referred to in the content. |
© 2023 by the authors. Licensee MDPI, Basel, Switzerland. This article is an open access article distributed under the terms and conditions of the Creative Commons Attribution (CC BY) license (https://creativecommons.org/licenses/by/4.0/).


