1. Introduction
In today’s world, networks are super important, highlighting the crucial need for research in keeping them secure. In the field of keeping things safe online, there are many tools like antivirus software, firewalls, anti-phishing tools, anti-spam filters, and intrusion detection systems (IDSs). These tools are there to protect against various threats that can come from inside or outside a network [
1]. An intrusion means someone is trying to access computer systems without permission or interfere with how they usually work. IDSs are carefully made to watch over all the parts of a network, both hardware and software, to make sure everything stays safe.
A big problem for intrusion detection systems is dealing with harmful software that can cause network security issues and serious problems [
2,
3,
4]. Cyber-attacks are becoming more complex, making it harder to identify new types of malicious software that aim to steal important information and avoid detection via intrusion detection systems. This is especially true during communication between different networks. So, we need new and smart ways to prevent attacks and quickly detect any intrusions. Recently, machine learning and deep learning techniques have been created and used to detect intrusions and unusual behaviors in networks to stop them before they cause damage [
5].
However, despite the plethora of IDS products available today, they grapple with several inherent challenges. One of the most pervasive issues is the occurrence of a high rate of false alarms, where alerts are triggered for non-threatening incidents. This predicament can potentially lead to the oversight of genuinely harmful attacks, posing a significant risk. In light of this, a substantial portion of research in this field is dedicated to the development of IDSs that are adept at reducing false alarm rates while simultaneously increasing detection rates. Moreover, a considerable number of researchers are actively exploring the creation of IDSs equipped to identify previously unknown attacks [
6].
IDSs can be broadly categorized based on their detection methods, offering detection-based and data source-based approaches. In the landscape of IDS development, machine learning methods have gained substantial traction. Machine learning, nestled within the realm of artificial intelligence, demonstrates remarkable proficiency in distinguishing between normal and anomalous data with a high degree of accuracy. This branch encompasses both supervised and unsupervised learning. Supervised learning harnesses the power of labeled data to extract meaningful insights, whereas unsupervised learning extracts valuable feature information from unlabeled data [
7]. Amidst these methodologies, common machine learning models employed in IDSs comprise clustering, support vector machine (SVM), naïve Bayes, k-nearest neighbor (KNN), logistic regression (LR), decision tree, artificial neural network (ANN), and various combined and hybrid methods [
8].
Within the purview of machine learning, deep learning, which is a subfield of machine learning, stands out for its enhanced performance capabilities. Deep learning methods exhibit a particularly remarkable capacity to handle extensive datasets, far surpassing the capabilities of traditional machine learning models. They excel in the realm of learning feature representations from raw data and subsequently generating refined output results [
9]. This paradigm includes supervised deep learning models such as deep belief networks (DBNs), deep neural networks (DNNs), convolutional neural networks (CNNs), and recurrent neural networks (RNNs). On the flip side, unsupervised models encompass autoencoders, restricted Boltzmann machines (RBMs), and generative adversarial networks (GANs) [
10].
This study makes the following scientific contributions:
HD-IDM innovatively combines GRU and LSTM models, providing a fresh perspective on intrusion detection.
The ensemble method of weighted averaging enhances accuracy, particularly in capturing intricate temporal patterns.
HD-IDM consistently outperforms traditional classifiers across benchmark datasets, showcasing its effectiveness in distinguishing between normal and malicious network activities.
2. Literature Review
Soheily-Khah et al. [
7] delved into data mining techniques for intrusion detection and introduced a hybrid IDS known as KM-RF. Their approach, combining machine learning techniques, demonstrated superior performance in terms of detection rate, false alarm rate, and accuracy. The ISCX dataset served as the testing ground, and the KM-RF method emerged as the frontrunner with remarkable accuracy, decision rate, and false alarm rate results. However, long tree generation times, especially for larger datasets, posed a challenge. The dataset’s imbalance, comprising only 2% attack data and covering seven days of network activities, also influenced precision.
In another study [
9], big data technologies and deep learning were harnessed to enhance intrusion detection system accuracy. Experiments conducted on the CICDS2017 and UNSW-NB15 datasets incorporated gradient-boosted tree (GBT), random forest (RF), and DNN. The results showcased impressive accuracy, especially with DNN for binary and multi-class classification. GBT excelled on the CICIDS2017 dataset. However, feature selection schemes and cluster node counts warranted further exploration.
Sezari et al. [
10] presented a network intrusion detection approach using a feedforward neural network. Their model aimed to detect known, unknown, and modern attacks, employing the KDD 1999 Cup dataset. While achieving a remarkable accuracy, detection rate, and low false alarm rate, the reliance on a small dataset subset with redundant records affected accuracy measurements.
In a comprehensive discussion [
11], the significance of intrusion detection systems (IDS) in network security was emphasized. The hybrid layered IDS introduced utilized various machine learning techniques on the NSL-KDD dataset. Achieving high accuracy and low false-positive rates across all attacks, it underscored the importance of extensive testing with a larger dataset.
Belavagi and Munigal [
12] explored intrusion detection classification and predictive models. Their supervised machine learning-based network intrusion detection system excelled, particularly random forest (RF). However, it could only identify specific attack types, warranting improvements in attack detection time.
Ghafir et al. [
13] highlighted the limitations of existing APT detection systems and introduced MLAPT, a machine learning system for advanced persistent threat detection. While achieving a high accuracy of 84.8%, it needed expansion for various attack techniques and further performance testing under varying cluster node counts.
Abusitta et al. [
14] focused on attacks and intrusion detection in the cloud, presenting a proactive multi-cloud cooperative IDS. Utilizing the NSL-KDD dataset, their model achieved promising accuracy, though challenges in detecting new attacks persisted. In another study, Belavagi and Munigal [
15] introduced a predictive model rooted in machine learning for intrusion detection using the NSL-KDD dataset. Nonetheless, it is imperative to note that the model’s ability to identify specific types of attacks has limitations, and there are delays in detecting intrusions.
On a different front, Ghafir et al. [
16] introduced MLAPT for intrusion detection, leveraging a private dataset. It is important to consider that the utilization of a non-public dataset may have implications for the model’s accuracy. Lastly, Abusitta et al. [
17] implemented a proactive multi-cloud IDS based on deep learning and relied on the KDDCup99 dataset. While the model achieved commendable accuracy, it is worth mentioning that this could be partly attributed to the usage of an older dataset with redundant records. In light of these findings, it becomes apparent that there is still room for exploring alternative neural networks that could potentially provide insights into further enhancing accuracy [
18].
Multi-perspective machine learning (MPML) approaches for intrusion detection, as explored by [
19], demonstrated potential improvements in accuracy, albeit limited to a single dataset. Yin et al. [
20] leveraged RNN-IDS and deep learning for intrusion detection, achieving notable accuracy but requiring longer training times. A flexible IDS based on deep neural networks, discussed by [
21], showed promise but required dataset extensions. Abu Taher et al. [
22] successfully employed supervised machine learning, particularly artificial neural network (ANN), for intrusion detection, highlighting the need for performance evaluation with diverse datasets.
Unsupervised deep learning, including auto encoder (AE) and restricted Boltzmann machine (RBM), was employed for feature extraction in intrusion detection by [
23]. The model achieved accuracy improvements but lacked online learning capabilities and relied on outdated datasets. Kasongo and Sun [
24] introduced a wireless intrusion detection system utilizing feedforward deep neural networks (FFDNN) and feature extraction units (FEU), achieving notable accuracy but necessitating enhancements in detecting specific attacks and evaluation on different datasets. Lastly, a vehicle security-focused IDS introduced by [
25] achieved high accuracy with a low false-positive rate (FPR), yet improvements in detecting other attacks and testing on larger datasets were identified as areas for development.
Existing intrusion detection methods face several significant limitations that impact their effectiveness in safeguarding network security. One of the primary challenges lies in their propensity to generate high false alarm rates and exhibit suboptimal performance when dealing with imbalanced datasets [
7,
10]. This is a critical issue as these false alarms can inundate network administrators with non-threatening incidents, potentially diverting their attention from genuine security threats [
7].
Furthermore, many of these methods rely on datasets that are either reduced in scale or inherently small [
7,
9,
11]. This reliance on limited data sources can severely constrain their capacity to identify and respond to new or modern attack techniques effectively [
5,
13]. These evolving threats demand more extensive and diverse datasets for training and evaluation to ensure the robustness of intrusion detection systems [
7].
In addition to these challenges, certain intrusion detection models suffer from lengthy training times, hindering their real-time responsiveness [
7]. Moreover, they may lack the flexibility needed to accurately identify a wide range of diverse attack types [
12] and exhibit limited online learning capabilities [
23]. These limitations collectively underscore the pressing need for comprehensive performance evaluation on various datasets to address these deficiencies and develop more robust intrusion detection solutions capable of effectively countering modern cyber threats [
26,
27,
28].
3. Methodology
We propose the HD-IDM, an ensemble model that harnesses the capabilities of both GRU (gated recurrent unit) and LSTM (long short-term memory) models. The HD-IDM enhances the network security by effectively detecting and mitigating malicious attacks within network traffic. In our approach, we train separate GRU and LSTM classifiers on network traffic data to detect intrusions or abnormal patterns. Mathematically, we denote the predictions of the GRU and LSTM classifiers as P_GRU(x) and P_LSTM(x), respectively, where x represents network data instances.
The novelty lies in our ensemble method, which combines these individual classifier outputs to create a powerful intrusion detection system (IDS). We adopt a weighted averaging approach to fuse the predictions, assigning weights w_GRU and w_LSTM to P_GRU(x) and P_LSTM(x), satisfying w_GRU + w_LSTM = 1. This ensemble model, represented as P_ensemble(x), leverages the complementary strengths of the GRU and LSTM, providing a more robust and accurate intrusion detection mechanism.
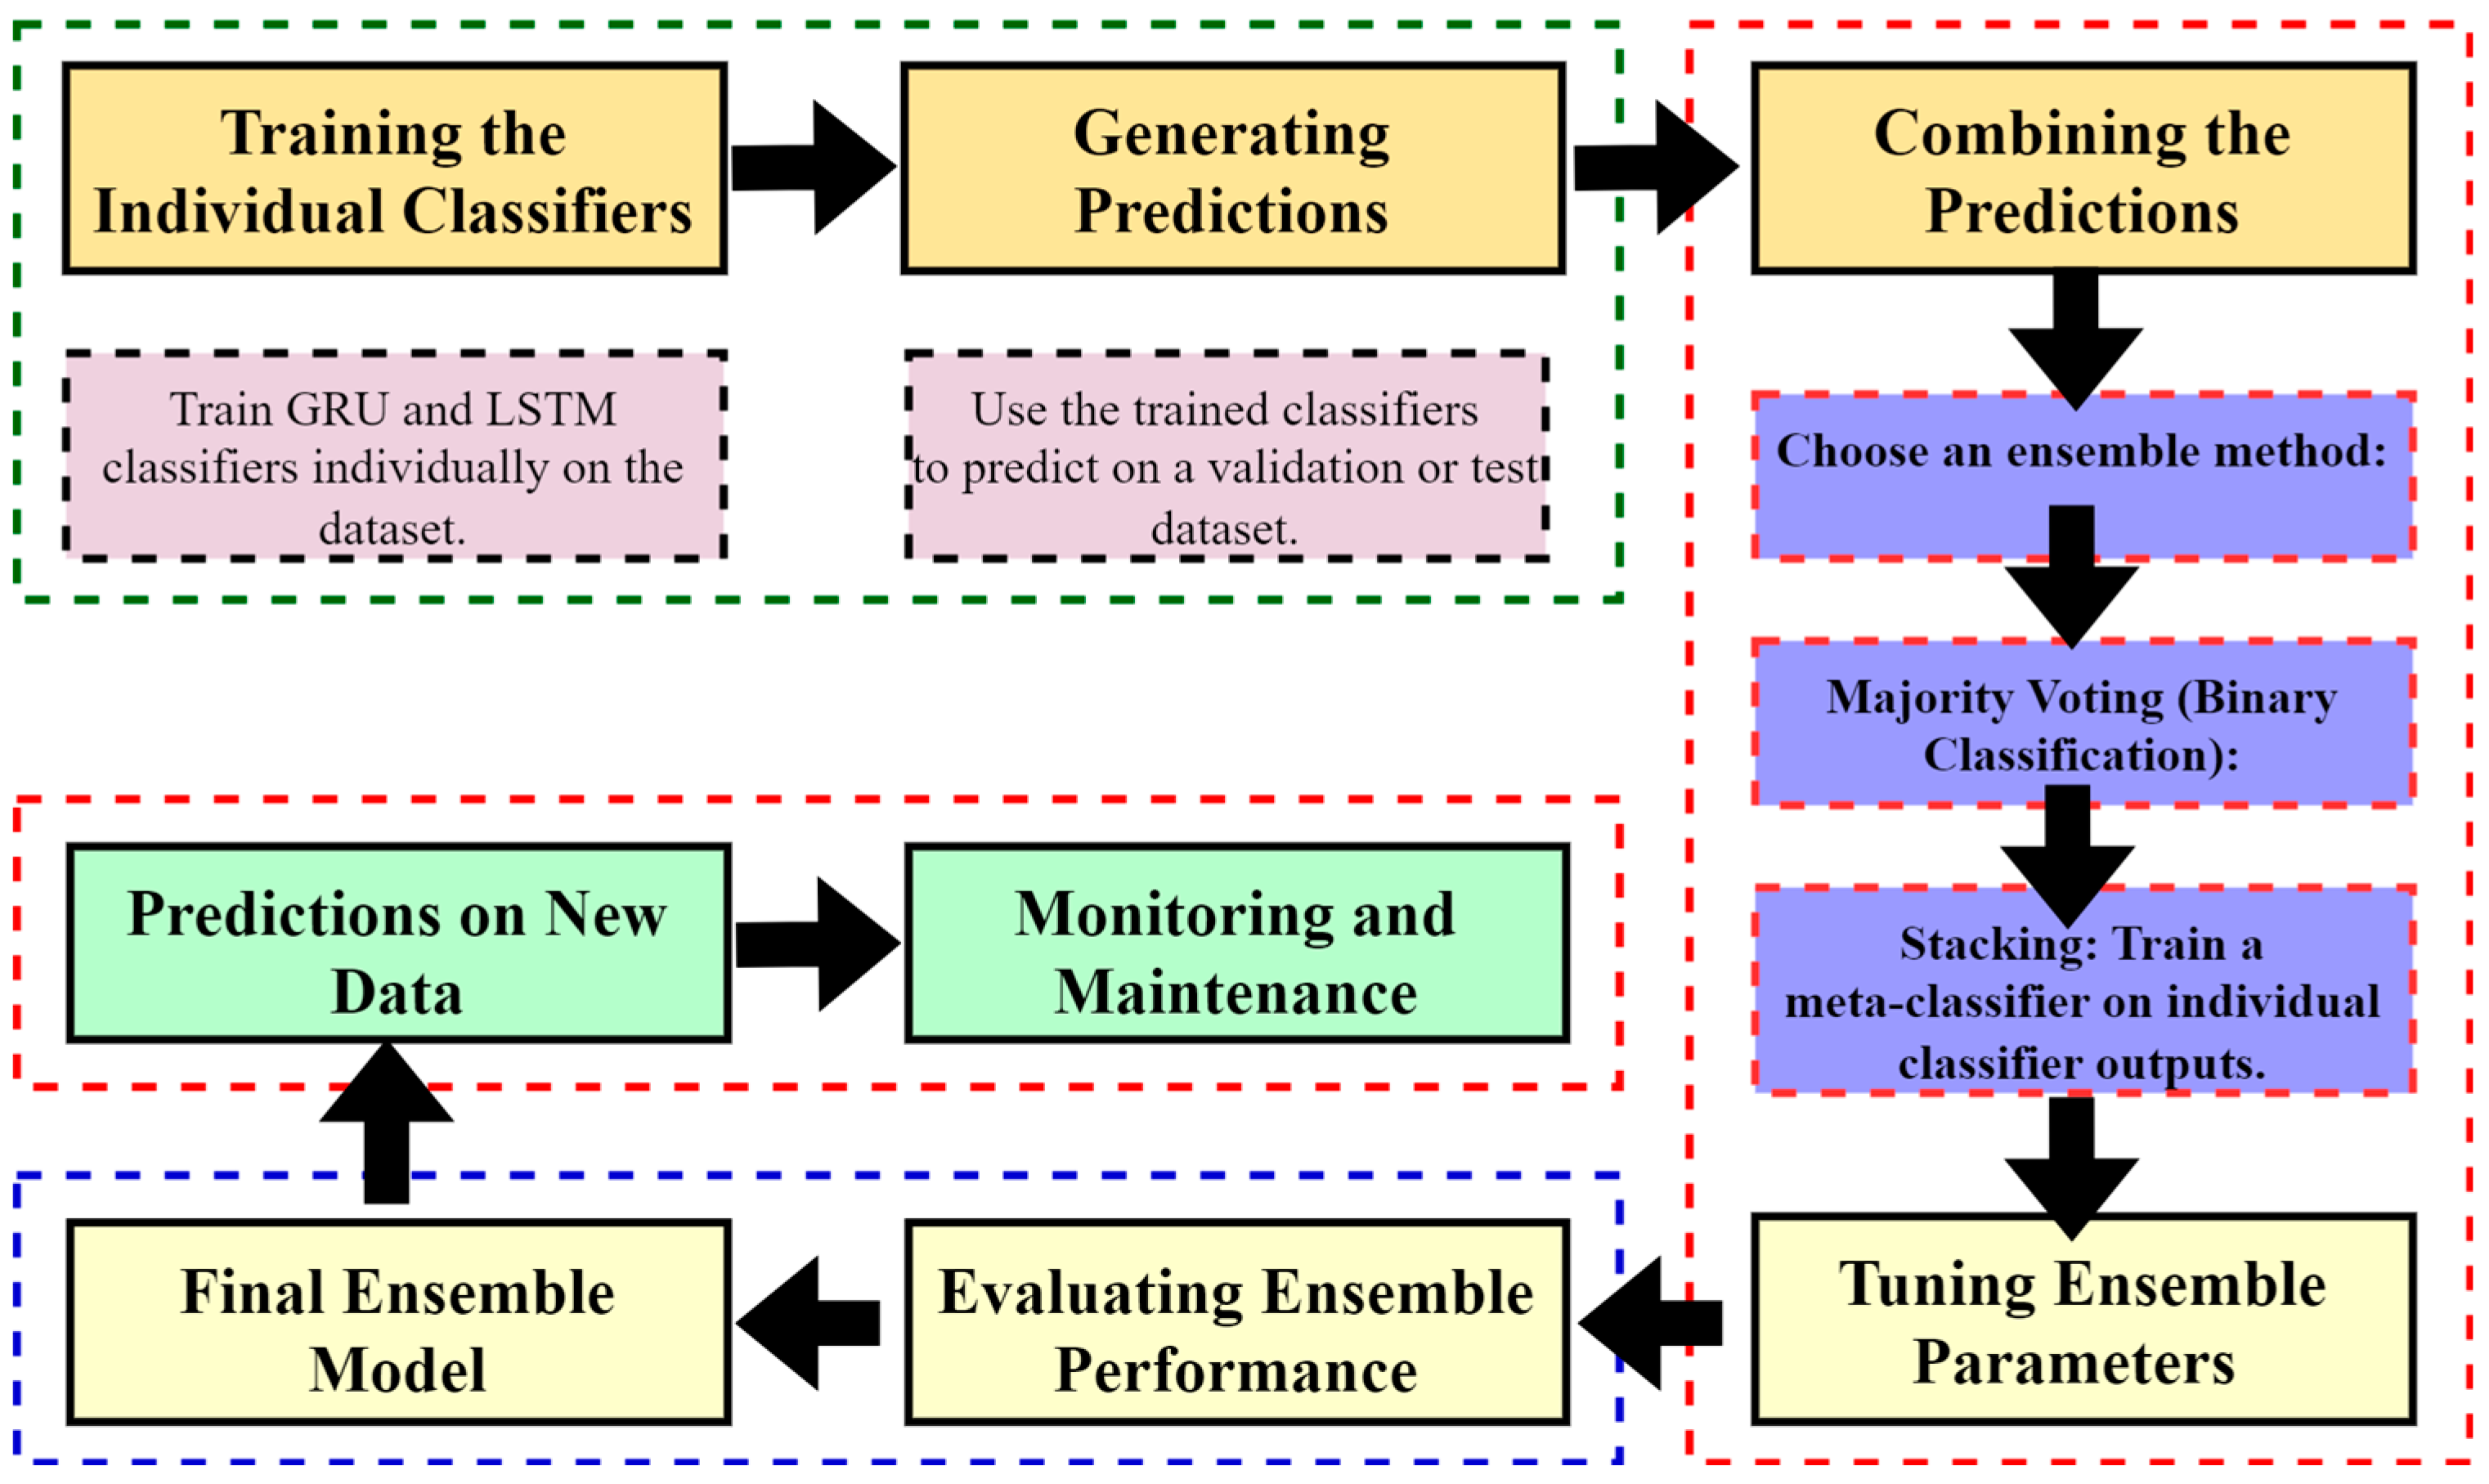
The proposed ensemble model follows a well-defined methodology as sown in
Figure 1. Initially, the process involves training individual GRU and LSTM classifiers on a dataset, resulting in distinct predictions denoted as P_GRU(x) and P_LSTM(x) for a given input x. These predictions are subsequently integrated using diverse ensemble methods, which may include majority voting, weighted averaging, or stacking, depending on the specific nature of the problem at hand. Critical to the ensemble’s success, ensemble parameters, such as the weights (w_GRU and w_LSTM), are meticulously fine-tuned. To gauge the ensemble’s effectiveness, various performance metrics, such as accuracy and F1-score, are employed. The ultimate ensemble model is forged based on the optimized combination of classifiers and the chosen ensemble method, serving as the core tool for making predictions on new and unseen data. Continual monitoring and adaptation become imperative to maintain the ensemble’s efficiency, especially in scenarios where the underlying dataset dynamics undergo changes over time. This approach demonstrates the technical process of ensemble GRU and LSTM classifiers for improved model performance in various machine learning tasks.
The HD-IDM algorithm is given blow,
| 1. Training the Individual Classifiers |
| | Train GRU and LSTM classifiers individually on the dataset. |
| | Define P_GRU(x) and P_LSTM(x) as predictions of GRU and LSTM for input x. |
| 2. Generating Predictions |
| | Use the trained classifiers to predict on a validation or test dataset. |
| | These predictions are represented as P_GRU(x) and P_LSTM(x). |
| 3. Combining Predictions |
| | Choose an ensemble method: |
| | Majority voting (binary classification): |
| | P_ensemble(x) = 1 if majority(P_GRU(x), P_LSTM(x)) > 0.5 else 0 |
| | Weighted averaging (regression or multi-class classification): |
| | P_ensemble(x) = w_GRU * P_GRU(x) + w_LSTM * P_LSTM(x), where w_GRU +
w_LSTM = 1 |
| | Stacking: Train a meta-classifier on individual classifier outputs. |
| 4. Tuning Ensemble Parameters |
| | Fine-tune ensemble parameters, such as weights (w_GRU, w_LSTM) or meta-
classifier hyperparameters, on a validation dataset. |
| | Optimize the ensemble’s performance. |
| 5. Evaluating Ensemble Performance |
| | Evaluate ensemble performance using metrics like accuracy and F1-score on a
separate dataset. |
| | Compare with individual classifier performance to assess ensemble
improvement. |
| 6. Final Ensemble Model |
| | Create the final ensemble model using the optimized combination of classifiers and
ensemble method. |
| 7. Predictions on New Data |
| | Utilize the trained ensemble model to predict on new, unseen data. |
| 8. Monitoring and Maintenance |
| | Continuously monitor ensemble model performance and adapt to changing
dataset or problem dynamics. |
The GRU falls under the category of RNN models. Its primary function is to process sequential data by maintaining a hidden state that captures crucial information from previous time steps. What sets the GRU apart is its distinctive gating mechanism, which effectively manages the flow of information both into and out of the hidden state. The GRU possesses a unique capability that sets it apart in the realm of RNN models. This distinctive feature allows the GRU to excel in capturing intricate long-range dependencies within data, all while effectively overcoming the well-known challenge of the vanishing gradient problem. This is made possible through a series of well-defined mathematical operations, including weighted summations and activation functions, which work in tandem to facilitate the continuous updating and generation of the hidden state and predictions. Consequently, the GRU emerges as a highly suitable choice for tasks involving sequential data, including but not limited to language modeling, speech recognition, and time series analysis.
In contrast, the LSTM operates within the broader category of RNN models and is engineered with a specific focus on the efficient processing of sequential data. What sets the LSTM apart is its specialized architecture, featuring memory cells and gating mechanisms that distinguish it from conventional RNNs. These distinctive components empower the LSTM to effectively learn and retain information over extended sequences while effectively mitigating the vanishing gradient problem, making it particularly well-suited for tasks involving temporal dependencies, such as natural language processing, speech recognition, and time series forecasting. These features enable the LSTM to effectively learn and retain information over extended sequences while adeptly sidestepping the vanishing gradient problem. Central to the LSTM’s functionality are its core components, including input gates, forget gates, output gates, and the memory cell, each performing specific mathematical operations like element-wise multiplications and additions. Consequently, LSTMs have found widespread use in applications such as natural language processing, speech recognition, and time series forecasting, where the modeling of intricate temporal dependencies proves to be of paramount importance.
| Mathematical Model of GRU Classifier |
| Inputs: | |
| | x_t: Input at time step t |
| | h_t: Hidden state at time step t |
| | z_t: Update gate at time step t |
| | r_t: Reset gate at time step t |
| | u_t: Candidate hidden state at time step t |
| Output: | |
| | GRU_Model: The GRU Deep Learning Model |
| | Initialize the model and update gates |
| |
Update Gate z_t: |
| | z_t = σ(W_z * [h_{t-1}, x_t]) (1) |
| |
Reset Gate r_t: |
| | r_t = σ(W_r * [h_{t-1}, x_t]) (2) |
| |
Candidate Hidden State u_t: |
| | u_t = tanh(W * [r_t ⊙ h_{t-1}, x_t]) (3) |
| |
New Hidden State h_t: |
| | h_t = (1 - z_t) ⊙ h_{t-1} + z_t ⊙ u_t (4) |
| Mathematical Model of LSTM Classifier |
| Inputs: | |
| | x_t: Input at time step t |
| | h_t: Hidden state at time step t |
| | c_t: Cell state at time step t |
| | f_t: Forget gate at time step t |
| | i_t: Input gate at time step t |
| | o_t: Output gate at time step t |
| | g_t: Candidate cell state at time step t |
| Output: | |
| | LSTM_Model: The LSTM Deep Learning Model |
| | Initialize the model and update gates |
| |
Forget Gate f_t:
|
| |
f_t = σ(W_f * [h_{t-1}, x_t]) (5)
|
| |
Input Gate i_t:
|
| |
i_t = σ(W_i * [h_{t-1}, x_t]) (6)
|
| |
Candidate Cell State g_t:
|
| |
g_t = tanh(W_c * [h_{t-1}, x_t]) (7)
|
| |
New Cell State c_t:
|
| | c_t = f_t ⊙ c_{t-1} + i_t ⊙ g_t (8) |
| |
Output Gate o_t:
|
| |
o_t = σ(W_o * [h_{t-1}, x_t]) (9)
|
| |
New Hidden State h_t:
|
| | h_t = o_t ⊙ tanh(c_t) (10) |
The GRU classifier’s math model outlines the steps in handling sequences of data. At each step ‘t’, it takes an input (x_t) and updates its hidden state (h_t). This involves operations with an update gate (z_t), a reset gate (r_t), and a candidate hidden state (u_t). The update gate decides how much of the past hidden state to keep, while the reset gate chooses which parts to forget. The candidate hidden state is then calculated based on the reset gate and combined with the update gate to form the new hidden state. The output of the GRU model (GRU_Model) holds the learned information from the input data sequence, reflecting its knack for capturing short-term patterns in the data.
On the other hand, the LSTM Classifier has a more intricate design, using memory cells and gates for sequential data processing. It takes an input (x_t) at each step and updates both its hidden state (h_t) and cell state (c_t). The forget gate (f_t) decides how much of the previous cell state to forget, the input gate (i_t) determines which parts of the new information to store, and the candidate cell state (c̃_t) is computed based on the input. The cell state is then updated by combining the forget and input gates. Finally, the output gate (o_t) regulates how much of the cell state is revealed to produce the new hidden state. The resulting hidden state (h_t) captures the learned information, showcasing the LSTM’s strength in modeling long-term dependencies in the sequential data.
The HD-IDM mathematical model encompasses training GRU and LSTM classifiers individually on a dataset, yielding predictions denoted as P_GRU(x) and P_LSTM(x). We integrated the predictions from GRU and LSTM classifiers employing majority voting, weighted averaging, or stacking. We realized these methods were quite suitable approaches for combining the individual predictions. Each method catered to this specific problem type and nuance. During the ensemble process, we gave meticulous attention to the critical parameters that govern the behavior of the GRU (w_GRU) and LSTM (w_LSTM) classifiers. These parameters are subject to rigorous fine-tuning, a process that plays a pivotal role in ensuring the ensemble’s ability to make accurate and reliable predictions. This fine-tuning procedure optimized the weights assigned to each classifier, contributing significantly to the overall effectiveness of the ensemble.
Ultimately, the culmination of this process resulted in the creation of the final ensemble model. This ensemble model represents a potent fusion of the capabilities of the GRU and LSTM classifiers, effectively harnessing their individual strengths. To reach this stage, it is imperative to train the individual GRU and LSTM models on the dataset. This training phase entails iterative updates to critical model parameters, including weight matrices (W), bias vectors (b), and activation functions (σ). These updates are executed through optimization techniques such as stochastic gradient descent (SGD), which ensures that the models become adept at capturing and comprehending the intricate temporal patterns embedded within the data.
− LSTM: LSTM involves computations with additional components, namely input gate (i), forget gate (f), and output gate (o), along with memory cells (c_t), allowing better memory retention and control over the hidden state (h_t):
Once trained, the GRU and LSTM models make predictions (P_GRU(x) and P_LSTM(x)) on network traffic data (x) by applying learned weights and biases. HD-IDM adeptly amalgamates these predictions through the utilization of an ensemble methodology, with a particular emphasis on weighted averaging. Within this ensemble framework, there exists a set of adjustable weights, specifically denoted as w_GRU and w_LSTM. These weights play a pivotal role in dictating the relative importance or contribution of each individual classifier’s prediction within the ensemble. The ensemble prediction, represented as P_ensemble(x), is computed as P_ensemble(x) = w_GRU · P_GRU(x) + w_LSTM · P_LSTM(x). To optimize the ensemble’s performance for intrusion detection, these ensemble parameters (weights) undergo a meticulous tuning process using validation data, with the aim of achieving the highest possible intrusion detection accuracy. The effectiveness of the HD-IDM ensemble model is rigorously assessed through a comprehensive evaluation process. Various performance metrics, including accuracy, precision, recall, F1-score, and ROC AUC, are employed on a separate dataset to gauge its intrusion detection capabilities thoroughly. This multifaceted evaluation demonstrates the ensemble’s robustness and its ability to excel in identifying network intrusions.
Moreover, HD-IDM introduces efficiencies by reducing training times and improving adaptability to evolving network dynamics. Its robustness on imbalanced datasets, scalability for handling extensive data, and augmented online learning capabilities further establish it as a formidable intrusion detection solution. By addressing the limitations of individual models and delivering superior performance across multiple metrics, HD-IDM showcases its technical prowess and solidifies its position as a cutting-edge approach in the field of cybersecurity.
The following are the potential strengths of HD-IDM that significantly overcome the limitations of the existing models:
Combining GRU and LSTM enhances model capabilities.
Improved accuracy and minimized false alarms.
Enhanced detection of known and unknown attacks.
Efficient training, flexibility, and adaptability to diverse scenarios.
4. Results and Discussion
We compare HD-IDM with Gaussian naïve Bayes, gradient boosting, multi-layer perceptron and random forest algorithms on the following publicly available different datasets [
29]:
CSE-CIC-IDS2017.
CSE-CIC-IDS2018.
NSL KDD.
CIC-DDoS2019.
The CSE-CIC-IDS2017 dataset is a comprehensive collection of network traffic data, primarily designed for intrusion detection systems (IDS) research and evaluation. The CSE-CIC-IDS2018 dataset is a valuable resource for intrusion detection research due to its wide-ranging composition of network attacks and normal traffic. Captured within a controlled laboratory environment, this dataset serves as a comprehensive platform for the development and testing of intrusion detection system (IDS) algorithms. Similarly, CSE-CIC-IDS2018, being a predecessor, plays an important role as a benchmark for evaluating the performance of IDS solutions. It encompasses a diverse spectrum of network traffic, comprising both benign and malicious activities. Researchers widely utilize this dataset to enhance the accuracy and effectiveness of their IDS approaches.
The NSL KDD dataset represents a refined iteration of the original KDD Cup ‘99 dataset, tailored specifically for research in intrusion detection systems. This dataset offers a more realistic portrayal of network traffic by addressing several limitations of the KDD Cup dataset, such as duplicated records and redundancy. Consequently, it stands as the preferred choice for the development and evaluation of IDS solutions, providing a more reliable basis for experimentation and algorithm refinement.
In the realm of network security, the CIC-DDoS2019 dataset takes a focused approach by centering on distributed denial of service (DDoS) attacks. This dataset presents a valuable resource for the study and mitigation of these disruptive network threats. Comprising various types of DDoS attacks alongside legitimate network traffic, it equips researchers with the means to develop more robust DDoS detection and prevention mechanisms. As such, the CIC-DDoS2019 dataset plays a crucial role in fortifying network defenses against these potentially devastating attacks.
The evaluation of the ensemble model’s performance performed a crucial step in the process. To gauge the model’s effectiveness, a set of metrics, including accuracy and F1-score, is employed. These metrics offer valuable insights into the precision of the model, its capability to strike a balance between precision and recall, and its proficiency in correctly identifying intrusions while minimizing the occurrence of false alarms.
We adopted the following evaluation metrics for the performance analysis of IDDs systems.
Accuracy: Accuracy measures overall correctness of predictions made by a classification model. It is the ratio of correctly classified instances (true positives and true negatives) to the total number of instances.
Precision: Precision assesses accuracy of positive predictions made by a classification model. It is the ratio of true positives (correctly predicted positive instances) to all instances predicted as positive (true positives + false positives).
Recall (Sensitivity): Recall, also known as Sensitivity or true-positive rate, evaluates the ability of a model to correctly identify all actual positive instances. It is the ratio of true positives to all actual positive instances (true positives + false negatives).
F1-score: F1-score is the harmonic mean of precision and recall, providing a balanced measure of false positives and false negatives. A higher F1-score indicates better overall classification performance.
4.1. Results on CSE-CIC-IDS2017 Dataset
The CSE-CIC-IDS2017 dataset holds a prominent position in the realm of network security as a meticulously crafted resource dedicated to the research and assessment of intrusion detection systems (IDS). Within this dataset, an extensive array of network traffic scenarios is meticulously curated, encompassing both typical and malicious activities. These scenarios are captured under controlled laboratory conditions, ensuring the dataset’s reliability and relevance in simulating real-world network environments. As a result, the CSE-CIC-IDS2017 dataset stands as a highly valuable asset for the development, testing, and fine-tuning of IDS algorithms. Researchers find in it a robust foundation for their work, with the potential to significantly enhance the precision and efficacy of intrusion detection in the face of intricate network landscapes.
Table 1 provides a comprehensive overview of the performance evaluation conducted on various classifiers using the CSE-CIC-IDS2017 dataset. Notably, the HD-IDM classifier emerges as the standout performer in this rigorous assessment. With an outstanding accuracy rate of 99.89%, it excels in its ability to consistently make precise predictions across the dataset, showcasing its remarkable classification capabilities. Moreover, the HD-IDM classifier demonstrates a remarkable equilibrium between precision and recall, further underlining its prowess. Boasting a precision score of 95.88%, it showcases exceptional accuracy in correctly identifying positive cases, thereby minimizing the occurrence of false positives. Simultaneously, it achieves an impressive recall rate of 99.78%, signifying its adeptness at accurately identifying a substantial portion of positive cases.
The F1-score, a critical metric that balances precision and recall, attests to the HD-IDM classifier’s robustness. With an impressive F1-score of 98.27%, it reaffirms its capacity to simultaneously achieve high precision and recall. This equilibrium is particularly vital in classification tasks where the minimization of both false positives and false negatives holds paramount importance. The HD-IDM Classifier’s exceptional performance in terms of accuracy, precision, recall, and F1-score underscores its significant capabilities in this evaluation. It emerges as a highly dependable choice for classification tasks, adept at effectively distinguishing between positive and negative cases while upholding an exceptional overall accuracy rate.
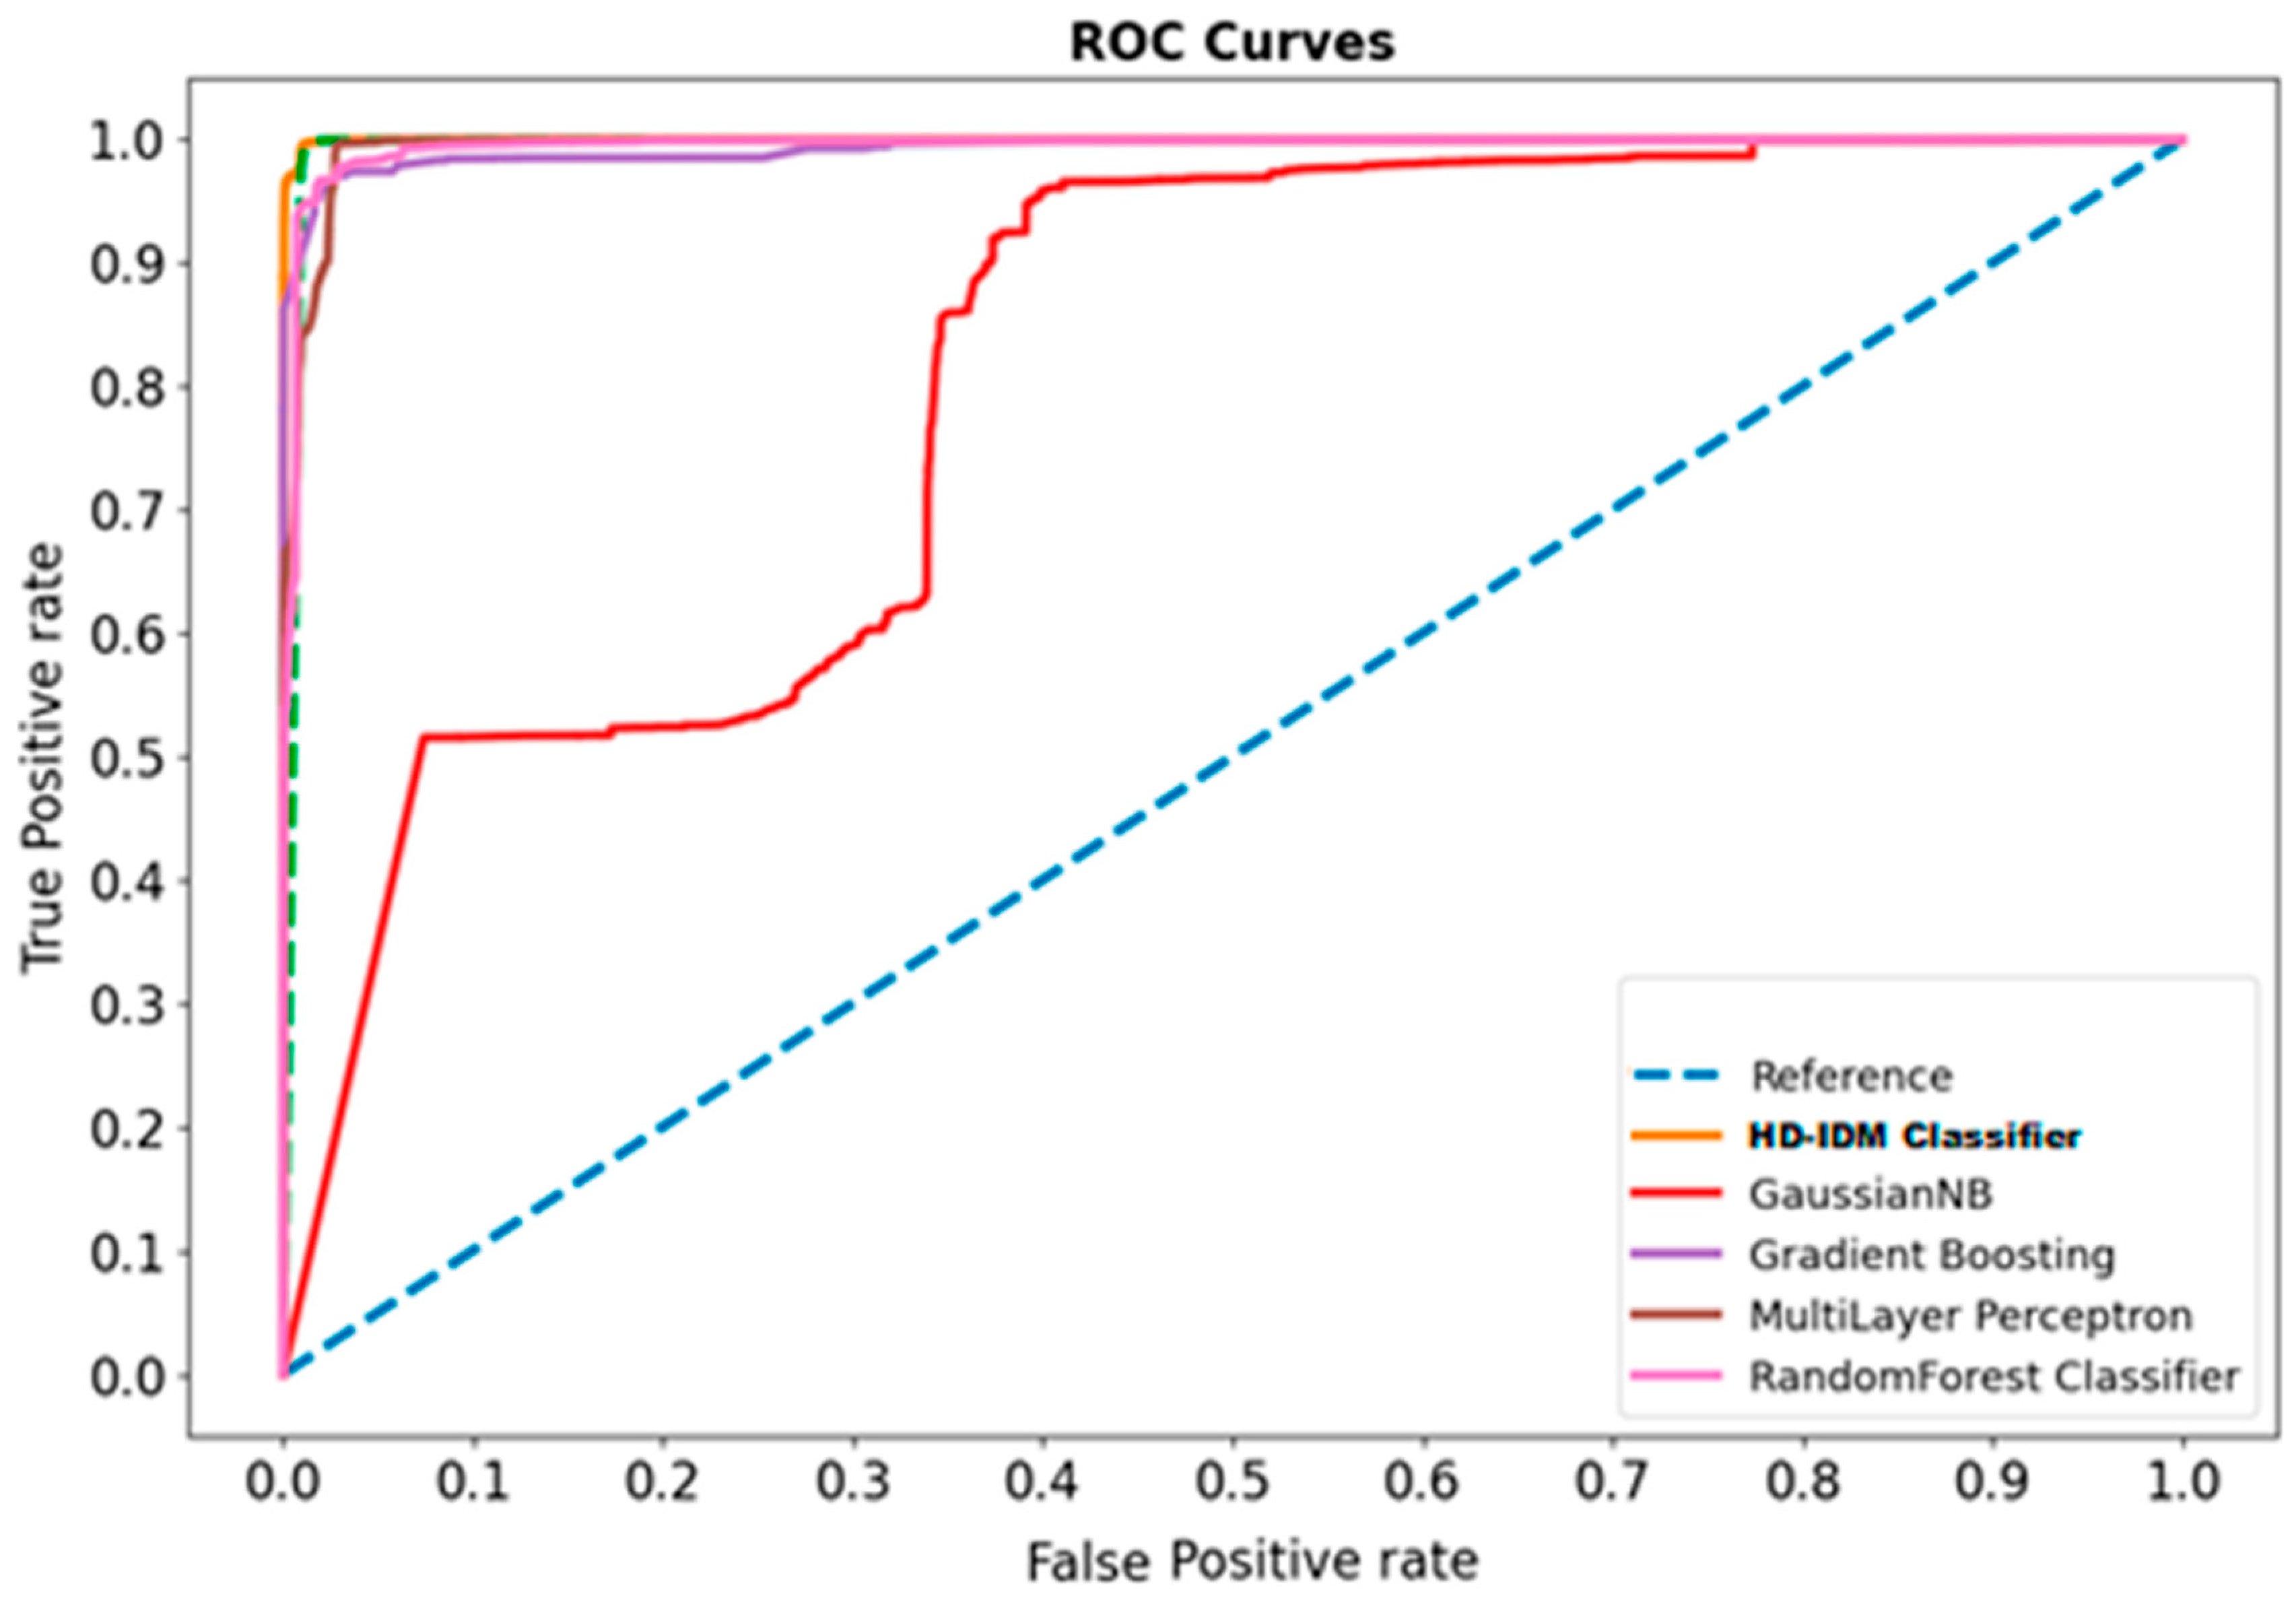
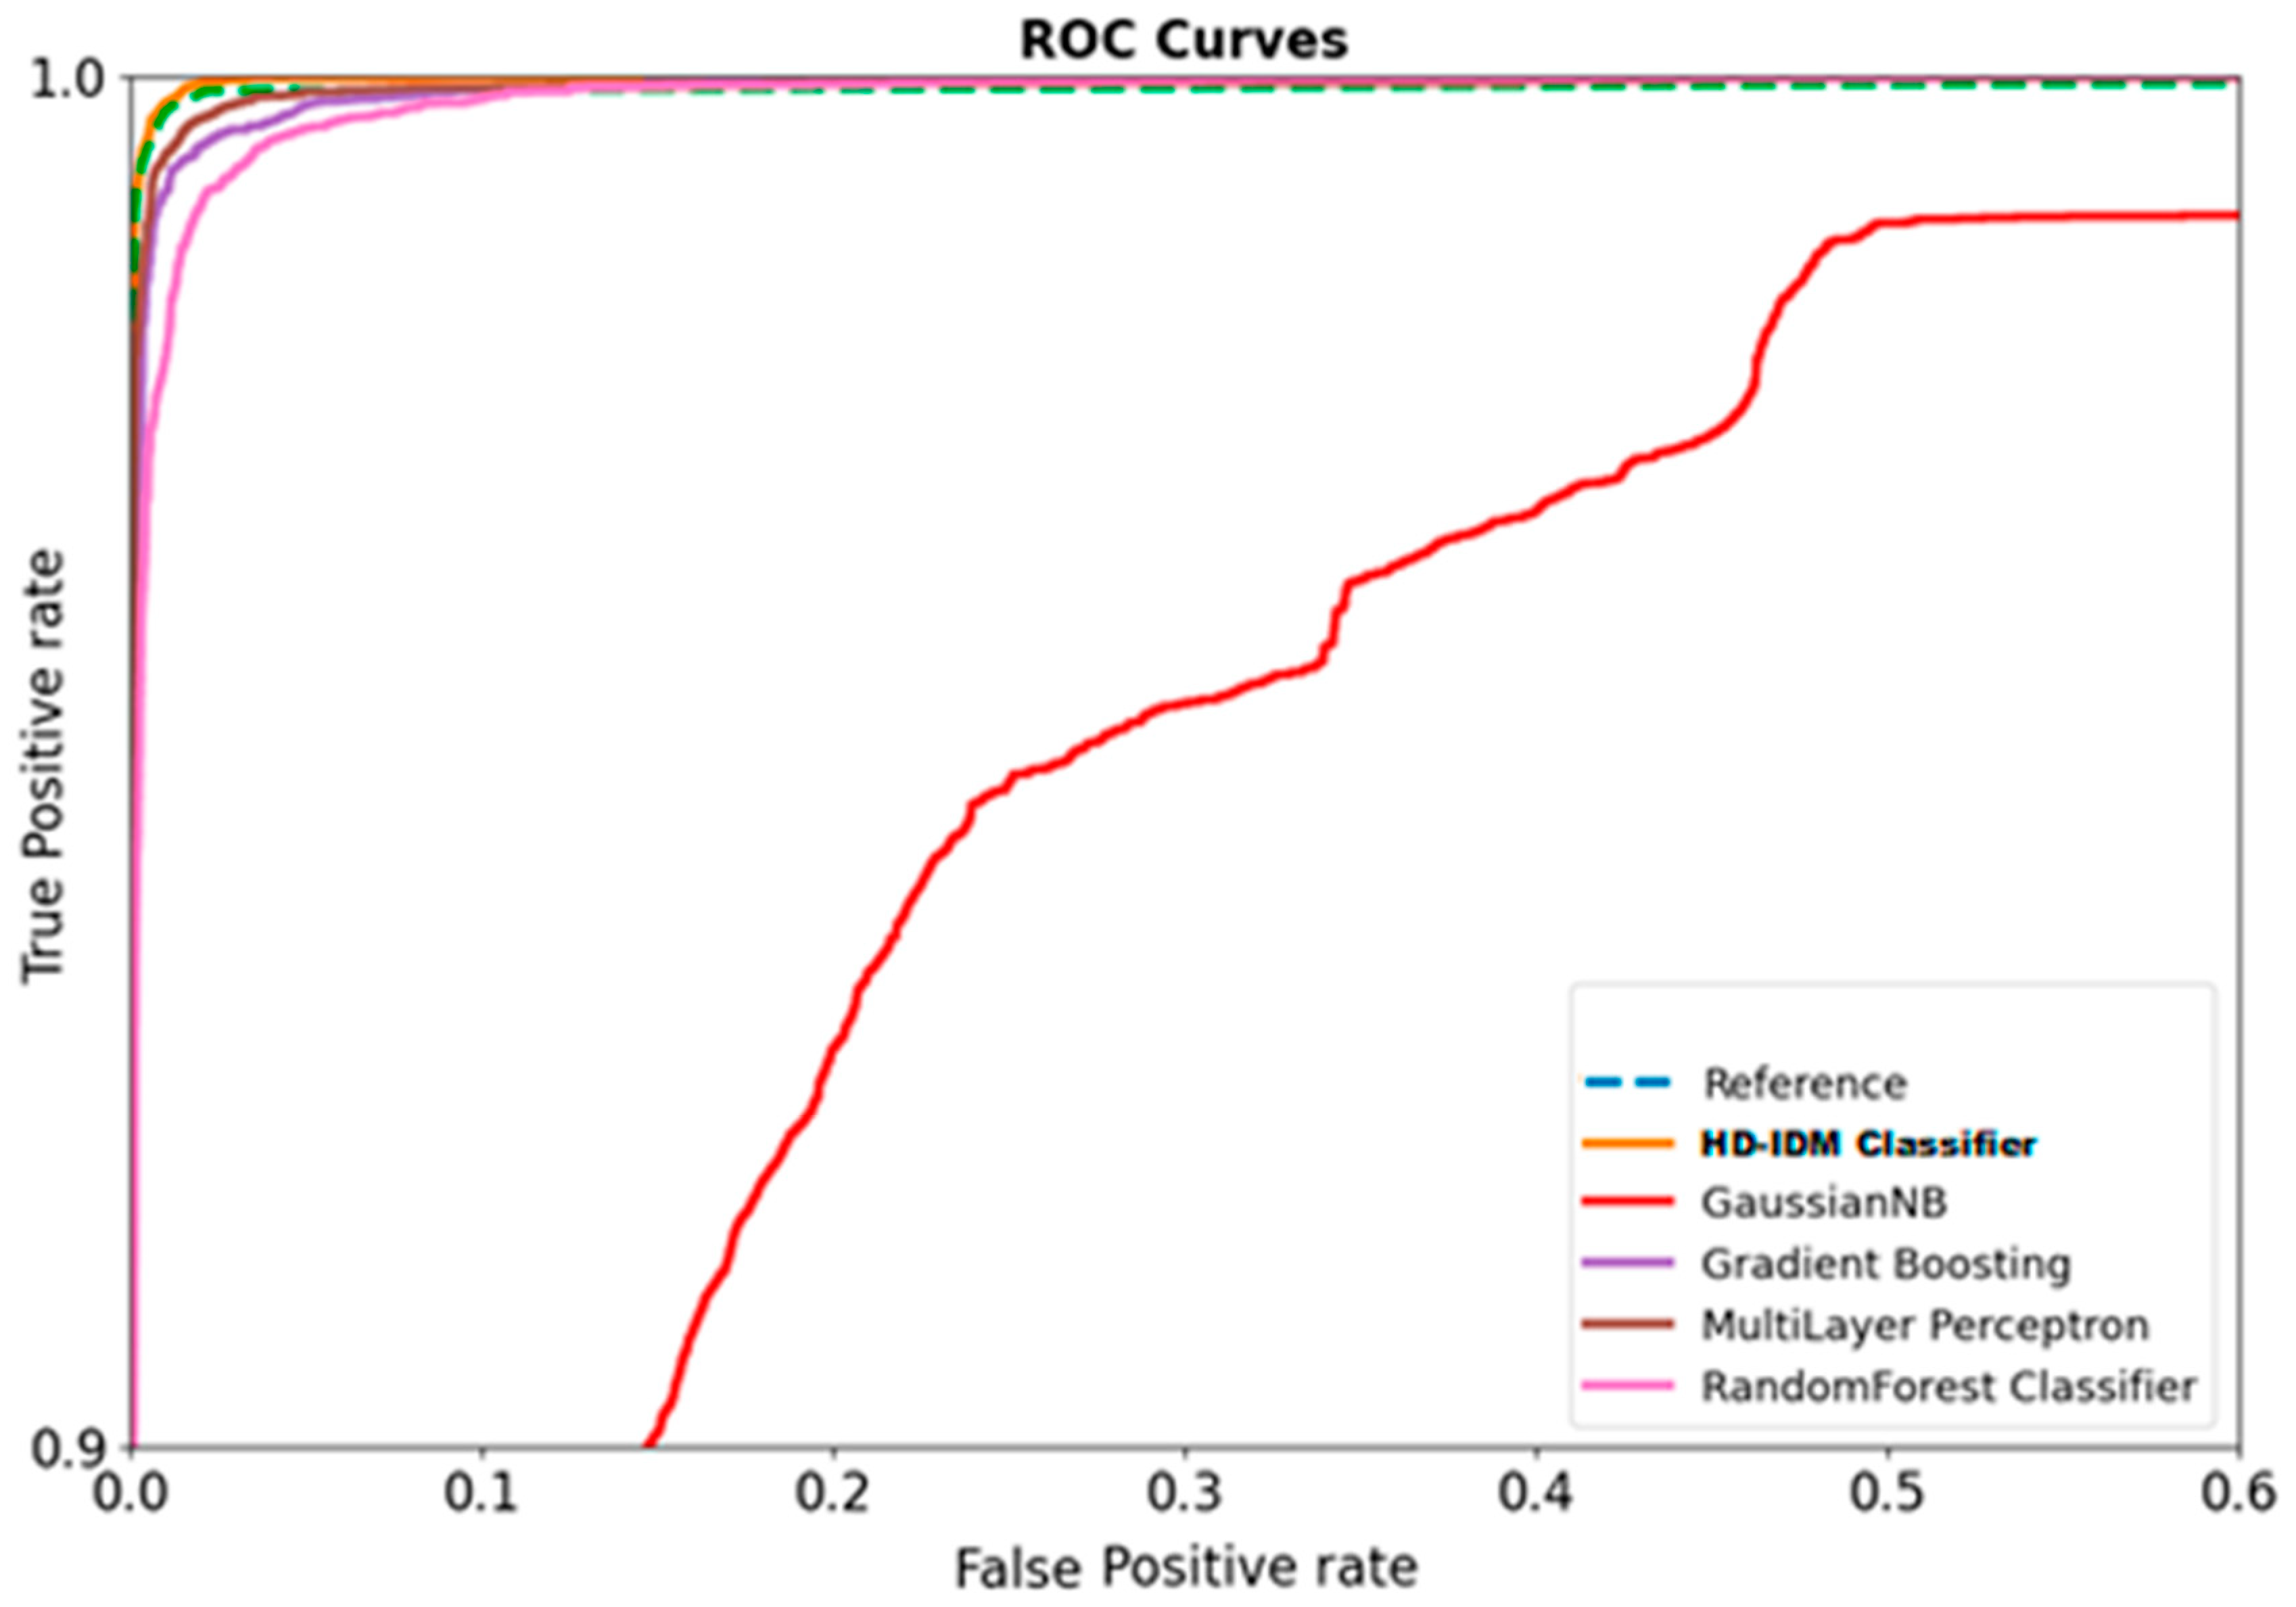
Figure 2 offers a comprehensive view of the performance of various classifiers on the CSE-CIC-IDS2017 dataset, evaluated through ROC curve analysis, revealing distinct and insightful patterns. The exceptional performance of the HD-IDM classifier becomes readily apparent upon closer examination of its ROC curve. The receiver operating characteristic (ROC) curve serves as a graphical representation that effectively illustrates the inherent trade-off between the true-positive rate (TPR) and the false-positive rate (FPR) at different classification thresholds.
In the case of the HD-IDM classifier, its ROC curve manifests a notably outstanding performance. This curve exhibits a trajectory that is significantly closer to the coveted top-left corner of the ROC space when compared to other prominent classifiers, including Gaussian naïve Bayes, gradient boosting, multi-layer perceptron, and random forest. What sets the ROC curve of the HD-IDM classifier apart is its remarkable steep ascent during the initial stages, signifying a high TPR while maintaining a low FPR. This is indicative of its exceptional ability to accurately classify positive cases while diligently minimizing the occurrence of false positives. Even as the classification threshold varies, the HD-IDM classifier’s curve consistently maintains its advantageous position, consistently surpassing other classifiers regarding the trade-offs between TPR and FPR.
Furthermore, it is highly likely that the area under the ROC curve (AUC), a quintessential metric for evaluating classifier performance, would yield notably high values for the HD-IDM classifier. A substantial AUC implies that this particular classifier possesses the capacity to effectively discriminate between positive and negative cases across an array of threshold settings. This, in turn, reinforces its distinct superiority in ROC curve analysis. In summary, the ROC curve analysis serves as an unequivocal visual testament to the HD-IDM classifier’s outperformance in comparison to its peers. Its curve’s proximity to the esteemed top-left corner, its impressive ascent, and its elevated AUC collectively underscore its remarkable prowess in achieving an exceptional equilibrium between the true-positive rate and the false-positive rate. This renders it an exceptionally robust and dependable choice for a wide array of classification tasks.
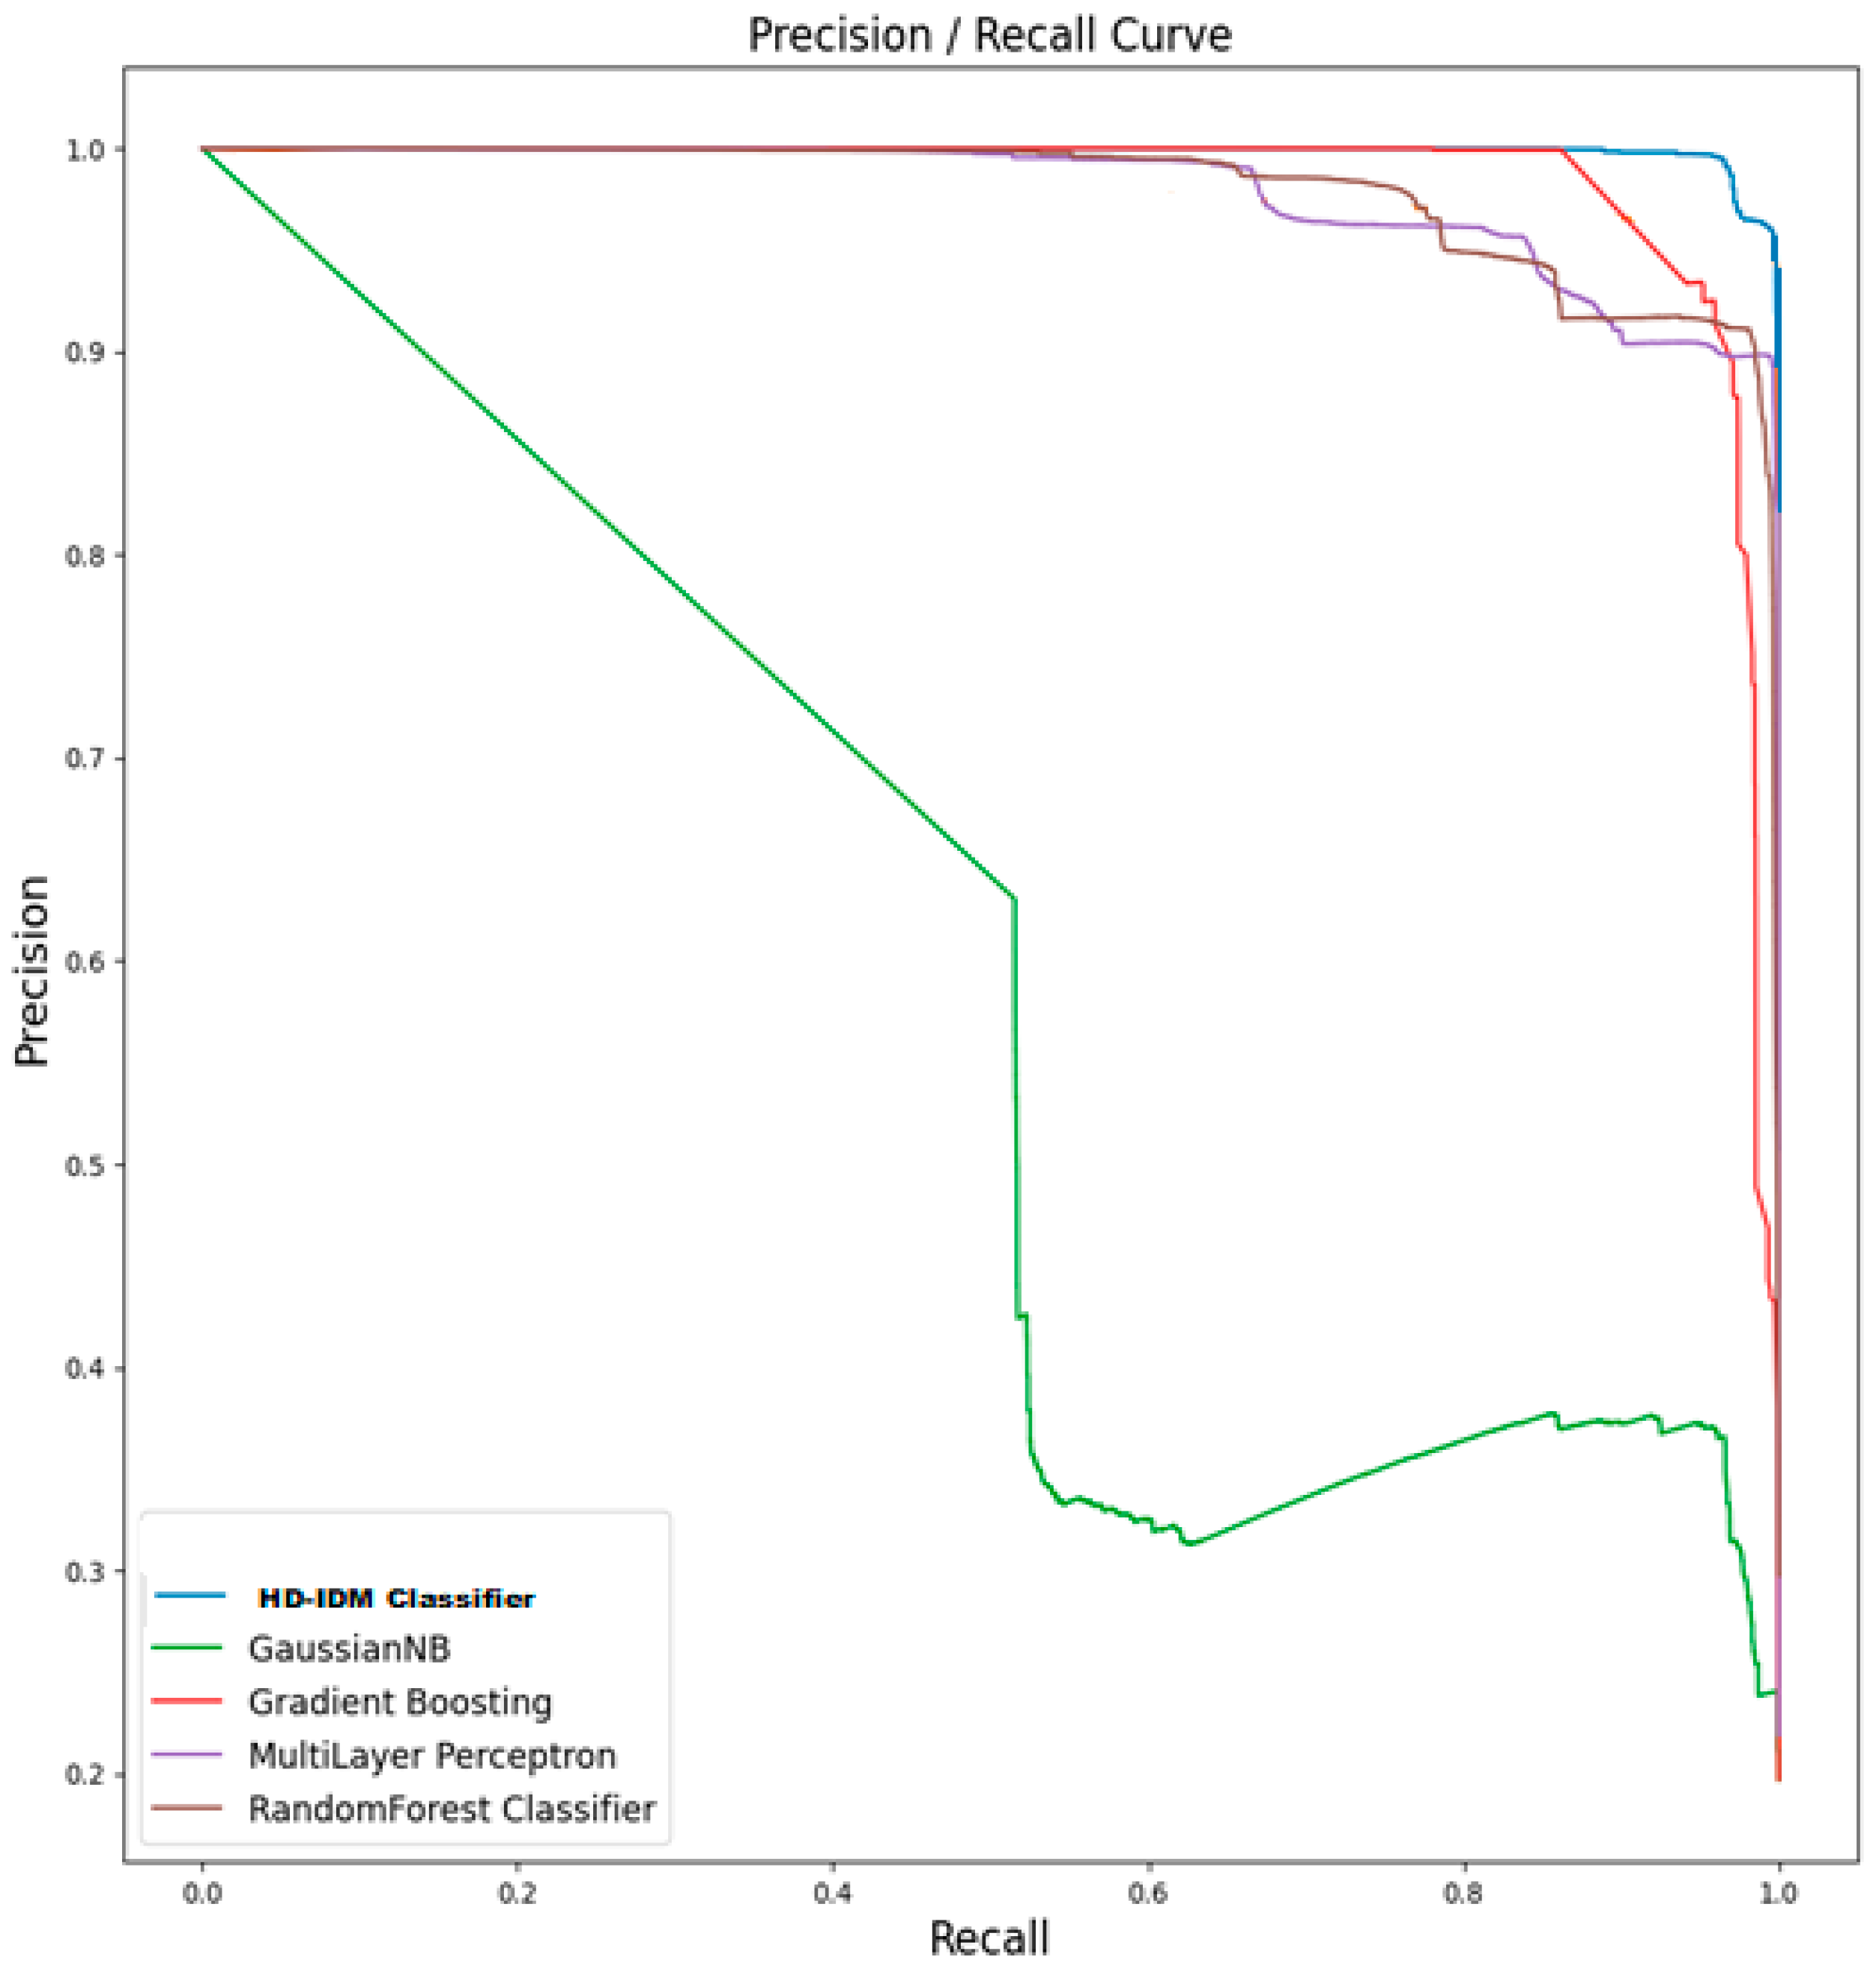
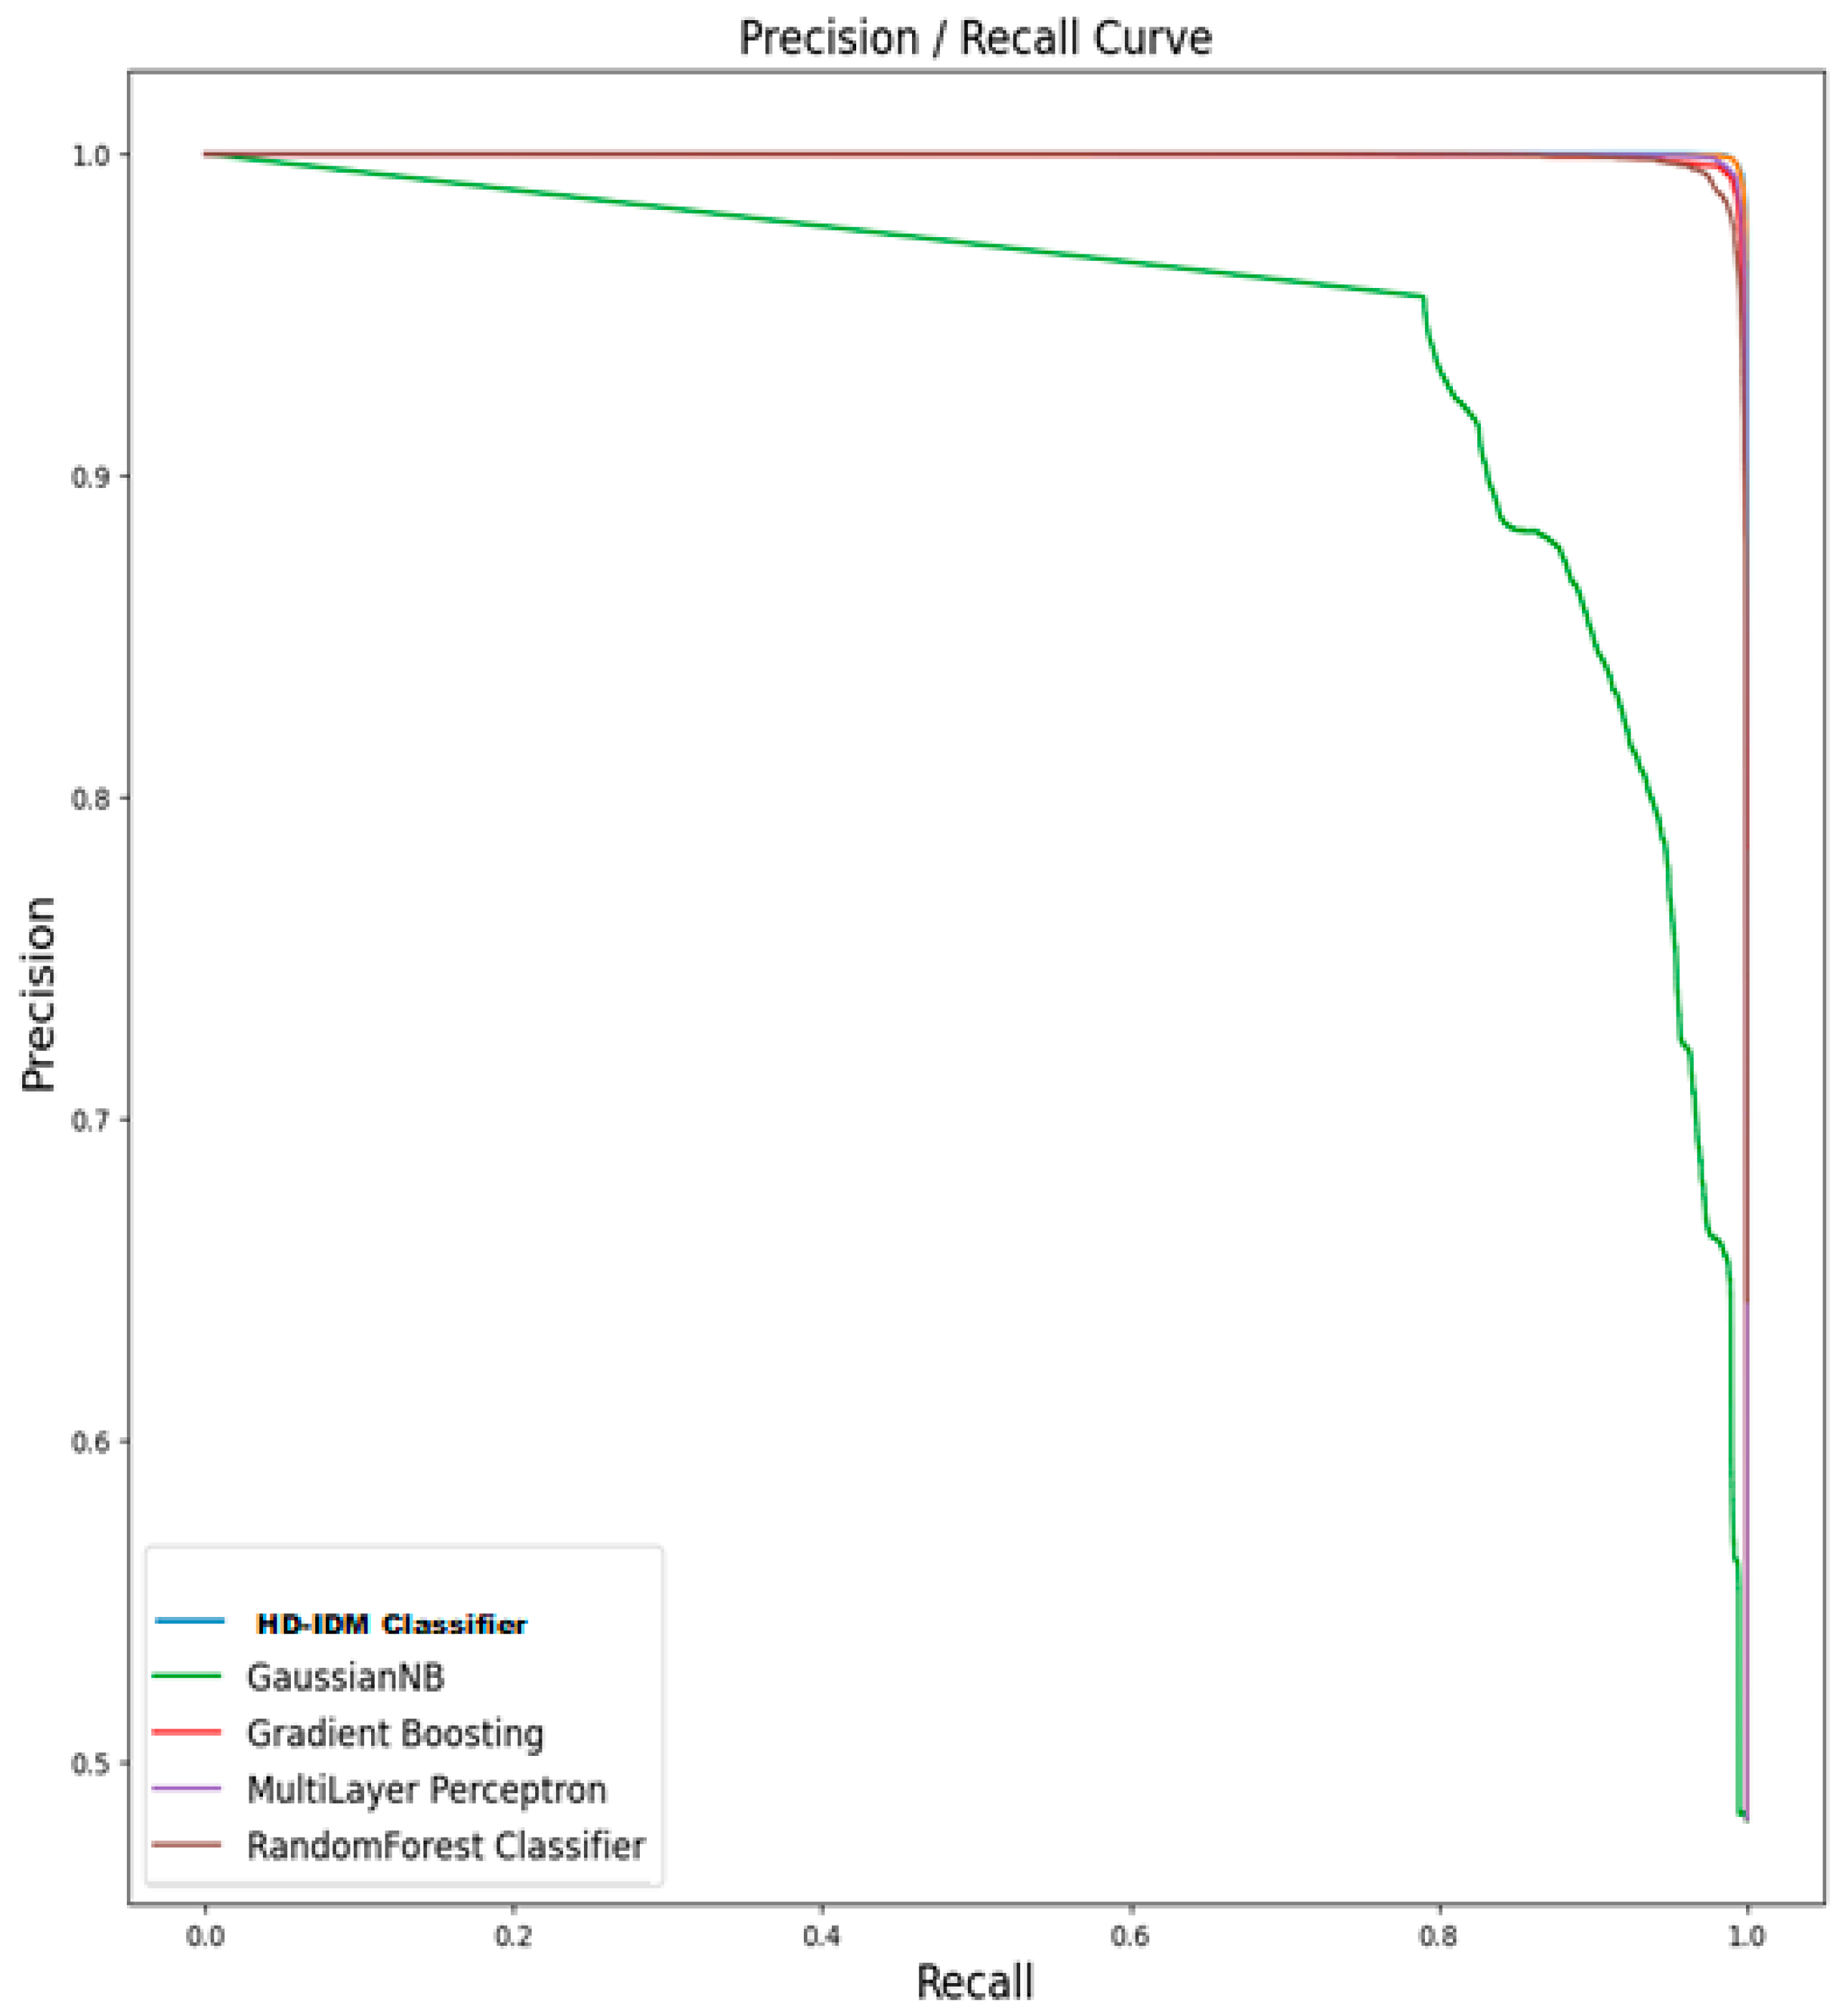
Figure 3 provides a compelling depiction of the HD-IDM classifier’s exceptional performance, particularly when scrutinizing its precision–recall curve. This curve offers a nuanced and detailed perspective on how the classifier adeptly manages the delicate balance between precision and recall across varying classification thresholds.
In the case of the HD-IDM classifier, its precision–recall curve is nothing short of remarkable. The curve showcases an initial steep ascent, especially during the early stages, signifying a remarkable level of precision even when the recall rate is relatively modest. This particular characteristic holds significant value as it implies that when the HD-IDM classifier issues a positive prediction, it carries a high degree of confidence in its correctness. This attribute proves especially valuable in applications where the consequence of false positives can be particularly detrimental or costly.
As one examines the curve further and observes how it retains its advantageous position throughout varying threshold settings, it becomes evident that the HD-IDM classifier consistently outperforms its peers when it comes to the intricate trade-offs between precision and recall. Moreover, it is highly plausible that the area under the precision–recall curve (AUC-PR), a pivotal metric for evaluating classifier performance, would yield notably elevated values for the HD-IDM classifier. This metric is indicative of the classifier’s remarkable capacity to achieve both high precision and high recall in unison. In more pragmatic terms, this implies that the HD-IDM classifier excels at accurately identifying positive cases while diligently minimizing the incidence of false positives. This attribute holds exceptional significance in scenarios where precision and the minimization of false positives hold paramount importance.
The precision–recall curve analysis serves as a compelling testament to the HD-IDM classifier’s conspicuous outperformance, especially concerning the intricacies of precision and recall trade-offs. The steep ascent observed at the beginning of its curve, the substantial AUC-PR (area under the precision–recall curve), and its capacity to consistently uphold remarkable precision while simultaneously achieving substantial recall collectively position it as an exceptionally resilient and dependable choice for a wide range of classification tasks. This is particularly relevant in scenarios where precision and the effective mitigation of false positives hold paramount importance.
4.2. Results on CSE-CIC-IDS2018 Dataset
The CSE-CIC-IDS2018 dataset represents an extensive compilation of network traffic data for the purpose of research and development in the field of intrusion detection systems (IDS). Within its contents, one finds a rich tapestry of network traffic scenarios, encompassing both legitimate and malicious activities, all meticulously captured within the confines of a controlled laboratory environment. This dataset assumes a pivotal role as an invaluable asset, facilitating the development, testing, and fine-tuning of IDS algorithms. It empowers researchers with the means to elevate the precision and efficacy of intrusion detection within intricate and multifaceted network environments.
Table 2 provides a comprehensive overview of the performance assessment of several classifiers on the CSE-CIC-IDS2018 dataset. This extensive evaluation uncovers a rich tapestry of intrusion detection capabilities, allowing for a nuanced comparison of each model’s performance. Amidst this array of classifiers, the HD-IDM classifier emerges as the standout performer, attaining the highest level of excellence among its peers in the presented results. It demonstrates a remarkable accuracy of 99.66%, signifying its consistent and precise predictions throughout the dataset.
Precision, another crucial metric, for the HD-IDM classifier is notably high at 96.25%. This indicates that when it classifies a data point as positive, it is very likely to be correct. This precision is especially important in applications where false positives carries significant consequences. In terms of recall, the HD-IDM classifier maintains an impressive level at 97.07%. This metric reflects its effectiveness in correctly identifying a substantial portion of the actual positive cases in the dataset, minimizing false negatives.
The F1-score, a measure that balances precision and recall, further underscores the robustness of the HD-IDM classifier, registering at 98.01%. This equilibrium is crucial in classification tasks where achieving both high precision and high recall simultaneously is of paramount importance. The HD-IDM Classifier excels across all key metrics, displaying outstanding accuracy, precision, recall, and F1-score. Its ability to consistently provide accurate predictions while striking a remarkable balance between precision and recall positions it as the top choice for demanding classification tasks.
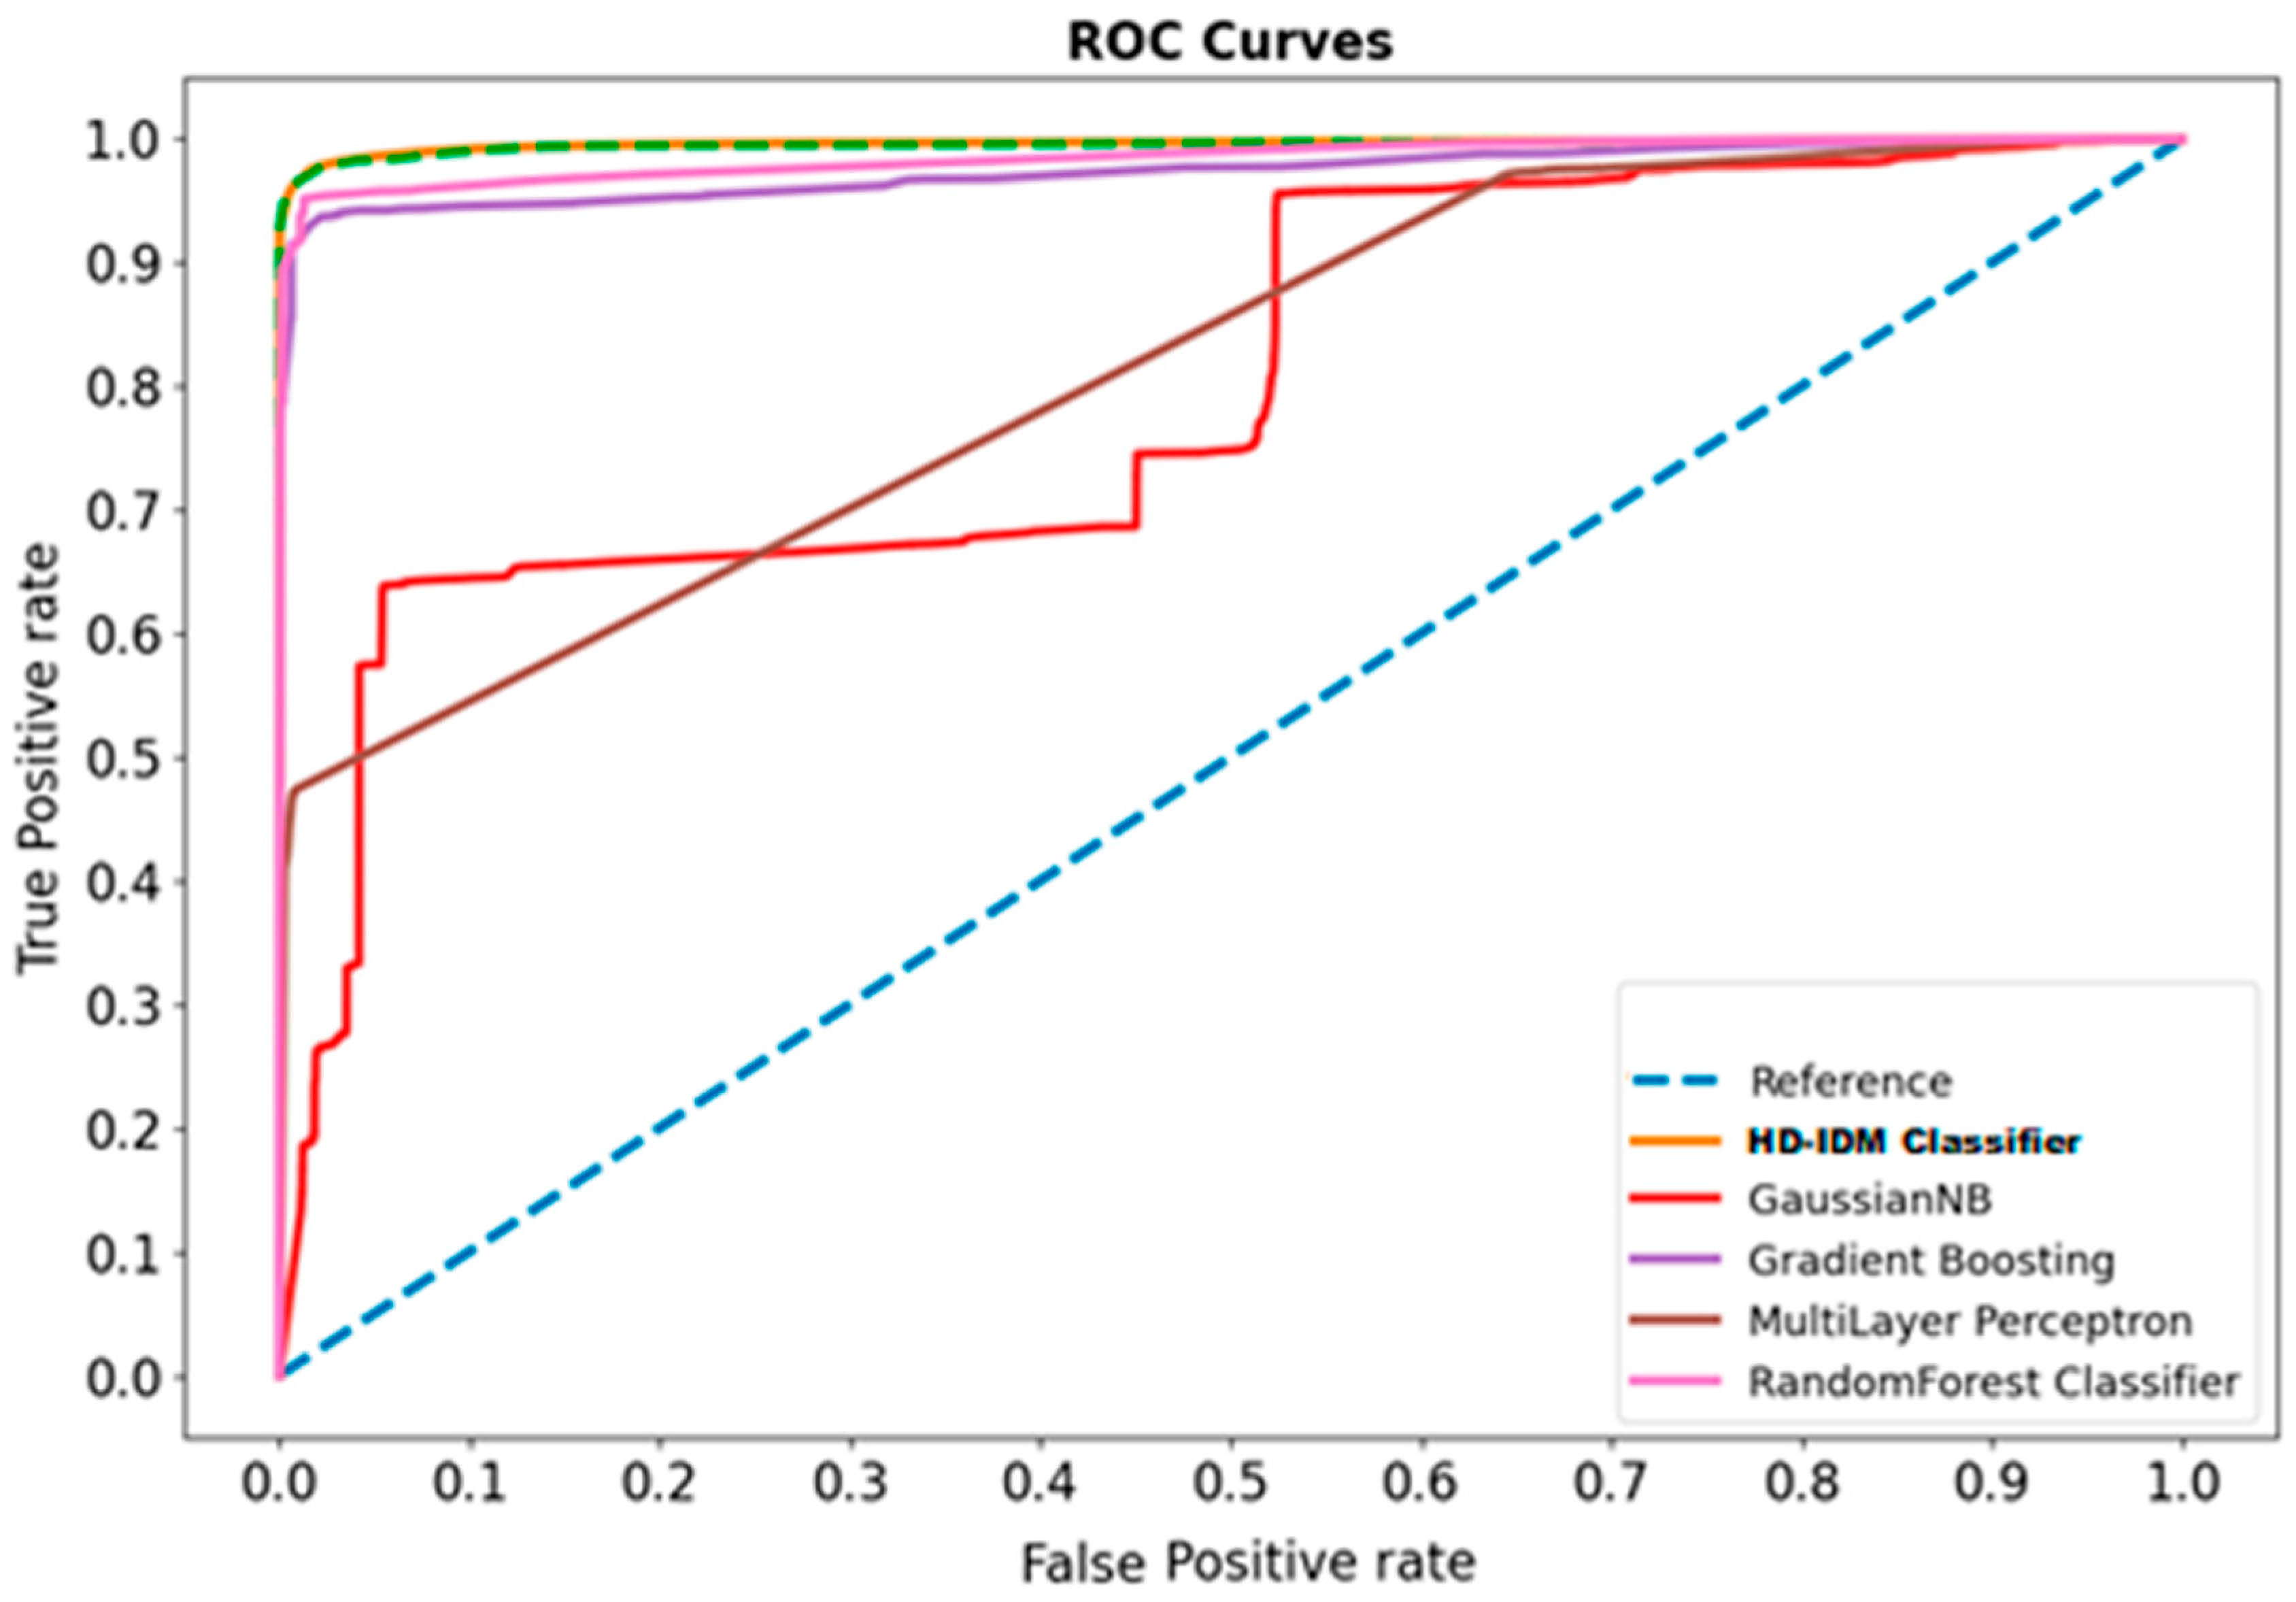
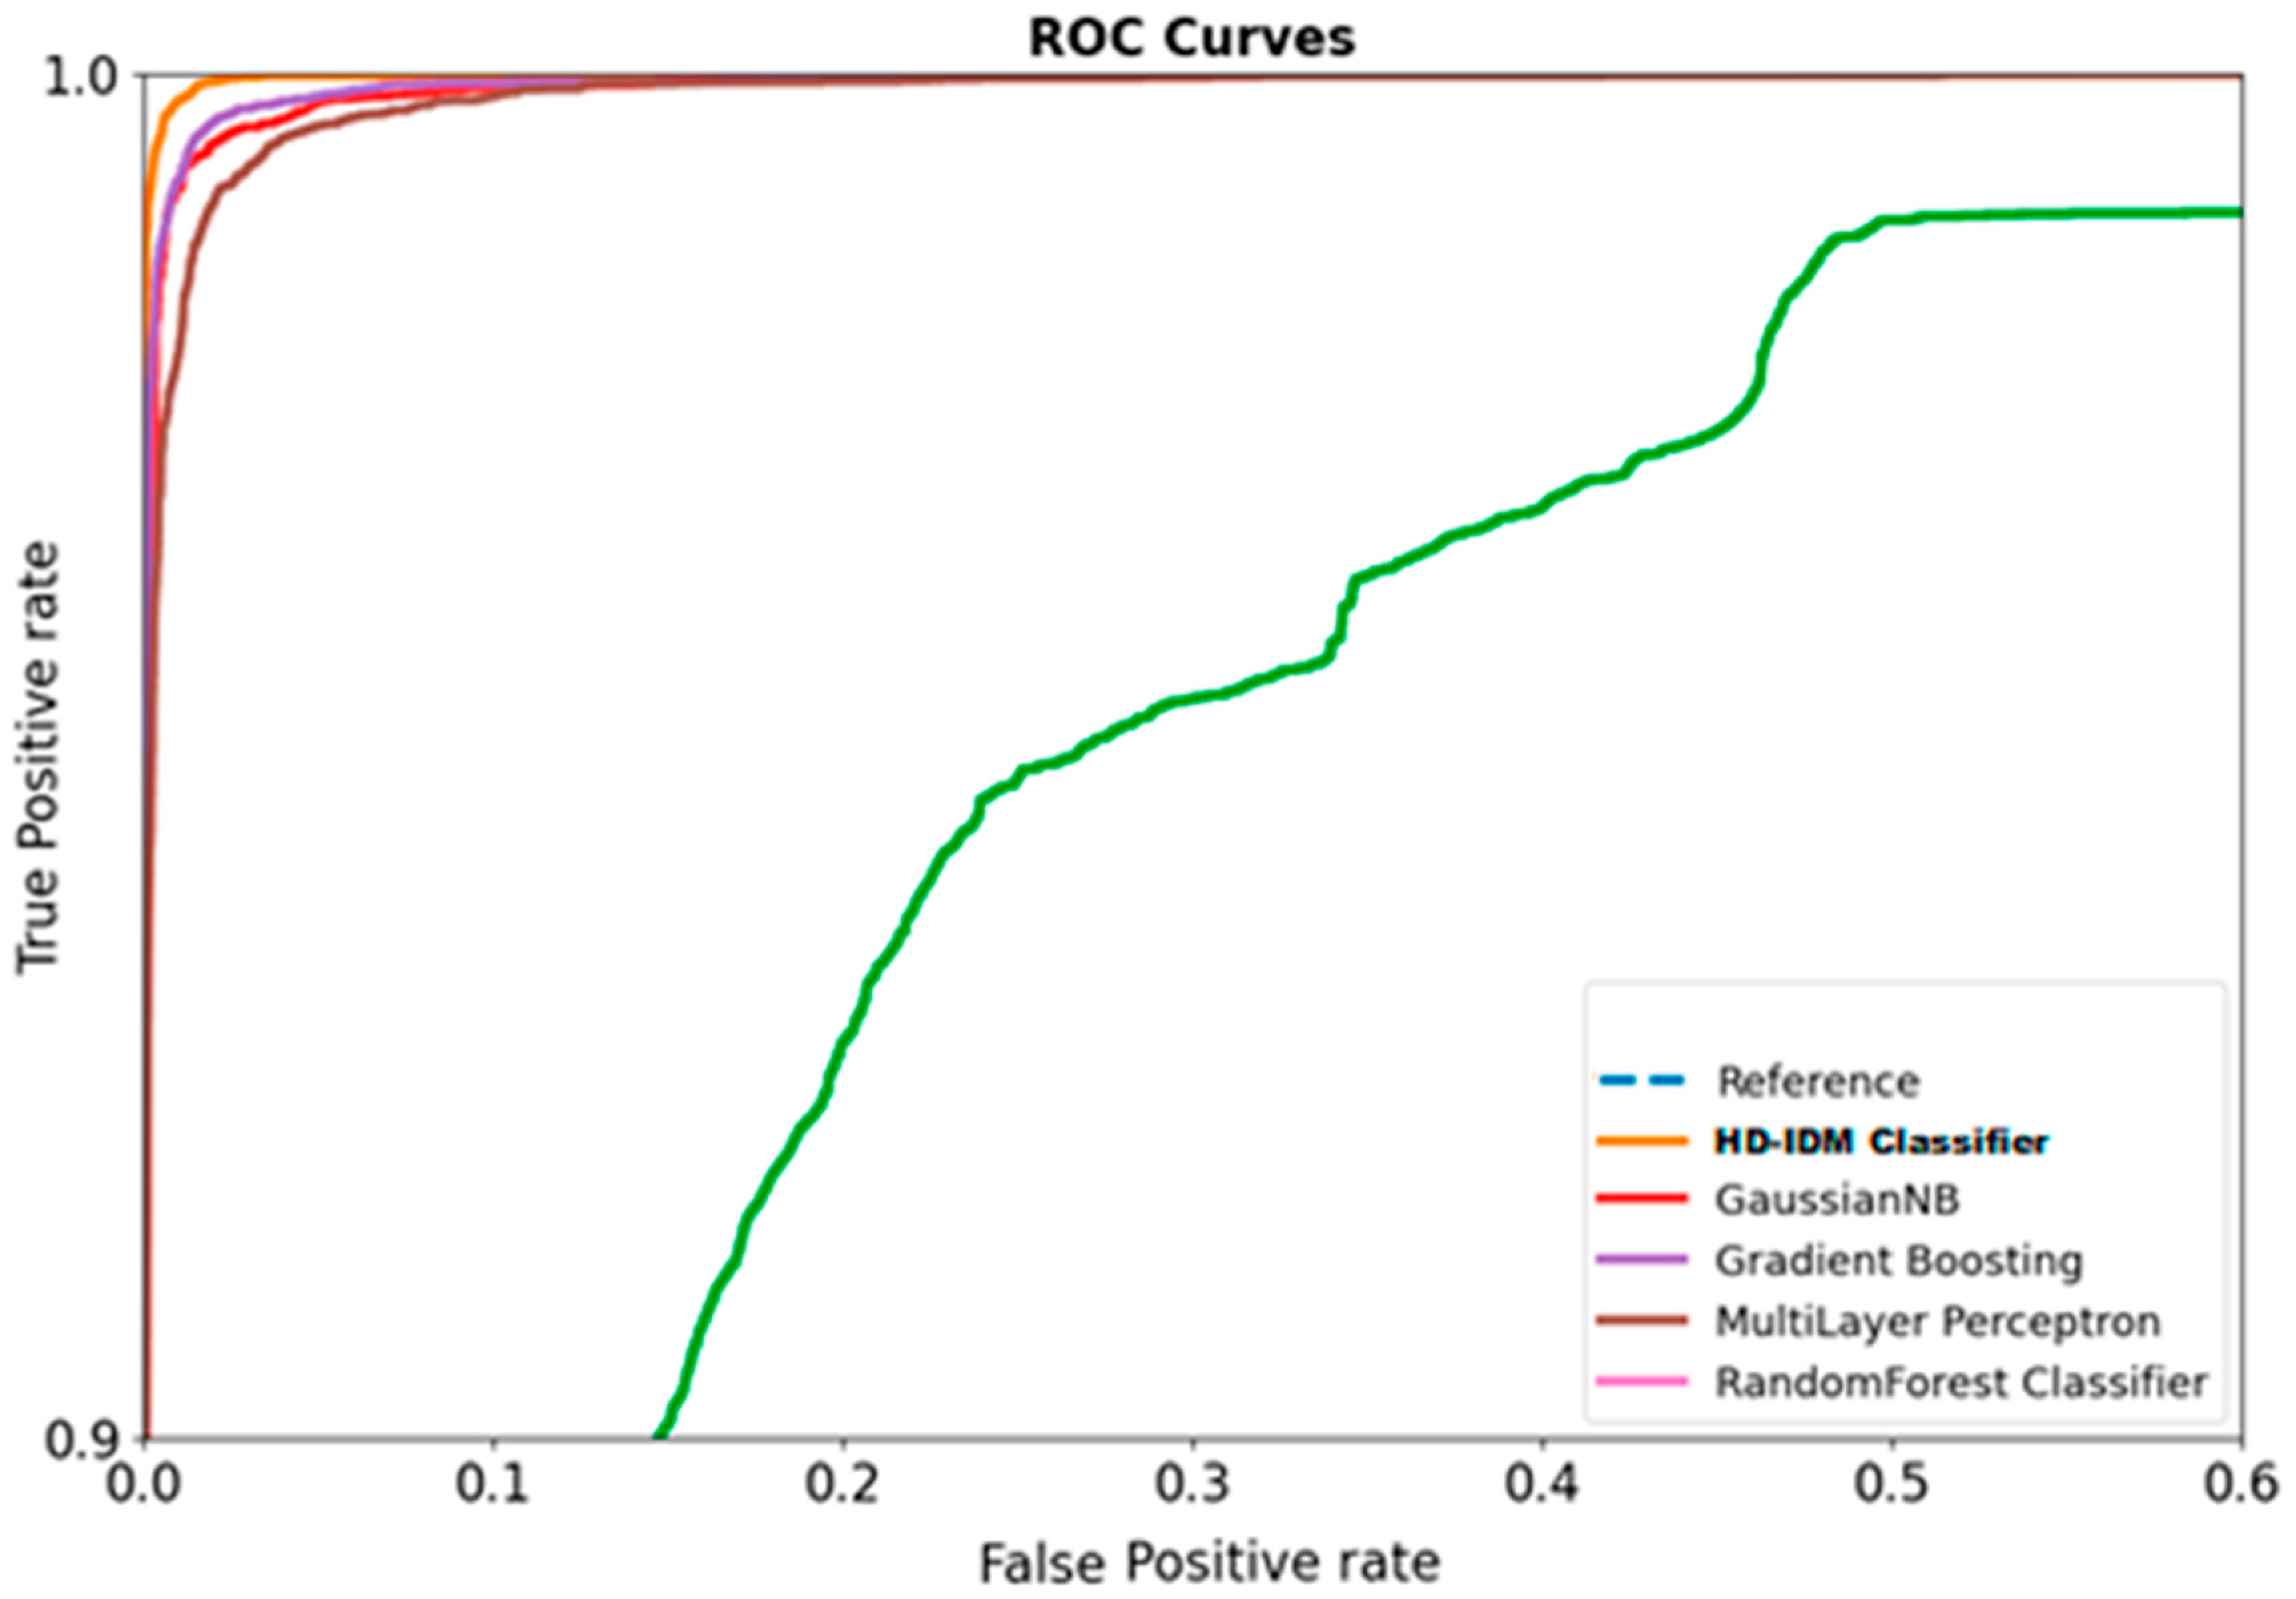
As shown in
Figure 4, the outperformance of the HD-IDM classifier becomes strikingly apparent when analyzing its ROC curve. This graphical representation reveals how well a classifier distinguishes between true-positive rates (TPR) and false-positive rates (FPR) at various classification thresholds. In the case of the HD-IDM classifier, its ROC curve exhibits a remarkable performance. It consistently maintains a curve that is positioned significantly closer to the top-left corner of the ROC space compared to the other classifiers, such as Gaussian naïve Bayes, gradient boosting, multi-layer perceptron, and random forest.
The ROC curve of the HD-IDM classifier demonstrates a steep ascent at the beginning, indicating a high TPR even when the FPR is low. This signifies the classifier’s ability to correctly identify positive cases while keeping the rate of false positives at a minimum. As the threshold varies, the curve consistently maintains its advantageous position, consistently outperforming other classifiers in terms of TPR and FPR trade-offs. The area under the ROC curve (AUC), a standard metric for classifier performance, is notably high for the HD-IDM classifier. A high AUC indicates its remarkable capability to effectively distinguish between positive and negative cases across various threshold settings, underscoring its superiority in ROC curve analysis.
The ROC curve analysis vividly illustrates the outperformance of the HD-IDM classifier. Its curve’s proximity to the top-left corner, steep ascent, and high AUC validate its exceptional ability to achieve a superior balance between true-positive rate and false-positive rate, firmly establishing it as a robust choice for classification tasks demanding precise discrimination between positive and negative cases.
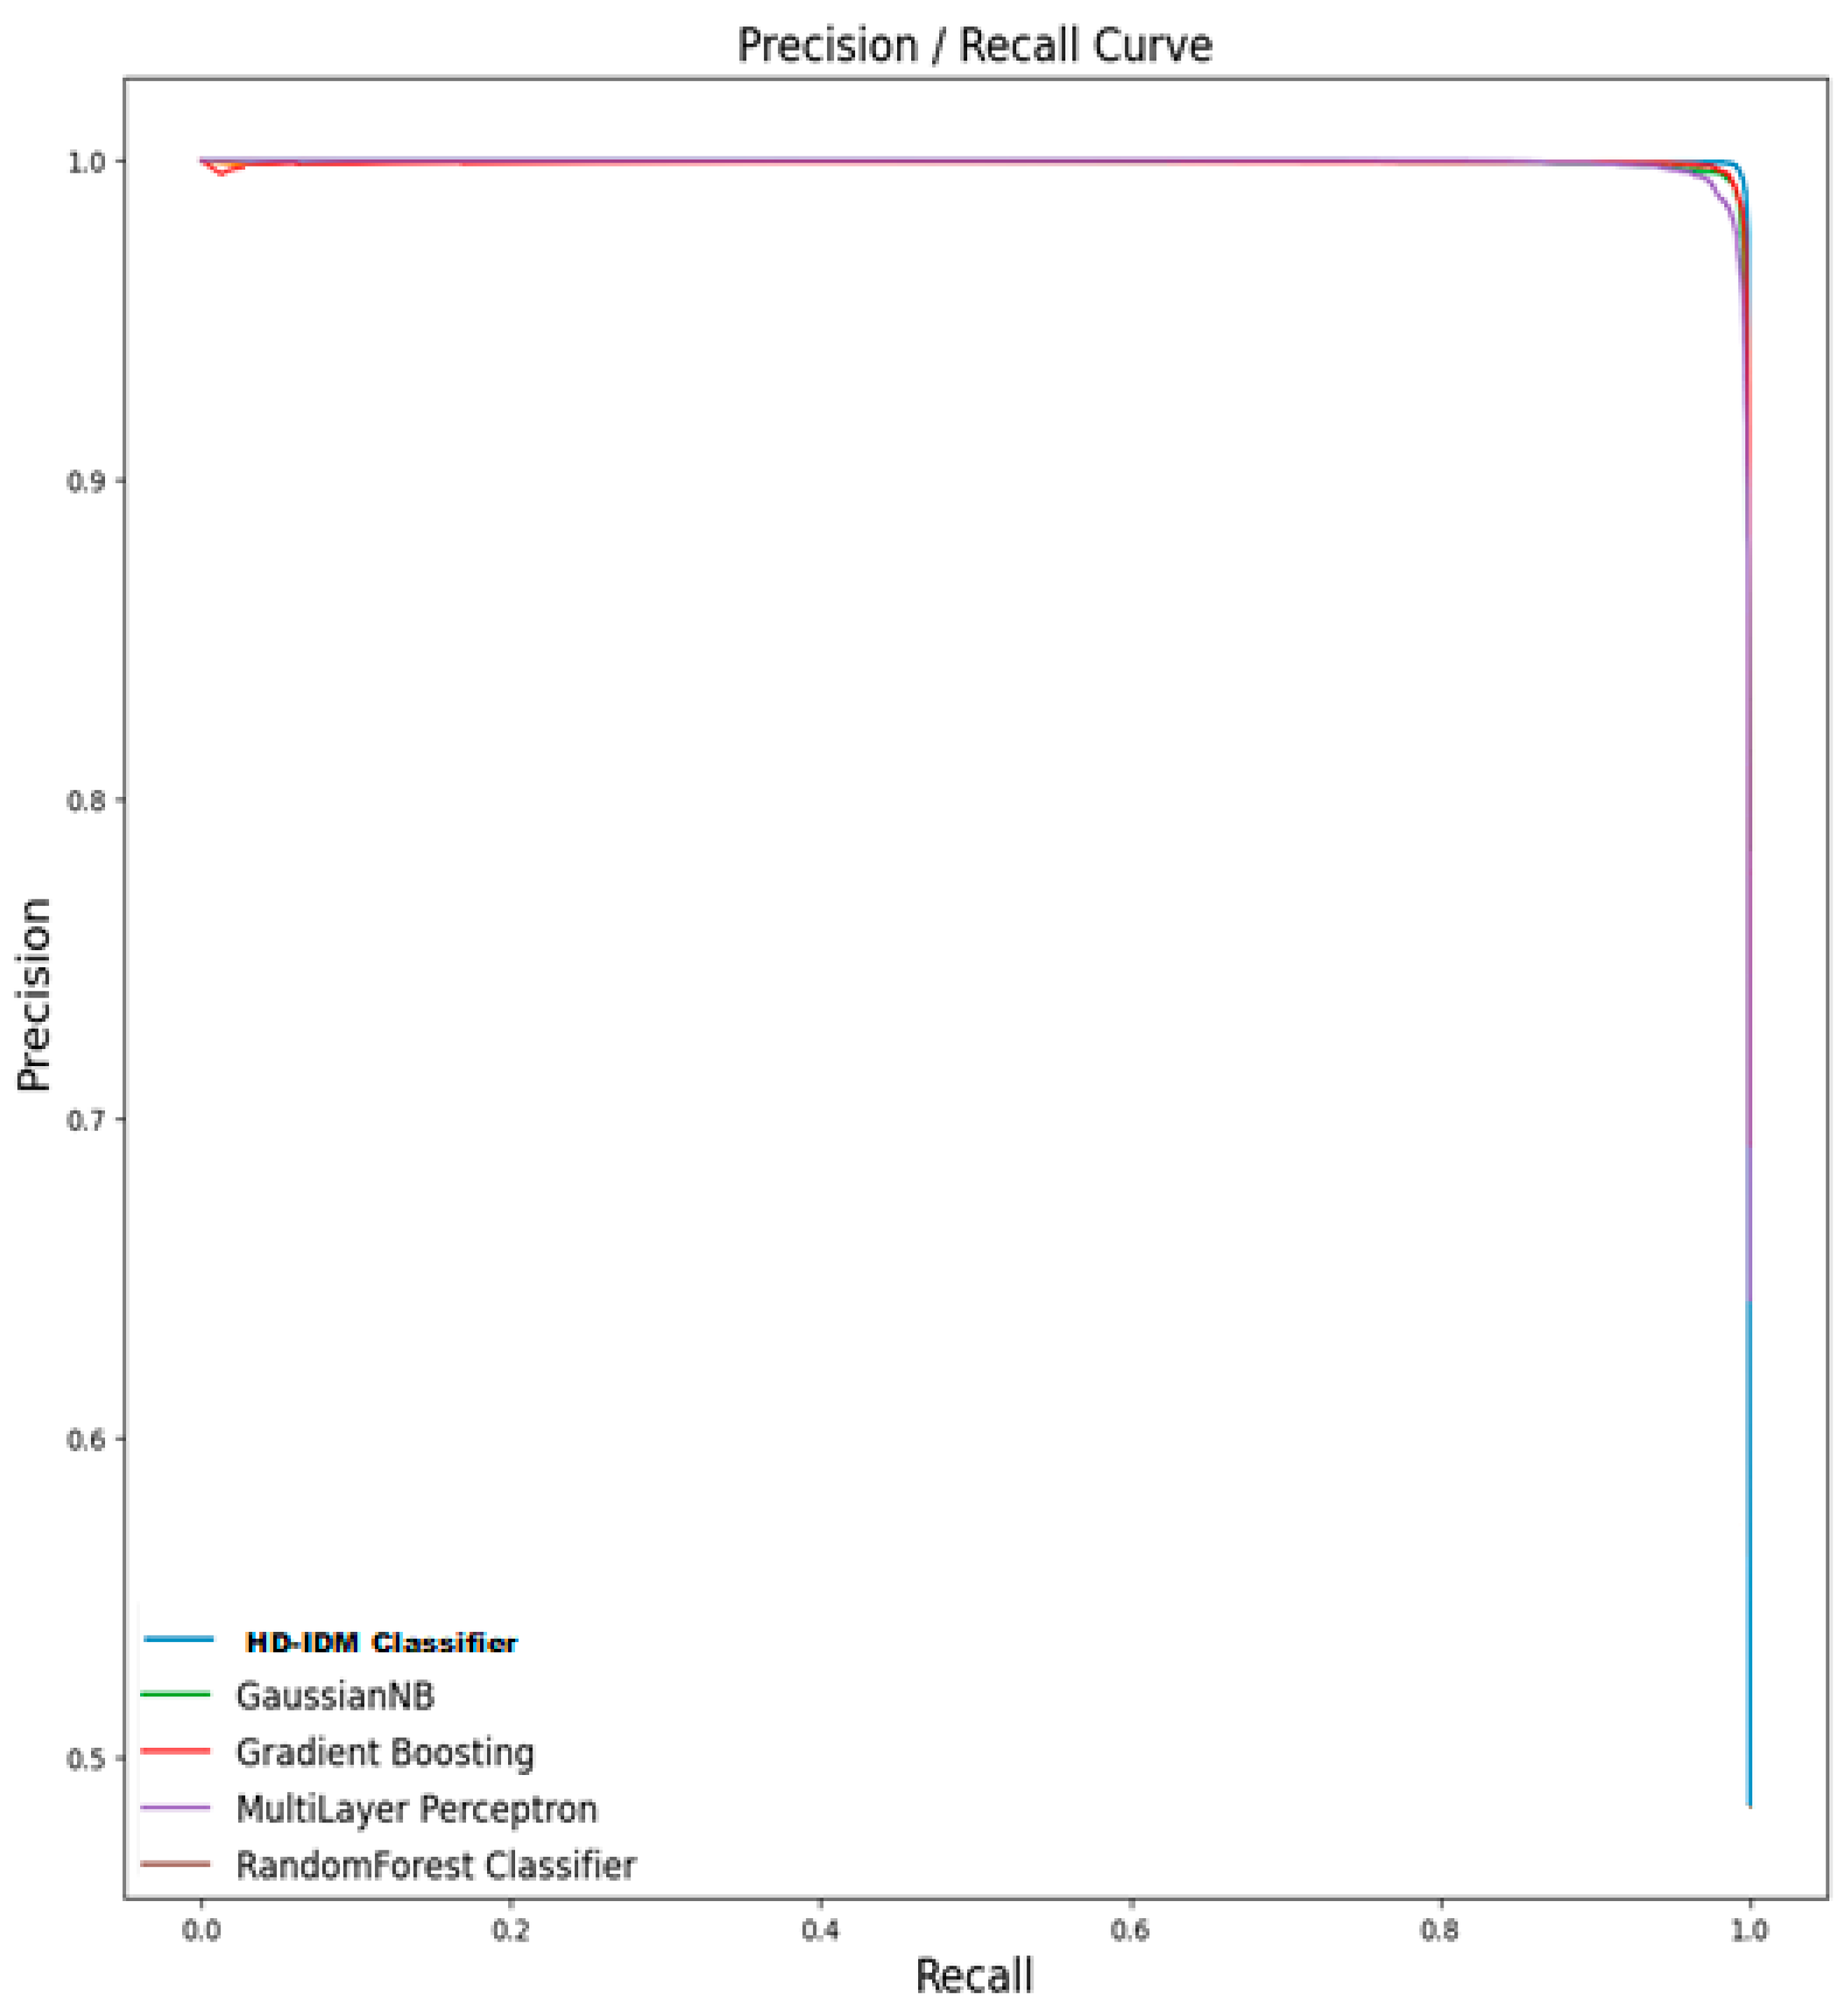
Figure 5 presents the precision/recall curve analysis on the CSE-CIC-IDS2018 dataset, the outperformance of the HD-IDM classifier is evident when examining its precision–recall curve. This curve showcases its remarkable ability to balance precision and recall effectively. The curve for the HD-IDM classifier exhibits a steep ascent at the initial stages, indicating high precision even when recall is low. This signifies that when the classifier makes a positive prediction, it is highly likely to be correct.
The precision–recall curve analysis accentuates the exceptional performance of the HD-IDM classifier. Across varying classification thresholds, this classifier consistently maintains its advantageous position, surpassing other classifiers in the delicate trade-off between precision and recall. The notably high area under the precision–recall curve (AUC-PR) further underscores its prowess. This high AUC-PR attests to the HD-IDM classifier’s unique ability to concurrently achieve both high precision and substantial recall. In practical terms, this implies that the HD-IDM classifier excels at making accurate positive predictions while diligently minimizing false positives—a quality of immense significance, particularly in contexts where precision and false-positive reduction are critical.
4.3. Results on NSL KDD Dataset
The NSL KDD dataset is a widely-acknowledged benchmark dataset in the realm of intrusion detection for computer networks. This dataset represents an enhanced and more lifelike iteration of the original KDD Cup ‘99 dataset, meticulously crafted to tackle the limitations of its predecessor. Within its comprehensive repository, the NSL KDD dataset encompasses a rich spectrum of network traffic data, incorporating both benign and diverse forms of malicious attack traffic. As a consequence, it emerges as an invaluable asset for the evaluation and advancement of intrusion detection systems. Its applicability is further amplified by its ability to faithfully mirror real-world network traffic scenarios, rendering it a preferred choice for researchers and practitioners who seek to rigorously assess and refine their intrusion detection algorithms.
The performance assessment outcomes on the NSL KDD dataset, as meticulously presented in
Table 3, offer profound insights into the efficacy of diverse classifiers in the realm of intrusion detection within intricate network environments. Amidst this spectrum of classifiers, the HD-IDM classifier stands as a beacon of exceptional performance, as evidenced by the comprehensive metrics provided. It attains an extraordinary accuracy level of 99.77%, eloquently affirming its consistent capability to render precise predictions across the dataset.
Furthermore, the HD-IDM classifier showcases an exceptional precision rate, culminating at an impressive 98.65%. This elevated precision signifies that when it deduces a positive case, the likelihood of it being correct is exceedingly high, rendering it an optimal choice for applications where the minimization of false positives assumes paramount importance.
Additionally, the HD-IDM classifier upholds an imposing recall rate of 98.42%. This signifies its proficiency in accurately identifying the majority of authentic positive cases while diligently restricting the occurrence of false negatives to a minimum. The F1-score, reaching a remarkable 98.14%, further underscores its resilience by striking an outstanding equilibrium between precision and recall This equilibrium is of paramount importance in classification tasks where both minimizing false positives and false negatives are crucial. The HD-IDM classifier excels across all key metrics, displaying exceptional accuracy, precision, recall, and F1-score. Its ability to consistently provide accurate predictions while maintaining an excellent balance between precision and recall firmly establishes it as the top choice for classification tasks demanding precision and reliability.
Figure 6 presents the outperformance of the HD-IDM classifier in terms of ROC curve analysis on the NSL KDD dataset. The HD-IDM classifier exhibits remarkable outperformance in terms of ROC (receiver operating characteristic) analysis. Its ROC curve consistently positions closer to the top-left corner of the ROC space compared to other classifiers, highlighting its superior ability to distinguish between true-positive rates (TPR) and false-positive rates (FPR).
The ROC curve of the HD-IDM classifier features a steep ascent, indicating high TPR even when FPR is low. This signifies its capacity to correctly identify positive cases while maintaining a low rate of false positives. As the threshold varies, the curve maintains its advantageous position, consistently outperforming other classifiers in TPR and FPR trade-offs. The area under the ROC curve (AUC), a crucial performance metric, is notably high for the HD-IDM classifier, emphasizing its exceptional capability to effectively differentiate between positive and negative cases across various threshold settings.
The ROC analysis demonstrates the HD-IDM classifier’s outperformance. Its curve’s proximity to the top-left corner, steep ascent, and high AUC reaffirm its ability to achieve a superior balance between true-positive rate and false-positive rate, establishing it as a robust choice for classification tasks demanding precise discrimination between positive and negative cases.
The outperformance of the HD-IDM classifier, as demonstrated in
Figure 7, is further highlighted when examining its performance through precision/recall curve analysis on the NSL KDD dataset. The outperformance of the HD-IDM classifier is evident when considering its precision–recall curve analysis. This curve illustrates its remarkable ability to balance precision and recall effectively. The precision–recall curve of the HD-IDM classifier exhibits a steep ascent at the start, signifying high precision even when recall is low. This indicates that when the classifier predicts a positive case, it is highly likely to be correct.
As the classification threshold varies, the precision–recall curve consistently retains its advantageous position, surpassing other classifiers in terms of precision and recall trade-offs. The area under the precision–recall curve (AUC-PR), a crucial performance metric, is notably high for the HD-IDM Classifier. This elevated AUC-PR exemplifies its capacity to simultaneously attain high precision and high recall. The precision–recall curve analysis accentuates the HD-IDM classifier’s superior performance, evident in its steep ascent, substantial AUC-PR, and its capability to sustain elevated precision while achieving substantial recall. These attributes establish it as a robust choice for classification tasks that prioritize precision and the reduction in false positives.
4.4. Results on CIC-DDoS2019
CIC-DDoS2019 stands as a substantial dataset with great importance for conducting research and in-depth analysis of distributed denial of service (DDoS) attacks. It encompasses an extensive repository of network traffic data meticulously curated for the explicit purpose of studying and mitigating these disruptive and potentially damaging attacks. Within this dataset, one can find a diverse array of DDoS attack types, as well as legitimate network traffic, rendering it an invaluable asset for the development and thorough evaluation of DDoS detection and prevention mechanisms. The cybersecurity community and researchers alike place significant reliance on CIC-DDoS2019 to bolster the robustness of network infrastructures against these malevolent and potentially devastating attacks.
The performance assessment outcomes on the CIC-DDoS2019 dataset, as showcased in
Table 4, offer valuable insights into the efficacy of different classifiers for intrusion detection within a complex network environment. Among the featured classifiers, the HD-IDM classifier showcases remarkable superiority in numerous crucial metrics. It attains an exceptional accuracy rate of 99.91%, underscoring its consistent capacity to make precise predictions across the dataset. This level of accuracy solidifies its standing as a leading performer among the classifiers.
Furthermore, the HD-IDM classifier demonstrates outstanding precision, achieving an impressive 99.62%. High precision signifies that when it categorizes a data point as positive, it possesses a high likelihood of being accurate. This precision is particularly crucial in applications where minimizing false positives is essential. Additionally, the HD-IDM classifier maintains an impressive recall of 99.43%. This signifies its effectiveness in correctly identifying the majority of actual positive cases while keeping false negatives to a minimum.
The F1-score, which balances precision and recall, further underscores the robustness of the HD-IDM classifier, registering at 99.52%. This equilibrium is vital in classification tasks where both minimizing false positives and false negatives are of paramount importance. The HD-IDM classifier outperforms other classifiers across accuracy, precision, recall, and F1-score. Its consistent ability to make accurate predictions while striking a balance between precision and recall establishes it as the top choice for classification tasks demanding precision and reliability.
Figure 8 presents the outperformance of the HD-IDM classifier in terms of ROC curve analysis on the CIC-DDoS2019 dataset. The HD-IDM classifier achieves a significant achievement in ROC analysis. Its ROC curve consistently positions closer to the top-left corner of the ROC space compared to other classifiers, showcasing its superior ability to distinguish between true-positive rates (TPR) and false-positive rates (FPR).
The ROC curve of the HD-IDM classifier features a steep ascent, indicating high TPR even when FPR is low. This demonstrates its capability to correctly identify positive cases while maintaining a low rate of false positives. As the threshold varies, the curve maintains its advantageous position, consistently outperforming other classifiers in TPR and FPR trade-offs. The area under the ROC curve (AUC), a critical performance metric, is notably high for the HD-IDM classifier, highlighting its exceptional ability to effectively differentiate between positive and negative cases across various threshold settings. The HD-IDM classifier’s achievement in ROC analysis is evident through its curve’s proximity to the top-left corner, steep ascent, and high AUC, establishing it as a robust choice for classification tasks requiring precise discrimination between positive and negative cases.
The outperformance of the HD-IDM classifier, as demonstrated in
Figure 9, is further highlighted when examining its performance through precision/recall curve analysis on the CIC-DDoS2019 dataset. The precision/recall curve analysis emphasizes the significant outperformance of the HD-IDM classifier. Its curve showcases a steep ascent at the initial stages, indicating high precision even when recall is low, highlighting its ability to make accurate positive predictions.
As the threshold changes, the HD-IDM classifier’s curve consistently maintains its advantageous position, outperforming other classifiers in terms of precision and recall trade-offs. The area under the precision/recall curve (AUC-PR), a key performance metric, is notably high for the HD-IDM classifier. This high AUC-PR demonstrates its ability to achieve both high precision and high recall simultaneously, signifying its excellence in capturing positive cases while minimizing false positives. The analysis of the precision/recall curve emphasizes the exceptional performance of the HD-IDM classifier. Its steep incline, elevated AUC-PR, and capability to sustain a high level of precision while concurrently achieving substantial recall firmly position it as the prime selection for classification tasks that prioritize precision and dependability.
4.5. Discussion
As presented in the results section, we tested HD-IDM on four datasets: CSE-CIC-IDS2017, CSE-CIC-IDS2018, NSL KDD, and CIC-DDoS2019. We can find that the HD-IDM classifier achieved remarkable performance metrics on all datasets. It attains an outstanding accuracy of 99.91%, showcasing its consistent precision across the dataset. With an impressive precision of 99.62%, it excels in accurately categorizing positive cases, crucial for minimizing false positives. Additionally, maintaining a high recall of 99.43%, it effectively identifies the majority of actual positive cases while minimizing false negatives. The F1-score of 99.52% emphasizes its robustness, making it the top choice for classification tasks requiring precision and reliability.
Further, we compare the performance of HD-IDM with other existing methods in terms of accurate prediction and the error rate using the four datasets in
Figure 10.
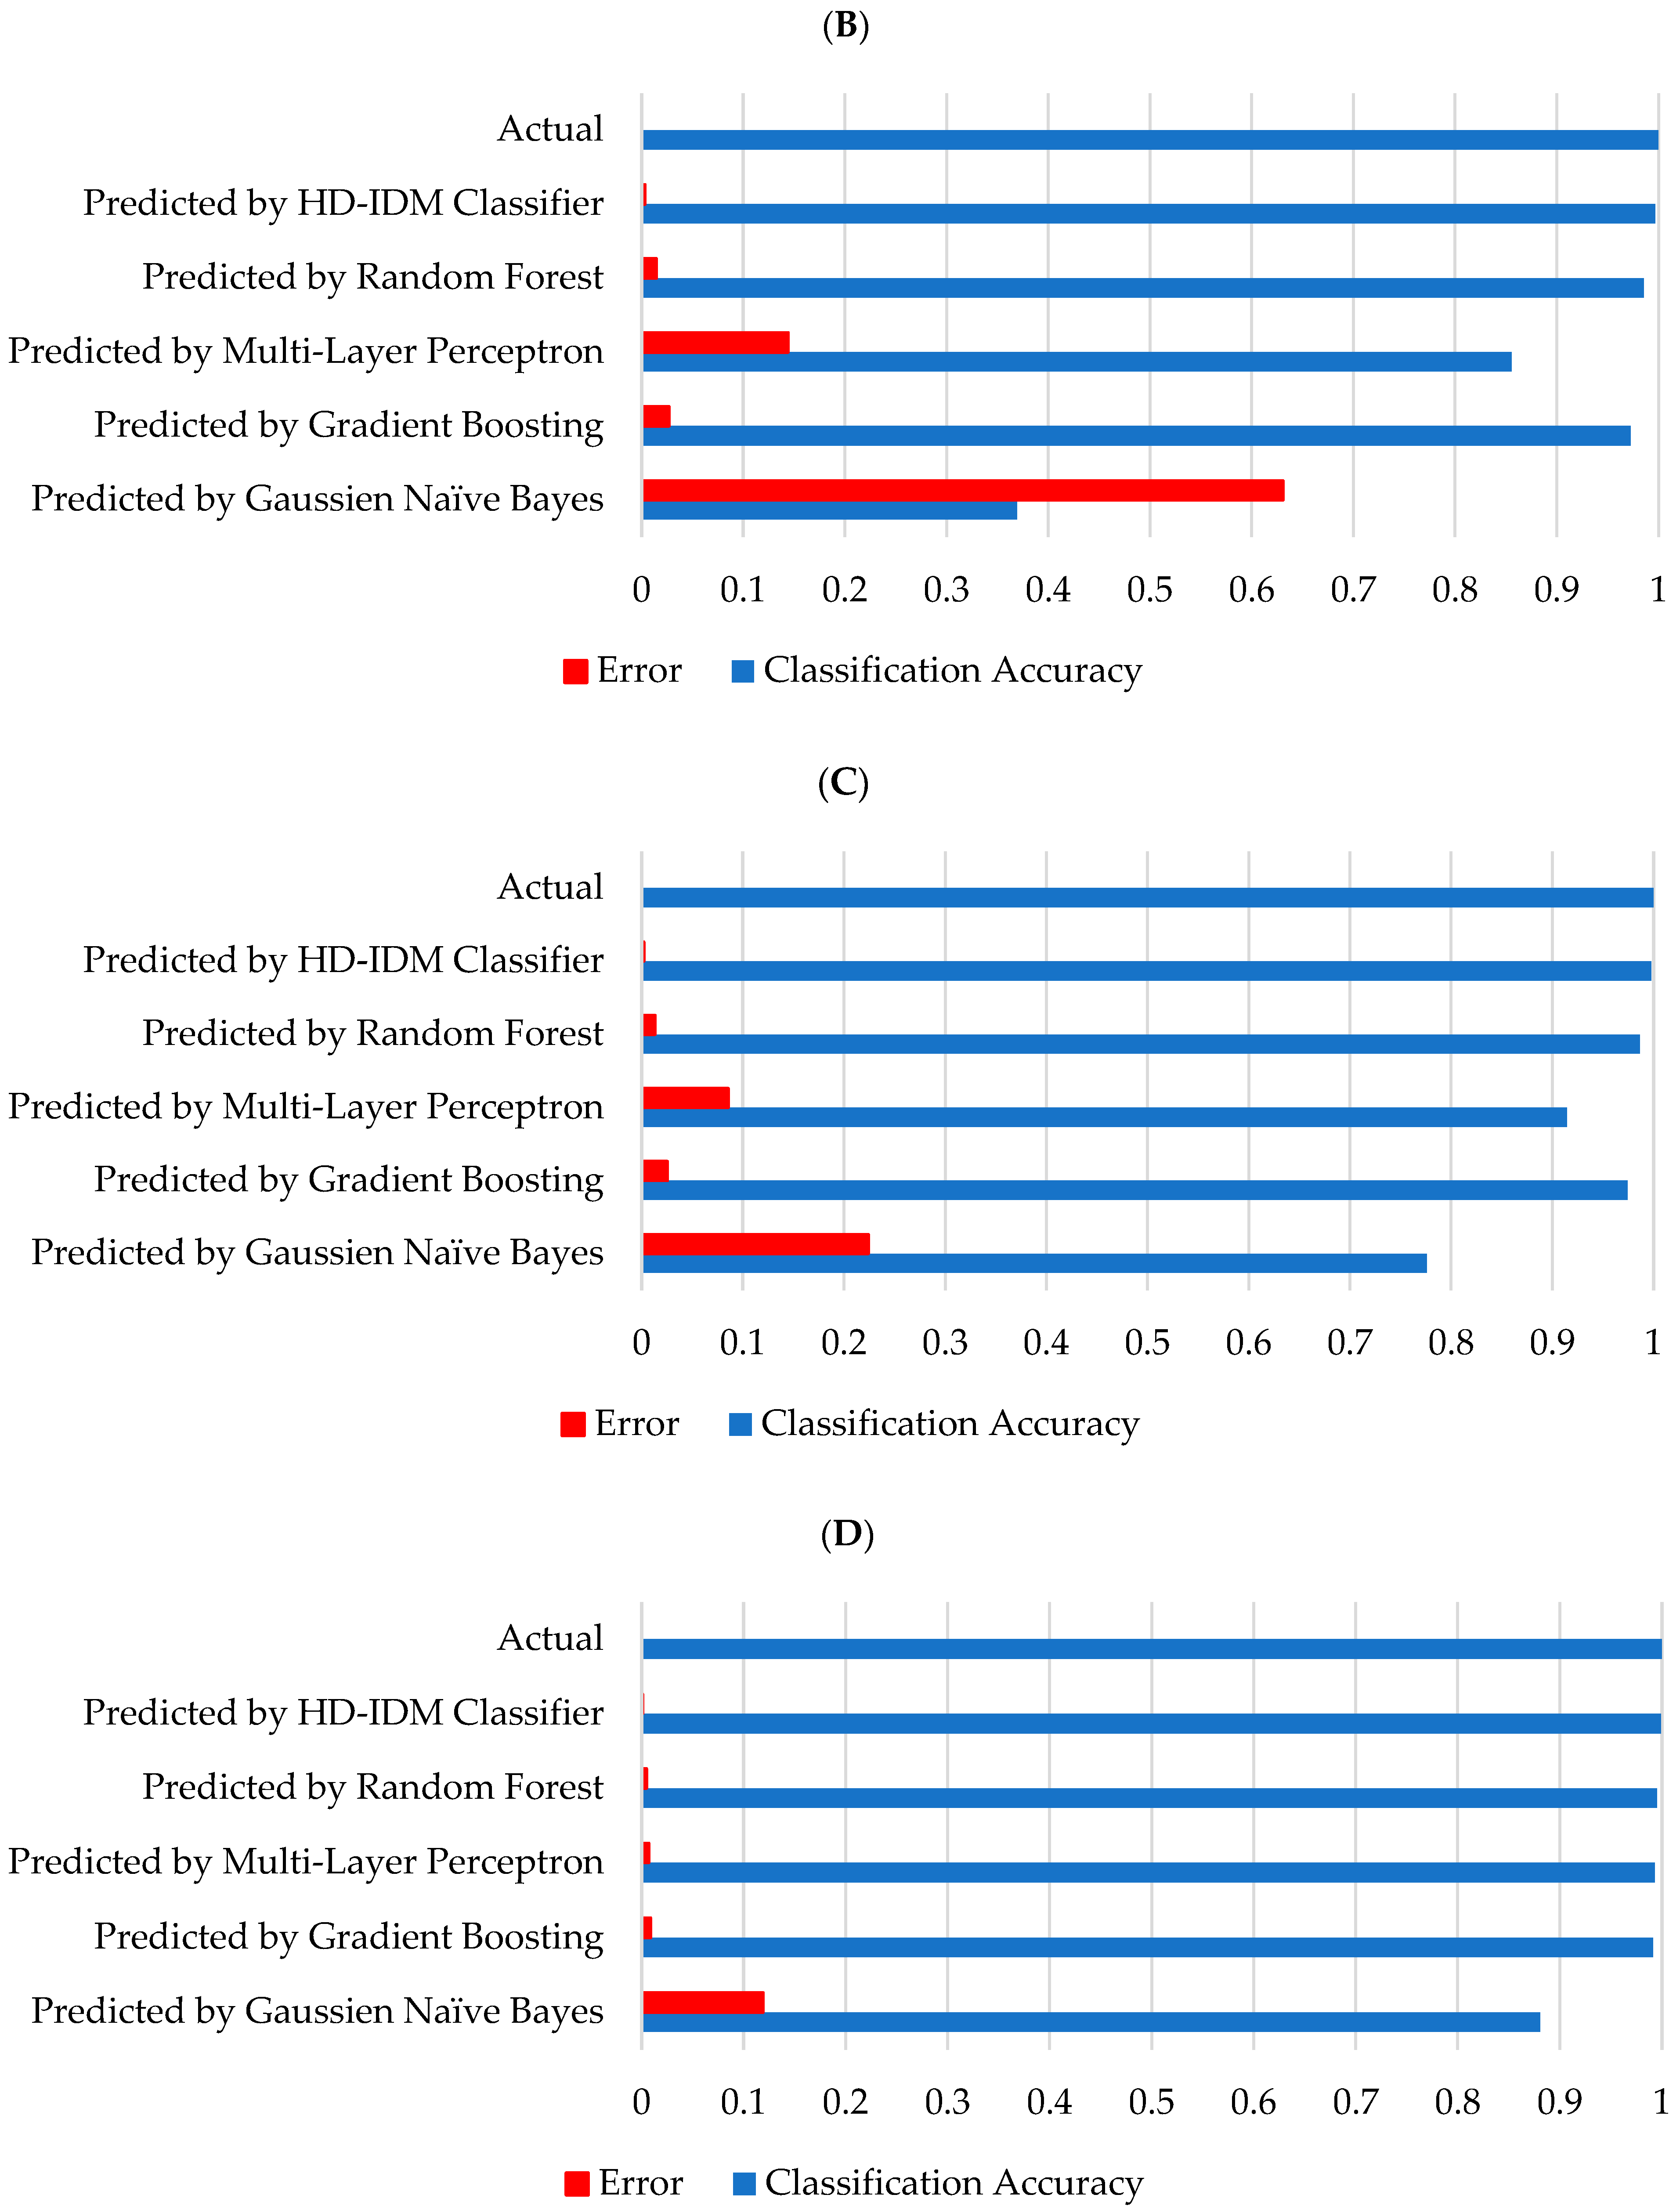
Figure 10A presents the evaluation of different methods on the CSE-CIC-IDS2017 dataset, we assessed their classification accuracy. The results show that the Gaussian naïve Bayes had an accuracy of 78%, with an error of 22%. Gradient boosting and multi-layer perceptron achieved higher accuracy at 98%, with a minimal error of 2%. Random forest further improved with a 99% accuracy and a 1% error rate. Remarkably, the HD-IDM classifier outperformed all, reaching a perfect accuracy of 100% and a remarkable error rate of 0%, aligning closely with the actual values. This indicates the superior performance of the HD-IDM classifier in accurately predicting classifications on the CSE-CIC-IDS2017 dataset.
Figure 10B the assessment of various models on the CSE-CIC-IDS2017 dataset based on classification accuracy and error rates. Gaussian naïve Bayes demonstrated a lower accuracy of 36.92% with a higher error rate of 63%. Gradient boosting showed a notable improvement with a 97.28% accuracy and a 3% error rate. Multi-layer perceptron achieved an accuracy of 85.58%, but with a higher error rate of 14%. Random forest outperformed with a 98.55% accuracy and a minimal 1% error rate. The HD-IDM classifier showcased remarkable accuracy at 99.66%, with an incredibly low error rate of 0%. Notably, the HD-IDM classifier closely aligned with the actual values, which had a perfect accuracy of 100% and an error rate of 0%, emphasizing its superior performance in classification on the evaluated dataset.
Figure 10C describes the classification accuracy and error rates on the NSL KDD dataset. Gaussian naïve Bayes exhibited an accuracy of 77.59% with an error rate of 22%. Gradient boosting showed a high accuracy of 97.45% and a low error rate of 3%. Multi-layer perceptron achieved an accuracy of 91.44% with a corresponding error rate of 9%. Random forest demonstrated excellent performance with a 98.67% accuracy and a minimal 1% error rate. The HD-IDM classifier displayed outstanding accuracy at 99.78%, with an exceptionally low error rate of 0%. Importantly, the HD-IDM classifier closely matched the actual values, which had a perfect accuracy of 100% and an error rate of 0%, emphasizing its exceptional performance in accurately classifying the evaluated dataset.
Figure 10D presents the classification accuracy and error rates on CIC-DDoS2019 dataset. Gaussian naïve Bayes achieved an accuracy of 88.08% with an error rate of 11.92%. Gradient boosting demonstrated exceptional accuracy at 99.13% and a minimal error rate of 0.87%. The multi-layer perceptron also performed remarkably well with an accuracy of 99.30% and a low error rate of 0.70%. Random forest exhibited a high accuracy of 99.51% and a minimal error rate of 0.49%. Notably, the HD-IDM classifier outperformed all others, boasting an impressive accuracy of 99.91% and an exceptionally low error rate of 0.09%. These results closely aligned with the actual values, which had a perfect accuracy of 100% and an error rate of 0%, emphasizing the outstanding performance of the HD-IDM classifier in accurately predicting the evaluated dataset.
Further, we perform the ANOVA test. The analysis of variance (ANOVA) reveals a notable source of variation among the groups, with a very low p-value. In statistical terms, a p-value below 0.05 indicates that the observed differences between the groups are highly unlikely to be due to random chance alone. This provides strong statistical evidence supporting the conclusion that there are significant differences in the performance of the classification methods, affirming the reliability and meaningfulness of the results.
Table 5,
Table 6,
Table 7 and
Table 8 provide a summary of statistical measures for different groups, including Gaussian naïve Bayes, gradient boosting, multi-layer perceptron, random forest, and the HD-IDM classifier. Each group has four data points, and the averages and variances across the groups are presented. The ANOVA reveals a significant source of variation between the groups, indicating that there are notable differences in the performance of the classification methods. The F-value and
p-value support the statistical significance of these differences. Overall, the table offers insights into the impact of different classifiers on the observed variations in the data.
The results presented in the above tables are statistically significant. The ANOVA indicates a significant source of variation between the groups, and the associated p-value is very small. In statistical terms, a small p-value (typically below 0.05) suggests that the observed differences between the groups are unlikely to have occurred by random chance alone. Therefore, the statistical evidence supports the conclusion that there are significant differences in the performance of the classification methods, making the results meaningful and reliable.


 ,
, 


