Article

Spillovers across the Asian OPEC+ Financial Market

by
Darko B. Vuković
1,2,*,
Senanu Dekpo-Adza
3,
Vladislav Khmelnitskiy
3 and
Mustafa Özer
4
1
International Laboratory for Finance and Financial Markets, Faculty of Economics, People’s Friendship University of Russia (RUDN University), Miklukho-Maklaya Str. 6, Moscow 117198, Russia
2
Geographical Institute “Jovan Cvijic” SASA, Djure Jaksica 9, 11000 Belgrade, Serbia
3
St. Petersburg School of Economics and Management, HSE University, Kantemirovskaya 3A, Office 331, Sankt Petersburg 194100, Russia
4
Department of Economics, Faculty of Economics and Administrative Sciences, Anadolu University, Eskişehir 26470, Turkey
*
Author to whom correspondence should be addressed.
Mathematics 2023, 11(18), 4005; https://doi.org/10.3390/math11184005
Submission received: 8 August 2023 / Revised: 7 September 2023 / Accepted: 15 September 2023 / Published: 21 September 2023
(This article belongs to the Special Issue The Econometric Analysis of Financial Markets)

Abstract

:
This research utilizes the Diebold and Yilmaz spillover model to examine the correlation between geopolitical events, natural disasters, and oil stock returns in Asian OPEC+ member countries. The study extends prior research by investigating the dynamics of the Asian OPEC+ oil market in light of recent exogenous events. The analysis commences by creating a self-generated Asian OPEC+ index, which demonstrates significant volatility, as indicated by GARCH (1, 1) model estimation. The results obtained from the Diebold and Yilmaz spillover test indicate that, on average, there is a moderate degree of connectedness among the variables. However, in the event of global-level shocks or shocks specifically affecting Asian OPEC+ countries, a heightened level of connectedness is found. Prominent instances of spillover events observed in the volatility analysis conducted during the previous decade include the COVID-19 pandemic, the conflict between Russia and Ukraine, and the Turkey earthquake of 2023. Based on the facts, it is recommended that investors take into account the potential risks linked to regions that are susceptible to natural calamities and geopolitical occurrences while devising their portfolios for oil stocks. The results further highlight the significance of integrating these aspects into investors’ decision-making procedures and stress the need for risk management tactics that consider geopolitical risks and natural disasters in the oil equity market.

1. Introduction

Technology and globalization have interconnected market forces across various industries and geographical borders. This implies that the occurrences within a particular economic system can potentially impact other economic activities that are not directly related, sometimes referred to as spillover effects. Over the course of recent decades, the regions of the Middle East and Asia have experienced a series of significant occurrences that have had far-reaching implications for global energy production as well as distribution. The primary objective of this study is to examine the presence, direction, and attributes of spillover effects on oil stock returns in Asian OPEC+ nations. The intention is to offer significant information to investors, resource managers, regulators, and market participants.
Against the backdrop of an intensifying worldwide economic downturn, there was a notable upswing in investment within the energy industry, with a growth rate of 8% observed in 2022, culminating in a cumulative sum of USD 2.4 trillion. According to the 2023 report published by the International Energy Agency [1], it is anticipated that this particular investment will experience a further increase of 17%, reaching a total of USD 2.8 trillion in 2023. This development would establish it as the most substantial recorded capital investment thus far. The energy sector has not experienced a significant decrease in investor confidence despite the presence of several factors such as high prices, increasing expenses, economic uncertainty, concerns over energy security, and imperatives related to climate policy [2]. The integrated oil and gas business is a sector that has garnered significant international interest. The market under consideration has a notable degree of volatility, rendering it one of the most unpredictable and unstable markets on a global scale. It possesses a substantial market capitalization and offers considerable anticipated returns for shareholders and investors. However, the rapid expansion of both external and internal shocks to the industry in recent times has generated considerable conjecture. There is a growing public concern regarding potential disruptions to the oil supply, as shareholders express concerns regarding the potential consequences of such disruptions on their financial returns in both the short and long term.
The phenomenon of spillover effects in energy markets, specifically with regard to the returns of oil, has received considerable scholarly interest. Spillover effects manifest when disturbances originating in a specific segment of the global economy disseminate and exert an influence on other geographical areas or financial markets. Within the framework of oil markets, these shocks can materialize in the form of rapid price swings, delays in supply, or geopolitical tensions. The widespread nature of spillover effects in financial markets has been underlined in studies conducted by [3]. These studies shed light on the interconnectedness of global financial markets, illustrating how events occurring in a particular country or region can have reverberating impacts on a global scale. Spillover effects frequently arise as a result of the interdependence of energy markets, whereby disparities in supply and demand within a particular region can significantly influence global oil prices. The oil price shocks that occurred throughout the 1970s, such as the OPEC oil embargo, served as a notable illustration of the extensive implications resulting from disturbances within the oil market. The preceding shocks resulted in notable economic consequences, affecting not only states involved in oil production but also those reliant on oil imports. In the latter, escalating energy expenses had a role in exacerbating inflationary forces and precipitating economic contractions [4].
Furthermore, the examination of risk and returns has undergone significant development and increased intricacy due to the extensive integration of technology [5,6]. The spread of news and updates related to regional occurrences such as geopolitical incidents, natural disasters, and worldwide disruptions can cause disruptions in economic markets, hence prompting market participants to react in a corresponding manner. The shifts in the supply and demand dynamics of local crude oil markets have been observed, as noted by [7]. In the present context, the term “spillover” pertains to the influence imposed by non-oil-related occurrences, such as geopolitical events and natural disasters, on the oil market. The energy market holds significant importance in global market dynamics as it plays a crucial role in both industrial development and home sustenance. The research conducted by [8] demonstrates that oil markets display bidirectional spillover transmission characteristics, which are also heightened by significant occurrences such as the recent global COVID-19 epidemic. Moreover, it has been observed that significant geopolitical risk shocks in the oil market have been linked to Russia. Consequently, there exists a responsibility for investors and scholars to assess the potential impact of these unrelated occurrences on market prices and returns [9]. An effective initial step involves comprehending the extent of impacts exhibited by certain areas or nations, exemplified by the Asian members of OPEC+.
The Organization of the Petroleum Exporting Countries and its Allies (OPEC+) is a prominent international organization that aims to stabilize and regulate the global oil market. OPEC+ comprises both OPEC member countries and non-member countries. The main distinction between OPEC+ members and non-members relates to their formal membership status within the organization. OPEC member countries, including prominent oil producers such as Saudi Arabia, Iran, and Venezuela, have full voting rights and actively participate in decision-making processes. The member countries share the joint responsibility of managing oil production levels and implementing production quotas to regulate global oil supply and ensure price stability. Non-member countries of OPEC+ are typically prominent oil-producing nations that do not possess official membership within OPEC, yet have established collaborative alliances with the organization to effectively synchronize oil production plans. These countries are commonly referred to as “non-member OPEC+ countries” [10]. Prominent countries outside the OPEC+ membership, such as Russia, Oman, Malaysia, and Kazakhstan, are part of the Asian OPEC+ members. While those who are not members of OPEC do not possess the power to vote in the organization’s decision-making processes, they actively engage in collaboration with OPEC member countries to collectively manage oil output and foster stability within the market. The inclusion of non-member countries inside the OPEC+ framework holds major implications. These countries frequently coordinate their oil production strategy with OPEC decisions, willingly agreeing to cuts or increases in production to ensure market stability.
Through collaboration with OPEC, non-members of the organization play a role in stabilizing the worldwide equilibrium between the supply and demand of oil. This collaborative effort has the potential to provide favorable outcomes in terms of oil prices and enhance market confidence. Yet, non-member countries within the OPEC+ framework encounter specific limitations and challenges. Non-members lack direct authority over OPEC’s decision-making processes and may not possess an equivalent level of influence compared to member nations. The absence of official membership may impose constraints on their capacity to influence policy and exert direct influence over crucial aspects pertaining to oil production quotas and pricing. Additionally, non-member countries have individual interests and priorities that may diverge from those of OPEC member countries. They face the challenge of balancing their domestic economic objectives, such as maximizing revenue from oil exports, while also contributing to the joint endeavors aimed at achieving stability within the worldwide oil market. Occasional conflicts or tensions may arise between non-members and OPEC member countries regarding production levels and market strategies. Extensive studies have been conducted on volatility spillover effects of OPEC oil prices and returns [11,12,13]. Nevertheless, it is imperative to have a more profound comprehension of the intricacies inherent in non-member nations and their engagements with the OPEC+ alliance.
Several scholars have analyzed the volatility and movement of oil returns and prices, particularly in relation to significant risk events such as the financial crisis of 2007–2008 [2], the uncertainty surrounding economic policies in the BRIC countries [14], and declarations made by OPEC [15]. Additional events that have been subject to research include the Gulf War of 1990–1991, the Iraq War of 2003, the occurrences of Hurricanes Rita and Katrina in late 2005, the Arab Spring of 2011, the ongoing COVID-19 pandemic, and the Russia–Ukraine conflicts from 2022 [16]. These studies provide further evidence of the significance of spillover effects on market returns. The current geopolitical landscape has prompted a closer examination of the involvement of significant non-member countries of OPEC+ in the oil trade and financial benefits. This scrutiny is particularly relevant in light of the European sanctions and restrictions imposed on the industry. Given the ongoing challenges faced by OPEC in maintaining global energy pricing and supplies, as well as addressing the Russia–Ukraine crisis, it is pertinent to explore the potential impact of these external factors on the oil returns of non-member countries. Our research contributes to the literature on spillover in the oil market in three ways.
Firstly, the study employs the Diebold–Yilmaz index, which offers an improved approach to investigating this phenomenon. The model quantifies the transmission of volatility or shocks between different markets or assets. It also measures the connectedness and interdependence of markets in terms of volatility rather than direct causality [17]. Secondly, the study focuses its attention on Asian OPEC+ members, encompassing Russia, a prominent oil producer in the region in the context of recent geopolitical events. Finally, the study examines the collective impact of two major exogenous variables—geopolitical events [18] and natural disasters [19]—on the spillover effect in the oil market. In light of significant global events such as the earthquake in Turkey–Syria in 2023, the confrontation between Russia and Ukraine in 2022, the European heatwave in 2022, and the South Asian floods in 2020, these two factors have emerged as the most persistent components. These factors are considered to pose the most significant shocks to oil prices [20,21]. The outcomes of this study hold significant value for market participants as they seek to assess the spillover impact of these external influences. Consequently, this is expected to have an impact on the construction of portfolios and the implementation of hedging strategies within the financial industry. The purpose of this study is to examine the effects that spillovers of geopolitical events and natural disasters have on oil returns among Asian members of OPEC+. The study integrated data collected over a period of twenty years. However, it is important to note that certain noteworthy occurrences, such as geopolitical events, were examined with careful consideration of key factors before the data collection period, and these events might have had an impact on the credibility and validity of the study. The selection of the data period was primarily motivated by the limited accessibility of stock return data for a significant number of the oil businesses that were included in the analysis. The primary reason for this is that many companies recently became listed and hence lack historical stock data.
The foundation of financial decision making lies in the capacity to measure and evaluate risk and return, which are limited to tangible factors that can be precisely and conveniently quantified [5,22]. Still, the emergence of recent external market activities or environmental variables has become a notable concern for investors, as they possess the capacity to induce substantial fluctuations in risk, particularly within the oil market. The main focus of this study is to offer significant insights into the spillover impacts of crucial economic variables. This will ultimately contribute to increasing the accuracy and confidence of decision-making processes for investors operating within the oil market. Moreover, the study holds relevance for key actors in the oil industry, including managers, employees, and policymakers, as it provides an empirical basis for informed decision making during periods of significant global occurrences. Additionally, it facilitates comprehension of the potential consequences for the market. Furthermore, this research aims to establish a platform for academics to develop feasible econometric models capable of predicting or measuring the characteristics of spillover effects. This, in turn, would assist in making informed economic decisions at the individual, firm, and state levels. This study holds particular significance in light of the persistent shocks in the oil market that have been instigated by actions unrelated to the oil industry. Our study comprises five distinct sections. The introductory chapter offers a comprehensive examination of the study’s contextual framework and clearly defines the issue statement, research objectives, and significance. The second section provides an overview of relevant academic literature pertaining to the subject matter areas of geopolitical events and natural disasters that are the focus of this study. The next part provides a comprehensive discussion of the research methodology employed, which includes an examination of the research design, data collection techniques, research model implemented, data processing methods, analysis procedures, and ethical issues taken into account. The subsequent sections of this study clarify the findings and conclusions derived from the research and provide recommendations based on these outcomes.

2. Theoretical Background

According to financial analysts and market observations, oil stocks have gained increased attractiveness and attention in recent periods. This can be attributed to several factors that have contributed to the changing dynamics and sentiment surrounding the oil industry. Most of these factors have emerged from markets/events different from the oil market [23]. The literature proposes two key theoretical underpinnings that provide valuable frameworks for understanding these spillovers: market contagion theory and spillover theory.

2.1. Market Contagion Theory

Market contagion theory refers to the spread of shocks or disturbances from one market to another unrelated market, leading to correlated and synchronized movements across multiple markets [24,25,26]. It suggests that interdependencies and linkages among financial markets can amplify the transmission of shocks, causing contagion effects. According to [24], market contagion occurs when shocks or disturbances in one market lead to significant and rapid spillover effects onto other markets. These shocks can be triggered by various factors, such as geopolitical events or natural disasters. The contagion effect implies that the initial shock spreads beyond the affected market and affects other markets, leading to a broad-based reaction. Market contagion theory assumes that markets are not perfectly efficient and that participants’ reactions to shocks are not always rational [24]. It recognizes the presence of behavioral biases, such as herding behavior and information cascades, which can magnify the transmission of shocks across markets [25,26]. Herding behavior refers to the tendency of investors to imitate the actions of others and follow the crowd during times of uncertainty or crisis. This behavior can lead to overreactions or underreactions, contributing to the contagion effect. The theory also acknowledges that the connectedness and linkages among markets play a crucial role in the propagation of shocks [25]. Globalization, financial integration, and the speed of information dissemination are identified as key factors influencing the contagion effect [24,25]. These factors enhance the transmission channels and make markets more susceptible to contagion.
Empirical studies have provided evidence of market contagion in various contexts. For instance, ref. [26] found evidence of contagion effects during episodes of financial crises, where shocks originating in one market spread to other markets, both domestically and internationally. Similarly, ref. [24] documented the contagion effect during the Asian financial crisis of 1997, where shocks in the affected countries spilled over to other emerging markets. Contagion effects have been observed to manifest in the context of natural disasters within the oil market, underscoring the significance of incorporating non-economic factors into the analysis of this sector [27]. In the context of the spillover of geopolitical events and natural disasters on the oil market among Asian OPEC+ countries, market contagion theory is highly relevant. It helps to explain how shocks in one country or region, such as conflicts, political instability, or natural disasters, can propagate to other oil markets and impact supply, demand, and prices. Understanding these spillover effects is crucial for assessing the vulnerability and resilience of non-member countries of OPEC+ to external shocks.

2.2. Spillover Theory

Spillover theory, however, differs from contagion theory in that it is a broader concept that encompasses the gradual transmission of both positive and negative effects between assets, markets, or sectors within the financial market. Unlike spillover theory, market contagion theory describes widespread adverse market conditions across different markets or asset classes. Spillover theory therefore refers to the transmission and propagation of shocks or disturbances from one economic entity to another, thereby influencing the behavior and performance of the receiving entity [28]. Both concepts are relevant to understanding the connectedness and interdependence of various economic agents and markets, emphasizing the potential for one market or entity to impact others.
According to [29], spillovers can occur through various channels, such as trade linkages, financial connections, and informational flows. These channels enable the transmission of shocks and the diffusion of economic effects across markets and countries. Spillover effects can be both direct, where shocks are transmitted immediately and directly, and indirect, where the effects are transmitted through intermediate channels. Recent studies show that spillovers can be transitory or permanent [30,31,32]. Transitory spillovers refer to short-term or temporary effects that arise from the transmission of shocks. These effects are typically observed in the immediate aftermath of the shock and tend to dissipate over time. Transitory spillovers can be driven by factors such as investor sentiment, market reactions, or temporary disruptions in specific sectors or regions. On the other hand, permanent spillovers represent long-lasting or persistent effects resulting from the transmission of shocks. These effects can persist beyond the initial shock and have a more sustained impact on the receiving entities or markets. Permanent spillovers may be driven by structural changes, fundamental shifts in economic conditions, or persistent linkages between markets or sectors.
Spillovers may also be unidirectional or bidirectional. Unidirectional spillovers occur when the effects of a shock or disturbance in one market influence another market without reciprocal feedback. On the other hand, bidirectional spillovers refer to the reciprocal influence between two or more markets, where the shocks or disturbances in one market can transmit to another market and vice versa. The literature recognizes the distinction between positive and negative spillovers [33]. Positive spillovers refer to beneficial effects that arise from the transmission of positive shocks, such as increased investment or technological advancements. On the other hand, negative spillovers entail adverse consequences resulting from the transmission of negative shocks, such as financial crises or economic downturns [34]. Furthermore, spillover theory acknowledges the role of both domestic and international factors in shaping the transmission of shocks. Internal factors refer to the composition and behavior of the national economy, whereas external factors encompass worldwide economic circumstances, geopolitical occurrences, and policy choices undertaken by foreign nations.

2.3. Spillover of Geopolitical Events on Oil Stock Returns

Previous research has established that a variety of geopolitical risk events, such as macroeconomic announcements [15,35,36], significant political occurrences [20,37], and economic policy uncertainties [14,38], affect asset price returns. Geopolitical risk, as defined by [39], refers to the “efforts of states and organizations to assert control and vie for territory...the risks arising from wars, acts of terrorism, and tensions between states that disrupt the usual and peaceful progression of international relations”. This study employs a Geopolitical Risk Index (GRI) to investigate the effects of geopolitical events on asset returns. In the context of the oil market, there is an indication of a negative impact on asset prices and returns [20,37,39]. These studies also emphasize a concurrent increase in price volatility [40] and a detrimental effect on market sentiment [41]. It is important to note that the extent of these effects varies depending on the specific characteristics of the event under investigation [42]. Collectively, these findings contribute to a comprehensive understanding of the implications of events on various aspects of the market.
One of the most significant geopolitical events within this time range was the 9/11 terrorist attacks, which had a significant impact on oil prices. Ref. [43] found that the attacks led to a persistent increase in oil prices due to increased geopolitical risk and higher oil demand from military operations. Similarly, the Arab Spring, a series of anti-government protests and uprisings across the Arab world in the early 2010s, was considered a relevant event in the volatility of oil prices and returns according to [44]. This event was closely followed by the Libyan war in 2011. Ref. [45] suggested that the Libyan war had a short-term impact on oil supply and returns, with Brent prices rising by 20% in the short run. This assertion aligns with [46], who found that the impact of political tensions is significant in the short term. The most recent geopolitical event within the study’s time domain is the Russia–Ukraine conflict. Ref. [47] performed an event analysis and found limited correlation between the oil market and capital markets in both importing and exporting countries. Ref. [48] assert that the event inflated international energy prices because the two countries involved are major international oil producers and suppliers. The impact of geopolitical events on oil returns is not symmetrical for both oil-importing and oil-exporting countries. Negative events in exporting countries may present the opportunity for higher returns in other exporting countries due to increased demand and price [49].
Economic policy uncertainty (EPU) in some BRICS countries shows a weak effect on oil returns that gradually strengthens in the long term [14]. Ref. [14] found strong volatility spillover effects in Brazil and Russia in the short and medium term. They examined these events from a multiscale perspective using a wavelet-based BEKK-GARCH model that focused on the frequency of the original data. The findings of [50,51] suggest that economic policy uncertainty is significant in determining oil price and return changes. Other literature presents slightly different results in the analysis of economic policy uncertainty in different time domains. Ref. [52] found a negative dependence between crude oil returns and EPU during the financial crisis and Great Recession but observed a positive dependence in prior periods. Ref. [53] observed an increase in spillover effects between oil prices and EPU during the Great Recession of 2007–2009 using the spillover index.
In general, political instability resulting from civil wars, military conflicts, sanctions, and regime changes increases oil prices, especially in Arabian and East European countries [54,55]. Ref. [56] recognized that geopolitical events may not be the primary determinant of oil return volatility within this period and that other factors such as trade disruptions and natural disasters may play contributory or even superior roles. Additionally, it is worth noting that not all macroeconomic announcements are tied to geopolitical risks. In reality, many of these announcements are shaped by various factors including domestic policy choices, global economic patterns, and natural disasters. Most literature on oil spillover focused on the magnitude and direction of spillover. In this study, the transitory or permanence of spillover will be prioritized to contribute to the discussions in the literature.

2.4. Spillover of Natural Disasters and Oil Stock Returns

Natural disasters play a significant role in impacting oil returns, as they can lead to disruptions in oil supply, changes in oil demand, and increased volatility in oil prices. In the context of infectious diseases, such as the COVID-19 pandemic, some research suggests a strong impact on both equity and the oil market. Ref. [57] assessed time–frequency volatility spillovers across global crude oil markets and major energy future markets in China during the pandemic. The study found increased volatility spillovers across different time intervals, indicating heightened transmission of volatility. Similarly, ref. [58] demonstrated that COVID-19 significantly affected short-term stock returns, with economic and health policies contributing to uncertainty and reduced economic activity, subsequently impacting energy production and consumption. Natural disasters such as hurricanes can disrupt oil production and transportation, leading to temporary increases in oil prices. The impact of Hurricane Katrina in 2005 highlighted supply disruptions in the Gulf of Mexico, resulting in temporary oil price increases [59,60]. Conversely, the Fukushima disaster in Japan in 2011 led to reduced oil demand and lower prices due to decreased economic activity [61]. Earthquakes and typhoons in Japan, Indonesia, and China have similarly caused temporary oil price increases due to supply concerns and reconstruction needs [62].
However, research findings also indicate that the impact of natural disasters on oil returns is nuanced. While natural disasters can cause short-term volatility in oil prices, their long-term effects might be less significant, with other factors such as geopolitical tensions and economic growth having a more prominent influence [63,64]. The relationship between natural disasters and oil returns becomes particularly relevant in the context of climate change. As climate change contributes to more frequent and severe natural disasters, the implications for the oil market become substantial. Ref. [65] suggested that climate change could lead to higher oil prices due to the increased occurrence of natural disasters, causing supply disruptions and higher demand for emergency reserves. Additionally, the transition towards renewable energy sources prompted by climate change could affect the demand for fossil fuels, leading to both short-term price volatility and long-term stability in the oil market [66]. In summary, natural disasters have a notable impact on oil returns, with their effects often being temporary and contingent upon the nature of the disaster and its influence on supply and demand factors. As the frequency and severity of natural disasters increase due to climate change, the implications for the oil market become more complex, potentially leading to both short-term volatility and long-term shifts in market dynamics.

3. Research Design

3.1. The Sample

The sample includes monthly data on three key variables: Oil Stock Returns, Geopolitical Risk Index (GRI), and Natural Disaster Index (NDI). The period of data collection is from 1 January 2000 to 1 March 2023.

3.1.1. Dependent Variable: Oil Stock Returns (NOPEC)

The study aimed to analyze the returns of publicly traded oil companies operating in non-member countries of the OPEC+ alliance. Since there was no existing return index specifically designed for these non-member OPEC+ countries, this study created one. The study focused on ten OPEC+ non-member countries: Azerbaijan, Bahrain, Brunei, Kazakhstan, Malaysia, Mexico, Oman, Russia, Sudan, and South Sudan. To construct the index, an extensive search was conducted using a Bloomberg terminal to gather monthly returns data for the period from 2000 to 2023. Initially, 61 publicly listed oil companies from the selected countries were identified. However, due to limited data availability for some recently listed companies, nine were excluded from the stock portfolio. Subsequently, 54 companies met the criteria for inclusion in the index, and they came from four countries: Kazakhstan, Oman, Malaysia, and Russia (Table 1). The weights for these companies within the portfolio were assigned based on their market capitalization as of 29 May 2023. The market capitalization values were converted into USD using exchange rates obtained from Yahoo Finance on 28 May 2023. Since the data period for returns data varied across the companies, multiple data ranges were used to calculate weighted returns for different periods, ensuring the creation of a reliable index. The index created for this study is referred to as the “NOPEC Index,” indicating its purpose as a return index specifically designed for non-member OPEC+ countries (please see Appendix A). The data and other relevant information for this index can be found in Appendix B.

3.1.2. Independent Variables

Geopolitical Risk Index (GRI)

The Geopolitical Risk Index serves as a crucial metric for quantifying the impact of geopolitical events. This index offers a comprehensive and measurable assessment of geopolitical risks. Specifically, the seminal study [39] is widely acknowledged for its meticulous analysis and rigorous methodology in capturing and quantifying these risks. Their index encompasses various indicators, such as political instability, conflicts, policy uncertainty, and diplomatic tensions, thereby providing a holistic evaluation of geopolitical risks. In addition to the overall Geopolitical Risk index, Caldara and Iacoviello also developed two sub-indexes called geopolitical threats and acts (GPRT and GPRA). The GPRT sub-index comprised words associated with categories 1 to 5, which encompassed war, peace, nuclear, and terrorism threats, as well as military buildups. On the other hand, the GPRA sub-index included words related to categories 6 to 8, representing the beginning of war, the escalation of war, and terrorism acts. Notably, the GRI facilitates standardized measurements, enabling comparisons across different times and countries. For this study, a recent iteration of the GRI from [39], which incorporated broader search criteria, was used. The data were acquired from an accessible dedicated site (refer to the provided site: https://www.matteoiacoviello.com/gpr.htm, accessed on 17 March 2023) and subsequently processed and organized to ensure consistency and compatibility with the research objectives. This included identifying relevant periods and aligning the dataset with other variables utilized in the study. Notably, the GRI facilitates standardized measurements, enabling comparisons across different times and countries. This characteristic ensures the data’s reliability and validity when evaluating the geopolitical event factor within the context of spillover analysis in the oil market.

Natural Disaster Index (NDI)

The Natural Disaster Index employed in this study serves to assess the economic ramifications of natural disasters, encompassing both the financial costs and the human toll incurred. The primary data source utilized for constructing this index is the publicly available EMDAT database (refer to https://www.emdat.be), which records occurrences of natural disasters and provides information on mortality, morbidity, and financial losses. Ref. [68] proposed an approach to creating the Natural Disaster Index which was adopted in this study. The methodology employed by [68] is founded on the World Health Organization’s calculation of the DALYs (disability-adjusted life years) lost through injuries and diseases (WHO 2013). Like the DALYs approach, the measurement framework utilizes life years as the unit of analysis. However, whereas DALYs focus solely on the health-related impacts of diseases, Noy’s measurement framework seeks to encompass the broader effects of calamities on human well-being, considering infrastructure and capital destruction. For the study, the index was adapted to a monthly format and recreated on the most recent EMDAT database available up until 1 April 2023.

3.2. The Diebold–Yilmaz Model

This study’s goal is to investigate and quantify the transmission of volatility, including its direction and intensity. We decided to use the approach first suggested by [29] to achieve this. The Diebold–Yilmaz (DY-2012) model allows bilateral volatility spillovers, in contrast to the Spillover Asymmetric Multiplicative Error (SAMEM) model introduced by [69], which necessitates predetermined directions in volatility. Additionally, the DY-2012 model enables us to assess the magnitude of spillovers by constructing an index for volatility transmissions. This feature facilitates meaningful comparisons across different variable sets and model configurations. Lastly, ref. [17] use a framework for generalized Vector Autoregression that does not rely on the order of the variables. This construction encompasses four categories of spillovers: directional, total, net, and net pairwise spillovers. These categories depict the level of connectedness or relationship among variables. The setup of the spillover indexes involves the utilization of a covariance-stationary VAR(p). According to this, we can express:
z t = Φ z t i + ε t ; ε t ( 0 ,   Σ )
where function z t = ( z 1 t ,   z 2 t , , z N t ) is a vector of return/volatility series of dimensions N × 1, Φ represents an N × N matrix of parameters, ε t is a vector of disturbances that are dispersed independently and identically, and Σ is the variance matrix of the error vector ε . The moving average form appears as follows:
z t = i = 0 A i ε t i
where A i is considered to be recursive. A i = ϕ 1 A i 1 + ϕ 1 A i 2 + + ϕ 1 A i p .   A 0 presents a matrix of N × N dimensions, for A i = 0   for i < 0 . The moving average’s coefficients in Equation (2) provide the framework for comprehending the dynamic procedure needed to calculate spillover indices. Prior to presenting the representations for the indices, it is essential to consider the following factors:
  • In forecasting z i , own variance shares represent the fractions of H-step-ahead error variances, which result from shocks to z t , for i = 1 ,   2 ,   ,   N .
  • The fractions of the H-step-ahead error variances in forecasting z i that derive from shocks to z j are known as cross variance shares or spillovers, for i , j = 1 ,   2 ,   ,   N , such that i j .
The H-step-ahead forecast error variance decompositions, indicated by θ i j g , are stated as follows using the generalized VAR framework of KPSS:
θ i j g H = σ j j 1 h = 0 H 1 ( e i A h e j ) 2 h = 0 H 1 ( e i A h A h e i )
where σ j j represents the standard deviation of ε   for the j th equation and where the selection vector is e i , with 1 as the i th element and 0 otherwise. The discrepancy arises from the fact that the combined contributions of the variance of the forecast error do not amount to a total of one, where is j = 1 N θ i j g H   1 . Diebold and Yilmaz (2012) employed a normalization technique whereby each item of the variance decomposition matrix was divided by the total of its respective row. As shown by θ ~ i j g H , the normalized KPSS H-step-ahead forecast error variance decompositions are written as follows:
θ ~ i j g H = θ i j g H j = 1 N θ i j g H  
where i , j = 1 N θ ~ i j g H = 1 and i , j = 1 N θ ~ i j g H = N by construction. Taking these factors into account, the total spillover index is represented as:
S g H = i , j = 1 N θ ~ i j g H i , j = 1 N θ ~ i j g H × 100 = i , j = 1 N θ ~ i j g H N   × 100
In summary, Equation (5) quantifies the extent of spillover contributions resulting from shocks in variables from j to i , for i j .
Table 2 presents related work and literature contributions of spillovers using the Diebold and Yilmaz model. Other similar studies also employed a GARCH model.

3.3. Preliminary Analysis

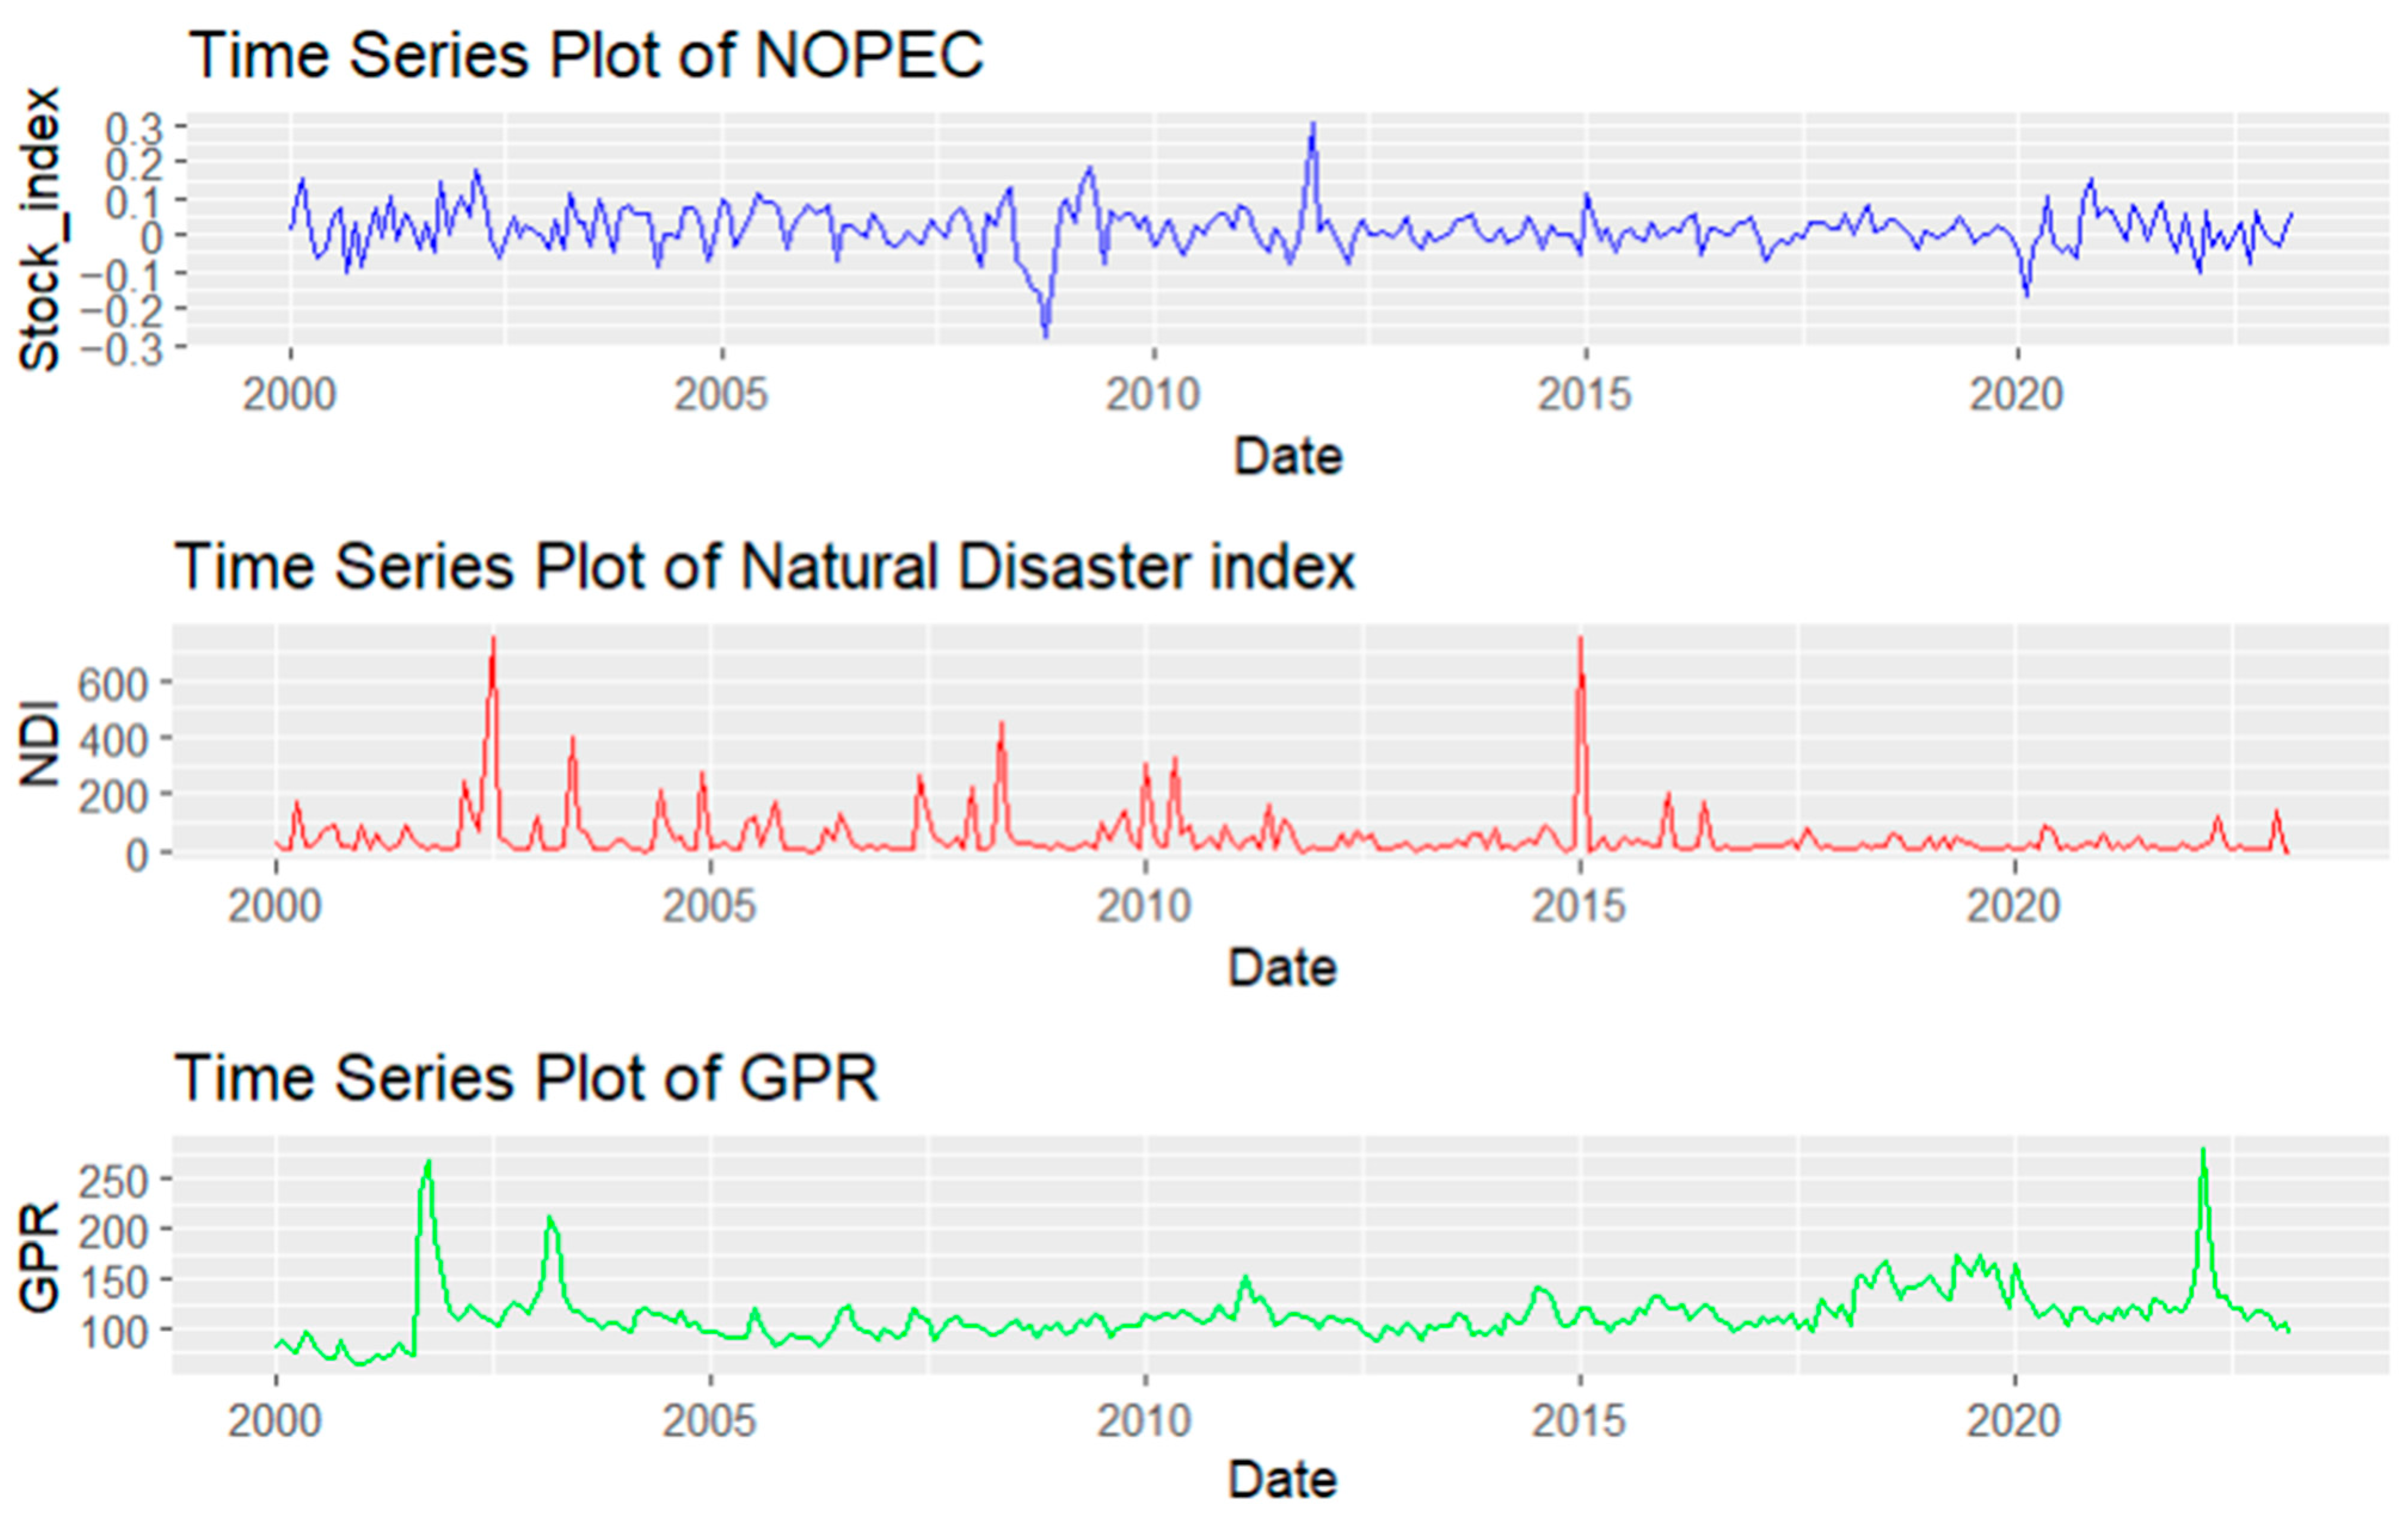
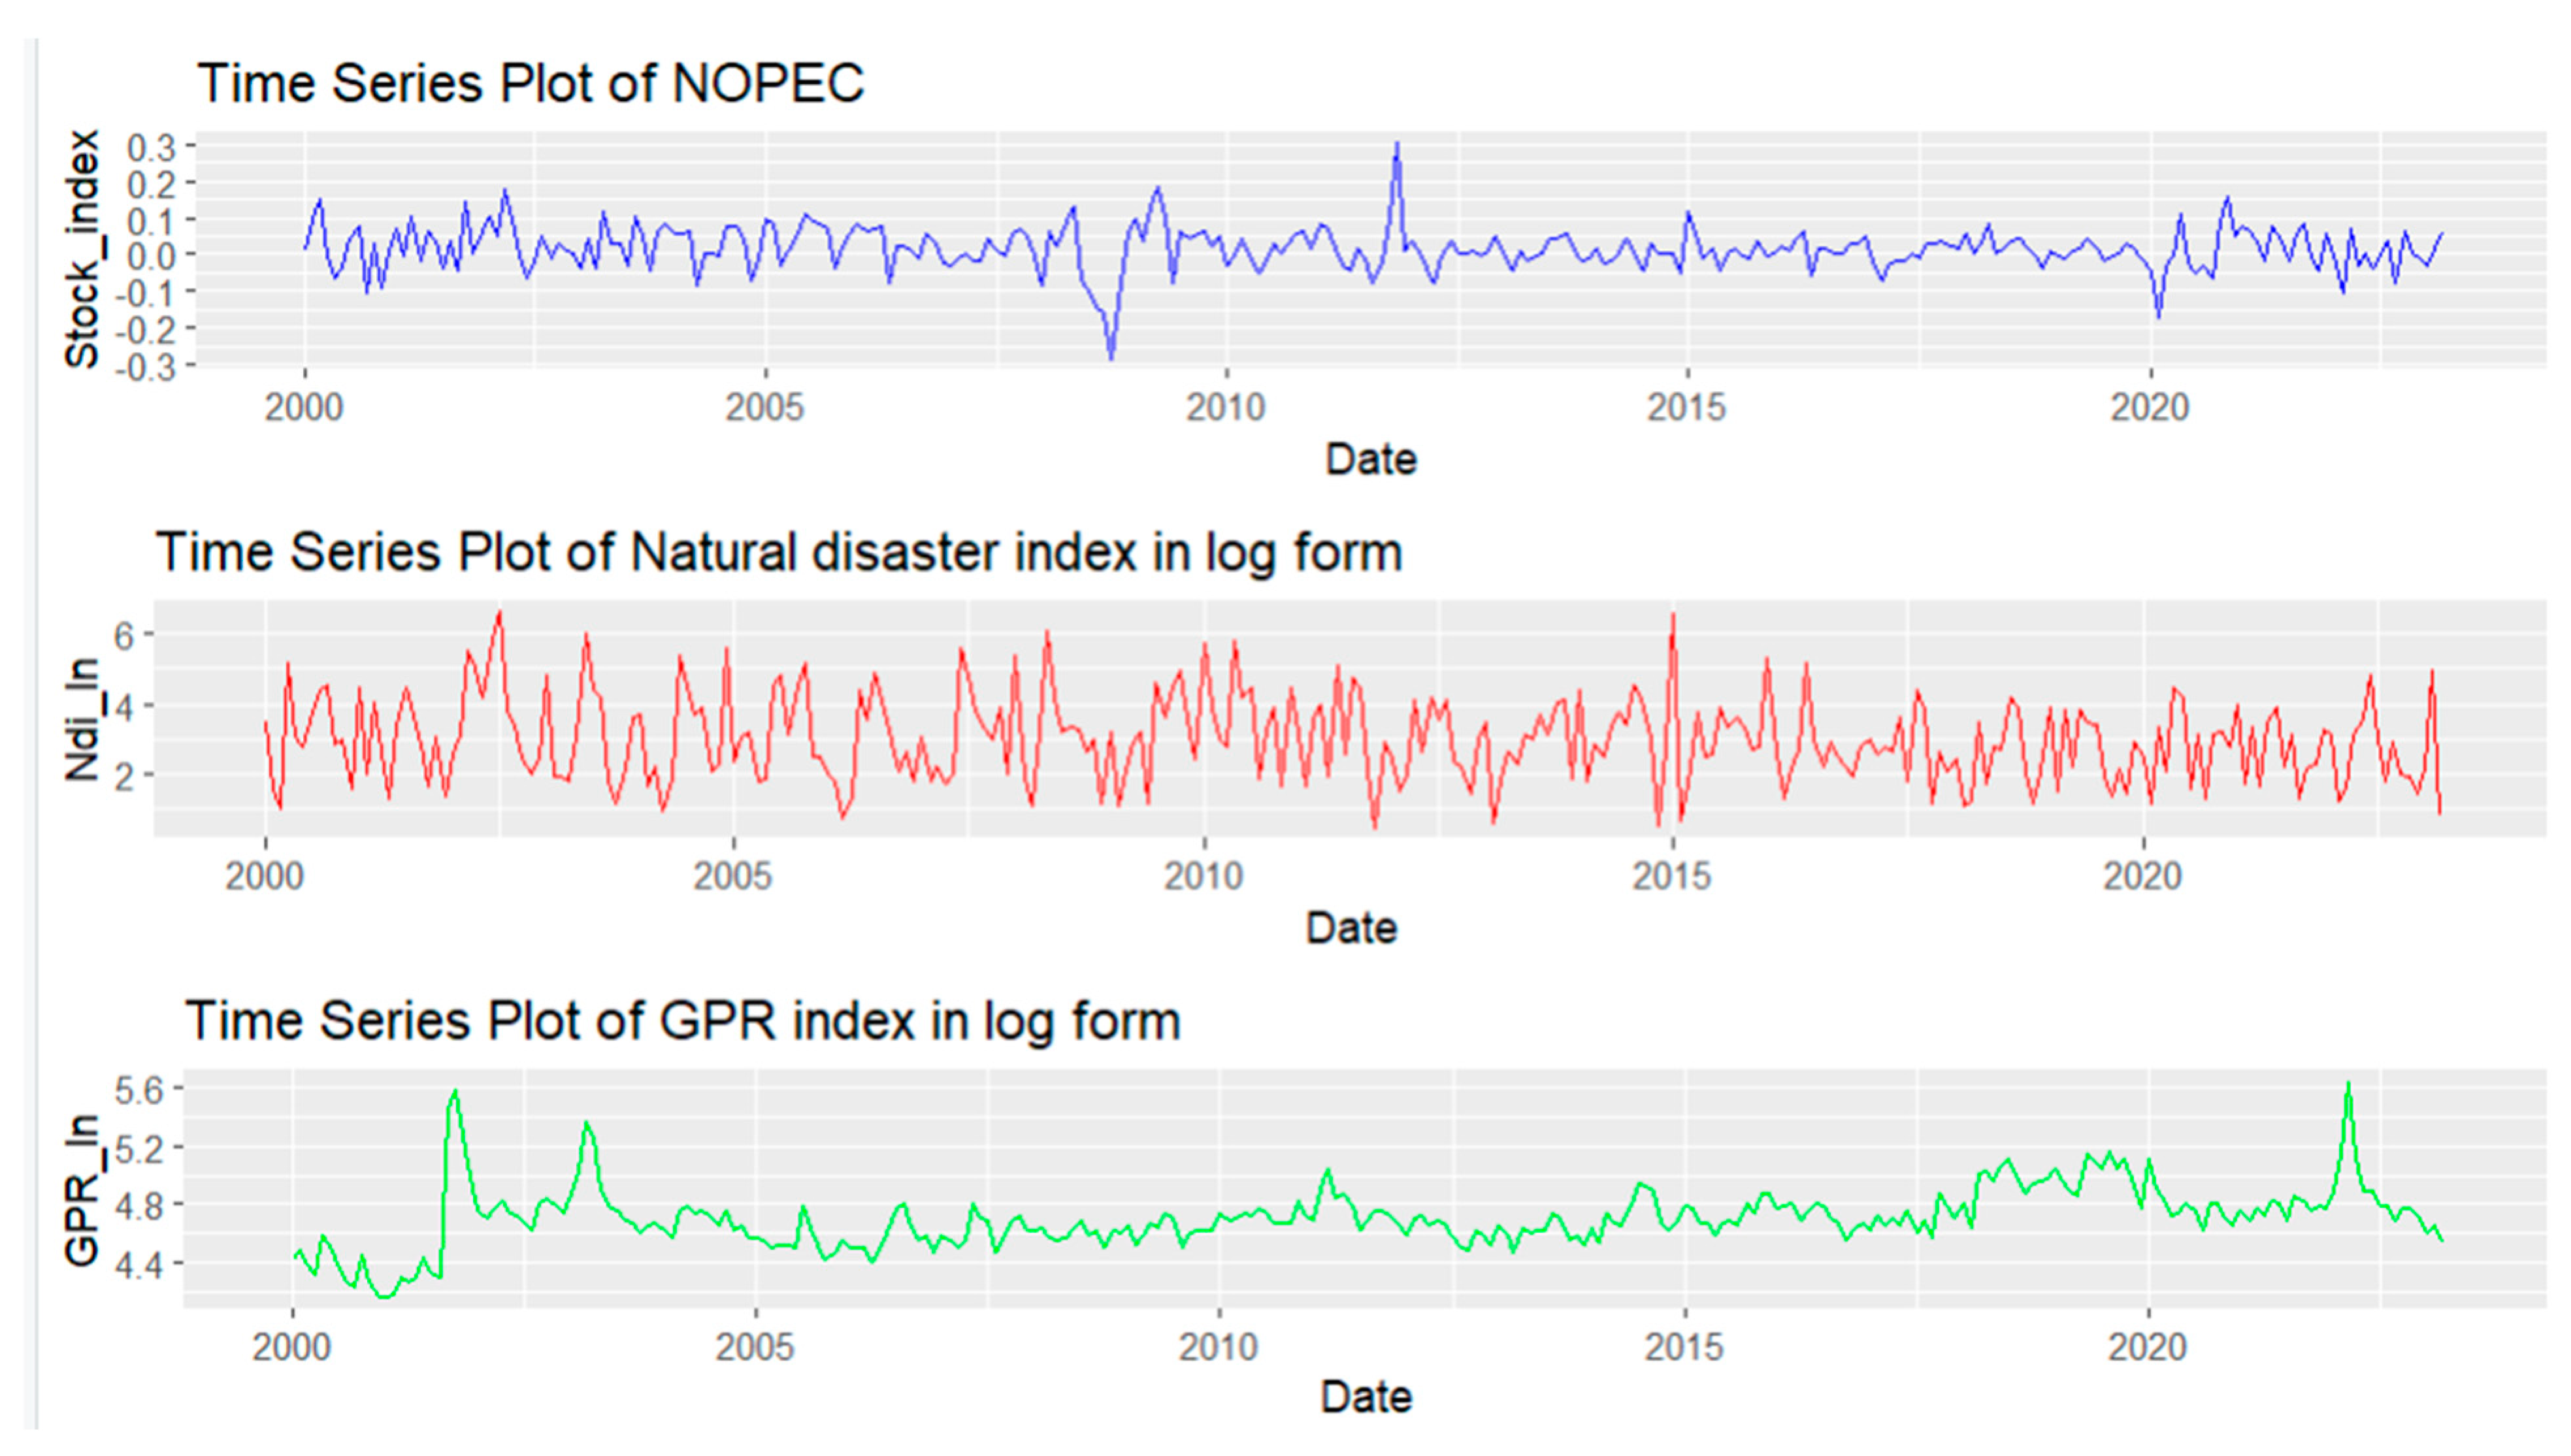
The preliminary analysis involved descriptive statistics and unit root tests for 279 observations. As an initial step, we use data transformation to account for the disparity in scale between returns and the other indexes, considering our focus on measuring spillover effects on returns rather than prices. It is essential to acknowledge the inherent differences in scale between these variables. Returns are expressed as percentage changes between consecutive periods, while indexes are represented in absolute terms. Consequently, the divergent scales can hinder direct comparisons. Moreover, the NDI and GRI had high values. To address this challenge, we utilize the natural logarithm of the indexes.
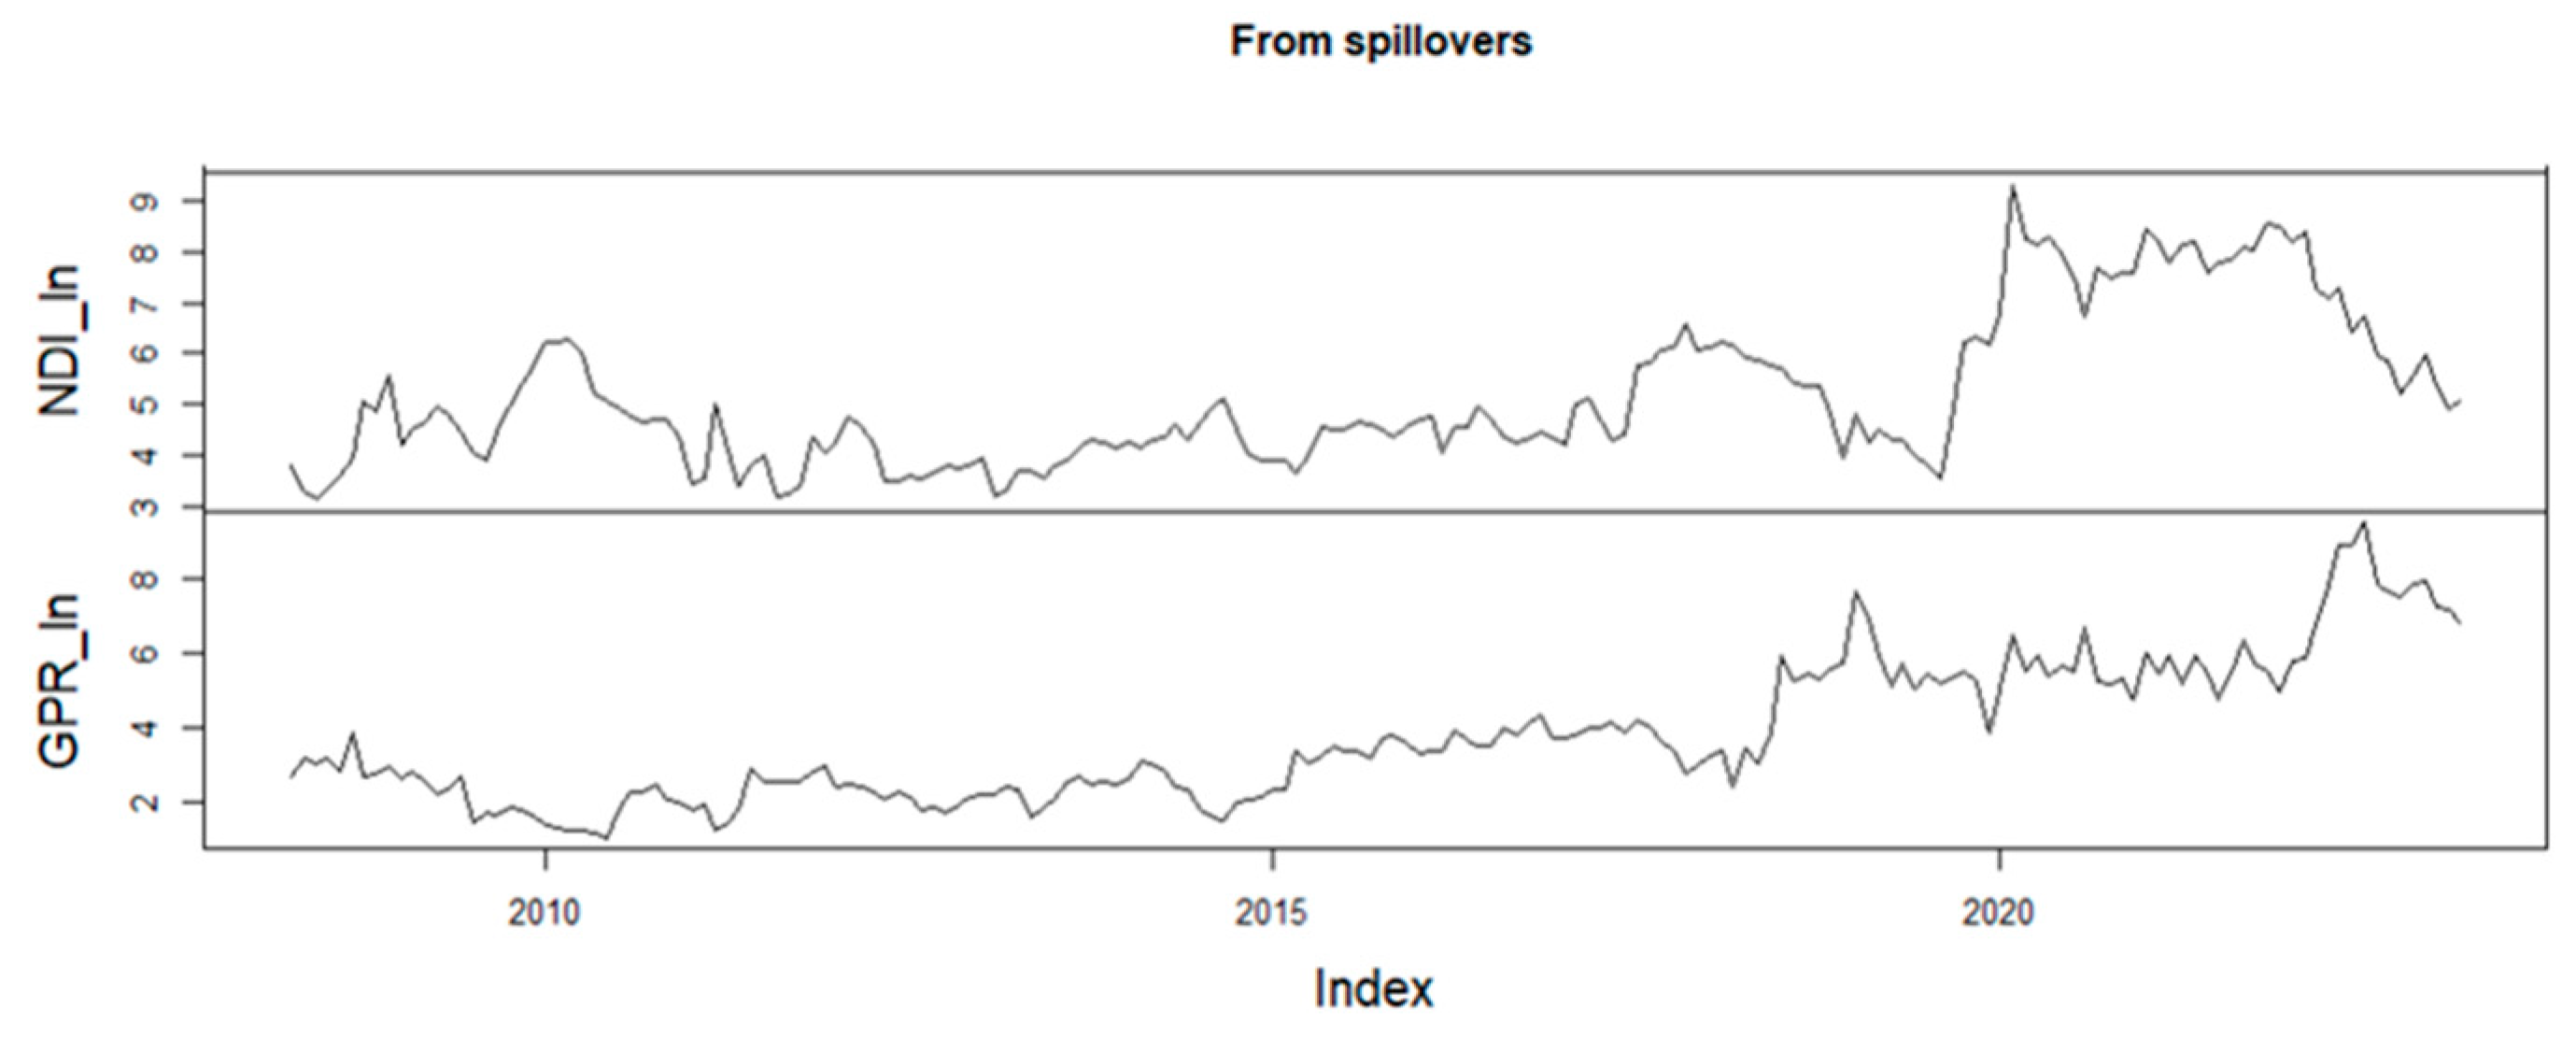
Employing the natural logarithm facilitates a transformation of the absolute index values into a scale that is more conducive to comparisons with returns. Specifically, the natural logarithm of an index provides a metric of the continuous growth rate of the index, rendering it more comparable to returns. This transformation enables a more accurate measurement of the degree of connectedness between different returns and indexes. The accompanying plots (Figure 1 and Figure 2) depict the data before and after the logarithmic transformation, illustrating the impact of this adjustment.
Key events in Figure 2:
Stock_Index: 2008–2009 (Great Recession), 2011 (Libyan war), 2020 (COVID-19).
NDI_ln: 2003 (Iran Bam Earthquake, China floods and Korea Maemi Typhoon), 2004 (Sumatra Earthquake, Indian Ocean Tsunami), 2005 (Hurricanes Katerina and Wilma), 2007(Windstorm and floods in Bangladesh and China, Japan Earthquake), 2008 (Cyclone Nargis in Myanmar and Sichuan Earthquake in China), 2010 (Haiti Earthquake and Russian Summer Heatwave), 2015 (Nepal Earthquake) (EMDAT Database).
GRI_ln: 2001 (9/11 terrorist attacks, Iraq war, London Bombings), 2011 (Military intervention in Libya), 2014/15 (Russia annexes Crimea), 2019/20 (US-North Korea tensions, US-Iran tensions), 2022 (Russia-Ukraine conflict) [39].
We employ a unit root test for all the variables after log transformation, which further confirmed the stationarity of the return index at a 1% significance level for all test types except for KPSS, which shows that the stationarity might be trend stationary and not strict stationary. It was a similar case for natural disasters and geopolitical risk, even though these two were stationary at 5% using only the intercept for DF-GLS.
Table 3 displays the descriptive statistics for the variables included in the study. Notably, the average returns of oil stocks from the selected Asian OPEC+ member countries over the study period were positive. The GRI and NDI variables exhibited positive skewness, indicating a tendency towards higher values. The average values for the Geopolitical Risk Index and the Natural Disaster Index are also provided. Moreover, the kurtosis values for GRI and NOPEC exceed three, indicating a leptokurtic distribution. Similarly, the Jarque–Bera statistics revealed evidence of non-normality in the variables under investigation.

4. Results and Discussion

4.1. Volatility Test of the Asian OPEC+ Stock Returns Index

Based on the findings presented in Table 4, it is evident that the stock return index of Asian OPEC+ members exhibited considerable volatility throughout the study period. Specifically, the sum of the lagged residuals (RESID (−1), i.e., ( α 1 )) and the lagged conditional variances (GARCH (−1), i.e.,   β 1 )) for the index can be approximated to one. Higher values of α 1 and β 1 imply that past volatility strongly affects current volatility and that volatility shocks decay more slowly over time, indicating a slower rate of convergence to the long-run average volatility. The results in Table 5 suggest a persistent pattern of fluctuations in the monthly returns of the index, which is further supported by the visual representation provided in Figure 2, depicting the plot of the residuals (volatility series). The spikes in volatility for the return index were easily noticeable in 2008–2009, 2012–2013, and 2020.
These periods mark the occurrence of major events such as the 2008–2009 global financial crisis, the aftermath of the 2011 Libyan war, and the global COVID-19 pandemic. It is worth noting that the volatility in the return index does not show significant or obvious spikes in 2022 to reflect the 2022–2023 Russian–Ukrainian conflict. This observation corroborates the assertions made by [45,48], who argue that the impacts of geopolitical events can vary across oil-producing and oil-exporting nations. Furthermore, these periods may present potential opportunities for positive spillover effects, as a decline in oil supply could lead to price increases or production shortfalls that might be compensated for by other oil-producing regions. In contrast, the volatility series of geopolitical events index captures this event as being the second most significant after the 9/11 terrorist strike and the Iraq invasion (Figure 3).

4.2. Main Econometric Findings

In our study’s framework, the measure of volatility spillover is derived from the decomposition of forecast error variance obtained through a Vector Autoregression (VAR) model. Before estimating the VAR, it is crucial to determine the appropriate lag order. This was accomplished by employing two criteria:
1. The Akaike Information Criterion (AIC), a statistical criterion used for model selection. The AIC compares various models and selects the one that provides the best balance between goodness of fit and simplicity. The absence of autocorrelation or heteroscedasticity in the residuals of the chosen VAR model indicates the fulfilment of assumptions for accurate estimation. This was checked with the Portmanteau test, for the VAR (6) model. The results of this test are presented in Table 6.
2. To determine the optimal lag order, we tested different lag orders ranging from 1 to 10 and recorded the corresponding AIC values. The results are presented in Table 7, which provides an easy-to-read summary of the AIC for each lag order.
Based on the Akaike Information Criterion (AIC), the optimal lag order for our analysis is determined to be 6. Subsequently, we constructed a Vector Autoregression (VAR) system, which forms the basis for calculating the measure of connectedness.

4.3. Diebold–Yilmaz Connectedness

We use the conventional measure that [29] suggested to quantify connectedness. The spillover table presented below represents the computation of connectedness without frequency bands, following the standard approach of Diebold and Yilmaz. This computation involves considering the non-diagonal elements of the variance decomposition matrix while the diagonal values are not set to zero. Retaining the diagonal terms accounts for the total variance of variables, which is not highly important to us because the focus of our study is on the directional spillover of NDI and GPR variables to NOPEC. However, both variants of tables are presented in Table 6 and Table 7, with the last column and last row defining the directions of spillover effects.
Table 8 presents the estimated contribution of variables j (column variables) to the forecast-error variance of variable i (row variables). The off-diagonal column sums “TO” and row sums “FROM” provide the total directional connectedness from i to all other variables j and from j to all other variables   i . The total connectedness is shown in the lower right corner of the table.
Table 9 also follows the standard approach of D-Y2012 for computing connectedness. It specifically focuses on the non-diagonal elements of the variance decomposition matrix while setting the diagonal values to zero. Notably, this computation does not incorporate frequency bands in the analysis.
Based on the obtained results, the overall spillover is estimated to be approximately 4.5%, indicating a notable level of connectedness. However, the NOPEC variable cannot affect the NDI or GPR variables, which results in their lowest values in the spillover table. Therefore, we focus on the NOPEC column in the table instead.

4.4. Time-Varying Diebold–Yilmaz Connectedness

In the context of our study, our primary focus lies in understanding the dynamics of this connectedness. Given that both natural disasters and geopolitical risks tend to fluctuate at moderate levels but experience peaks during specific events, we hypothesized that the spillover effects would be higher during such periods of heightened activity. To investigate this hypothesis, we employ a time-varying volatility connectedness approach. To obtain the computations required for this approach, we used the moving method approach. This analysis helps to determine how much of the prediction error in the stock index variable can be attributed to shocks from the NDI and GPR variables. The outcomes of this examination are visually represented in the Figure 4 below.
The plot presented in the study reveals the presence of multiple peaks, each corresponding to significant events that affected the connectedness of the variables being analyzed. Among these peaks, the one observed in 2020 stands out, and its occurrence can be attributed to the global COVID-19 pandemic. The pandemic had a profound impact on various aspects of the global economy, including the oil market and the connectedness of the variables under examination.
The findings of this study align with the research conducted by [72], who investigated the effects of the COVID-19 pandemic on the oil market. Ref. [72] assert that the pandemic resulted in a sharp decline in oil demand as lockdown measures were implemented worldwide, and it also disrupted global supply chains. These factors led to significant long-run price falls in the oil market and increased volatility. The heightened volatility in oil markets during the pandemic can be seen as a contributing factor to the peak observed in the plot, indicating a substantial impact on the connectedness of the variables.
Moreover, the COVID-19 pandemic had far-reaching consequences beyond the oil market. It caused widespread disruptions across various sectors, leading to economic contractions, financial market turbulence, and uncertainties. These macroeconomic conditions can further amplify the spillover effects and connectedness among the variables under investigation. Research by [73] highlights the systemic effects of the pandemic on global financial markets, emphasizing the transmission of shocks and the increased connectedness during this period. Understanding the specific dynamics and consequences of such significant events is crucial for comprehending the dynamics of interconnected financial markets and their susceptibility to external shocks.
Table 10 below presents the spillover measures for the specific day of interest, 1 February 2020. It is important to note that the spillover table employed in this analysis follows the standard Diebold and Yilmaz methodology without the incorporation of frequency bands.
In Table 11, the spillover effects of natural disasters and geopolitical events on returns in February 2022 were 20.47%, indicating significant connectedness as initially analyzed. This peak is likely attributed to the ongoing conflict between Russia and Ukraine. This geopolitical event also had a significant impact on the connectedness of the GRI and oil stock returns. It is worth noting that the spillover table utilized in this analysis adheres to the standard Diebold and Yilmaz methodology without the inclusion of frequency bands.
This finding aligns with prior research that has demonstrated the influence of geopolitical risks on financial markets [74,75]. In a similar vein, [76] revealed that the conflict under scrutiny has had a substantial impact on global financial markets, manifesting as heightened volatility and increased risk aversion across various asset classes. The authors further identify several key factors that have contributed to the conflict’s impact on financial markets, including Russia’s role as a prominent oil exporter and the potential for broader geopolitical instability in the region.
However, while previous studies have primarily focused on examining the relationship between stock returns of oil companies and geopolitical tensions, there is limited research specifically investigating the implications of the Russia–Ukraine conflict from this perspective. Overall, our study’s results align with previous findings, highlighting the significant connectedness between stock returns in the oil market and geopolitical shocks. An additional peak observed in 2023 can be attributed to a series of earthquakes that occurred in Turkey during early February of that year. These seismic events had a significant impact on the connectedness of the variables examined in the study. The result is presented in Table 12 below. This finding is consistent with previous studies that have demonstrated the influence of natural disasters on the financial market [43,58,63].
Figure 5 from our analysis depicts spillovers received from NDI and GRI variables, proving that the spillover increase in 2020 was caused specifically by the COVID-19 pandemic via increasing the NDI and in 2022 by Russian special military operations via the GPR index.
Various moderate peaks can be observed on the overall spillover plot, each representing distinct events of interest. These peaks, although less pronounced than the major ones, signify other noteworthy occurrences that have influenced the connectedness dynamics examined in the study.

5. Conclusions

The present study aimed to investigate the spillover effects of natural disasters and geopolitical risks on the stock returns of public oil companies operating in Asian OPEC+ member countries. By utilizing a time-varying Diebold–Yilmaz connectedness model, we were able to analyze the dynamic connectedness between these variables. An overall spillover measure of about 4.5% demonstrates the findings of our study, which show that both natural disasters and geopolitical risk factors exhibit a moderate level of connectedness with stock returns. However, it is worth noting that during significant geopolitical shocks and destructive natural disasters, the connectedness between these variables escalates to a substantial level, reaching up to 20%. These results underscore the importance of considering political risks and monitoring natural-disaster-prone regions when making investment decisions. They emphasize the need for investors and portfolio managers to assess the potential impact of geopolitical events and natural disasters on the financial markets.
By shedding light on the impact of natural disasters and geopolitical risks on financial markets, our study contributes to the existing literature in this field. The insights derived from our research provide valuable information for investors, policymakers, and market participants. These findings can aid in the development of strategies that account for the potential risks associated with natural disasters and geopolitical events, ultimately assisting informed decision making and risk management.

Author Contributions

Conceptualization, D.B.V., S.D.-A. and V.K.; Methodology, D.B.V., S.D.-A., V.K. and M.Ö.; Software, V.K.; Validation, V.K. and M.Ö.; Formal analysis, D.B.V. and S.D.-A.; Investigation, D.B.V.; Data curation, S.D.-A. and V.K.; Writing—original draft, S.D.-A. and V.K.; Writing—review & editing, D.B.V.; Supervision, D.B.V.; Project administration, D.B.V.; Funding acquisition, D.B.V. All authors have read and agreed to the published version of the manuscript.

Funding

This paper has been supported by the RUDN University Strategic Academic Leadership Program.

Data Availability Statement

The datasets used and analyzed during the current study are available from the corresponding author on reasonable request.

Acknowledgments

The work of author Darko B. Vuković for his contribution in the paper (investigation, writing—review and editing, supervision, and project administration) has been supported by the RUDN University Strategic Academic Leadership Program for his personal project in Priority-2030 RUDN program.

Conflicts of Interest

The authors declare no conflict of interest.

Appendix A

Table A1. List of countries and their tickers included in NOPEC Index.
CountriesStickerPublicly-Listed Oil Companies
Kazakhstan (1)KZTO KZ EquityKAZTRANSOIL JSC
Malaysia (29)AMRB MK EquityALAM MARITIM RESOURCES BHD
BARAKAH MK EquityBARAKAH OFFSHORE PETROLEUM
BOUS MK EquityBOUSTEAD HOLDINGS BHD
BAB MK EquityBUMI ARMADA BERHAD
CARIP MK EquityCARIMIN PETROLEUM BHD
COCO MK EquityCOASTAL CONTRACTS BHD
DEHB MK EquityDAYANG ENTERPRISE HLDGS BHD
DLUM MK EquityDELEUM BERHAD
DLG MK EquityDIALOG GROUP BHD
GMB MK EquityGAS MALAYSIA BHD
HDL MK EquityHANDAL ENERGY BHD
HYR MK EquityHENGYUAN REFINING CO BHD
HHH MK EquityHIAP HUAT HOLDINGS BHD
HIBI MK EquityHIBISCUS PETROLEUM BHD
ICON MK EquityICON OFFSHORE BHD
MMHE MK EquityMALAYSIA MARINE AND HEAVY EN
MARG MK EquityMARINE & GENERAL BHD
PETR MK EquityPERDANA PETROLEUM BHD
PENB MK EquityPETRA ENERGY BHD
PETRONM MK EquityPETRON MALAYSIA REFINING & M
PETD MK EquityPETRONAS DAGANGAN BHD
PTG MK EquityPETRONAS GAS BHD
REB MK EquityREACH ENERGY BHD
SAPE MK EquitySAPURA ENERGY BHD
STRA MK EquitySTRAITS ENERGY RESOURCES BHD
T7G MK EquityT7 GLOBAL BHD
UZMA MK EquityUZMA BHD
VEB MK EquityVELESTO ENERGY BHD
WSC MK EquityWAH SEONG CORP BHD
Oman (8)OOMS OM EquityOMAN OIL MARKETING COMPANY
MHAS OM EquityAL MAHA PETROLEUM PRODUCTS M
SOMS OM EquitySHELL OMAN MARKETING
HECI OM EquityAL-HASSAN ENGINEERING CO
MGMC OM EquityMUSCAT GASES COMPANY SAOG
NGCI OM EquityNATIONAL GAS CO
RNSS OM EquityRENAISSANCE SERVICES SAOG
OXY OM EquityOCCIDENTAL PETROLEUM CORP
Russia (16)BANE RM EquityBASHNEFT PJSC
SIBN RM EquityGAZPROM NEFT PJSC
GAZP RM EquityGAZPROM PJSC
LKOH RM EquityLUKOIL PJSC
NVTK RM EquityNOVATEK PJSC
CHGZ RM EquityRN-WESTERN SIBERIA PJSC
ROSN RM EquityROSNEFT OIL CO PJSC
RNFT RM EquityRUSSNEFT PJSC
KRKN RM EquitySARATOVSKIY NEFTEPERERABATYV
MFGS RM EquitySLAVNEFT-MEGIONNEFTEGAZ OJSC
JNOS RM EquitySLAVNEFT-YAROSLAVNEFTEORGSIN
SNGS RM EquitySURGUTNEFTEGAS PJSC
TATN RM EquityTATNEFT PJSC
TRNFP RM EquityTRANSNEFT PJSC
VJGZ RM EquityVARYEGANNEFTEGAZ PJSC
YAKG RM EquityYAKUTSK FUEL-ENERGY CO PJSC
Total 54 companies

Appendix B

Excel document of NOPEC Index: https://disk.yandex.com/i/kjyLSTX9PD3bJQ.

References

  1. IEA. World Energy Outlook 2022, IEA, Paris. 2022. Available online: https://www.iea.org/reports/world-energy-outlook-2022 (accessed on 15 June 2023).
  2. Ouyang, Z.-Y.; Qin, Z.; Cao, H.; Xie, T.-Y.; Dai, X.-Y.; Wang, Q.-W. A spillover network analysis of the global crude oil market: Evidence from the post-financial crisis era. Pet. Sci. 2021, 18, 1256–1269. [Google Scholar] [CrossRef]
  3. Babar, M.; Ahmad, H.; Yousaf, I. Returns and volatility spillover between agricultural commodities and emerging stock markets: New evidence from COVID-19 and Russian-Ukrainian war. Int. J. Emerg. Mark. 2023. [Google Scholar] [CrossRef]
  4. Nguyen, T.T.; Nguyen, V.C.; Tran, T.N. Oil price shocks against stock return of oil- and gas-related firms in the economic depression: A new evidence from a copula approach. Cogent Econ. Financ. 2020, 8, 1799908. [Google Scholar] [CrossRef]
  5. Vukovic, D.B.; Lapshina, K.A.; Maiti, M. Wavelet Coherence Analysis of Returns, Volatility and Interdependence of the US and the EU Money markets: Pre & Post Crisis. N. Am. J. Econ. Financ. 2021, 58, 101457. [Google Scholar]
  6. Vukovic, D.; Lapshina, K.A.; Maiti, M. uropean Monetary Union Bond Market Dynamics: Pre & Post Crisis. Res. Int. Bus. Financ. 2019, 50, 369–380. [Google Scholar]
  7. Zhang, Y.-J.; Wu, Y.-B. The time-varying spillover effect between WTI crude oil futures returns and hedge funds. Int. Rev. Econ. Financ. 2019, 61, 156–169. [Google Scholar] [CrossRef]
  8. Fasanya, I.O.; Oyewole, O.; Adekoya, O.B.; Odei-Mensah, J. Dynamic spillovers and connectedness between COVID-19 pandemic and global foreign exchange markets. Econ. Res.-Ekon. Istraživanja 2021, 34, 2059–2084. [Google Scholar] [CrossRef]
  9. Jin, Y.; Zhao, H.; Bu, L.; Zhang, D. Geopolitical risk, climate risk and energy markets: A dynamic spillover analysis. Int. Rev. Financ. Anal. 2023, 87, 102597. [Google Scholar] [CrossRef]
  10. Khachirova, R.; Shakhverdov, R. Russia, Saudi Arabia and OPEC: International Oil Games. J. Gov. Politics 2020, 1, 18. [Google Scholar]
  11. Hameed, Z.; Shafi, K.; Nadeem, A. Volatility spillover effect between oil prices and foreign exchange markets. Energy Strategy Rev. 2021, 38, 100712. [Google Scholar] [CrossRef]
  12. Bhuyan, R.; Robbani, M.; Talukder, B. Oil Volatility Spillover into Oil Dependent Equity-Sector Stock Returns: Evidence from Major Oil Producing Countries. Bull. Appl. Econ. 2021, 8, 149. [Google Scholar] [CrossRef]
  13. Kirkulak-Uludag, B.; Safarzadeh, O. The interactions between OPEC oil price and sectoral stock returns: Evidence from China. Phys. A Stat. Mech. Appl. 2018, 508, 631–641. [Google Scholar] [CrossRef]
  14. Chen, X.; Sun, X.; Wang, J. Dynamic spillover effect between oil prices and economic policy uncertainty in BRIC countries: A wavelet-based approach. Emerg. Mark. Financ. Trade 2019, 55, 2703–2717. [Google Scholar] [CrossRef]
  15. Degasperi, R. Identification of Expectational Shocks in the Oil Market Using OPEC Announcements; University of Warwick: Coventry, UK, 2021. [Google Scholar]
  16. Yang, Y.; Zhao, L.; Zhu, Y.; Chen, L.; Wang, G.; Wang, C. Spillovers from the Russia-Ukraine conflict. Res. Int. Bus. Financ. 2023, 66, 102006. [Google Scholar] [CrossRef]
  17. Diebold, F.X.; Yilmaz, K. Measuring financial asset return and volatility spillovers, with application to global equity markets. Econ. J. 2009, 119, 158–171. [Google Scholar] [CrossRef]
  18. Känzig, D.R. The macroeconomic effects of oil supply news: Evidence from OPEC announcements. Am. Econ. Rev. 2021, 111, 1092–1125. [Google Scholar] [CrossRef]
  19. Sakib, N.; Hossain, N.U.I.; Nur, F.; Talluri, S.; Jaradat, R.; Lawrence, J.M. An assessment of probabilistic disaster in the oil and gas supply chain leveraging Bayesian belief network. Int. J. Prod. Econ. 2021, 235, 108107. [Google Scholar] [CrossRef]
  20. Smales, L. Geopolitical risk and volatility spillovers in oil and stock markets. Q. Rev. Econ. Financ. 2021, 80, 358–366. [Google Scholar] [CrossRef]
  21. Caldara, D.; Cavallo, M.; Iacoviello, M. Oil price elasticities and oil price fluctuations. J. Monet. Econ. 2019, 103, 1–20. [Google Scholar] [CrossRef]
  22. Vukovic, D.; Maiti, M.; Frömmel, M. Inflation and portfolio selection. Financ. Res. Lett. 2022, 50, 103202. [Google Scholar] [CrossRef]
  23. Basdekis, C.; Christopoulos, A.; Katsampoxakis, I.; Nastas, V. The impact of the Ukrainian war on stock and energy markets: A wavelet coherence analysis. Energies 2022, 2, 8174. [Google Scholar] [CrossRef]
  24. Forbes, K.J.; Rigobon, R. No contagion, only interdependence: Measuring stock market comovements. J. Financ. 2002, 57, 2223–2261. [Google Scholar] [CrossRef]
  25. Ehrmann, M.; Fratzscher, M.; Mehl, A.; Bekaert, G. Global crises and equity market contagion. Eur. Cent. Bank 2011, 1381. [Google Scholar]
  26. Caramp, N. Sowing the Seeds of Financial Crises: Endogenous Asset Creation and Adverse Selection. (April 4, 2017). Available online: https://ssrn.com/abstract=3009977 (accessed on 25 June 2023).
  27. Si, D.K.; Li, X.L.; Xu, X.; Fang, Y. The risk spillover effect of the COVID-19 pandemic on energy sector: Evidence from China. Energy Econ. 2021, 102, 105498. [Google Scholar] [CrossRef] [PubMed]
  28. Ampofo, A.; Cheng, T.C.; Tchatoka, F.D. Oil extraction and spillover effects into local labour market: Evidence from Ghana. Energy Econ. 2022, 106, 105699. [Google Scholar] [CrossRef]
  29. Diebold, F.X.; Yilmaz, K. Better to give than to receive: Predictive directional measurement of volatility spillovers. Int. J. Forecast. 2012, 28, 57–66. [Google Scholar] [CrossRef]
  30. Li, Z.; Mo, B.; Nie, H. Time and frequency dynamic connectedness between cryptocurrencies and financial assets in China. Int. Rev. Econ. Financ. 2023, 86, 46–57. [Google Scholar] [CrossRef]
  31. Sevinç, D. Volatility spillovers among MIST stock markets. Data Sci. Financ. Econ. 2022, 2, 80–95. [Google Scholar] [CrossRef]
  32. Suzan, L.; Sudrajat, J.; Daud, Z.M. Accounting information systems as a critical success factor for increased quality of accounting information. Rev. Espac. 2020, 41, 2. [Google Scholar]
  33. Sorrell, S.; Gatersleben, B.; Druckman, A. The limits of energy sufficiency: A review of the evidence for rebound effects and negative spillovers from behavioural change. Energy Res. Soc. Sci. 2020, 64, 101439. [Google Scholar] [CrossRef]
  34. Borio, C.; Zhu, H. Capital regulation, risk-taking and monetary policy: A missing link in the transmission mechanism? J. Financ. Stab. 2012, 8, 236–251. [Google Scholar] [CrossRef]
  35. Ayadi, M.A.; Ben Omrane, W.; Lazrak, S.; Yan, X. OPEC production decisions, macroeconomic news, and volatility in the Canadian currency and oil markets. Financ. Res. Lett. 2019, 37, 101366. [Google Scholar] [CrossRef]
  36. Belgacem, A.; Creti, A.; Guesmi, K.; Lahiani, A. Volatility spillovers and macroeconomic announcements: Evidence from crude oil markets. Appl. Econ. 2015, 47, 2974–2984. [Google Scholar] [CrossRef]
  37. Antonakakis, N.; Gupta, R.; Kollias, C.; Papadamou, S. Geopolitical risks and the oil-stock nexus over 1899–2016. Financ. Res. Lett. 2017, 23, 165–173. [Google Scholar] [CrossRef]
  38. Su, R.C.; Du, J.G.; Shahzad, F.; Long, X.L. Unveiling the effect of mean and volatility spillover between the United States economic policy uncertainty and WTI crude oil price. Sustainability 2020, 12, 6662. [Google Scholar] [CrossRef]
  39. Caldara, D.; Iacoviello, M. Measuring geopolitical risk. Am. Econ. Rev. 2022, 112, 1194–1225. [Google Scholar] [CrossRef]
  40. Demirer, R.; Gupta, R.; Pierdzioch, C.; Shahzad, S.J.H. The predictive power of oil price shocks on realized volatility of oil: A note. Resour. Policy 2020, 69, 101856. [Google Scholar] [CrossRef]
  41. Shaikh, I. Behaviors of Stocks and Fear Index from Terrorist Attacks: Empirical Evidence from SENSEX and NVIX. Int. J. Bus. Econ. 2019, 18, 195–219. [Google Scholar]
  42. Arin, K.P.; Ciferri, D.; Spagnolo, N. The price of terror: The effects of terrorism on stock market returns and volatility. Econ. Lett. 2008, 101, 164–167. [Google Scholar] [CrossRef]
  43. Kilian, L.; Murphy, D.P. The role of inventories and speculative trading in the global market for crude oil. J. Appl. Econ. 2014, 29, 454–478. [Google Scholar] [CrossRef]
  44. El-Chaarani, H. The Impact of Oil Prices on the Financial Performance of Banking Sector in Middle East Region. Int. J. Energy Econ. Policy 2019, 9, 214–223. [Google Scholar] [CrossRef]
  45. Lee, C.C.; Zhou, H.; Xu, C.; Zhang, X. Dynamic spillover effects among international crude oil markets from the time-frequency perspective. Resources Policy. 2023, 80, 103218. [Google Scholar] [CrossRef]
  46. Elsayed, A.H.; Helmi, M.H. Volatility transmission and spillover dynamics across financial markets: The role of geopolitical risk. Ann. Oper. Res. 2021, 305, 1–22. [Google Scholar] [CrossRef]
  47. Huang, M.; Shao, W.; Wang, J. Correlations between the crude oil market and capital markets under the Russia–Ukraine conflict: A perspective of crude oil importing and exporting countries. Resour. Policy 2023, 80, 103233. [Google Scholar] [CrossRef]
  48. Prisecaru, P.; Calanter, P. Intensification of the Prices Volatility for Oil and Natural Gas. Glob. Econ. Obs. 2022, 10, 46–52. [Google Scholar]
  49. Mokni, K. A dynamic quantile regression model for the relationship between oil price and stock markets in oil-importing and oil-exporting countries. Energy 2020, 213, 118639. [Google Scholar] [CrossRef]
  50. Li, J.; Liu, R.; Yao, Y.; Xie, Q. Time-frequency volatility spillovers across the international crude oil market and Chinese major energy futures markets: Evidence from COVID-19. Resour. Policy 2022, 77, 102646. [Google Scholar] [CrossRef]
  51. Wei, Y. Oil price shocks, economic policy uncertainty and China’s trade: A quantitative structural analysis. N. Am. J. Econ. Financ. 2019, 48, 20–31. [Google Scholar] [CrossRef]
  52. Aloui, R.; Gupta, R.; Miller, S.M. Uncertainty and crude oil returns. Energy Econ. 2016, 55, 92–100. [Google Scholar] [CrossRef]
  53. Antonakakis, N.; Chatziantoniou, I.; Filis, G. Dynamic spillovers of oil price shocks and economic policy uncertainty. Energy Econ. 2014, 44, 433–447. [Google Scholar] [CrossRef]
  54. Ewing, B.T.; Malik, F. Volatility spillovers between oil prices and the stock market under structural breaks. Glob. Financ. J. 2016, 29, 12–23. [Google Scholar] [CrossRef]
  55. Aloui, R.; Aïssa, M.S.B. Relationship between oil, stock prices and exchange rates: A vine copula based GARCH method. N. Am. J. Econ. Financ. 2016, 37, 458–471. [Google Scholar] [CrossRef]
  56. Li, B.; Chang, C.P.; Chu, Y.; Sui, B. Oil prices and geopolitical risks: What implications are offered via multi-domain investigations? Energy Environ. 2020, 31, 492–516. [Google Scholar] [CrossRef]
  57. Li, W.; Zhu, Q.; Wen, F.; Nor, N.M. The evolution of day-of-the-week and the implications in crude oil market. Energy Econ. 2022, 106, 105817. [Google Scholar] [CrossRef]
  58. Yu, Y.; Guo, S.; Chang, X. Oil prices volatility and economic performance during COVID-19 and financial crises of 2007–2008. Resour. Policy 2022, 75, 102531. [Google Scholar] [CrossRef]
  59. Kilian, L. Explaining fluctuations in gasoline prices: A joint model of the global crude oil market and the US retail gasoline market. Energy J. 2010, 31. [Google Scholar] [CrossRef]
  60. Jo, S.; Karnizova, L.; Reza, A. Industry effects of oil price shocks: A re-examination. Energy Econ. 2019, 82, 179–190. [Google Scholar] [CrossRef]
  61. Demirer, R.; Gupta, R.; Suleman, T.; Wohar, M.E. Time-varying rare disaster risks, oil returns and volatility. Energy Econ. 2018, 75, 239–248. [Google Scholar] [CrossRef]
  62. Odugbesan, J.A.; Aghazadeh, S. Environmental Pollution and Disaggregated Economic Policy Uncertainty: Evidence from Japan. Pollution 2021, 7, 749–767. [Google Scholar]
  63. Wang, M.; Jia, D.; Shaw, J.H.; Hubbard, J.; Plesch, A.; Li, Y.; Liu, B. The 2013 Lushan earthquake: Implications for seismic hazards posed by the Range Front blind thrust in the Sichuan Basin, China. Geology 2014, 42, 915–918. [Google Scholar] [CrossRef]
  64. Ji, C.-J.; Hu, Y.-J.; Tang, B.-J. Research on carbon market price mechanism and influencing factors: A literature review. Nat. Hazards 2018, 92, 761–782. [Google Scholar] [CrossRef]
  65. Burke, P.J.; Shahiduzzaman, M.; Stern, D.I. Carbon dioxide emissions in the short run: The rate and sources of economic growth matter. Glob. Environ. Chang. 2015, 33, 109–121. [Google Scholar] [CrossRef]
  66. Stern, J.P. Is there a rationale for the continuing link to oil product prices in continental European long-term gas contracts? Int. J. Energy Sect. Manag. 2007, 1, 221–239. [Google Scholar] [CrossRef]
  67. Organization of the Petroleum Exporting Countries. OPEC Annual Statistical Bulletin 2023. Available online: https://asb.opec.org/ASB_PDFDownload.php (accessed on 25 June 2023).
  68. Noy, I. A global comprehensive measure of the impact of natural hazards and disasters. Glob. Policy 2016, 7, 56–65. [Google Scholar] [CrossRef]
  69. Otranto, E. Capturing the spillover effect with multiplicative error models. Commun. Stat. -Theory Methods 2015, 44, 3173–3191. [Google Scholar] [CrossRef]
  70. Liu, Y.; Han, L.; Xu, Y. The impact of geopolitical uncertainty on energy volatility. Int. Rev. Financ. Anal. 2021, 75, 101743. [Google Scholar] [CrossRef]
  71. Lee, K.-J.; Lu, S.-L.; Shih, Y. Contagion effect of natural disaster and financial crisis events on international stock markets. J. Risk Financ. Manag. 2018, 11, 16. [Google Scholar] [CrossRef]
  72. Baker, S.R.; Bloom, N.; Davis, S.J.; Terry, S.J. COVID-Induced Economic Uncertainty (No. w26983). Natl. Bur. Econ. Res. 2020. [Google Scholar] [CrossRef]
  73. Ahmed, R.; Chaudhry, S.M.; Kumpamool, C.; Benjasak, C. Tail risk, systemic risk and spillover risk of crude oil and precious metals. Energy Econ. 2022, 112, 106063. [Google Scholar] [CrossRef]
  74. Jung, S. The Impact of Geopolitical Risk on Stock Returns: Evidence from Inter-Korea Geopolitics. J. Asian Financ. Econ. Bus. 2019, 6, 45–53. [Google Scholar]
  75. Bouri, E.; Demirer, R.; Gupta, R.; Marfatia, H.A. Geopolitical risks and movements in Islamic bond and equity markets: A note. Def. Peace Econ. 2019, 30, 367–379. [Google Scholar] [CrossRef]
  76. Izzeldin, M.; Muradoğlu, Y.G.; Pappas, V.; Petropoulou, A.; Sivaprasad, S. The impact of the Russian-Ukrainian war on global financial markets. Int. Rev. Financ. Anal. 2023, 87, 102598. [Google Scholar] [CrossRef]
Figure 1. Plot of variables before transformation.
Mathematics 11 04005 g001
Figure 2. Plots of variables after transformation.
Mathematics 11 04005 g002
Figure 3. Volatility series for GRI and NOPEC.
Mathematics 11 04005 g003
Figure 4. Overall spillover and directional spillovers.
Mathematics 11 04005 g004
Figure 5. Spillovers of the GRI and the NDI.
Mathematics 11 04005 g005
Table 1. OPEC+ countries, membership status, and production ranking.
CountriesMembership StatusOil Production RankingRaking Reserves (‘million barrels)
AlgeriaOPEC11th 12,200
AngolaOPEC10th 2550
AzerbaijanOPEC Plus15th 7000
BahrainOPEC Plus20th -
BruneiOPEC Plus21st 1100
CongoOPEC17th 1811
Equatorial GuineaOPEC22nd 1100
GabonOPEC19th 2000
IranOPEC6th 208,600
IraqOPEC3rd 145,019
KazakhstanOPEC Plus8th 30,000
KuwaitOPEC5th 101,500
LibyaOPEC12th 48,363
MalaysiaOPEC Plus16th 3600
MexicoOPEC Plus7th 5558
NigeriaOPEC9th 36,967
OmanOPEC Plus13th 5373
RussiaOPEC Plus2nd 80,000
Saudi ArabiaOPEC1st 267,192
SudanOPEC Plus18th 5000
South SudanOPEC Plus-
United Arab EmiratesOPEC4th 113,000
VenezuelaOPEC14th 303,221
Source: [67].
Table 2. Related work and literature contributions.
AuthorsModelStudyResults
[3]Diebold and Yilmaz (2012, 2014)This study examines the spillover effects of return and volatility between agricultural commodities and emerging stock markets during periods of crisis, specifically focusing on the COVID-19 pandemic and the Russian–Ukrainian crisis.The occurrence of spillovers was significantly amplified during the COVID-19 pandemic, while a more modest increase was observed during the Russian–Ukrainian conflict.
[29]Diebold and Yilmaz spillover (2014)Oil and commodities market and global factors (financial crisis and economic policy Uncertainty).Transmission of oil and other commodities in both directions. The global financial crisis and economic policy uncertainty have a causal effect on market connectedness and return volatility.
[8]Diebold and Yilmaz (2009, 2012) and rolling window analysesGlobal COVID-19 events and global foreign exchange markets.A substantial degree of connection between COVID-19 pandemic and currency return volatility.
[9]Diebold and Yilmaz (2014)Dynamic spillover among geopolitical risk, climate risk, and energy market. Frequency-dependent connectedness among energy future prices, geopolitical risks, and climate risks.
[70] GARCH-MIDASImpact of geopolitical risk on the energy market.Geopolitical risk has significant long-run effects on the volatilities of the energy market.
[71]heteroscedasticity bias correlation coefficient and GARCH modelNatural disasters and financial crisis events on a contagious effect on broad stock markets.The Sichuan earthquake in China in 2008 and the consequences resulting from secondary mortgages in the U.S. had the biggest impact on financial markets in the Asia-Pacific area.
Table 3. Summary statistics of variables.
GRI_lnNDI_lnNOPEC
Mean4.70882.98460.0163
Median4.68792.94180.0123
Maximum5.63756.62450.3031
Minimum4.16340.4498−0.2811
Std. Dev.0.20701.24240.0588
Skewness0.82340.3977−0.0939
Kurtosis6.03242.73967.0820
Jarque–Bera138.42368.1412194.1146
Table 4. Stationarity test.
NOPECGRI_lnNDI_ln
ADF−6.5670(1) ***−5.8193(1) ***−3.3047(1) ***
DF-GLS−12.2719(0) ***−2.1278(2) **−2.1996(8) **
Philip and Peron−12.1034[6] ***−5.9757[1] ***−14.2059[1] ***
KPSS0.2809[4]0.7518[12] ***0.7177[0] **
Notes: The figures within parentheses represent the lag length recommended by the Akaike Information Criterion (AIC). The figures within brackets indicate the bandwidth selection method proposed by Newey and West (1994). Source: Calculations performed by the authors. Significance at the 10%, 5% and 1% levels are denoted by, **, ***, respectively.
Table 5. GARCH (1, 1) model for NOPEC.
α 1 β 1 CProb
NOPEC0.5474670.4181390.0004380.0001
Table 6. Portmanteau test.
LagsChi-Squareddfp-Value
636.721360.4353
Table 7. Optimal lag criteria.
Lag Order12345678910
AIC(n)−8.649−8.821−8.841−8.874−8.861−8.930−8.900−8.874−8.901−8.921
Table 8. Measure of connectedness with the standard Diebold and Yilmaz approach 1 (not set to 0).
NOPECNDI(ln)GPR(ln)FROM
NOPEC97.580.791.630.81
NDI (ln)3.8094.062.141.98
GRI(ln)0.674.4194.911.70
TO1.491.731.264.48
Table 9. Measure of connectedness with the standard Diebold and Yilmaz approach 2.
NOPECNDI(ln)GPR(ln)FROM
NOPEC98.020.691.290.66
NDI (ln)3.6094.372.031.88
GRI(ln)0.823.8895.301.57
TO1.471.521.114.10
Table 10. Spillover table for the month of March 2020.
NOPECNDI(ln)GPR(ln)FROM
NOPEC90.612.566.833.13
NDI (ln)20.4772.077.469.31
GRI(ln)10.029.6080.386.54
TO10.164.064.7618.98
Table 11. Spillover table for the month of February 2022.
NOPECNDI(ln)GPR(ln)FROM
NOPEC79.9011.418.696.70
NDI (ln)16.3578.155.507.28
GRI(ln)6.7813.5279.706.77
TO7.718.314.7320.75
Table 12. Spillover table for the month of February 2023.
NOPECNDI(ln)GPR(ln)FROM
NOPEC82.096.7011.215.97
NDI (ln)8.4085.196.414.94
GRI(ln)13.158.5378.327.23
TO7.185.085.8718.13
Disclaimer/Publisher’s Note: The statements, opinions and data contained in all publications are solely those of the individual author(s) and contributor(s) and not of MDPI and/or the editor(s). MDPI and/or the editor(s) disclaim responsibility for any injury to people or property resulting from any ideas, methods, instructions or products referred to in the content.

