Article

Dynamic Regimes for Corporate Human Capital Development Used Reinforcement Learning Methods

by
Ekaterina V. Orlova
Department of Economics and Management, Ufa University of Science and Technology, 450076 Ufa, Russia
Mathematics 2023, 11(18), 3916; https://doi.org/10.3390/math11183916
Submission received: 25 July 2023 / Revised: 8 September 2023 / Accepted: 12 September 2023 / Published: 14 September 2023
(This article belongs to the Section Financial Mathematics)

Abstract

:
Corporate human capital is a critical driver of sustainable economic growth, which is becoming increasingly important in the changing nature of work. Due to the expansion of various areas of human activity, the employee’s profile becomes multifaceted. Therefore, the problem of human capital management based on the individual trajectories of professional development, aimed at increasing the labor efficiency and contributing to the growth of the corporate operational efficiency, is relevant, timely, socially, and economically significant. The paper proposes a methodology for the dynamic regimes for human capital development (DRHC) to design individual trajectories for the employee’s professional development, based on reinforcement learning methods. The DRHC develops an optimal management regime as a set of programs aimed at developing an employee in the professional field, taking into account their individual characteristics (health quality, major and interdisciplinary competencies, motivation, and social capital). The DRHC architecture consists of an environment—an employee model—as a Markov decision-making process and an agent—decision-making center of a company. The DRHC uses DDQN, SARSA, and PRO algorithms to maximize the agent’s utility function. The implementation of the proposed DRHC policy would improve the quality of corporate human capital, increase labor resource efficiency, and ensure the productivity growth of companies.

1. Introduction

Corporate human capital (HC) is one of the most important drivers of sustainable economic growth that has become increasingly important under innovative economic development and the changing nature of work. Often, companies, underestimating the benefits of investments into HC development and exaggerating their risks, do not invest sufficient resources. Indeed, the return on investment is seen in the long-term. Thus, companies lose the opportunity to ensure a relationship between physical and human capital, on the one hand, and economic growth and development, on the other hand. Timely and informed decisions and investments make it possible to manage corporate human capital, which determines their economic growth and development.
The existing conditions of technological development inevitably change the nature and conditions of work. The employee’s profile has become more and more multifaceted due to the expansion of various areas of human activity in the digital space. Therefore, the problem associated with the development of approaches, methods, and tools for HC modeling and management as the most important resource for an company’s activities is relevant, timely, socially, and economically significant.
The aim of the study was to develop the technology for HC management based on a new methodology for HC assessment and a scheme for the individual trajectories for the employee’s development that improve the HC quality and increase the company performance. To implement the HC management scheme, the reinforcement learning method (RL) and a set of algorithms were used to find out the optimal personnel management strategies.
We considered the problem of sequential decision making in a stochastic environment. To solve this problem, the principle of maximum expected utility was applied. The optimal choice of decision sequence is based on future successive actions and observations. To formalize the problem of sequential decision making, when the consequences of actions are not determined, the Markov decision process (MDP) is used. The model defines the stochastic dynamics of the system as well as the utility associated with evolution and decision strategies. Therefore, we can find exact solutions for the MDP problem and also use various approximate methods.
The rest of this article is organized as follows. Section 2 describes the features of the HC study, summarizes methods for corporate HC assessment and management, presents the economic and social effects achievable with the competent management of corporate HC, and provides an overview of problems from the field of economics, finance, and business that can be solved based on RL methods. Section 3 presents the proposed methodology used to design the dynamic regimes for the development of corporate HC, and Section 4 describes a numerical experiment regarding the implementation of the proposed methodology and analyzes the results of the study.

2. Literature Review

2.1. Methods for Corporate HC Management

The existing conditions of technological development in the framework of the Fourth Industrial Revolution will inevitably change the nature and conditions of work. The quality of HC determines a significant contribution not only to the labor productivity growth, but also contributes to the increase in social connections, an expansion of market share, and product competitiveness.
At the level of the individual employee, HC is a set of knowledge, skills, and abilities, and the state of a person’s physical and mental health affects the results of their labor activity and corresponding income. At the level of an enterprise (organization), HC forms an economic resource, the reproduction of which requires, in contrast to physical capital, constant motivation. At the level of the state and the region, HC is formed by investing in the accumulation of knowledge and the intellectual component, and by improving the level and quality of life including upbringing, education, health, security, culture, and art. HC is a complex intensive factor of social and economic development. It contributes to improving the quality and productivity of labor in all types of life and the support of society.
The cornerstone in the formation of HC management mechanisms is the choice of methods for its assessment. Depending on the level of consideration and the subject of use, there are many methods designed to assess human capital in order to identify it and further manage it. Considering the assessment of personnel at the level of an individual employee (personnel assessment), talent management methods aimed at obtaining feedback from employees [1,2] in order to manage the company’s performance have recently become widespread. Within the talent management system, for personnel assessment and development, the following stages are usually performed: assessment of the performance of an employee; assessment of potential; career planning, training and career mentoring; staff rotation; the study of competencies in behavior. The problem of career management in the human resource development system has also been actively discussed in the scientific literature where the use of different coefficients for factors have been proposed to achieve a greater efficiency [3,4,5]. These factors in the development of HC are not independent and often have a close correlation [6,7,8,9], which complicates the search for specific mechanisms for career management. Regular and continuous evaluation and monitoring of employees is recommended to assess the extent to which the goal is being achieved [10].
Analysis of the scientific literature on the issues of the assessment and management of corporate HC has revealed a single goal: the design and maintenance of a sustainable system for the company’s human resource management [11,12]. Generalized methods of presenting human capital and methods for its analysis at the company level are combined in Table 1.
An analysis of the existing approaches, methods, and tools for assessing and managing corporate HC shows that there is a gap between the need to take into account all aspects of a company’s HC and the possibility of existing approaches to such an assessment and management. The assessment of corporate human capital in various scientific works is formed, on the one hand, from the standpoint of the competence of employees or the state of health of the employees or motivational characteristics, etc. However, a comprehensive assessment of human capital at the corporate level, reflecting all of these different factors of employees and characteristics including education, health, qualifications, involvement and motivation as well as social skills, communication skills, interdisciplinary skills for the requirements of new professions and the ability to quickly employees adapt, which are the basis for the formation of management decisions on personal corporate developments, is absent in existing scientific papers on the topic.
Traditionally, HC management is implemented on the basis of tactical rather than strategic management methods, in which the long-term effects of the decisions taken are not considered. However, the dynamic nature of the HC indicators themselves, associated with changes in the professional qualities of the employee, their motivation, and social characteristics, is also not taken into account.

2.2. Modern Trends for the Personnel Professional Development

The strategic point for a design personnel management system needs to invest in personnel development, which is beneficial for the company. Proper investment in the employee’s development guarantees a competent, motivated, and well-coordinated team that will bring profit to the company.
Below, we present the main potential economic and social effects that arise as a result of competent personnel development for various economic subjects including the employee, the company, and society. At the employee level, the following positive effects are observed:
  • Guaranteed job retention;
  • Acquisition of new knowledge, skills, abilities, disclosure of abilities;
  • Growth in labor market value;
  • Expanding opportunities for professional and career growth;
  • Expansion of social networks and connections;
  • Growth in self-esteem and self-confidence.
At the company level:
  • Growth in productivity and quality of work, income and profits;
  • Reducing staff turnover;
  • Increasing employee motivation;
  • Increasing the contribution of each employee to the achievement of goals;
  • Facilitating the delegation of authority;
  • Improvement in corporate culture;
  • Reducing the adaptation period;
  • Improving the moral and psychological climate in the team and project teams;
  • Positive impact on labor discipline.
Society, as a whole, has the following benefits from increased HC quality:
  • Development of the labor potential of society;
  • The growth of social labor productivity.
At the stage of the personnel development strategy, it is required to clearly define what results the company expects to receive from its employees as well as what professional and personal qualities need to be developed. The personnel development strategy can be situational and systemic. In the first case, it is tied to a specific business task (for example, ensuring sales growth). With the system option, there is constant learning and development within the company. Through this strategy, employees improve their full range of skills and apply them in practice on the job.
The company itself must create specialists who are capable of developing and implementing innovative ideas and solutions. In this process, the selection and implementation of adequate methods of personnel management are of great importance.

2.3. Applications of RL in Organizational Systems

Applications of reinforcement learning methods and algorithms are diverse and are associated with the optimization problems (dynamic programming) of processes in organizational systems:
  • In industry and management, RL is used across the entire spectrum of resource management tasks [33,34,35,36,37,38], the development of production scheduling principles [39], development of restocking plans that set the timing and volume of restocking, and the development of logistics routes and supply chains [40,41];
  • In robotics, RL has many applications including the improvement in movement and the development of autonomous vehicles [42,43];
  • RL is used to improve cloud computing. Application performance is optimized for latency [44], data center cooling, processor cooling, and network routing [45,46];
  • RL is used to optimize energy consumption in power grids under conditions of multi-agent consumption [47] and for building smart energy infrastructure systems [48,49];
  • RL improves traffic control on the roads and is used in smart city management algorithms [50,51,52];
  • Many RL applications in the field of healthcare are used to generate schemes for calculating and dosing medicines [53,54,55];
  • In designing education and e-learning systems, RL can increase their effectiveness by selecting curricula [56].
In addition, Table 2 shows the RL applications in the field of economics, finance, and business, grouped by the commonality of the methods and learning algorithms used.
A number of studies have shown that RL is a learning model in the human brain. The use and implementation of the ideas of neuroscience and psychology for RL can also potentially affect the solutions of the sampling and research efficiency problems in modern algorithms. People can learn new tasks using few data. People can learn to perform the same problem by varying the parameters without having to relearn them [69,70,71]. In contrast to the RL model, people form generic representations that they transfer between different tasks. Principles such as compositionality, causality, intuitive physics, and intuitive psychology have been observed in the learning process [72,73]. If these learning processes can be modeled on the basis of RL, this can lead to a significant increase in the sampling efficiency and robustness of the algorithms. Experiments with RL models can provide results that can in turn be used in the fields of neuroscience and psychology.
Thus, all of this suggests the need to develop a new universal approach and method for corporate HC management, using HC as an economic productive resource, free from the shortcomings of existing methods. Based on an adequate assessment of the company’s HC, the new approach should provide support for making management decisions for the design of individual trajectories of professional development that ensure the improvement in the quality, not only of the individual and corporate HC, but also in the continuous growth in social welfare.
We propose a new methodology for corporate HC management, which is discussed in detail below.

3. Research Methodology

3.1. Concept Description

The dynamic regimes for human capital development (DRCH) are aimed at dynamic adaptation to various situations and improving the quality of HC and its return to the company in the long-term (due to delayed effects) and medium-term. The methodology of DRCH is presented in Figure 1.
DRCH is based on the proposed methodology for HC assessment [13] and the scheme for the design of individual trajectories of professional development. It is different from the existing ones in the systematic and comprehensive HC assessment in related fields, reflecting different aspects and properties of human capital as well as a scientifically-based strategy for HC management. The conceptual diagram of the methodology consists of an assessment module and a HC control module.
The human capital assessment module is based on a comprehensive consideration of the HC properties that are manifested in the digital economy, and takes into account traditional characteristics such as age, education, professional experience, and competencies as well as additional characteristics such as social status, health level, interdisciplinary professional competencies, motivation, and involvement.
For the assessment, we examined employers through five tracks: track 1 assesses the health quality, track 2 is intended to assess major competencies, track 3 is to assess the interdisciplinary competencies, track 4 is to assess motivation and involvement, and track 5 is to assess social status and behavioral skills. The control module is to design individual trajectories for the employees’ professional development and is based on the assessment results obtained from the previous module.
The design of the DRHC is as a sequential solution to a decision problem that fits well into the RL structure. Decision rules are equivalent to policies in RL, and management results are expressed by reward functions. The input data are a set of data on the employees across the entire spectrum of HC factors such as knowledge, skills, health quality, social capital, innovativeness, socio-demographic factors, digital footprint data as well as data on the causal relationships of these factors. The output data are formed as a management decision for each stage (as a state in RL).
The use of RL for solving the problem for DRCH design has several advantages:
  • RL makes the best decision over time for each employee at any given time, taking into account the diversity of the employees’ characteristics. This can be achieved without an exact mathematical model of an employee, and without data on the cause–effect relationships between the decision (impact) and the result (return);
  • RL and its solutions improves the long-term results, taking into account the distribution over time and the delayed effect of the impact;
  • RL allows for the design of a reward function that is adaptive and based on domain expertise;
  • RL provides multi-criteria optimization in terms of efficiency and risk criteria (for example, for a company to lose a competitive employee who may go to another employer).
The DRHC consists of a sequence of decision rules to form a course of action (type of impact) in accordance with the current employees’ performance and previous impacts. Unlike traditional randomized trials that are used as evaluation tools to confirm the effectiveness of a program, the DRHC has been designed to create scientific hypotheses and develop methods of influence (programs, activities) in certain employee groups or individual employees. Using the data generated in the system (for example, in the randomized trials system), the optimal DRHC can find the optimal result, which can consist of different programs.
The policy for the individual professional trajectory development of an employee is becoming increasingly relevant and can be used to select effective tools for HC management. This policy is a set of rules to determine the optimal composition of programs at a time, which depends on the characteristics of the employees as well as the effectiveness of the impact of already implemented programs. The optimal regime of influence (management) or a consistent set of programs allows for the maximization of the average expected income for the entire period of program implementation (management decisions).
The problem to be solved is to determine a set of individual programs for employees that increase the company’s efficiency. This takes into account the effectiveness of the next program, which depends on the results of the effectiveness of previous programs for a particular employee. As applied to this problem, the RL algorithm can be described as follows.
For each employee, stages correspond to points at which the program is defined. At these points, programs are selected, and observed information about the employee is recorded. The consequence of the impact of the program is a numerical value or reward. The search for the best exposure regime, which leads to the maximum effect for the company, is the goal of the RL algorithm.
The control object is HC, the assessment of which for individual employees is presented in detail in [13,74,75,76,77,78,79]. Based on the developed methodology, each employee has a certain numerical assessment of their HC. The assessment is carried out according to five groups of indicators (assessment blocks): the assessment of the level of health, assessment of competencies, assessment of cross-professional competencies, assessment of motivation and involvement, and the assessment of social status. Depending on the final HC value, the employee belongs in one of five groups for each assessment block (each block has five gradations of its values).
The proposed methodology to assess human capital is the basis for the design of management decisions aimed to develop the employees’ potential and the HC quality. Management decisions are personal in nature and depend on the existing HC level. Management decisions implemented in dynamics are called individual trajectories for professional development. A list of decisions has been developed for each block of HC assessment, depending on the total HC level [13]. These decisions, as programs, are aimed at HC improvement by one of its indicators. The general trajectory of the employee’s professional development is determined by the composition of managerial decisions from each block. The design of such a trajectory is the problem of RL.

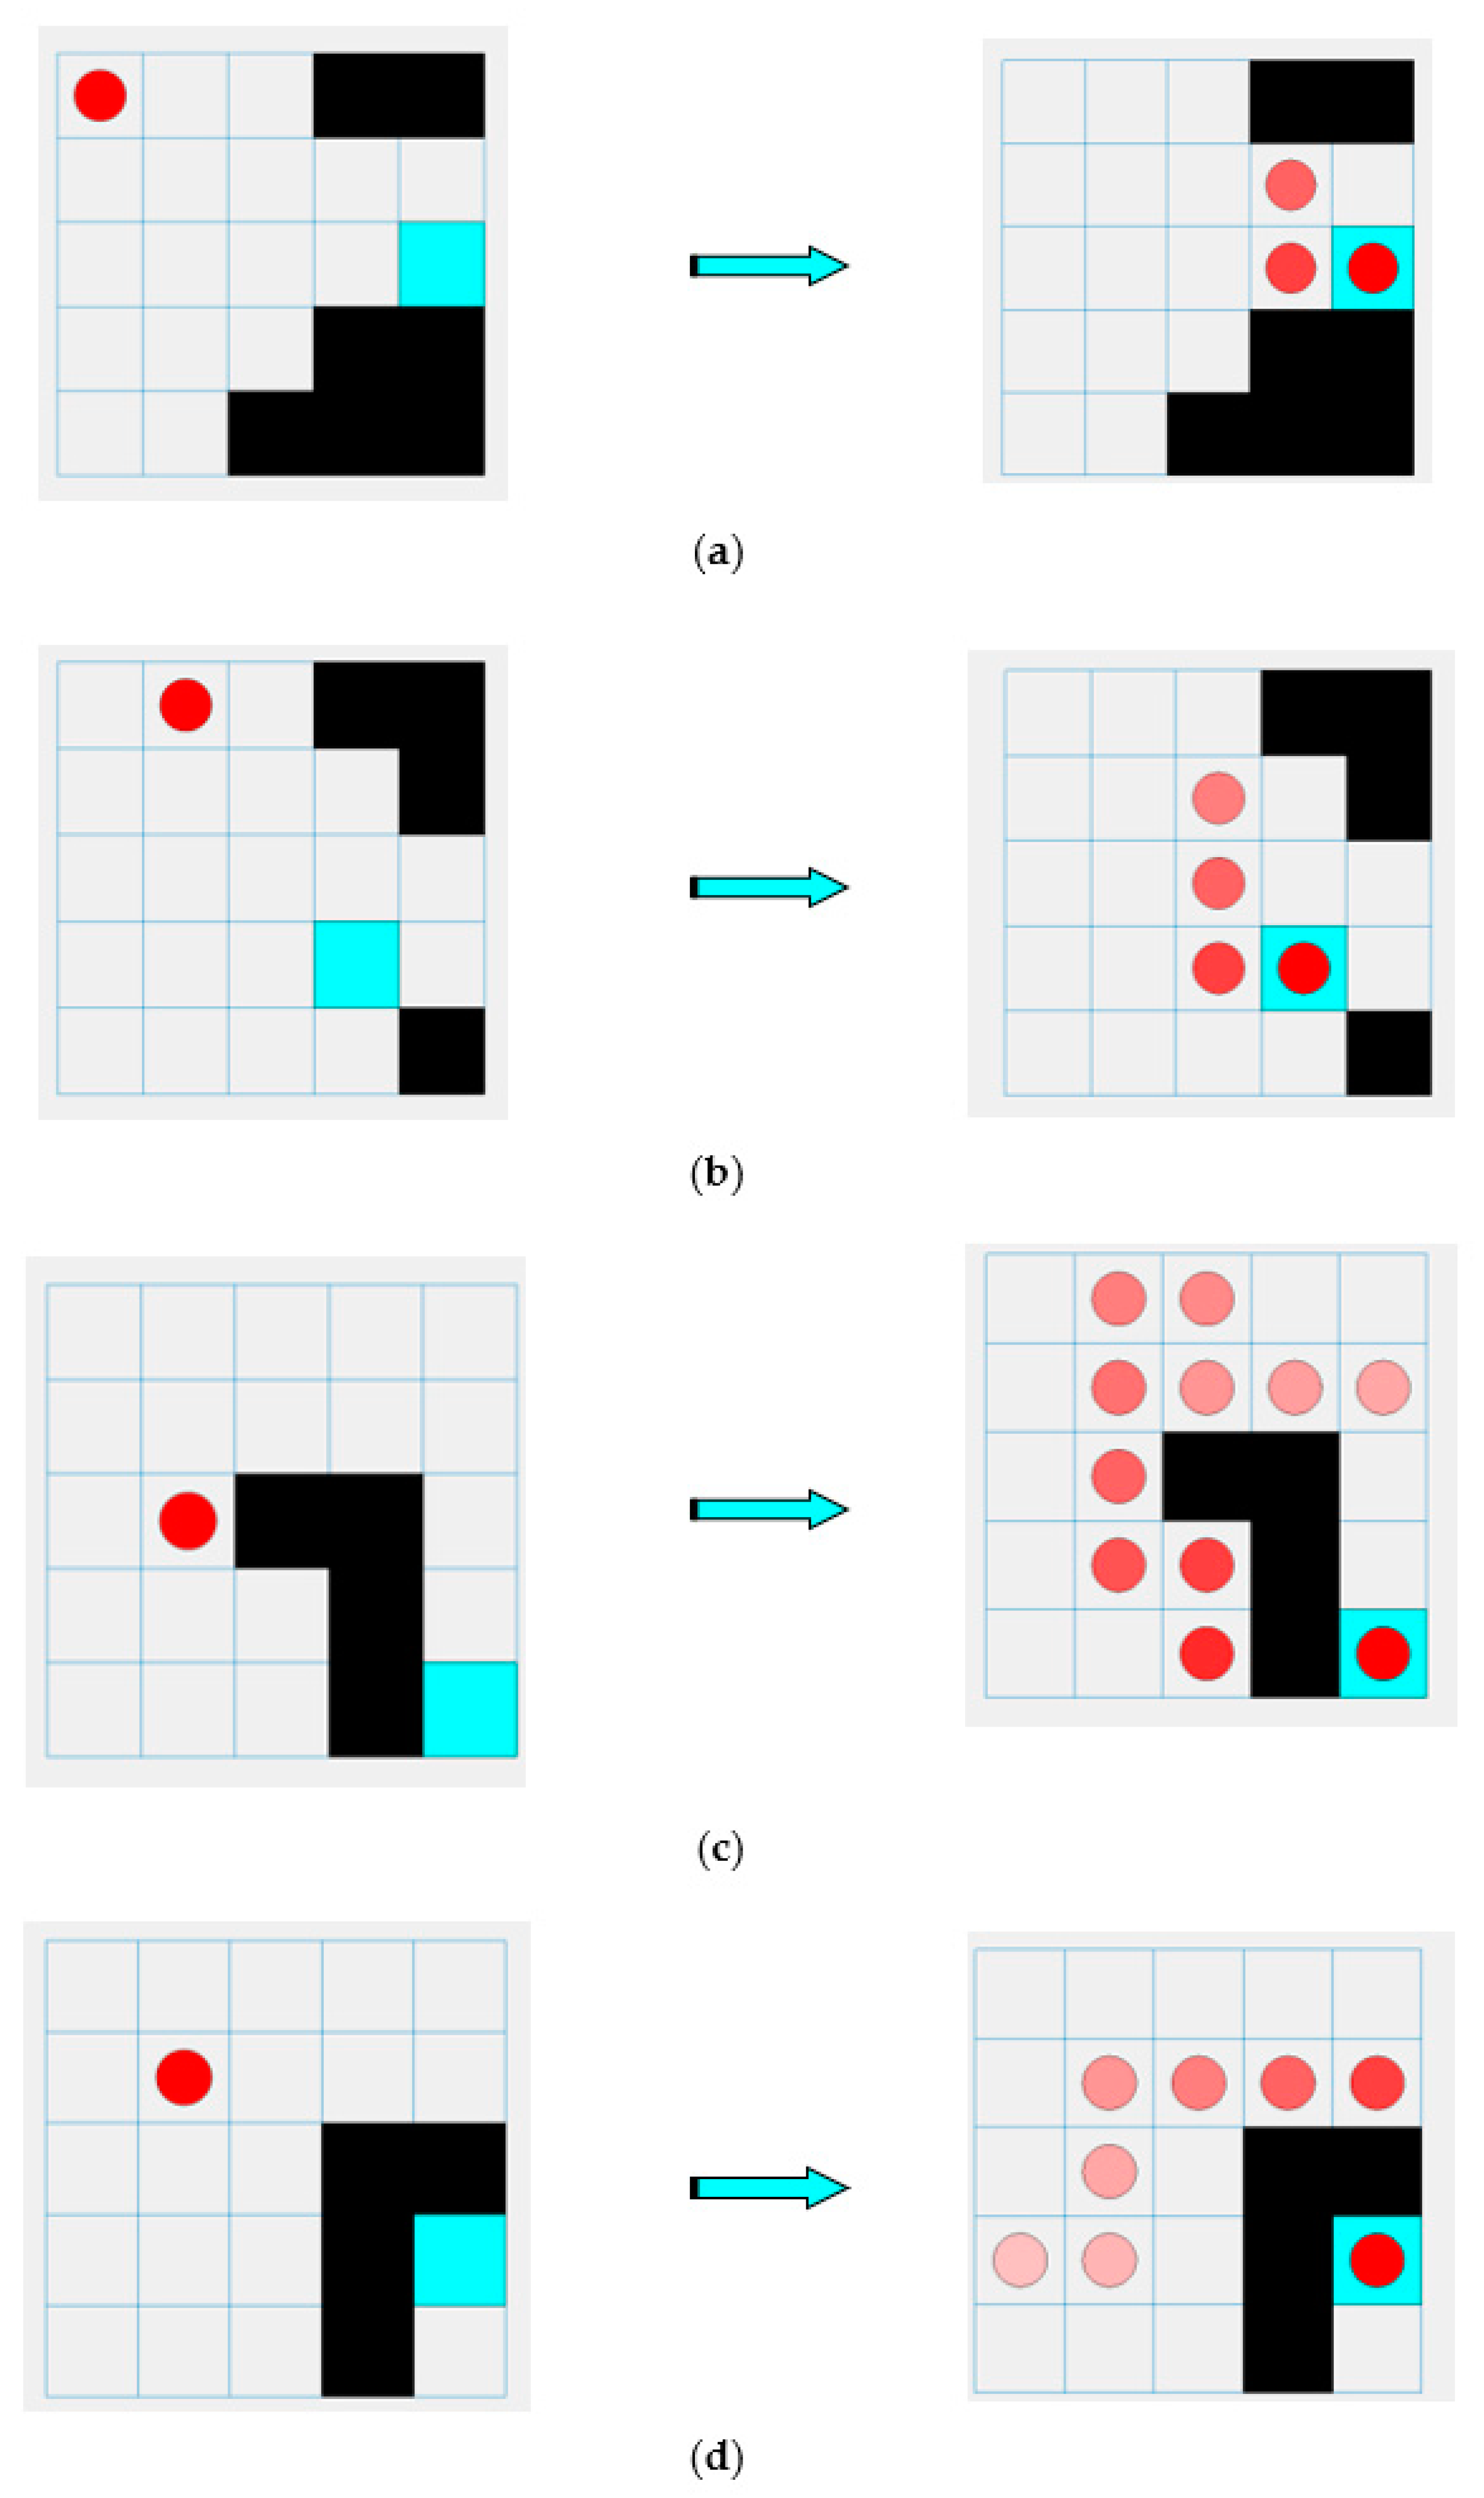
3.2. Statement of the Problem

The environment is defined as a Markov decision process (MDP) [80]: M = S , A , P , R , γ , where S is the state space in which the environment states are defined, s t S ; A is the action space in which the actions of the agent are defined, a t A ; P is the transition probabilities of the Markov process, at each time step t, the next state s t + 1 is taken from the probability distribution P : p s t + 1 s t , a t P ; R is the reward function, at each time step t, the agent receives a reward depending on the action implemented a t from the state s t to the new state s t + 1 : r t s t , a t , s t + 1 R ; γ is the discount factor used to sum rewards, γ 0 , 1 . The notations for states s t = s , s t + 1 = s , actions a t = a , and rewards r t = r will be further used interchangeably.
The MDP graph consists of a set of vertices corresponding to different levels of HC quality. The states are set in 5-dimensional space by the number of HC assessment indicators (major competencies, interdisciplinary competencies, social skills, health quality, motivation). The change in state occurs under the influence of 25 different decisions, five decisions for each of the five indicators for the HC quality assessment. We introduced an assumption that for each employee in a unit of time, it is possible to implement a decision (action) only from one block A 1 , A 2 , A 3 , A 4 , A 5 A . Therefore, the movement of an employee along their trajectory when implementing a certain decision is possible one level forward, according to a certain indicator (that is, the value of this HC indicator increases), back along this indicator (that is, the value of this indicator decreases), or the HC indicator remains unchanged. If, as a result of the implementation of action a t , the employee’s HC indicator increases, the improvement of which is directed by this action, then the reward r t a t is returned to the agent.
In total, there are five blocks of indicators for HC assessment and five gradations within each indicator group, thus it is possible to form 55 states of the MDP graph (vertices correspond to different levels of the quality of human capital). In each block of indicators for each of the five levels of the integral indicator in the block, there is a certain management decision to increase the HC level. Therefore, there are 25 different actions implemented by MDP. Let us set the states of the graph as s i j m k l , where the indices correspond to the indicators of the five blocks of HC assessment. In each state, the agent can make different decisions, forming a set of decisions a i j , where i is a block of HC indicators to be controlled and j is the corresponding decision in the i-th block. For example, when implementing an action, the transition from state s 22111 through action a 13 means that decision 3 in block 1 (health level) is applied, which allows us to increase the level of HC from level s 22111 to level s 32111 . Figure 2 shows the transitions graph from state s when implementing action a. Each arrow in the figure corresponds to the triple s , s , a ; the arrows reflect the probabilities of transition p s s , a from the current state s to a new state s at the next step when implementing action a as well as the corresponding reward r s , a , s for this transition. The sum of the transition probabilities on the arrows emanating from the top is equal to 1. The transition probabilities can be determined based on the results of randomized trials [81].
Interaction with the environment lasts for T steps. The whole process is divided into episodes; at the end of each episode, the environment is again transferred to the initial state and the interaction starts again. Rewards are considered as components of an additive decomposition of a utility function. In a problem with an infinite horizon, the number of solutions is not limited, and a discount factor γ 0 , 1 is introduced. Utility is defined as t = 0 γ t r t , which characterizes the discounted reward.
The reward R τ from episode τ = s 0 , a 0 , r 0 , , s T , a T , r T is as follows:
R τ = t = 0 T γ t r t .
Then, the objective function of the agent J τ is represented as the mathematical expectation of the reward on several trajectories:
J τ = E τ R τ = E τ t = 0 T γ t r t .
where R τ is the reward as the sum of discounted rewards for time steps t = 0 , , T , and the objective function J τ is the reward averaged over several episodes (repeated runs).
The problem of DRCH development is considered as a stationary MDP, in which the probabilistic model of transition from state to state under a certain action and the probabilistic model of rewards do not change over time.
The value function Q π s , a of action a in state s under strategy π determines the expected reward when the agent starts from state s, takes actions a, and then follows strategy π :
Q π s , a = E t 0 = s , a 0 = a , τ π t = 0 T γ t r t .
The optimal strategy can be found using the dynamic programming method, which is the simplification of a complex problem by recursively breaking it down into simpler subtasks. Let us consider the Bellman optimality equations for Q π s , a :
Q * s , a = E R t + 1 + γ max π Q * s t + 1 , a s t = s , a t = a = max π s , τ p s , r s , a r + γ Q * s , a .
For MDP, Equation (4) has a unique decision that does not depend on the strategy. The Bellman equations are a system of equations written for each state.
The goal of the RL algorithm is to find a strategy π * that maximizes the mathematical expectation of the cumulative expected reward for all s states:
π * s = max π Q * s , a .
To calculate the expected reward J τ , the agent can use various objective functions that generate different learning algorithms. In this research, we used the following algorithms: utility-based algorithms, strategy-based algorithms, and combined algorithms.

3.3. Agent Learning Algorithms

The reinforcement learning algorithm is a sequence of adapted procedures corresponding to the dynamic change in the modeled system states. Thus, the strategy for designing the DRHC, developed on the basis of the reinforcement learning method, will dynamically change over time as the observations of the states accumulate.
An algorithm for the formation of individual development trajectories of employees was developed based on the reinforcement learning approach, taking into account the current HC level. The strategy that the algorithm develops determines how the agent chooses an action in a given state, that is, what methods of managerial influence will be most appropriate for an employee at a given time. A decision (action) is chosen that maximizes the total reward that can be achieved from a given state, rather than the action that brings the greatest immediate effect (reward). The long-term goal of the enterprise is to improve the HC quality as well as increase the resources’ productivity and efficiency.
There is a fundamental difference between stochastic and deterministic strategies. A deterministic strategy uniquely determines which action to take, while a stochastic strategy is based on the probability of each action being taken. The use of a stochastic strategy for the execution of actions takes into account the environmental dynamics and helps to explore it in dynamics.
When constructing RL algorithms, the representation of the environment as a control object is important. There are algorithms based on the environment model (model-based algorithm) and those that do not use the environment model (model-free algorithm). The model describes the environment behavior, predicts its next state, and rewards for different states and actions. If the model is known, then planning algorithms can be used to interact with the environment as a recommendation for future actions. For example, in environments with discrete actions, potential trajectories can be modeled using Monte Carlo tree search. The environment model can either be set in advance or trained by interacting with it. If the environment is complex, dynamic, or poorly formalized, then it can be approximated by a deep neural network in the learning process.
The environment presented in the form of MDP and flexible RL algorithms implement a method of sequential decision making when the selected action affects the next state of the control object and the decision results. The optimal strategy for achieving the set goal is developed through the interaction of the agent with the environment.
The following classes of algorithms were considered: utility-based algorithms, strategy-based algorithms, and combined algorithms.
Utility based algorithms, as a deep neural network (deep Q-Networks, DQN), are learning algorithms based on utility and the time difference method that approximates the Q-function. The configured Q-function is used by the agent to select actions. Q-learning is action value based; it is a split strategy algorithm. To update the current strategy, the experience gained in the implementation of different strategies (not only the current one) is used. Two strategies in Q-learning—target (constantly improving) and behavioral ε -greedy—are used to interact with the environment. The agent, based on information about the state of the control object s t and the reward r t received from the environment for the action a t that has transferred the state of the object to the next state, calculates the value of the function Q s , a , which evaluates the value of the action a t in the state s t . The Q-function is tuned using the time difference method (TD-learning method); the function value is updated on the accumulated discounted future rewards and determines the Bellman optimality principle [81]:
Q s t , a t Q s t , a t + α r t + 1 + γ max a Q s t + 1 , a Q s t , a t ,
where α is a learning rate of the value function, at α < 1 , the old state is approximated to the new one, at α = 1 , the old state is replaced by a new one; r t + 1 are rewards received from the environment for actions a t from the state s t ; γ is the discount coefficient; max a Q s t + 1 , a is the maximum expected value from the state s t + 1 (new value); Q s t , a t is the previous value (old value).
The obtained Q-values are used to train the agent and determine the next action. For this, a neural network (utility network, value networks) is used, which evaluates the Q-value of pairs s , a and selects actions with the maximum Q-value (maximum utility):
Q t arg e t π s , a = r + γ max a i Q π θ s , a .
To prevent errors in maximization in Q-learning and increase the learning stability, a double Q-learning (double DQN, DDQN) algorithm is used. The DQN algorithm uses the same neural network to select an action and obtain a Q-function score. The DDQN algorithm uses two neural networks. The first is the trained θ -network, which is used to select the action a , and the second is the predictive ϕ -network, which is used to calculate the Q-value for pairs s , a , that is, to evaluate this action a . These two networks are trained on overlapping use cases. The use of a predictive network makes it possible to make learning more stable by reducing the rate of change of the target Q-value Q t arg e t π :
Q t arg e t π s , a = r + γ Q π ϕ s i , max a i Q π θ s i , a i .
Algorithm 1 is based on DDQN and reduces the overestimation of Q-values by adjusting the Q-function estimates.
Algorithm 1: Estimation of the agent’s utility function based on double deep Q-networks.
1. Initialization of hyperparameters: learning rate α ; discount coefficient γ ; update rate of the trained network τ ; predictive network update rate F
2. Initialization of the number of use cases per training step, B; number of updates per package, U; data packet size, P; case memories with a maximum size of K; number of steps in episode T; initialization of network parameters θ with random values; initialization of predictive network parameters ϕ = θ
        For each episode
3. for m := 1 to T do
4.            Accumulate and save h cases s i , a i , r i , s i , using the current strategy
5.            for b := 1 to B do
6.                select the b-th package of cases from memory
7.                for u := 1 to U do
8.                             for i := 1 to P do
9.                                 calculate target Q-values for each case
10.                                 y i : = r i + δ s i γ Q π θ s i , max a i Q π θ s i , a i ,
                                    where δ s i = 0 , if s i -final state otherwise δ s i = 1
11.                end for
12.               Calculate the loss function
13.                L θ : = 1 N i y i Q π θ s i , a i 2
14.              Update trained network parameters θ
15.                    θ : = θ α θ L θ
16.                end for
17.       end for
18.     decrease τ
19.             if (m mod F) = 0 then
20.                    Updating predictive network parameters ϕ
21.                     ϕ : = 0
22.                    end if
23. end for
In accordance with Algorithm 1, the data are first collected and stored (step 4), obtained in accordance with the ε -greedy strategy that generates Q-values. The Q-function estimate is parameterized using a neural network with parameters θ and is denoted by Q π θ . To train the agent, B is fetched (using five batches and five parameter updates per batch) of case packets from memory (steps 5–7). For each dataset, the parameters are updated. Next, target Q-values for all items in the batch are calculated (step 10). Q-values for all actions are calculated and the action with the maximum value is selected. After that, the loss functions are calculated (step 13), the loss gradient is calculated, and the network parameters are updated (step 15). After implementing this training step (steps 16–18), the parameter τ is updated. The experience replay buffer is used to allow the agent to analyze and learn from its previous actions. This is the trajectory store for the current episode. The agent can look back to calculate the expected reward for each step. After completing the entire learning phase (steps 6–17), the parameter τ is updated.
A hyperparameter F determines how often the predictive network is updated. First, there is initialization of the additional network as a predictive network, then its parameters are assigned values (step 2). Target Q-values are calculated using the predictive network (step 10). The predictive network is updated periodically (steps 20–23). Periodic replacement of the predictive network parameters ϕ with a copy of the network parameters θ is used to perform updates.
Usage of two networks in this algorithm can slow down the learning process if the parameters θ and ϕ are very close values, in which case learning can be unstable, but if it changes too slowly, the learning process can slow down. To find a reasonable relationship between the stability and learning rate, we need to adjust the frequency hyperparameter F , which controls the rate of change ϕ .
Figure 3 shows the architecture of the developed RL system in DRHC as the DDQN algorithm. The trained network θ is used to select actions; the predictive network ϕ is used to evaluate this action, that is, to calculate the Q-value for the pair s , a .
The SARSA algorithm uses the same idea, except that the DQN algorithm calculates the utility function in several time steps, that is, it buffers the experience. The DQN algorithm implements calculations over multiple data packets, which increases the computational load on the computing system, but can significantly speed up learning.
Strategy-based algorithms (REINFORCE) are a class of algorithms designed to customize the strategy. Good states should generate actions that provide trajectories that maximize the agent’s objective function as the sum of discounted rewards averaged over several episodes. The agent needs to act in the environment, and the actions that will be optimal at the moment depend on the state. The strategy function takes a state as an input and produces an action as an output. That is, the agent could make effective decisions in different situations. The algorithm builds a parameterized strategy that obtains the probabilities of action from the states of the environment. The agent uses this strategy to act in the environment. These are strategy gradient algorithms. In order to maximize the objective function of the state value, its gradient is used, which is to adjust the weights of the backpropagation neural network.
The proximal policy optimization (PRO) algorithm is a strategy gradient method with objective function transformation. It combines the REINFORCE algorithm and the actor-critic algorithm. There are two options for choosing a loss function: (1) based on the Kullback–Leibler distance (with an adaptive loss function) and (2) based on a truncated objective function. The application of the objective function transformation for the strategy could increase the stability and efficiency of the samples in the learning process due to lower computational resources and higher performance. However, there are also disadvantages of this algorithm, for example, low sensitivity to the hyperparameter, which gives close performance values for different values of this parameter.

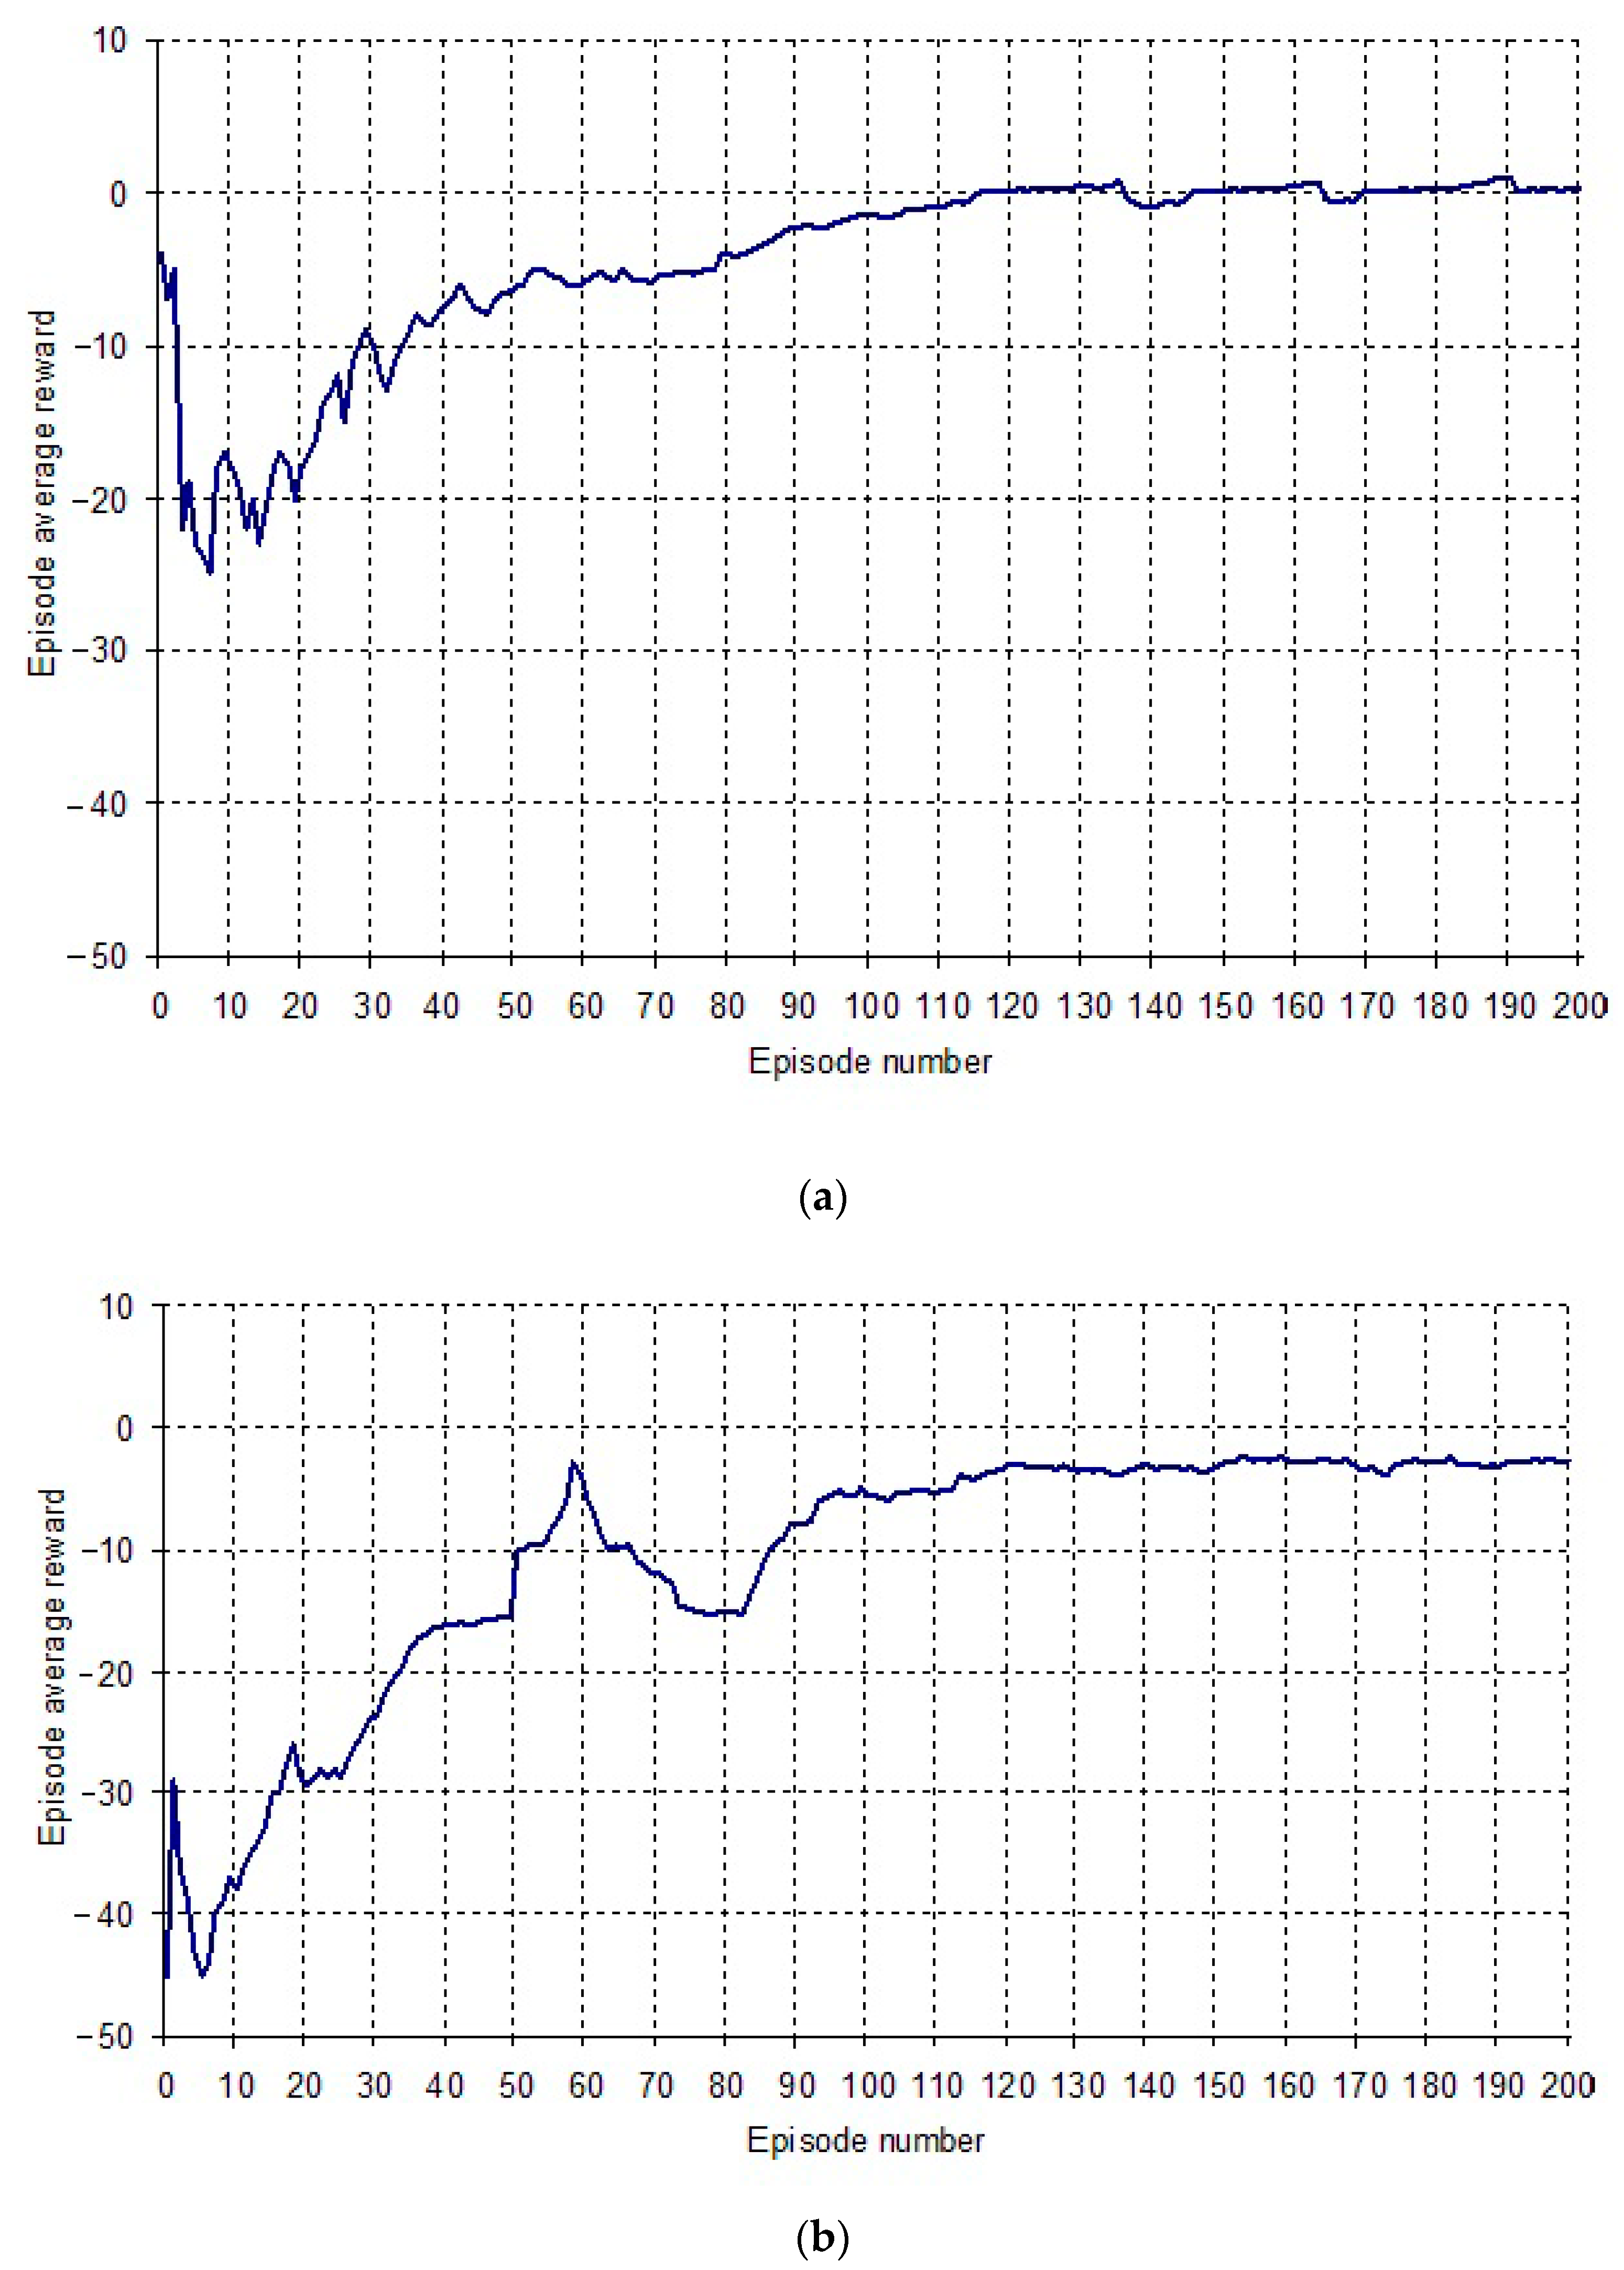
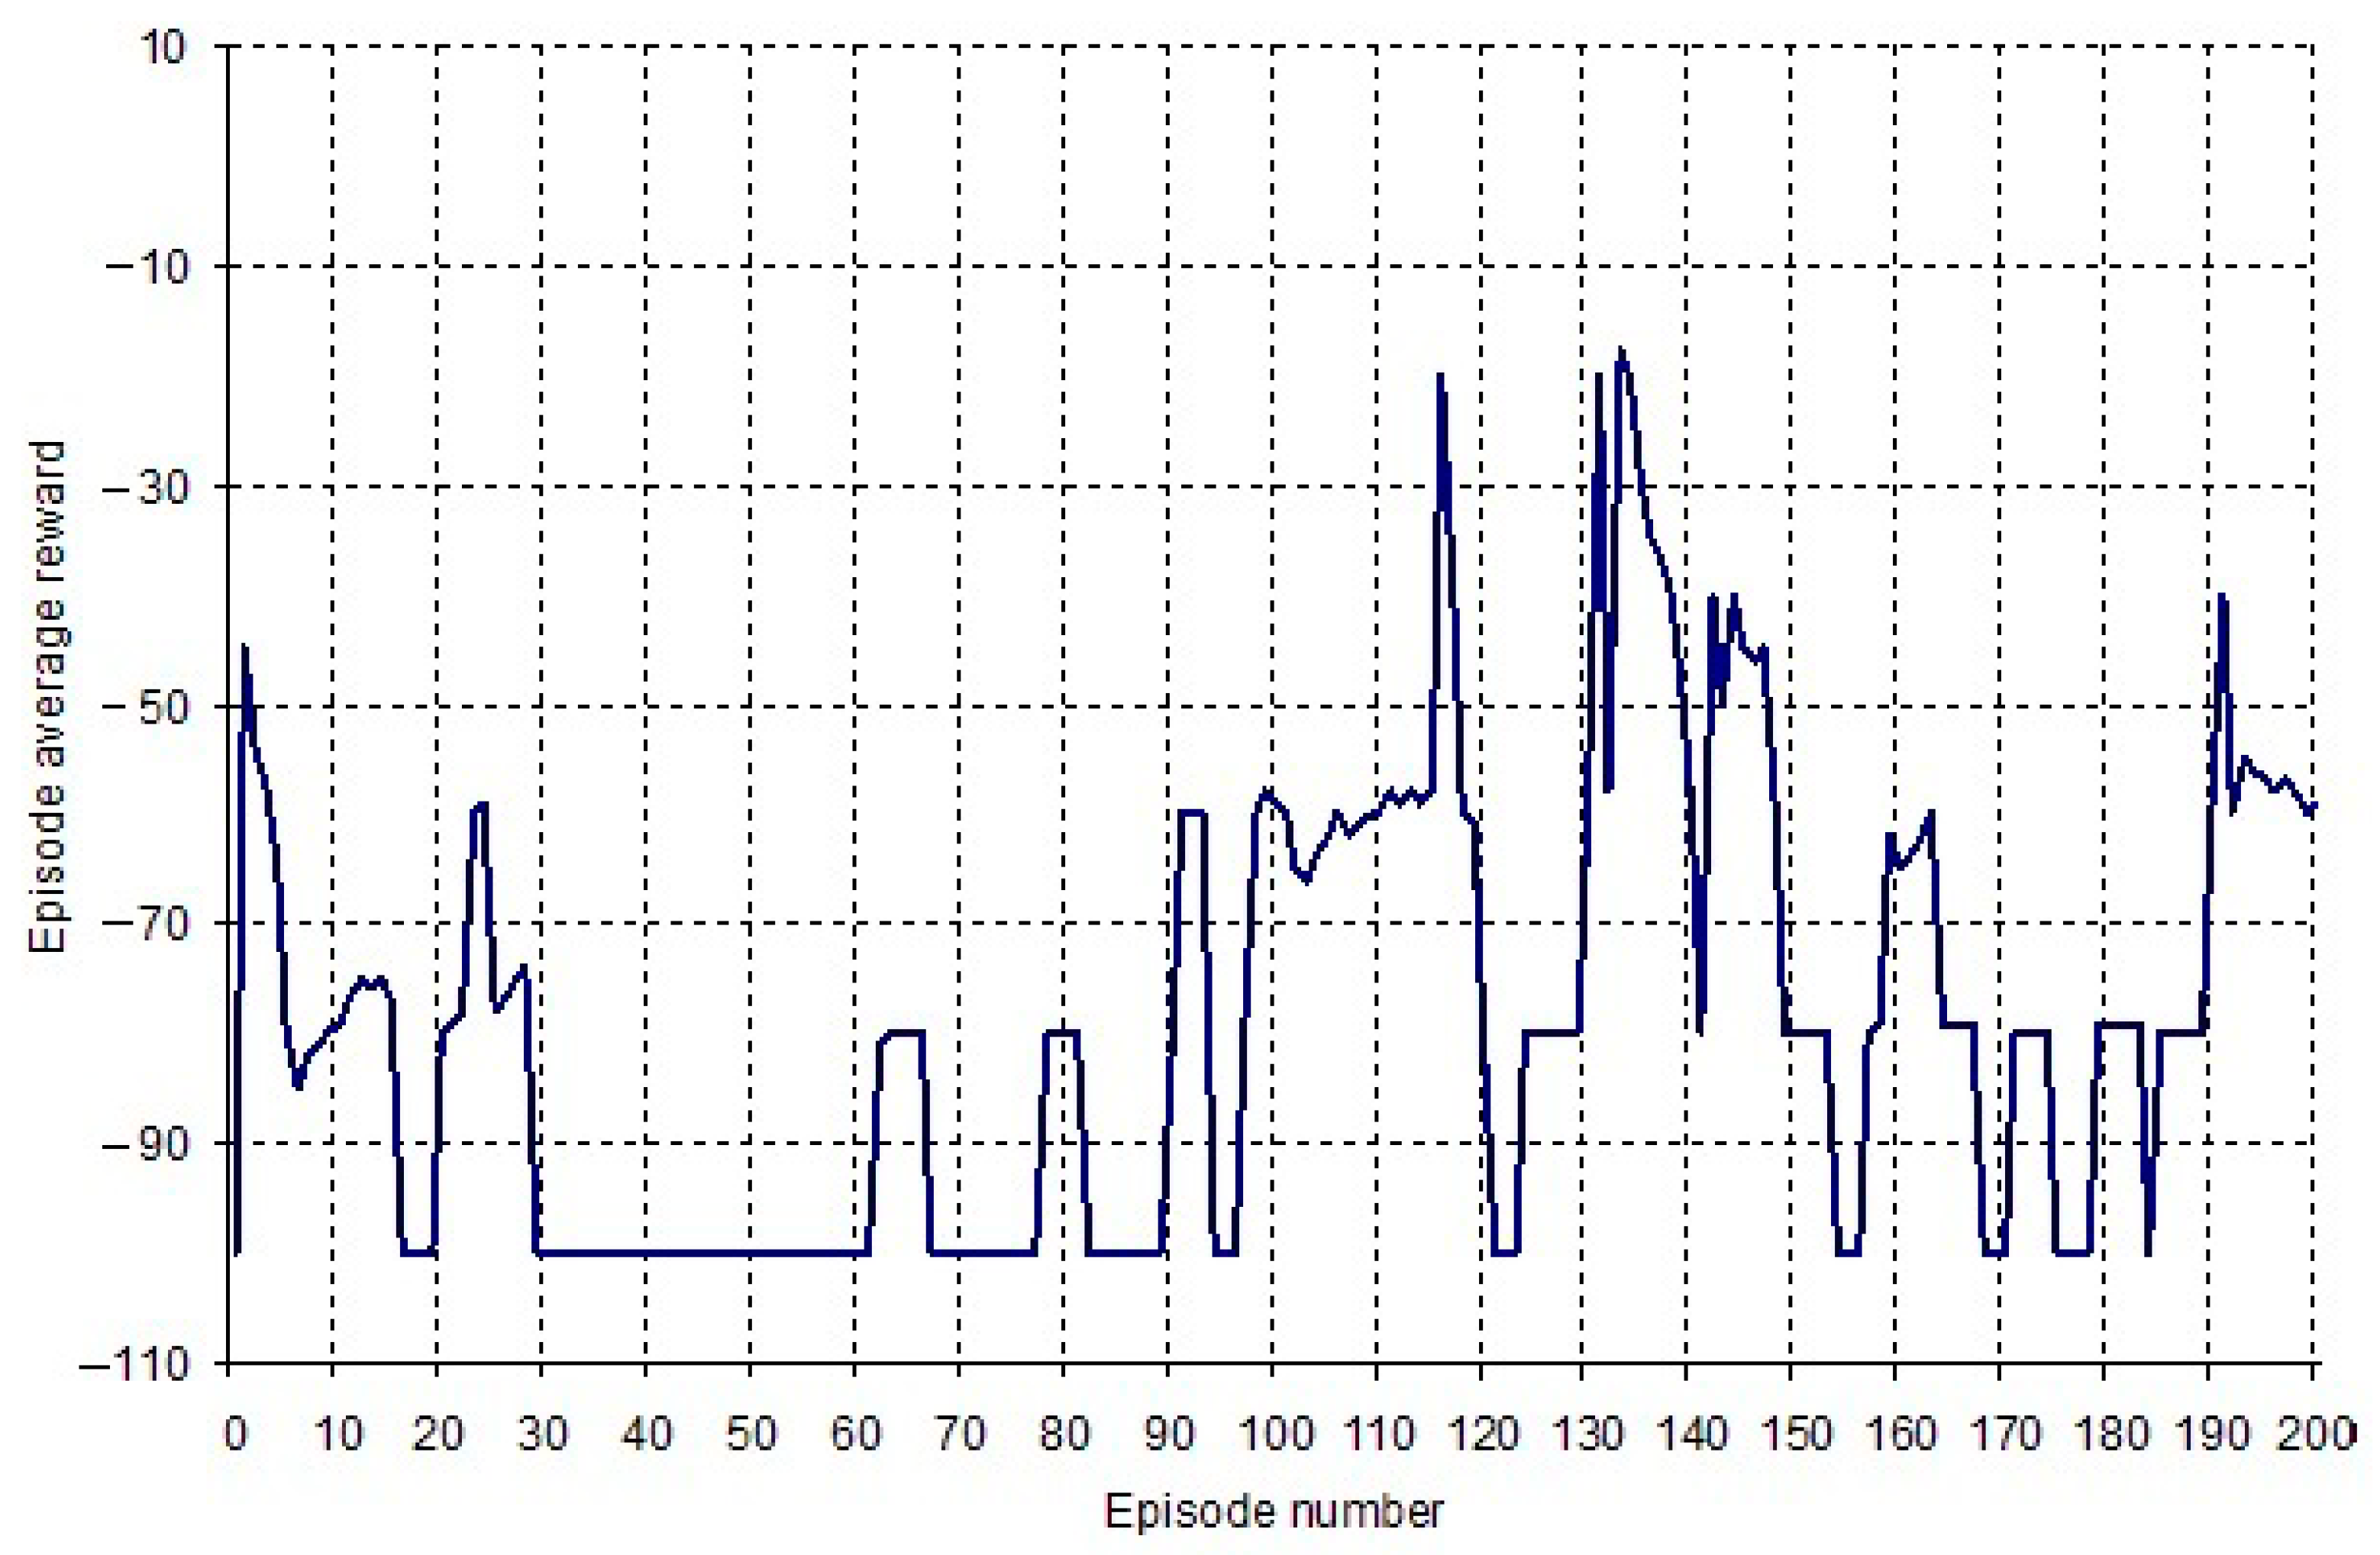
4. Empirical Results and Discussion

The experiments were carried out on the basis of data from a large oil producing and refining enterprise. There are data on the assessment of human capital; for the labor productivity of employees, a set of management decisions is formed about the impact on the HC elements (indicators). Here, two indicators were considered that form the human capital: an indicator about the employee’s health level and an indicator about the level of their major competencies. Each indicator has five value levels. The problem of HC quality improvement is solved on a two-dimensional grid 5 × 5, where the rows reflect the levels of the first indicator (the level of employee health), the columns (the levels of the second indicator) are the major competencies. According to the results of the HC assessment determined according to the methodology proposed by the authors in [13,74], each employee receives a certain score for each of these two indicators—the value range for each indicator is from 1 to 1000 points and is presented as a red circle in the grid (Figure 4).
Figure 4 shows that for the employee (cell (3,2)), there is an opportunity to move toward the goal (cell (5,5)). If, for a certain employee, it is not possible to achieve the highest possible level of competence, taking into account their current level of education and other objective health factors that would not allow this employee to achieve the maximum possible level, then another goal is determined for this employee. Also, based on the combination of health factors, they will not be able to achieve an increase in the level of major competencies in this area, taking into account low values of health quality. That is, the conditions of this profession are such that levels 3 and 4 of professional development are not possible for an employee with low indicators of physical capabilities (black cells (3,3), (3,4)). Besides, with high indicators of the health quality, an employee can immediately move to the highest level of major competencies, that is, a quick transition to level 5 according to indicator 2 (cells (4,4), (4,5)).
The employee is presented as an environment in which the restrictions on the attainability of the goal (the final state of the environment), the initial state, the functions of state transitions, and the rewards for these transitions are set. Transitions to the right and down are possible, which correspond to the movement of an employee to the next level according to one of the indicators when implementing management decisions in the corresponding group. Actions are discrete and reflect one of the management decisions intended for this employee category. A decision is understood as the implementation of a certain program (for example, advanced training) aimed at increasing human capital and labor productivity. A full list of programs can be found in [13,74]. It is possible to implement 24 different decisions when an employee moves from cell (1,1) to cell (5,5). Rewards are formed in a way that out of all the possible paths to the target state, the shortest one is found. This corresponds to the dynamic regime development for an employee who has to achieve the target state in the shortest possible period of time. Each step has a penalty of −1 point, reaching the goal has a reward of 3, passing through the restriction area, for example, movement from (4,3) to (4,5) is rewarded with 1 point. The goal is to learn from the agent (as a decision making center of the company) to design the most adequate composition of management decisions that correspond to the current state of the employee’s HC and implement this set of decisions in the shortest possible time in order to increase the productivity and efficiency of the company as a whole.
A series of experiments was carried out for several employees with different HC values. For each employee, various agent training algorithms were tested. We also evaluated the algorithms’ convergence on the path to maximum reward. Figure 5 and Figure 6 show the average rewards received for each of the 200 simulation episodes for each of the four different experiments. There were 50 trials in each episode and a total of 10,000 trials in each training experiment. The simulation results characterize the fast convergence of the algorithms. We used the DDQN learning algorithm for the first three experiments, and the SARSA learning algorithm for the fourth experiment.
The agent was also trained based on the PRO algorithm. The results of estimating the average reward for the learning period are shown in Figure 7. It shows that the agent does not learn well based on this algorithm; it acts randomly to achieve the target state. This indicates that this learning algorithm is not very suitable for this class of problems, which has discrete states and discrete actions.
To select the best algorithms, we analyzed their performance. The performance of the algorithms was evaluated according to two criteria: policy efficiency (average reward) and agent learning efficiency (convergence rate). The average reward values were calculated for each of the 200 simulation episodes averaged over 50 trials. It was shown that the best result was provided by the DDQN algorithm, which provided relatively fast learning and a positive reward (Table 3). Therefore, the development of individual trajectories of professional development should be based on the DDQN agent.
After the agent has been learned, a set of experiments is implemented. As a result, for each employee with the initial and target states, optimal dynamic regimes for HC management (optimal strategies) are formed (Figure 8). These optimal strategies show the sequence of management decisions that ensure the growth in HC quality. All policies were developed by the agent using Q-learning. In Figure 8, the movement along the trajectory is characterized by a large dimming of the current state (indicated in different shades of the current state in the figure).
The simulation results show that for the first employee to achieve a given target state, the best regime would be the following sequence of actions. First, implement a program aimed at the improvement of the employee’s health quality to the second level, then gradually implementing programs to ensure the growth of competence to level 4, after that, apply a health improvement program, and only after that, ensure the improvement of professional competencies. This sequence of developed programs would provide the best result in the shortest time. For the second employee, the trajectory is as follows: it is necessary to ensure the growth of the major competencies to level 3, then step-by-step to improve their health quality to level 4, and finally increase their competence.
Thus, individual trajectories for employees are proposed based on the DRHC methodology in accordance with the rules obtained from the RL. Optimal policies are formed as a result of an agent learning based on previous experience; designed policies are the implementation of a dynamic regime for the employee’s development. Application in a company of the proposed policies would improve the HC quality, improve its resource efficiency, and ensure the performance growth.

5. Conclusions

In this study, we showed that RL methods have proven effectiveness when the control problem features are as follows:
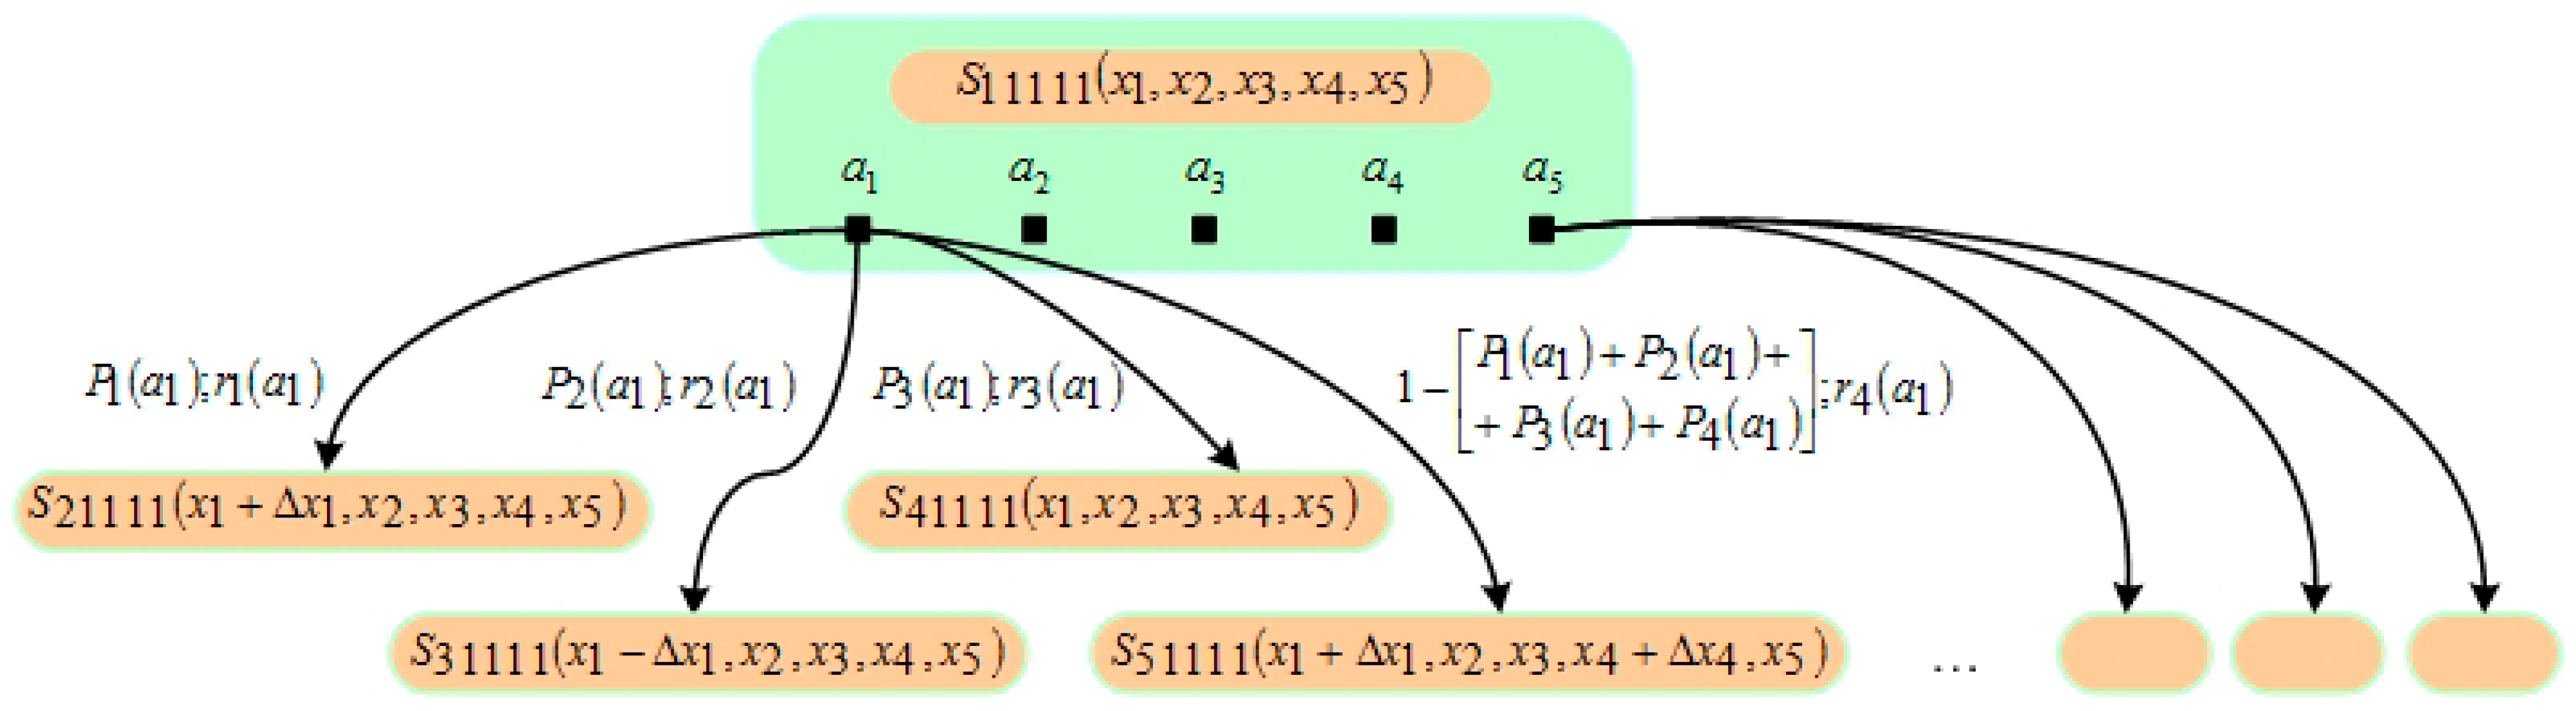
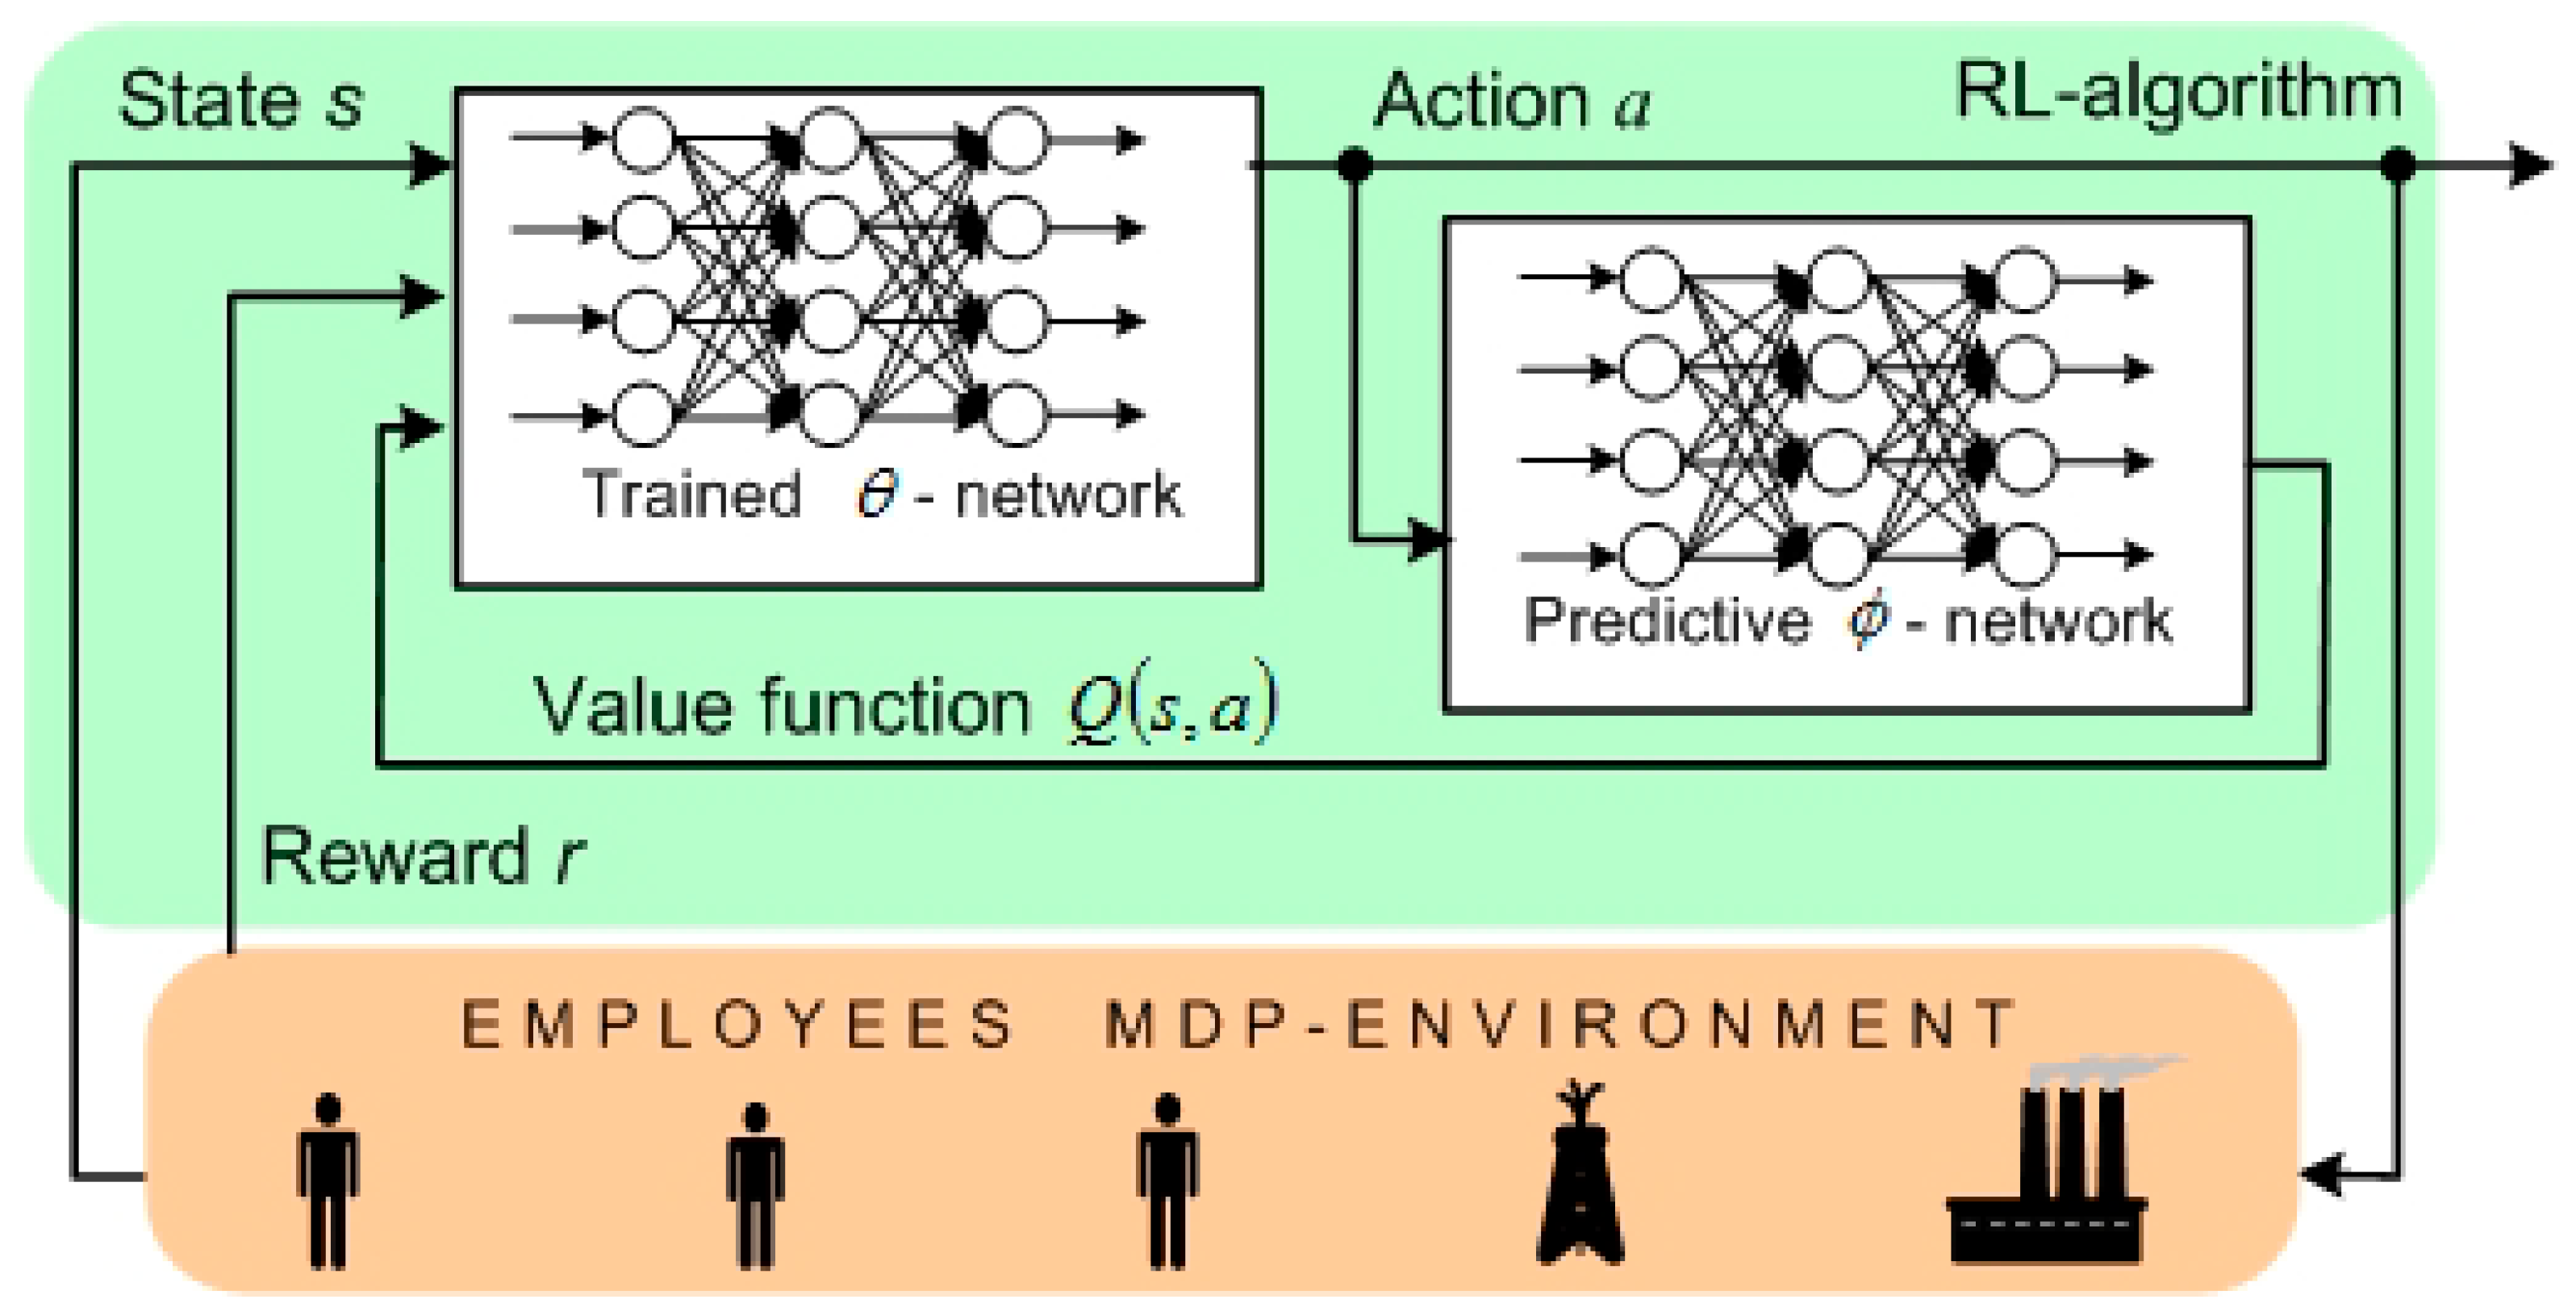
  • The control object is characterized by the stochastic dynamics of its indicators, and management decisions are not determined. To describe an object, a Markov decision process (MDP) model is used as a set of requirements for determining and changing system states when sequences of actions are stochastic. When describing the control object, the Markov property is used, which proposes that the current state of the object and the projected impact at the current period contain sufficient information to determine the transition probability of the object to the next state at the next period. The MDP formalism is an important abstraction in solving the problem of learning a purposeful agent in the process of interacting with the environment.
  • The control problem has a strategic nature. RL methods allow for the study of long-term strategies. Solutions that are effective in the current period do not always show high efficiency in the long-term. Other decisions, in contrast, may have a delayed effect and be in demand when planning for the medium-term.
  • The control problem is presented in the form of sequential decision making. RL methods are applicable when decisions are made sequentially and actions are related to the study of the environment. The trained model provides optimal long-term multi-stage results in the form of rewards. The optimal control regime or a sequential set of actions allows for the maximization of the average expected rewards for the entire period of the implementation of management decisions. Classical algorithms of dynamic programming and Bellman’s principle of optimality are used as a theoretical basis. The basic concept of dynamic programming when used in RL problems is to use value functions to organize and structure the search for good strategies.
The focus of this paper was the complex process of corporate human capital management. Human capital is one of the most important resources for the innovative development of modern companies. Human capital, as a controlled object, satisfies all of the above listed properties. Therefore, the use of RL methods and tools for its solution is theoretically substantiated. The methods and algorithms of artificial intelligence for human capital quality management would significantly increase the adaptation of the company to global trends. Increasing the quality of human capital would allow companies to increase their innovative activity, ensure sustainable competitiveness, and expand potential growth.
The paper systematizes the application of RL models and methods. It was shown that for complex organizational systems such as corporate human capital management systems, which have the properties of independent goal-setting, reflection, and limited rationality in decision making, there is no comprehensive methodological approach to developing an optimal management regime.
First, it was presented that one of the effective tools for improving the quality of human capital is the individualization of decisions in management strategy development. The methodology was developed for the dynamic regimes of human capital development (DRHC), based on the reinforcement learning methods, which ensures the design of individual trajectories for the employee’s professional development, taking into account their individual characteristics (health quality, level of professional and multidisciplinary competencies, motivation, social capital) and current performance indicators.
The novelty of the DRHC methodology is as follows. Firstly, it reflects the essential properties of human capital that form the conditions for its management. Secondly, it is based on a new scheme to support the management decision-making process for the design of individual trajectories of professional development, which makes it possible to develop a set of decisions for the development of each employee, adequate to their health potential, intelligence, social, and career opportunities. The DRHC methodology is based on the MDP concept and RL algorithms. The policy developed by the DRHC is a set of rules, formed on the basis of the RL algorithm, to determine the optimal composition of programs, depending on the characteristics of the employee in the current period and the results of previous programs in the previous period of time. The difference between the proposed methodology of DRHC and other management methodologies is that the management policy is developed without an exact mathematical model (behavior) of the employee, and also without the availability of data on the causal relationships between the decision (program) and its result (program effectiveness).
Experimental studies were carried out on the use of the proposed DRHC methodology on the data of a large company in Russia. Testing of various agent learning algorithms was also carried out. Based on the experiments, it was shown that the best results in terms of achieving the maximum utility (reward) in the shortest possible time were provided by the DDQN algorithm based on Q-learning. For employees with different human capital profiles, optimal policies were designed with the implementation of an individual dynamic regime for employee development. The implementation of the proposed policies would improve the quality of corporate human capital, improve resource efficiency, and ensure the growth of the company.
The theoretical significance of the results is because the process of organizing, structuring, and searching for effective human capital management strategies is considered as a problem of consistent decision making in a stochastic environment. Optimal decisions are generated in a stochastic environment, whose dynamics are described as MDP, according to the expected utility maximization criterion, based on Q-learning algorithms.
The practical significance of the study was realized through the development of a decision support system on the basis of the developed DRHC methodology. It would provide a management process in the shortest possible time and ensure the innovativeness and competitiveness growth of a company.
The directions for further improvement of the proposed DRHC methodology are the design of reward signals, since they evaluate the progress in achieving the goal. Recently, much more attention has been paid to the construction of a reward function consisting of two components. The first component forms the agent’s internal motivation, reflecting their level of social responsibility for their decisions. The second component is related to external motivation; this is formed as a reward from the control object (human capital). The synthesis of such complex rewards can significantly improve the agent’s learning process by improving the performance of the algorithms used.

Funding

This research received no external funding.

Data Availability Statement

Data sharing is not applicable.

Conflicts of Interest

The author declare no conflict of interest.

References

  1. Church, A.H.; Bracken, D.W.; Fleeno, J.W.; Rose, D.S. Handbook of Strategic 360 Feedback; Oxford University Press: New York, NY, USA, 2019; p. 637. [Google Scholar]
  2. Steelman, L.A.; Williams, J.R. Feedback at Work; Springer Nature: Berlin, Germany, 2019; p. 280. [Google Scholar]
  3. Zhang, L.; Guo, X.; Lei, Z.; Lim, M.K. Social Network Analysis of Sustainable Human Resource Management from the Employee Training’s Perspective. Sustainability 2019, 11, 380. [Google Scholar] [CrossRef]
  4. Hernaus, T.; Pavlovic, D.; Klindzic, M. Organizational career management practices: The role of the relationship between HRM and trade unions. Empl. Relat. Int. J. 2019, 41, 84–100. [Google Scholar] [CrossRef]
  5. Alzyoud, A.A.Y. The Influence of Human Resource Management Practices on Employee Work Engagement. Found. Manag. 2018, 10, 251–256. [Google Scholar] [CrossRef]
  6. Hitka, M.; Kucharčíková, A.; Štarchoň, P.; Balážová, Ћ.; Lukáč, M.; Stacho, Z. Knowledge and Human Capital as Sustainable Competitive Advantage in Human Resource Management. Sustainability 2019, 11, 4985. [Google Scholar] [CrossRef]
  7. Stokowski, S.; Li, B.; Goss, B.D.; Hutchens, S.; Turk, M. Work Motivation and Job Satisfaction of Sport Management Faculty Members. Sport Manag. Educ. J. 2018, 12, 80–89. [Google Scholar] [CrossRef]
  8. Fang, W.; Zhang, Y.; Mei, J.; Chai, X.; Fan, X. Relationships between optimism, educational environment, career adaptability and career motivation in nursing undergraduates: A cross-sectional study. Nurse Educ. Today 2018, 68, 33–39. [Google Scholar] [CrossRef]
  9. Dickmann, M.; Cerdin, J.-L. Boundaryless career drivers—Exploring macro-contextual factors in location decisions. J. Glob. Mobil. Home Expatr. Manag. Res. 2014, 2, 26–52. [Google Scholar] [CrossRef]
  10. Jung, Y.; Takeuchi, N. A lifespan perspective for understanding career self-management and satisfaction: The role of developmental human resource practices and organizational support. Hum. Relat. 2018, 71, 73–102. [Google Scholar] [CrossRef]
  11. Zsigmond, T.; Mura, L. Emotional intelligence and knowledge sharing as key factors in business management—Evidence from Slovak SMEs. Econ. Sociol. 2023, 16, 248–264. [Google Scholar] [CrossRef]
  12. Osranek, R.; Zink, K.J. Corporate Human Capital and Social Sustainability of Human Resources. In Sustainability and Human Resource Management; CSR, Sustainability, Ethics & Governance; Ehnert, I., Harry, W., Zink, K., Eds.; Springer: Berlin/Heidelberg, Germany, 2014. [Google Scholar]
  13. Orlova, E.V. Design of Personal Trajectories for Employees’ Professional Development in the Knowledge Society under Industry 5.0. Soc. Sci. 2021, 10, 427. [Google Scholar] [CrossRef]
  14. Flores, E.; Xu, X.; Lu, Y. Human Capital 4.0: A workforce competence typology for Industry 4.0. J. Manuf. Technol. Manag. 2020, 31, 687–703. [Google Scholar] [CrossRef]
  15. Flores, E.; Xu, X.; Lu, Y. A Reference Human-centric Architecture Model: A skill-based approach for education of future workforce. Procedia Manuf. 2020, 48, 1094–1101. [Google Scholar] [CrossRef]
  16. Demartini, P.; Paoloni, P. Human Capital Assessment: A Labor Accounting or a Management Control Perspective? In Management, Valuation, and Risk for Human Capital and Human Assets; Palgrave Macmillan: New York, NY, USA, 2014. [Google Scholar] [CrossRef]
  17. Bassi, L.; Mcmurrer, D. Developing Measurement Systems for Managing in the Knowledge Era. Organ. Dyn. 2005, 34, 185–196. [Google Scholar] [CrossRef]
  18. Martinez, J.B.; Fernandez, M.L.; Fernandez, P.M.R. Research proposal on the relationship between corporate social responsibility and strategic human resource management. Int. J. Manag. Enterp. Dev. 2011, 10, 173. [Google Scholar] [CrossRef]
  19. Hasan, I.; Hoi, C.K.; Wu, Q.; Zhang, H. Social Capital and Debt Contracting: Evidence from Bank Loans and Public Bonds. J. Financ. Quant. Anal. 2017, 52, 1017–1047. [Google Scholar] [CrossRef]
  20. Lins, K.V.; Servaes, H.; Tamayo, A. Social Capital, Trust, and Firm Performance: The Value of Corporate Social Responsibility during the Financial Crisis. J. Financ. 2016, 72, 1785–1824. [Google Scholar] [CrossRef]
  21. Massingham, P.; Nguyet, T.; Nguyen, Q.; Massingham, R. Using 360-degree peer review to validate self-reporting in human capital measurement. J. Intellect. Cap. 2011, 12, 43–74. [Google Scholar] [CrossRef]
  22. Scott, H.; Cheese, P.; Cantrell, S. Focusing HR on growth at Harley-Davidson: Sustaining widespread success by prioritizing employee development. Strat. HR Rev. 2006, 5, 28–31. [Google Scholar] [CrossRef]
  23. Boudreau, J.W.; Jesuthasan, R. Transformative HR: How Great Companies Use Evidence-Based Change for Sustainable Advantage; Jossey Bass: San Francisco, CA, USA, 2011. [Google Scholar]
  24. Chynoweth, C. Stop doing dumb things with data. People Management, 23 November 2015. [Google Scholar]
  25. Lengnick-hall, M.; Lengnick-hall, C. Human Resource Management in the Knowledge Economy; Barrett Koehler Publishers: San Francisco, CA, USA, 2003. [Google Scholar]
  26. Douthit, S.; Mondore, S. Creating a business-focused HR function with analytics and integrated talent management. People Strategy 2014, 36, 16–21. [Google Scholar]
  27. Mouritsen, J.; Bukh, P.N.; Marr, B. Reporting on intellectual capital: Why, what and how? Meas. Bus. Excell. 2014, 8, 46–54. [Google Scholar] [CrossRef]
  28. Haube, J. HR Analytics: A Look Inside Walmart’s HR ‘Test and Learn’ Model. HR Daily. 2015. Available online: http://community.hrdaily.com.au/profiles/blogs/hr-analytics-a-look-insidewalmart-s-hr-test-learn-model (accessed on 21 August 2021).
  29. HCMI (Human Capital Management Institute). Imperial Services Sales Training ROI Case Study. 2016. Available online: http://www.hcminst.com/thought-leadership/workforce-analyticscase-studies/ (accessed on 21 July 2023).
  30. Smith, T. HR Analytics: The What, Why and How; CreateSpace Independent Publishing Platform: Scotts Valley, CA, USA, 2013. [Google Scholar]
  31. Fuller, R. The Paradox of Workplace Productivity. Harvard Business Review. 2016. Available online: https://hbr.org/2016/04/the-paradox-of-workplace-productivity (accessed on 21 July 2023).
  32. Hesketh, A. Case Study: Xerox; Chartered Institute of Personnel and Development: London, UK, 2014; Available online: http://www.valuingyourtalent.com/media/Case%20study%20-%20Xerox%20-%20PDF_tcm1044-5905.pdf (accessed on 21 July 2023).
  33. Liu, Z.; Zhang, H.; Rao, B.; Wang, L. A Reinforcement Learning Based Resource Management Approach for Time-critical Workloads in Distributed Computing Environment. In Proceedings of the IEEE International Conference on Big Data, Seattle, WA, USA, 10–13 December 2018; pp. 252–261. [Google Scholar] [CrossRef]
  34. Munaye, Y.Y.; Juang, R.-T.; Lin, H.-P.; Tarekegn, G.B.; Lin, D.-B. Deep Reinforcement Learning Based Resource Management in UAV-Assisted IoT Networks. Appl. Sci. 2021, 11, 2163. [Google Scholar] [CrossRef]
  35. Ding, Q.; Jahanshahi, H.; Wang, Y.; Bekiros, S.; Alassafi, M.O. Optimal Reinforcement Learning-Based Control Algorithm for a Class of Nonlinear Macroeconomic Systems. Mathematics 2022, 10, 499. [Google Scholar] [CrossRef]
  36. Pinheiro, G.G.; Defoin-Platel, M.; Regin, J.-C. Outsmarting Human Design in Airline Revenue Management. Algorithms 2022, 15, 142. [Google Scholar] [CrossRef]
  37. Qiu, H.; Mao, W.; Patke, A.; Wang, C.; Franke, H.; Kalbarczyk, Z.T.; Başar, T.; Iyer, R.K. Reinforcement learning for resource management in multi-tenant serverless platforms. In Proceedings of the EuroMLSys ’22: Proceedings of the 2nd European Workshop on Machine Learning and Systems, Rennes, France, 5–8 April 2022; pp. 20–28. [Google Scholar] [CrossRef]
  38. Li, Q.; Lin, T.; Yu, Q.; Du, H.; Li, J.; Fu, X. Review of Deep Reinforcement Learning and Its Application in Modern Renewable Power System Control. Energies 2023, 16, 4143. [Google Scholar] [CrossRef]
  39. Wang, R.; Chen, Z.; Xing, Q.; Zhang, Z.; Zhang, T. A Modified Rainbow-Based Deep Reinforcement Learning Method for Optimal Scheduling of Charging Station. Sustainability 2022, 14, 1884. [Google Scholar] [CrossRef]
  40. Abideen, A.Z.; Sundram, V.P.K.; Pyeman, J.; Othman, A.K.; Sorooshian, S. Digital Twin Integrated Reinforced Learning in Supply Chain and Logistics. Logistics 2021, 5, 84. [Google Scholar] [CrossRef]
  41. Yan, Y.; Chow, A.H.; Ho, C.P.; Kuo, Y.-H.; Wu, Q.; Ying, C. Reinforcement learning for logistics and supply chain management: Methodologies, state of the art, and future opportunities. Transp. Res. Part E Logist. Transp. Rev. 2022, 162, 102712. [Google Scholar] [CrossRef]
  42. Han, D.; Mulyana, B.; Stankovic, V.; Cheng, S. A Survey on Deep Reinforcement Learning Algorithms for Robotic Manipulation. Sensors 2023, 23, 3762. [Google Scholar] [CrossRef]
  43. Orr, J.; Dutta, A. Multi-Agent Deep Reinforcement Learning for Multi-Robot Applications: A Survey. Sensors 2023, 23, 3625. [Google Scholar] [CrossRef]
  44. Dutreilh, Х. Using reinforcement leaming for autonomic resource allocation in clouds: Towards а fully automated work-flow. In Proceedings of the ICAS 2011, The Seventh International Conference on Autonomic and Autonomous Systems, Venice, Italy, 22–27 May 2011; pp. 67–74. [Google Scholar]
  45. Littman, М.; Boyan, J. A Distributed reinforcement leaming scheme for network routing. In Proceedings of the International Workshop on Applications of Neural Networks to Telecommunications, Halkidiki, Greece, 13–16 September 2013; pp. 1–7. [Google Scholar]
  46. Das, A.; Shafik, R.A.; Merrett, G.V.; Al-Hashimi, B.M.; Kumar, A.; Veeravalli, B. Reinforcement Learning-Based Inter- and Intra-Application Thermal Optimization for Lifetime Improvement of Multicore Systems. In Proceedings of the DAC’14: Proceedings of the 51st Annual Design Automation Conference, San Francisco, CA, USA, 1–5 June 2014; pp. 1–6. [Google Scholar] [CrossRef]
  47. Rolnick, D.; Donti, P.L.; Kaack, L.H.; Kochanski, K.; Lacoste, A.; Sankaran, K.; Bengio, Y. Tackling climate change with machine leaming. arXiv 2019, arXiv:1906.05433. [Google Scholar]
  48. Chen, T.; Bu, S.; Liu, X.; Kang, J.; Yu, F.R.; Han, Z. Peer-to-Peer Energy Trading and Energy Conversion in Interconnected Multi-Energy Microgrids Using Multi-Agent Deep Reinforcement Learning. IEEE Trans. Smart Grid 2022, 13, 715–727. [Google Scholar] [CrossRef]
  49. Kumari, A.; Kakkar, R.; Gupta, R.; Agrawal, S.; Tanwar, S.; Alqahtani, F.; Tolba, A.; Raboaca, M.S.; Manea, D.L. Blockchain-Driven Real-Time Incentive Approach for Energy Management System. Mathematics 2023, 11, 928. [Google Scholar] [CrossRef]
  50. La, Р.; Bhatnagar, S. Reinforcement leaming with function approximation for traffic signal control. IEEE Trans. Intell. Transp. Syst. 2011, 12, 412–421. [Google Scholar] [CrossRef]
  51. Rezaee, К.; Abdulhai, В.; Abdelgawad, Н. Application of reinforcement leaming with continuous state space to ramp metering in real-world conditions. In Proceedings of the 2012 15th International IEEE Confeгence on Intelligent Transportation Systems, Anchorage, AK, USA, 16–19 September 2012; pp. 1590–1595. [Google Scholar]
  52. Mohammadi, М.; Al-Fuqaha, А.; Guizani, М.; Oh, J. Semisupervised deep reinforcement leaming in support of IoT and smart city services. IEEE Internet Things J. 2018, 5, 624–635. [Google Scholar] [CrossRef]
  53. Zhao, Y.; Kosorok, M.R.; Zeng, D. Reinforcement learning design for cancer clinical trials. Stat. Med. 2009, 28, 3294–3315. [Google Scholar] [CrossRef]
  54. Laber, E.B.; Lizotte, D.J.; Qian, M.; Pelham, W.E.; Murphy, S.A. Dynamic treatment regimes: Technical challenges and applications. Electron. J. Stat. 2014, 8, 1225–1272. [Google Scholar] [CrossRef]
  55. Yu, C.; Liu, J.; Nemati, S. Reinforcement Learning in Healthcare: A Survey. arXiv 2019, arXiv:1908.08796. [Google Scholar] [CrossRef]
  56. Chi, M.; VanLehn, K.; Litman, D.; Jordan, P. Empirically evaluating the application of reinforcement learning to the induction of effective and adaptive pedagogical strategies. User Model. User-Adapt. Interact. 2011, 21, 137–180. [Google Scholar] [CrossRef]
  57. Xiong, Z.; Liu, X.-Y.; Zhong, S.; Yang, H.; Walid, A. Practical deep reinforcement learning approach for stock trading. arXiv 2018, arXiv:1811.07522. [Google Scholar]
  58. Li, X.; Li, Y.; Zhan, Y.; Liu, X.-Y. Optimistic bull or pessimistic bear: Adaptive deep reinforcement learning for stock portfolio allocation. arXiv 2019, arXiv:1907.01503. [Google Scholar]
  59. Li, Y.; Ni, P.; Chang, V. An Empirical Research on the Investment Strategy of Stock Market based on Deep Reinforcement Learning model. In Proceedings of the 4th International Conference on Complexity, Future Information Systems and Risk, Crete, Greece, 2–4 May 2019; pp. 52–58. [Google Scholar] [CrossRef]
  60. Azhikodan, A.R.; Bhat, A.G.; Jadhav, M.V. Stock Trading Bot Using Deep Reinforcement Learning. In Innovations in Computer Science and Engineering; Springer: Berlin/Heidelberg, Germany, 2019; pp. 41–49. [Google Scholar]
  61. Moody, J.; Wu, L.; Liao, Y.; Saffell, M. Performance functions and reinforcement learning for trading systems and portfolios. J. Forecast. 1998, 17, 441–470. [Google Scholar] [CrossRef]
  62. Liang, Z.; Chen, H.; Zhu, J.; Jiang, K.; Li, Y. Adversarial deep reinforcement learning in portfolio management. arXiv 2018, arXiv:1808.09940. [Google Scholar]
  63. Jiang, Z.; Liang, J. Cryptocurrency portfolio management with deep reinforcement learning. In Proceedings of the 2017 Intelligent Systems Conference (IntelliSys), London, UK, 7–8 September 2017; pp. 905–913. [Google Scholar]
  64. Yu, P.; Lee, J.S.; Kulyatin, I.; Shi, Z.; Dasgupta, S. Model-based Deep Reinforcement Learning for Dynamic Portfolio Optimization. arXiv 2019, arXiv:1901.08740. [Google Scholar]
  65. Amirzadeh, R.; Nazari, A.; Thiruvady, D. Applying Artificial Intelligence in Cryptocurrency Markets: A Survey. Algorithms 2022, 15, 428. [Google Scholar] [CrossRef]
  66. Feng, L.; Tang, R.; Li, X.; Zhang, W.; Ye, Y.; Chen, H.; Guo, H.; Zhang, Y. Deep reinforcement learning based recommendation with explicit user-item interactions modeling. arXiv 2018, arXiv:1810.12027. [Google Scholar]
  67. Liu, J.; Zhang, Y.; Wang, X.; Deng, Y.; Wu, X. Dynamic Pricing on E-commerce Platform with Deep Reinforcement Learning. arXiv 2019, arXiv:1912.02572. [Google Scholar]
  68. Zheng, G.; Zhang, F.; Zheng, Z.; Xiang, Y.; Yuan, N.J.; Xie, X.; Li, Z. DRN: A deep reinforcement learning framework for news recommendation. In Proceedings of the 2018 Worldwide Web Conference, Lyon, France, 23–27 April 2018; pp. 167–176. [Google Scholar]
  69. Lake, B.M.; Ullman, T.D.; Tenenbaum, J.B.; Gershman, S.J. Building machines that learn and think like people. Behav. Brain Sci. 2017, 40, e253. [Google Scholar] [CrossRef]
  70. Gershman, S.J. Reinforcement learning and causal models. Oxf. Handb. Causal Reason. 2017, 1, 295. [Google Scholar]
  71. Liu, Y.; Dolan, R.J.; Kurth-Nelson, Z.; Behrens, T.E. Human Replay Spontaneously Reorganizes Experience. Cell 2019, 178, 640–652.e14. [Google Scholar] [CrossRef]
  72. Feliciano-Avelino, I.; Méndez-Molina, A.; Morales, E.F.; Sucar, L.E. Causal Based Action Selection Policy for Reinforcement Learning. In Advances in Computational Intelligence; MICAI 2021; Lecture Notes in Computer Science; Batyrshin, I., Gelbukh, A., Sidorov, G., Eds.; Springer: Cham, Switzerland, 2021; Volume 13067. [Google Scholar] [CrossRef]
  73. Bornstein, A.M.; Khaw, M.W.; Shohamy, D.; Daw, N.D. Reminders of past choices bias decisions for reward in humans. Nat. Commun. 2017, 8, 15958. [Google Scholar] [CrossRef]
  74. Orlova, E.V. Innovation in Company Labor Productivity Management: Data Science Methods Application. Appl. Syst. Innov. 2021, 4, 68. [Google Scholar] [CrossRef]
  75. Orlova, E.V. Assessment of the Human Capital of an Enterprise and its Management in the Context of the Digital Transformation of the Economy. J. Appl. Econ. Res. 2021, 20, 666–700. [Google Scholar] [CrossRef]
  76. Orlova, E.V. Inference of Factors for Labor Productivity Growth Used Randomized Experiment and Statistical Causality. Mathematics 2023, 11, 863. [Google Scholar] [CrossRef]
  77. Orlova, E.V. Methodology and Statistical Modeling of Social Capital Influence on Employees’ Individual Innovativeness in a Company. Mathematics 2022, 10, 1809. [Google Scholar] [CrossRef]
  78. Orlova, E.V. Technique for Data Analysis and Modeling in Economics, Finance and Business Using Machine Learning Methods. In Proceedings of the IEEE 4th International Conference on Control Systems, Mathematical Modeling, Automation and Energy Efficiency (SUMMA), Lipetsk, Russia, 9–11 November 2022; pp. 369–374. [Google Scholar] [CrossRef]
  79. Orlova, E.V. Data Science Methods for Modeling and Decision Support in Companies’ Labor Productivity Management. In Proceedings of the IEEE Proceedings of 3rd International Conference on Control Systems, Mathematical Modeling, Automation and Energy Efficiency (SUMMA), Lipetsk, Russia, 10–12 November 2021; pp. 202–207. [Google Scholar] [CrossRef]
  80. Markov, A.A. The Theory of Algorithms. J. Symb. Log. 1953, 18, 340–341. [Google Scholar]
  81. Bellman, R. A Markovian decision process. J. Math. Mech. 1957, 6, 679–684. [Google Scholar] [CrossRef]
Figure 1. Conceptual diagram of the methodology of DRCH (developed by the author).
Mathematics 11 03916 g001
Figure 2. Graph of the transitions from state s to state s when implementing action a (developed by the author).
Mathematics 11 03916 g002
Figure 3. Architecture of the designed RL system in the DRCH (developed by the author).
Mathematics 11 03916 g003
Figure 4. Presentation of the problem in the 5 × 5 grid (developed by the author).
Mathematics 11 03916 g004
Figure 5. The results of agent learning for four different employees corresponding to four experiments with a discount coefficient γ = 0.99 and the probability of random action ε = 0.04 : (a) experiment 1—the agent’s learning process based on the DDQN algorithm; (b) experiment 2—the agent learning process based on the DDQN algorithm.
Mathematics 11 03916 g005
Figure 6. The results of agent learning for four different employees corresponding to four experiments with a discount coefficient γ = 0.99 and the probability of random action ε = 0.04 : (a) experiment 3—agent learning process based on the DDQN algorithm; (b) experiment 4—agent learning process based on the SARSA algorithm (developed by the author).
Mathematics 11 03916 g006
Figure 7. The results of agent learning based on the PRO algorithm with a discount factor γ = 0.99 and the probability of a random action ε = 0.04 (developed by the author).
Mathematics 11 03916 g007
Figure 8. Optimal policies for the four experiments (employees): (a) experiment 1, initial state (1,1), target state (3,5), transition from state (4,3) to state (3,4) is possible; (b) experiment 2, initial state (2,1), target state (4,4), transition from (1,3) to (2,4) is possible; (c) experiment 3, initial state (3,2), target state (5,5), transition from (5,3) to (5,5) is possible; (d) experiment 4, initial state (2,2), target state (4,5), transition from (5,3) to (5,5) is possible, transition from (2,5) to (4,5) is possible (developed by the author).
Mathematics 11 03916 g008
Table 1. Corporate HC related studies in terms of its management (first published by the author in [13]).
Subject of Study and HighlightsMethods of StudyReferences
Propose human-centered architecture and a human-centered architectural model. HC is based on competencies, human life cycle, and scenarios of the external environmentInformation system development[14,15]
Examines the features of corporate HC and its management using generations theoryExpert measures[16]
Shows that factors of the company’s HC are not independent, but often have a close correlation. Points out on the complexity of building specific mechanisms for career managementCorrelation analysis[3,4,5,6,7,8]
Propose subjective self-ratings of employees as to their individual HC and its conversion to objective measurementsExpert measures[17]
Development of a HC strategy of a company. Description of the relationship between corporate social responsibility and strategic HRM.
Focuses on social capital, economic performance, and society wealth
Strategic analysis[10,18,19,20,21]
Measurement of the effectiveness of leadership development programs. HR analysis as a driver and a measuring tool to support organizational changeHC metrics
(indices analysis)
[22,23]
Using times series to build up data about HC and its comparison over timeTimes series analysis[24]
Cause–effect relationships between HR processes and product shrink Structural equations modeling[25]
HC-related measurements within the company’s intellectual capital relating to the company strategy: product development, improvement of personal skills, creating knowledge and competences within current and future technologiesHC metrics
(indexes analysis)
[26]
Explore HR quantitative and qualitative data across the organization and its analysis as “capability metrics” to the business unit leader HC metrics[27]
Model for support decision making. Analysis of the relations of the HC data and its impact on managerial effectiveness and engagement. Using HC measures for the diagnosis of business problems and sales effectivenessDescriptive measures[28,29,30,31]
Corporate performance dashboard with greater emphasis on HR data in decision makingInformation system development/use/support[32]
Table 2. Analysis of the problems in the field of economics, finance, and business solved by RL.
ProblemAlgorithmReferences
Stock trading
Development of a decision-making strategy
DDPG (deep deterministic policy gradient)
Adaptive DDPG
DQN (deep Q-networks)
RCNN (recurrent convolutional neural networks)
[57,58,59,60]
Portfolio management
Algorithmic trading
Portfolio optimization
DDPG
Model-free CNN
Model-based CNN
[61,62,63,64,65,66]
Online services and retail
Development of recommender systems
Development of dynamic pricing algorithms
(in real-time)
Actor-critic method
SS-RTB (sponsored search real-time bidding)
DDPG
DQN
[66,67,68]
Table 3. Average reward obtained for each of the 200 simulation episodes averaged over 50 trials.
AlgorithmPolicy Effectiveness-Average RewardLearning Efficiency-Convergence Rate (Number of Episodes)
DQN−0.150.27 (53)
DDQN0.20.29 (58)
SARSA−3.10.59 (117)
PRO−52-
Disclaimer/Publisher’s Note: The statements, opinions and data contained in all publications are solely those of the individual author(s) and contributor(s) and not of MDPI and/or the editor(s). MDPI and/or the editor(s) disclaim responsibility for any injury to people or property resulting from any ideas, methods, instructions or products referred to in the content.

