


Analytical Solution for Bearing Capacity of Reinforced Strip Footings on Unsaturated Soils under Steady Flow
Abstract
:1. Introduction
2. Theoretical Framework
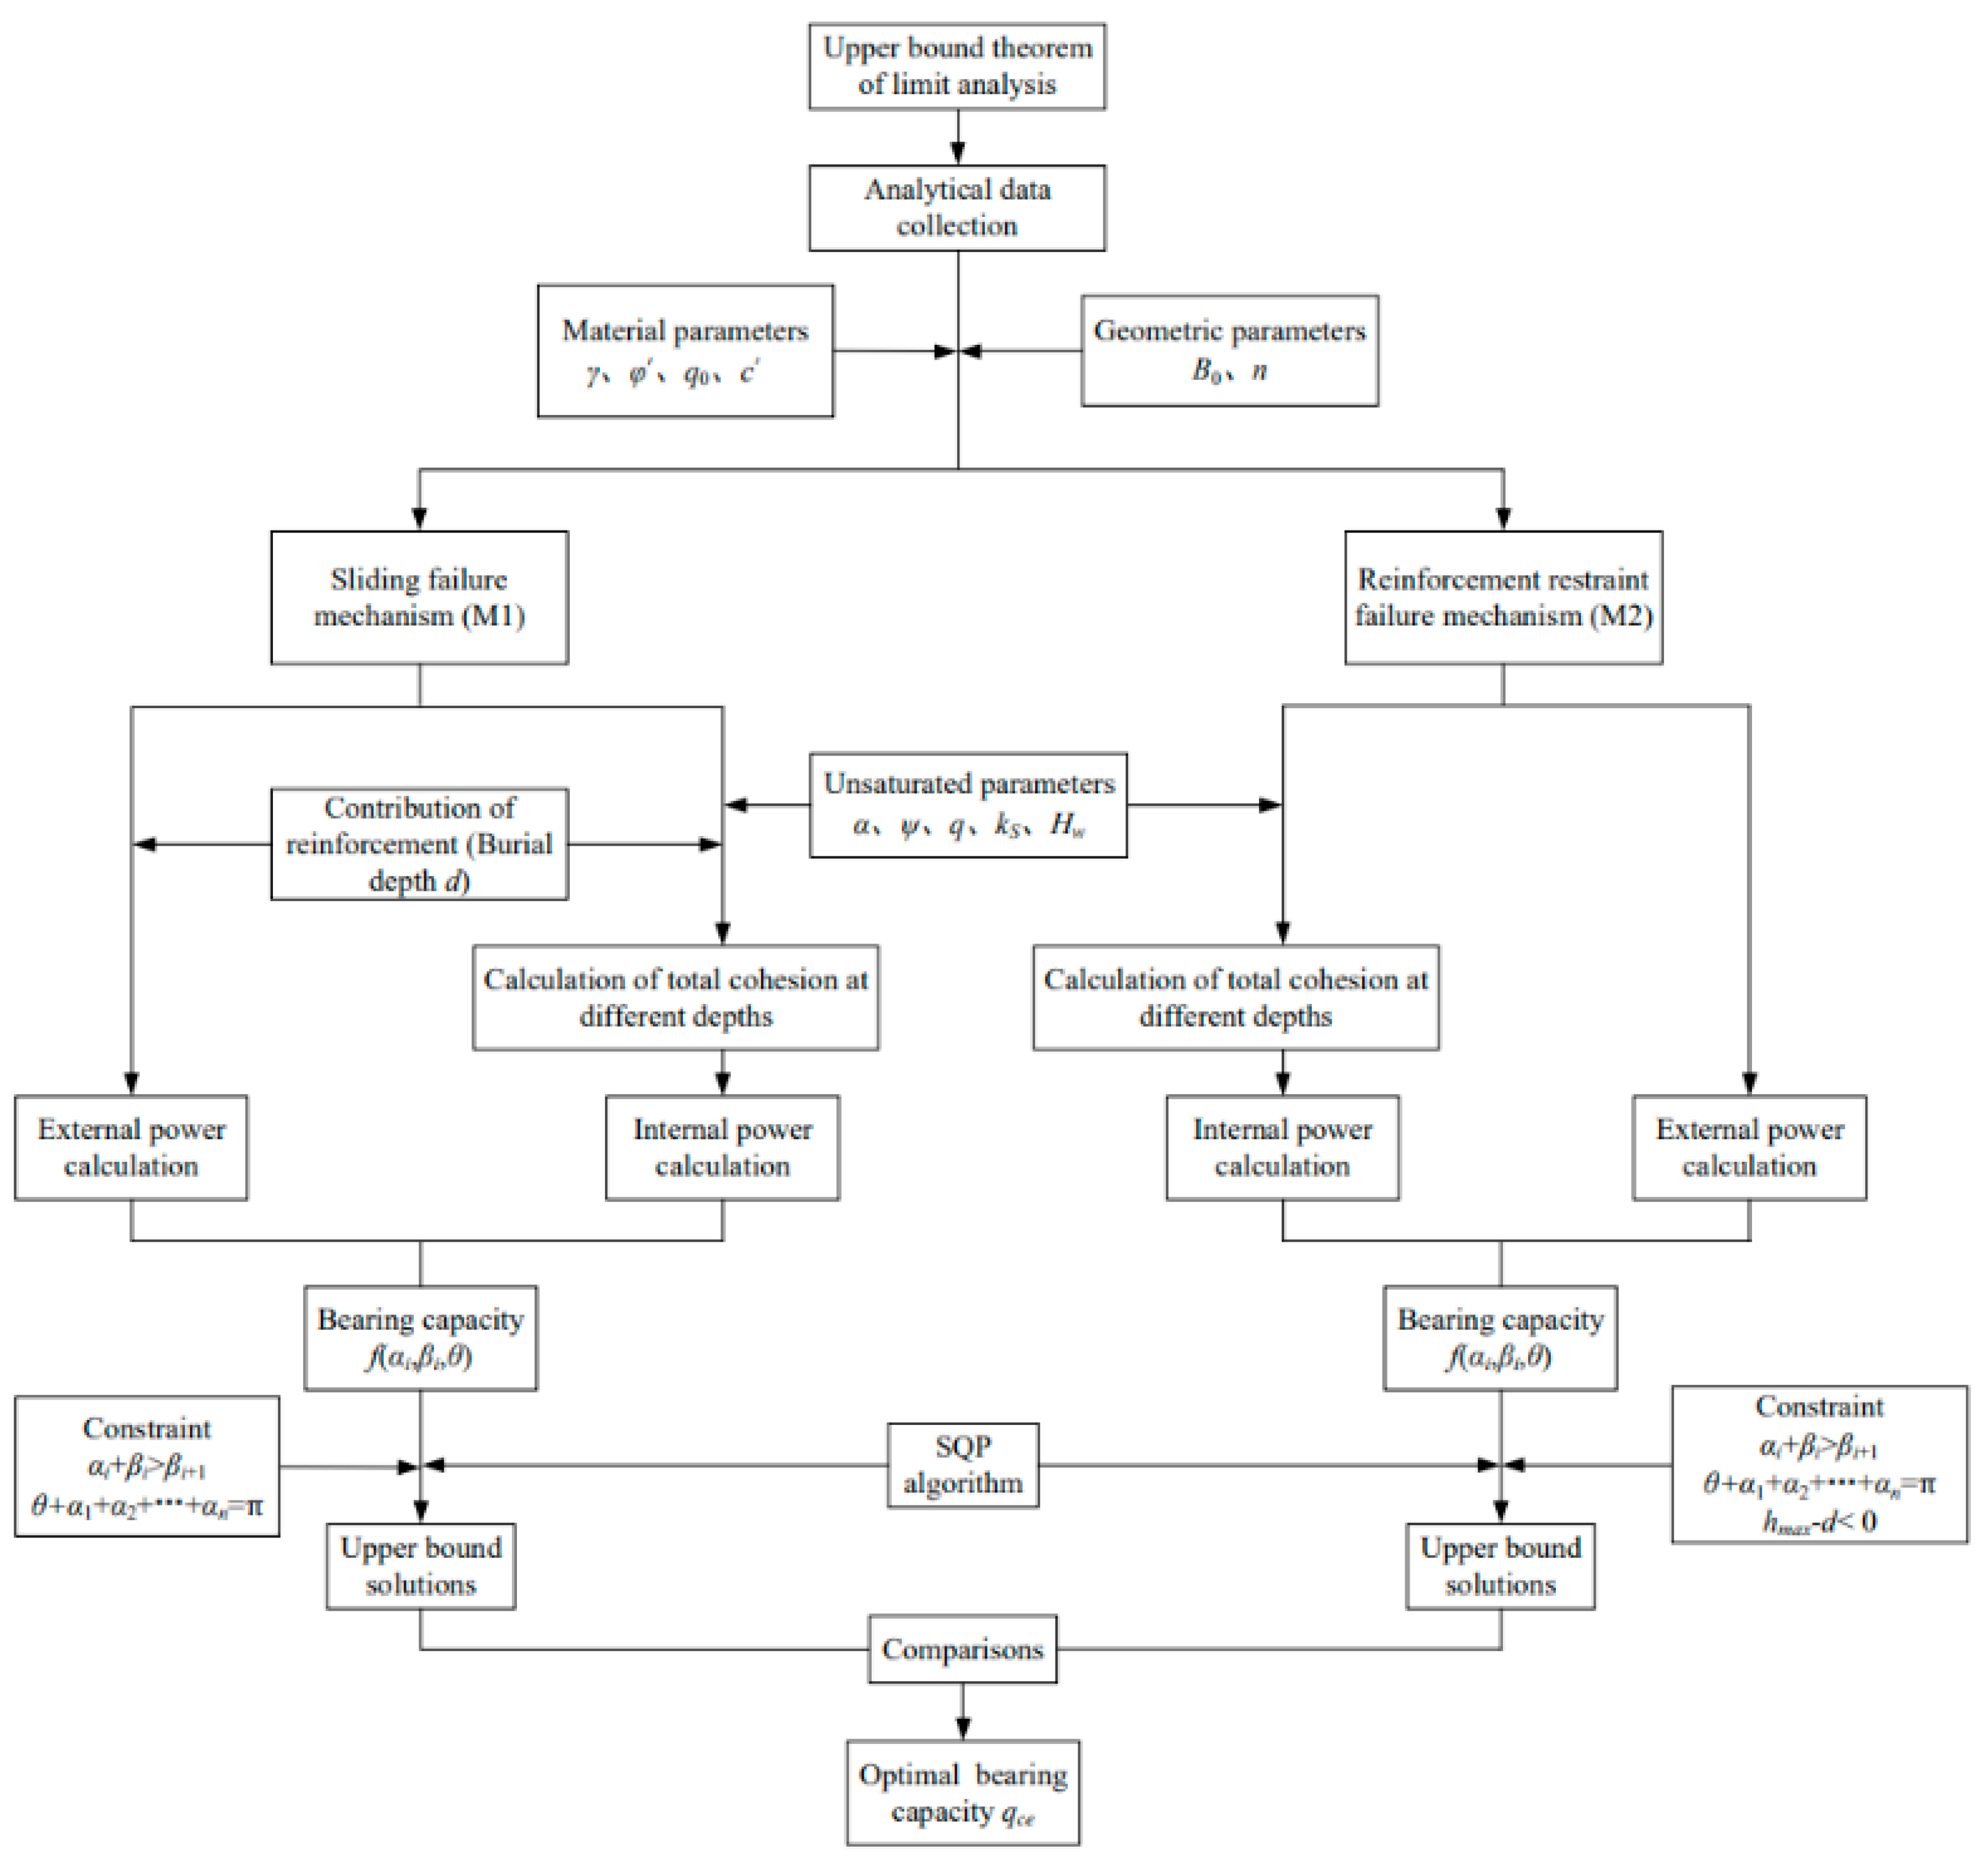
2.1. Upper Bound Theorem of Limit Analysis
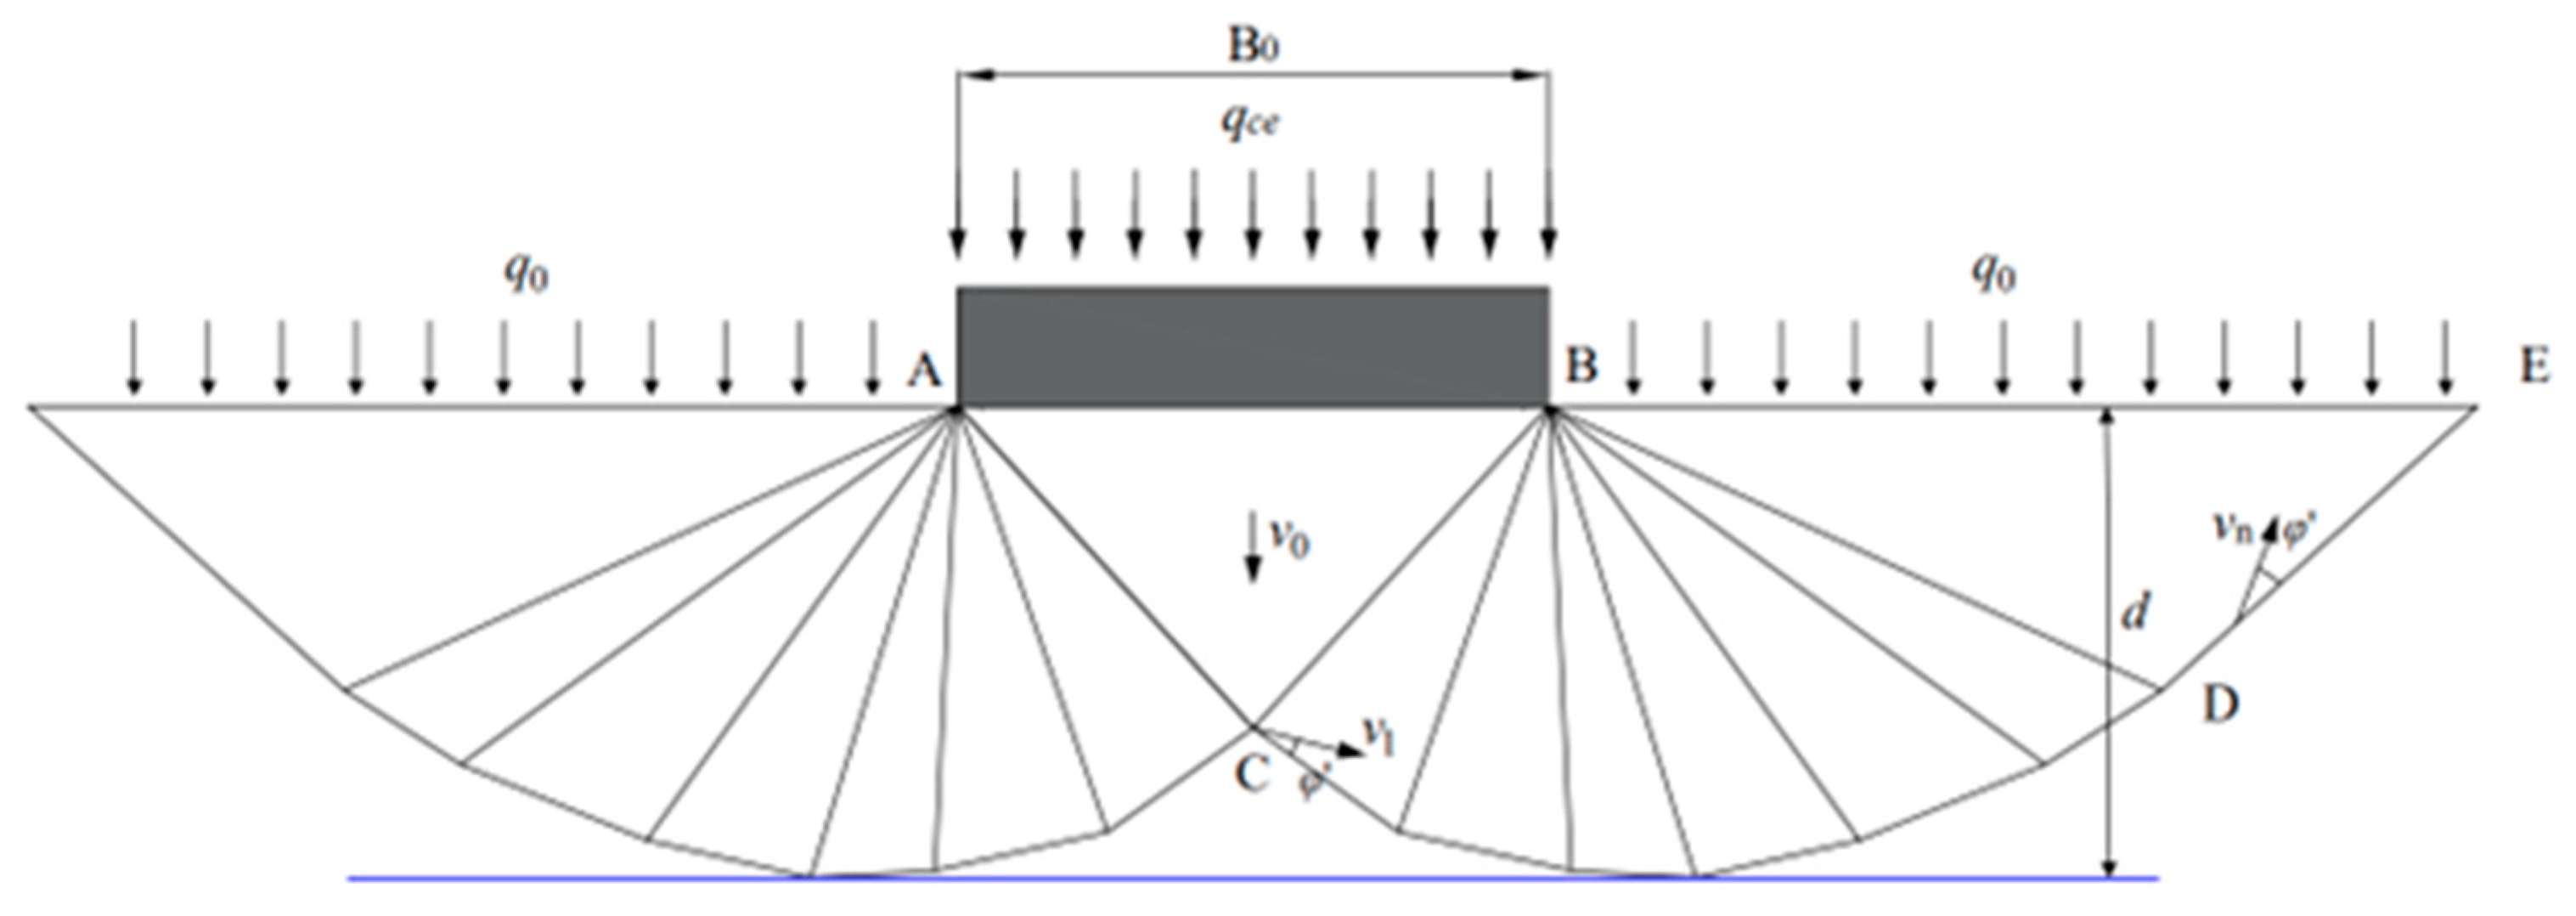
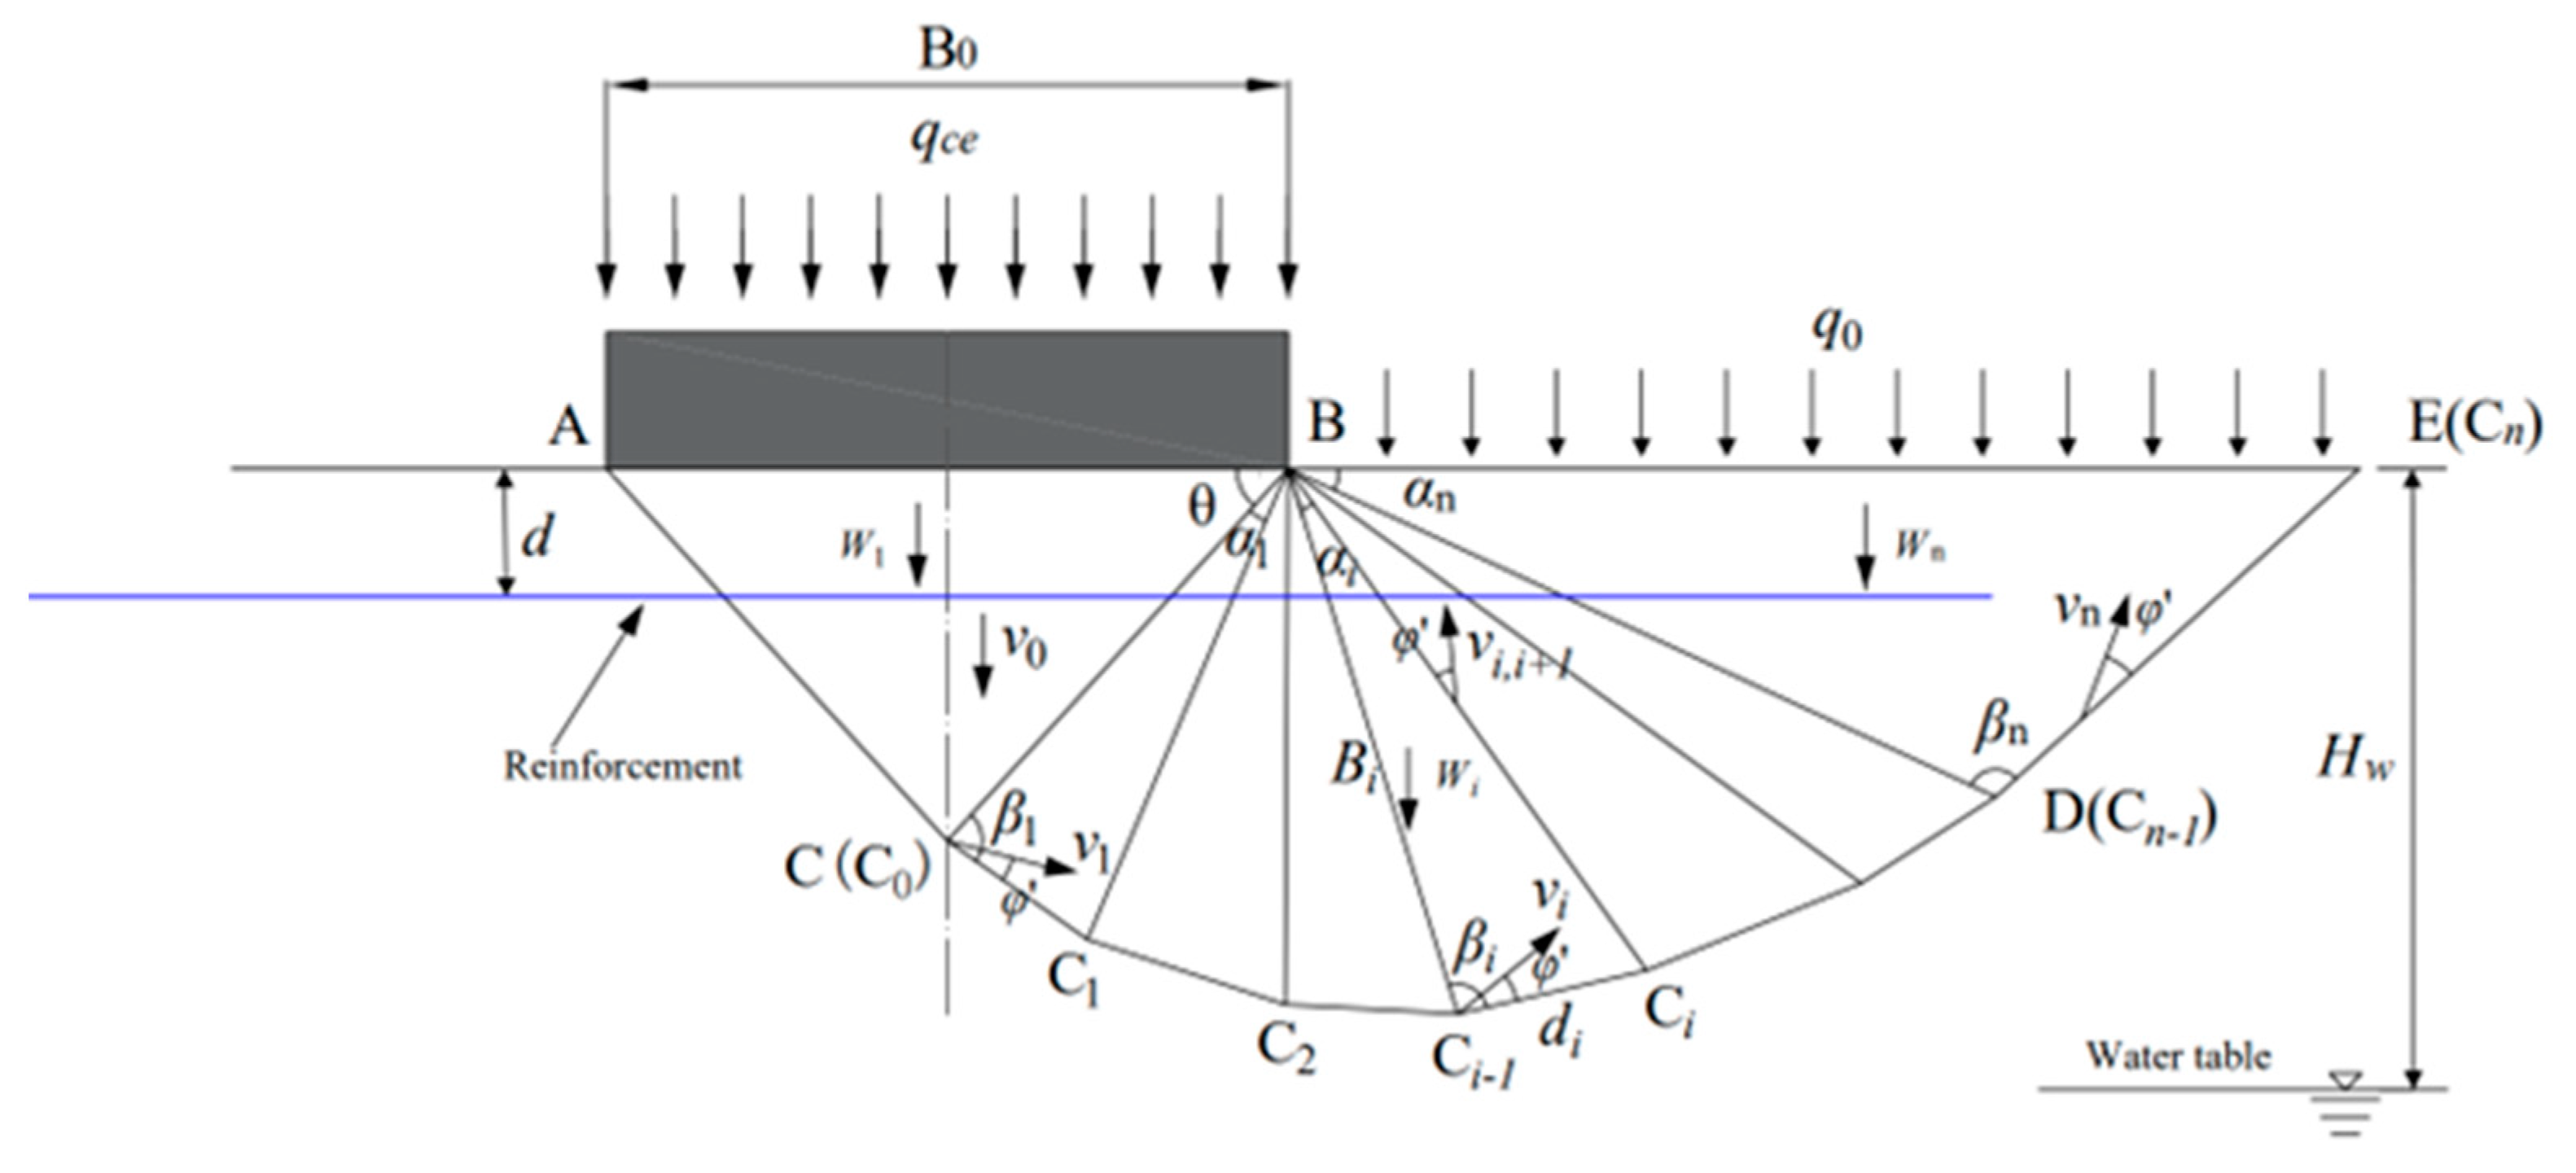
2.2. Slide Failure Mode
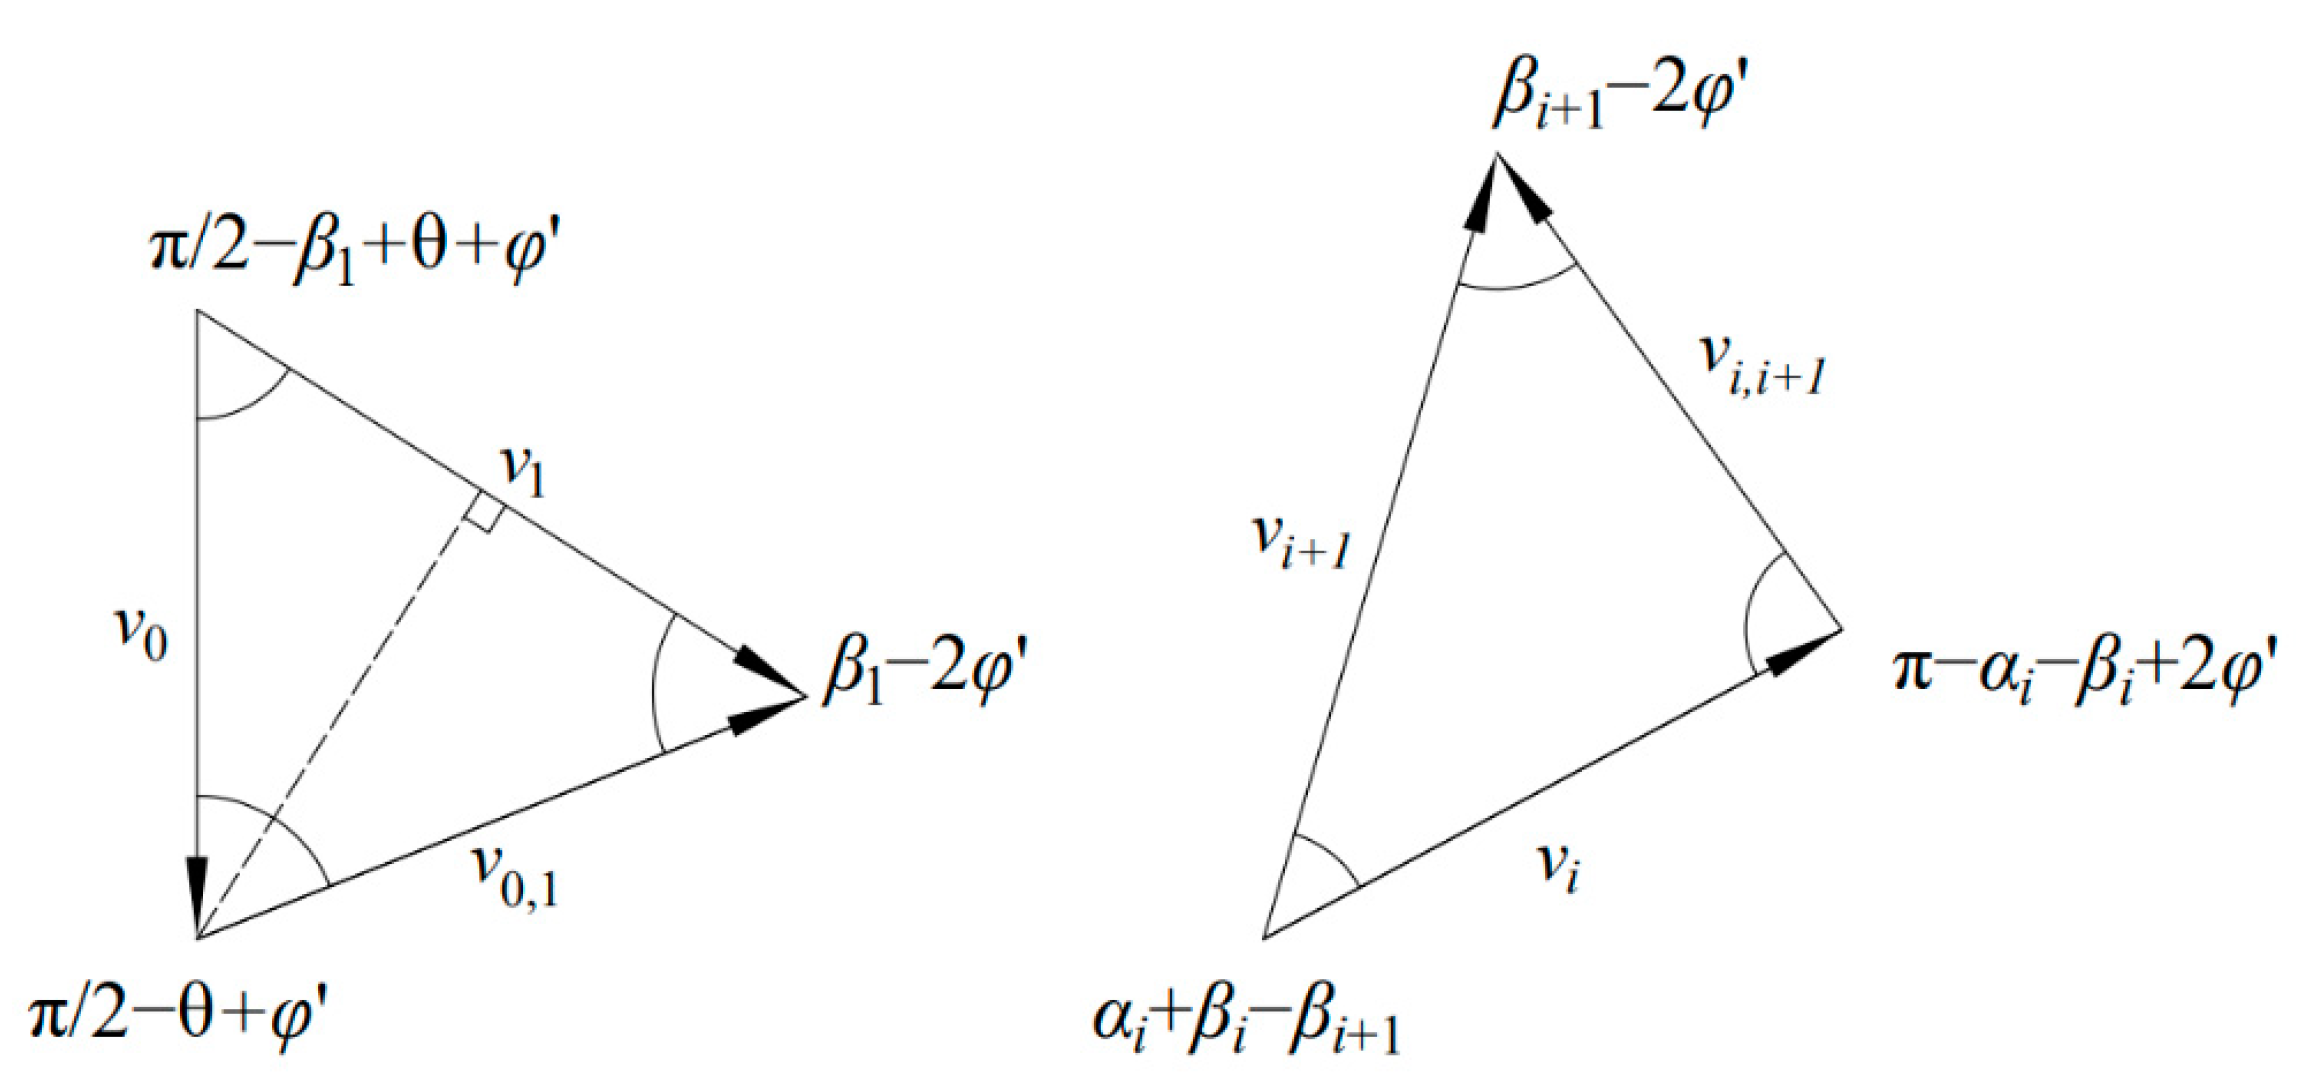
2.2.1. Symmetric Multi-Block Failure Mechanism
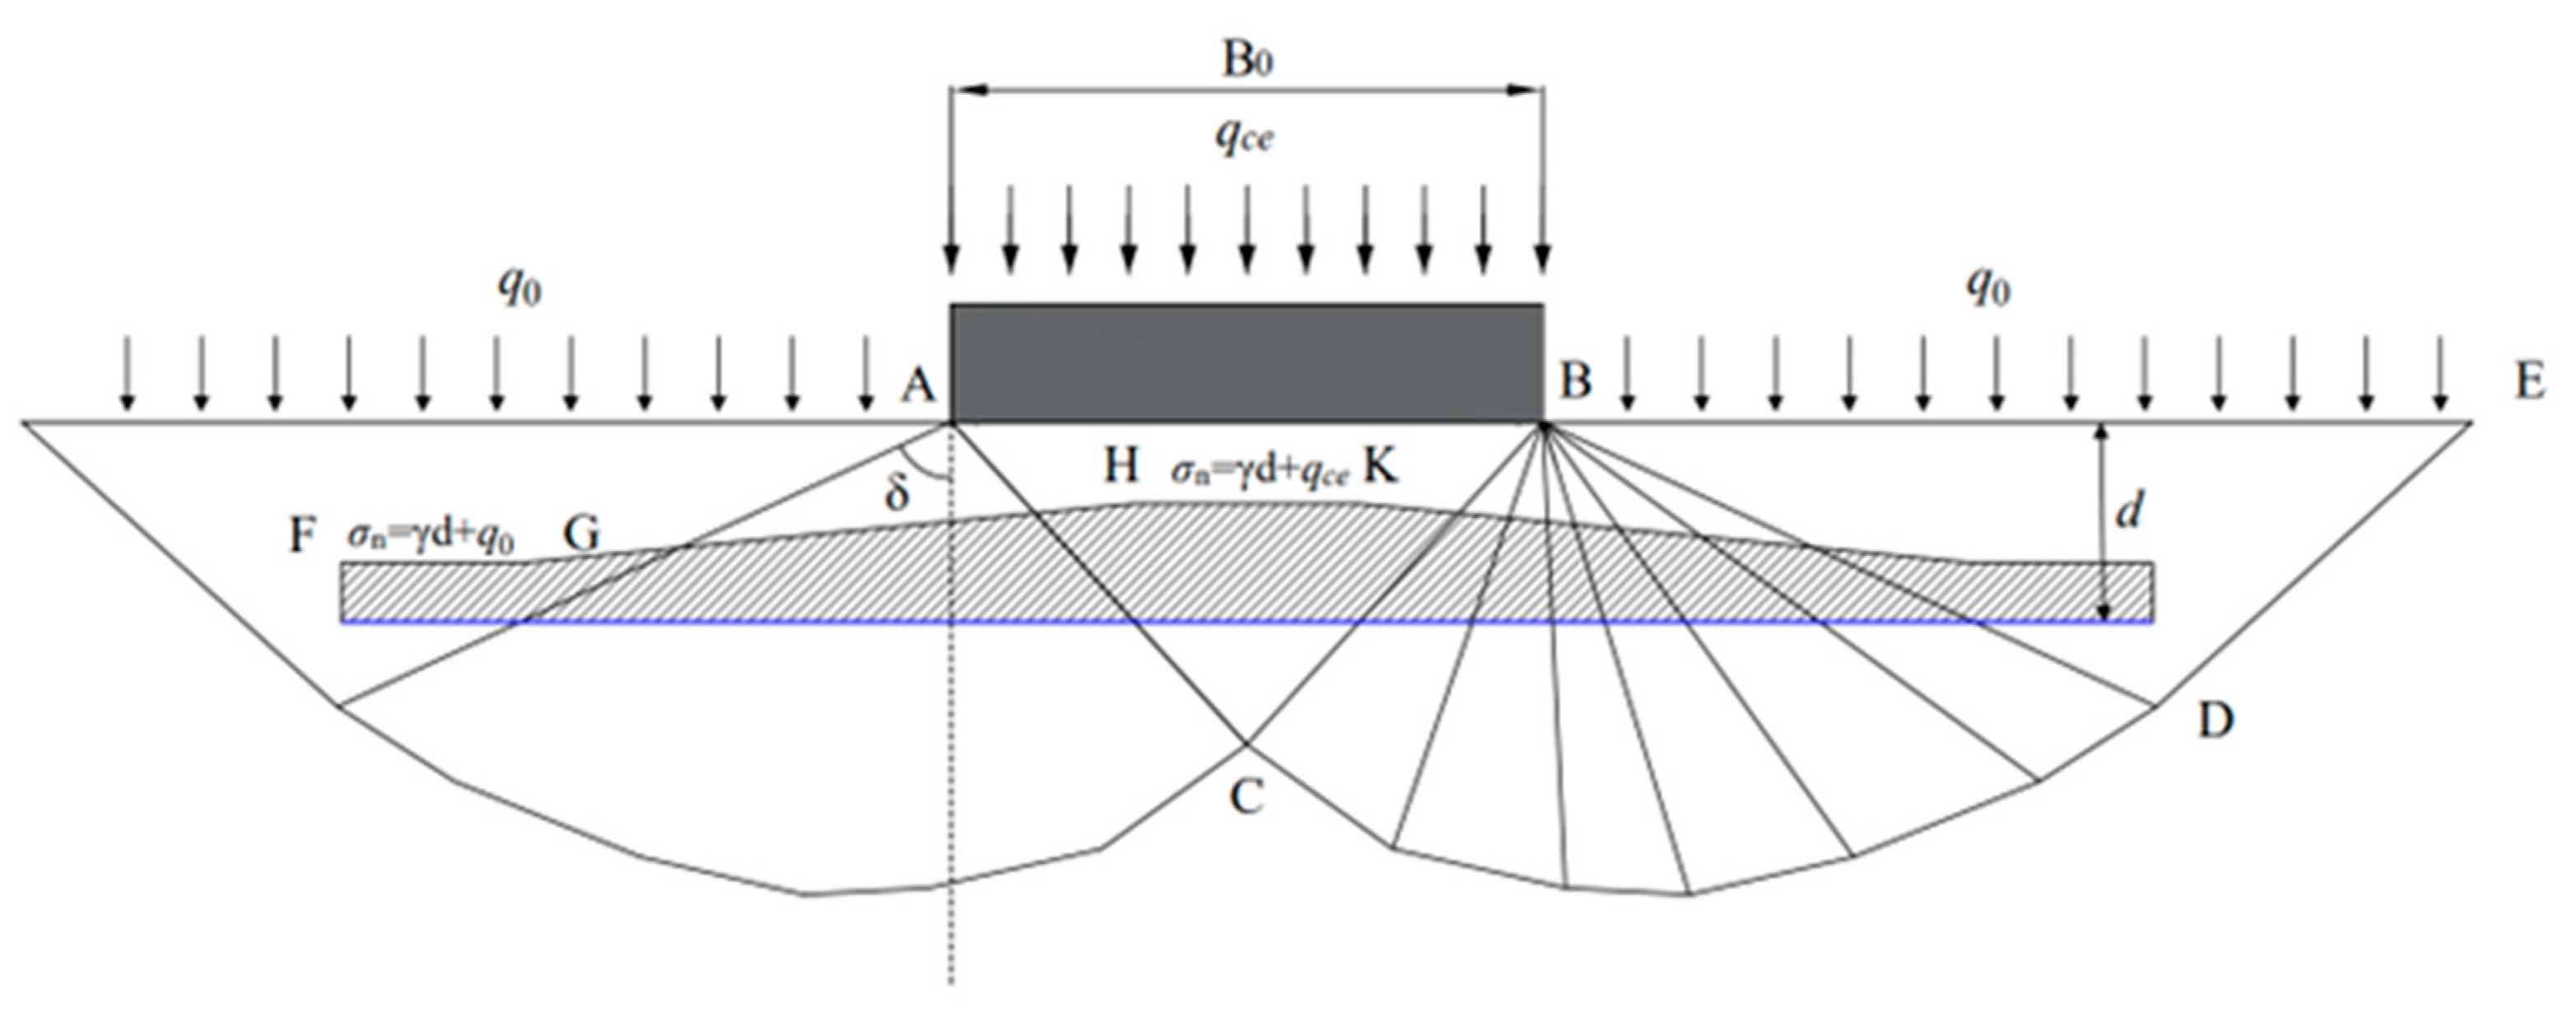
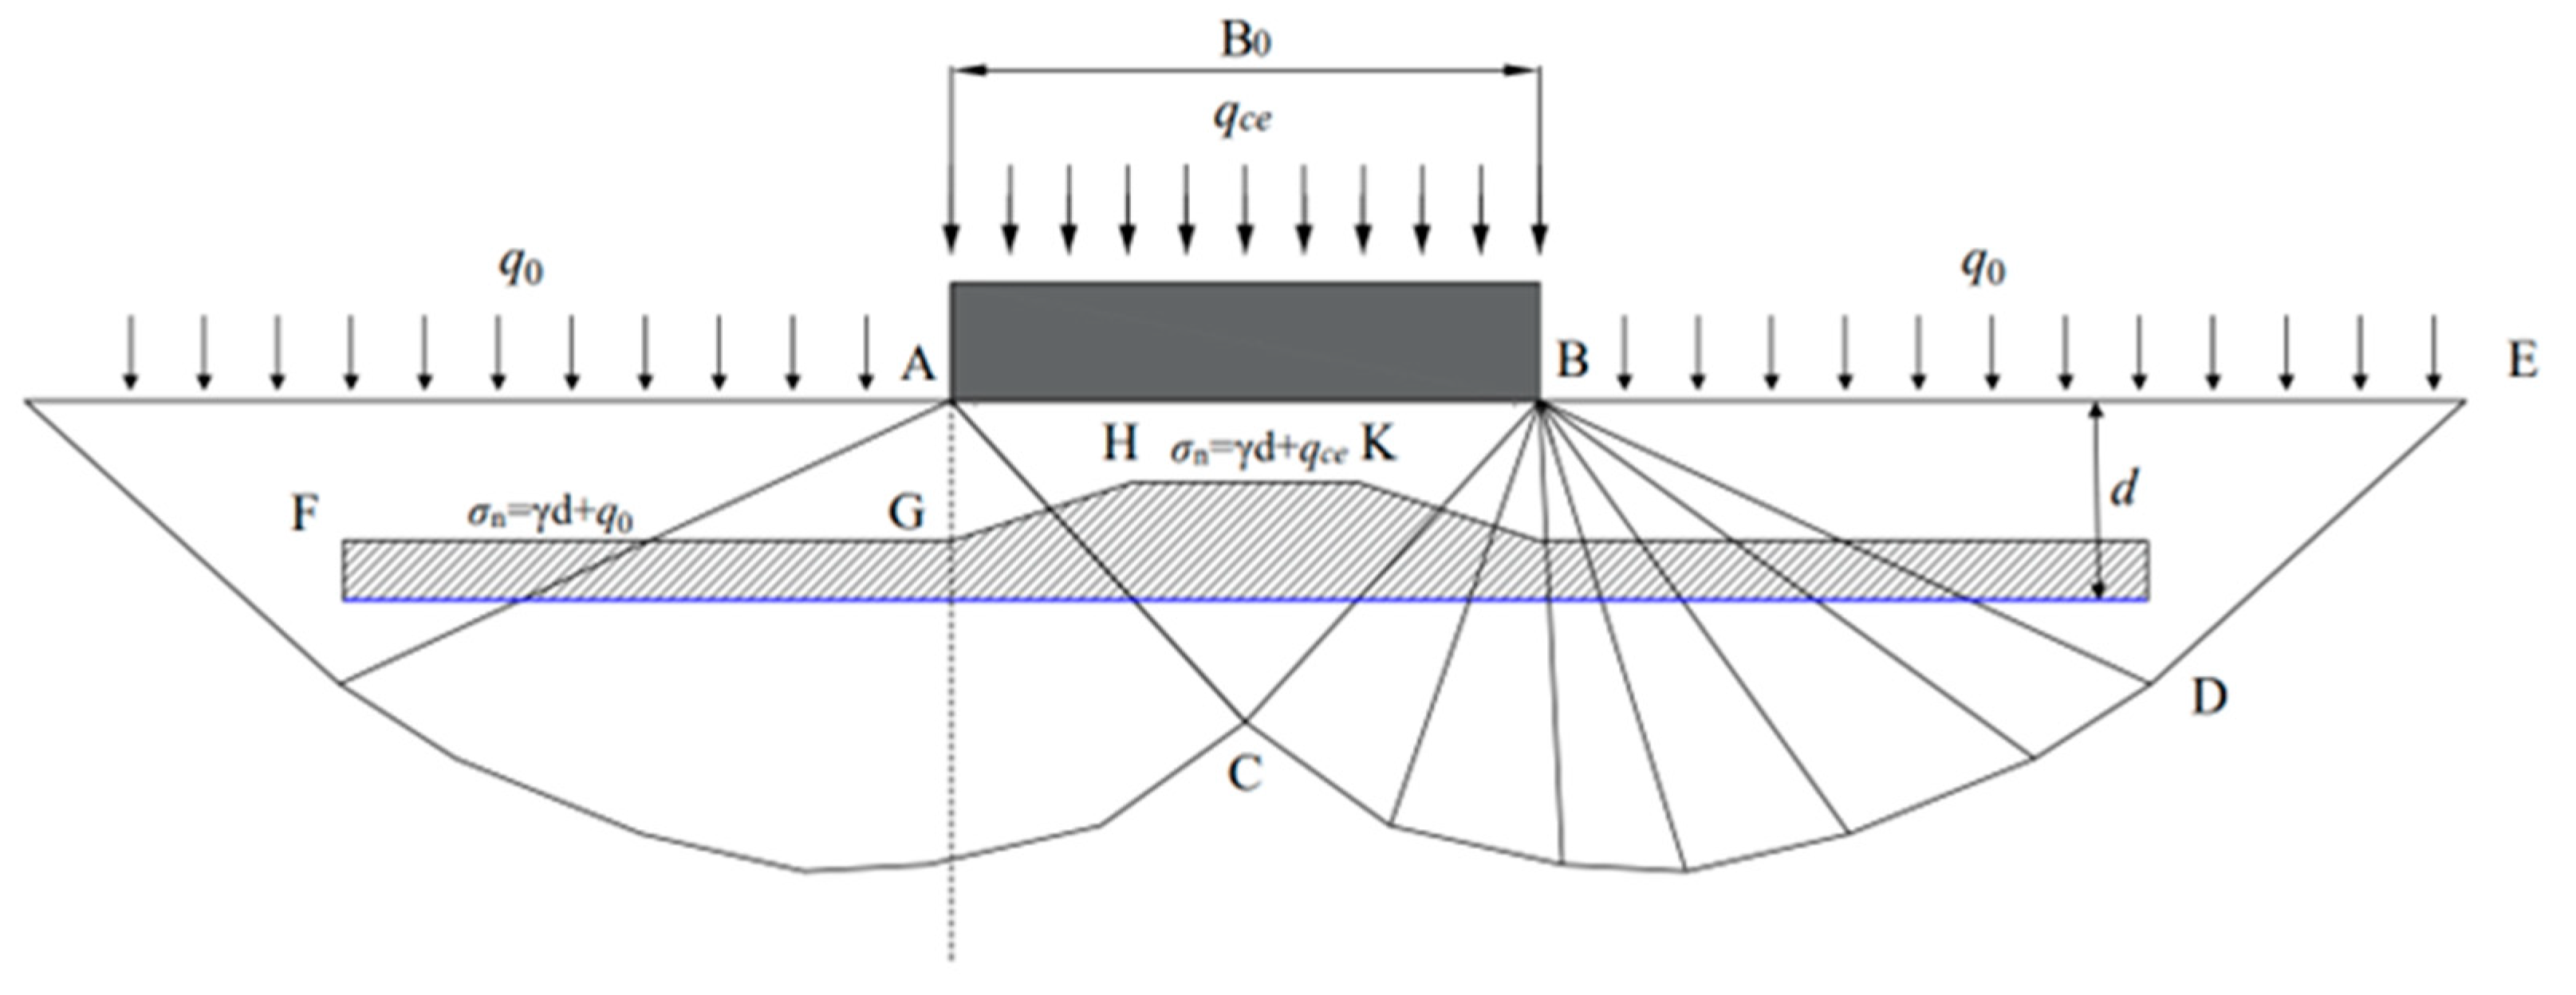
2.2.2. Work Dissipation Rate of the Reinforcement
2.3. Properties of Unsaturated Soils
3. Materials and Methods
3.1. Selection of Materials
3.2. The Upper Bound Method
3.2.1. Calculation of Internal Power
3.2.2. Calculation of External Power
3.2.3. Formula of Bearing Capacity
4. Validation of Results
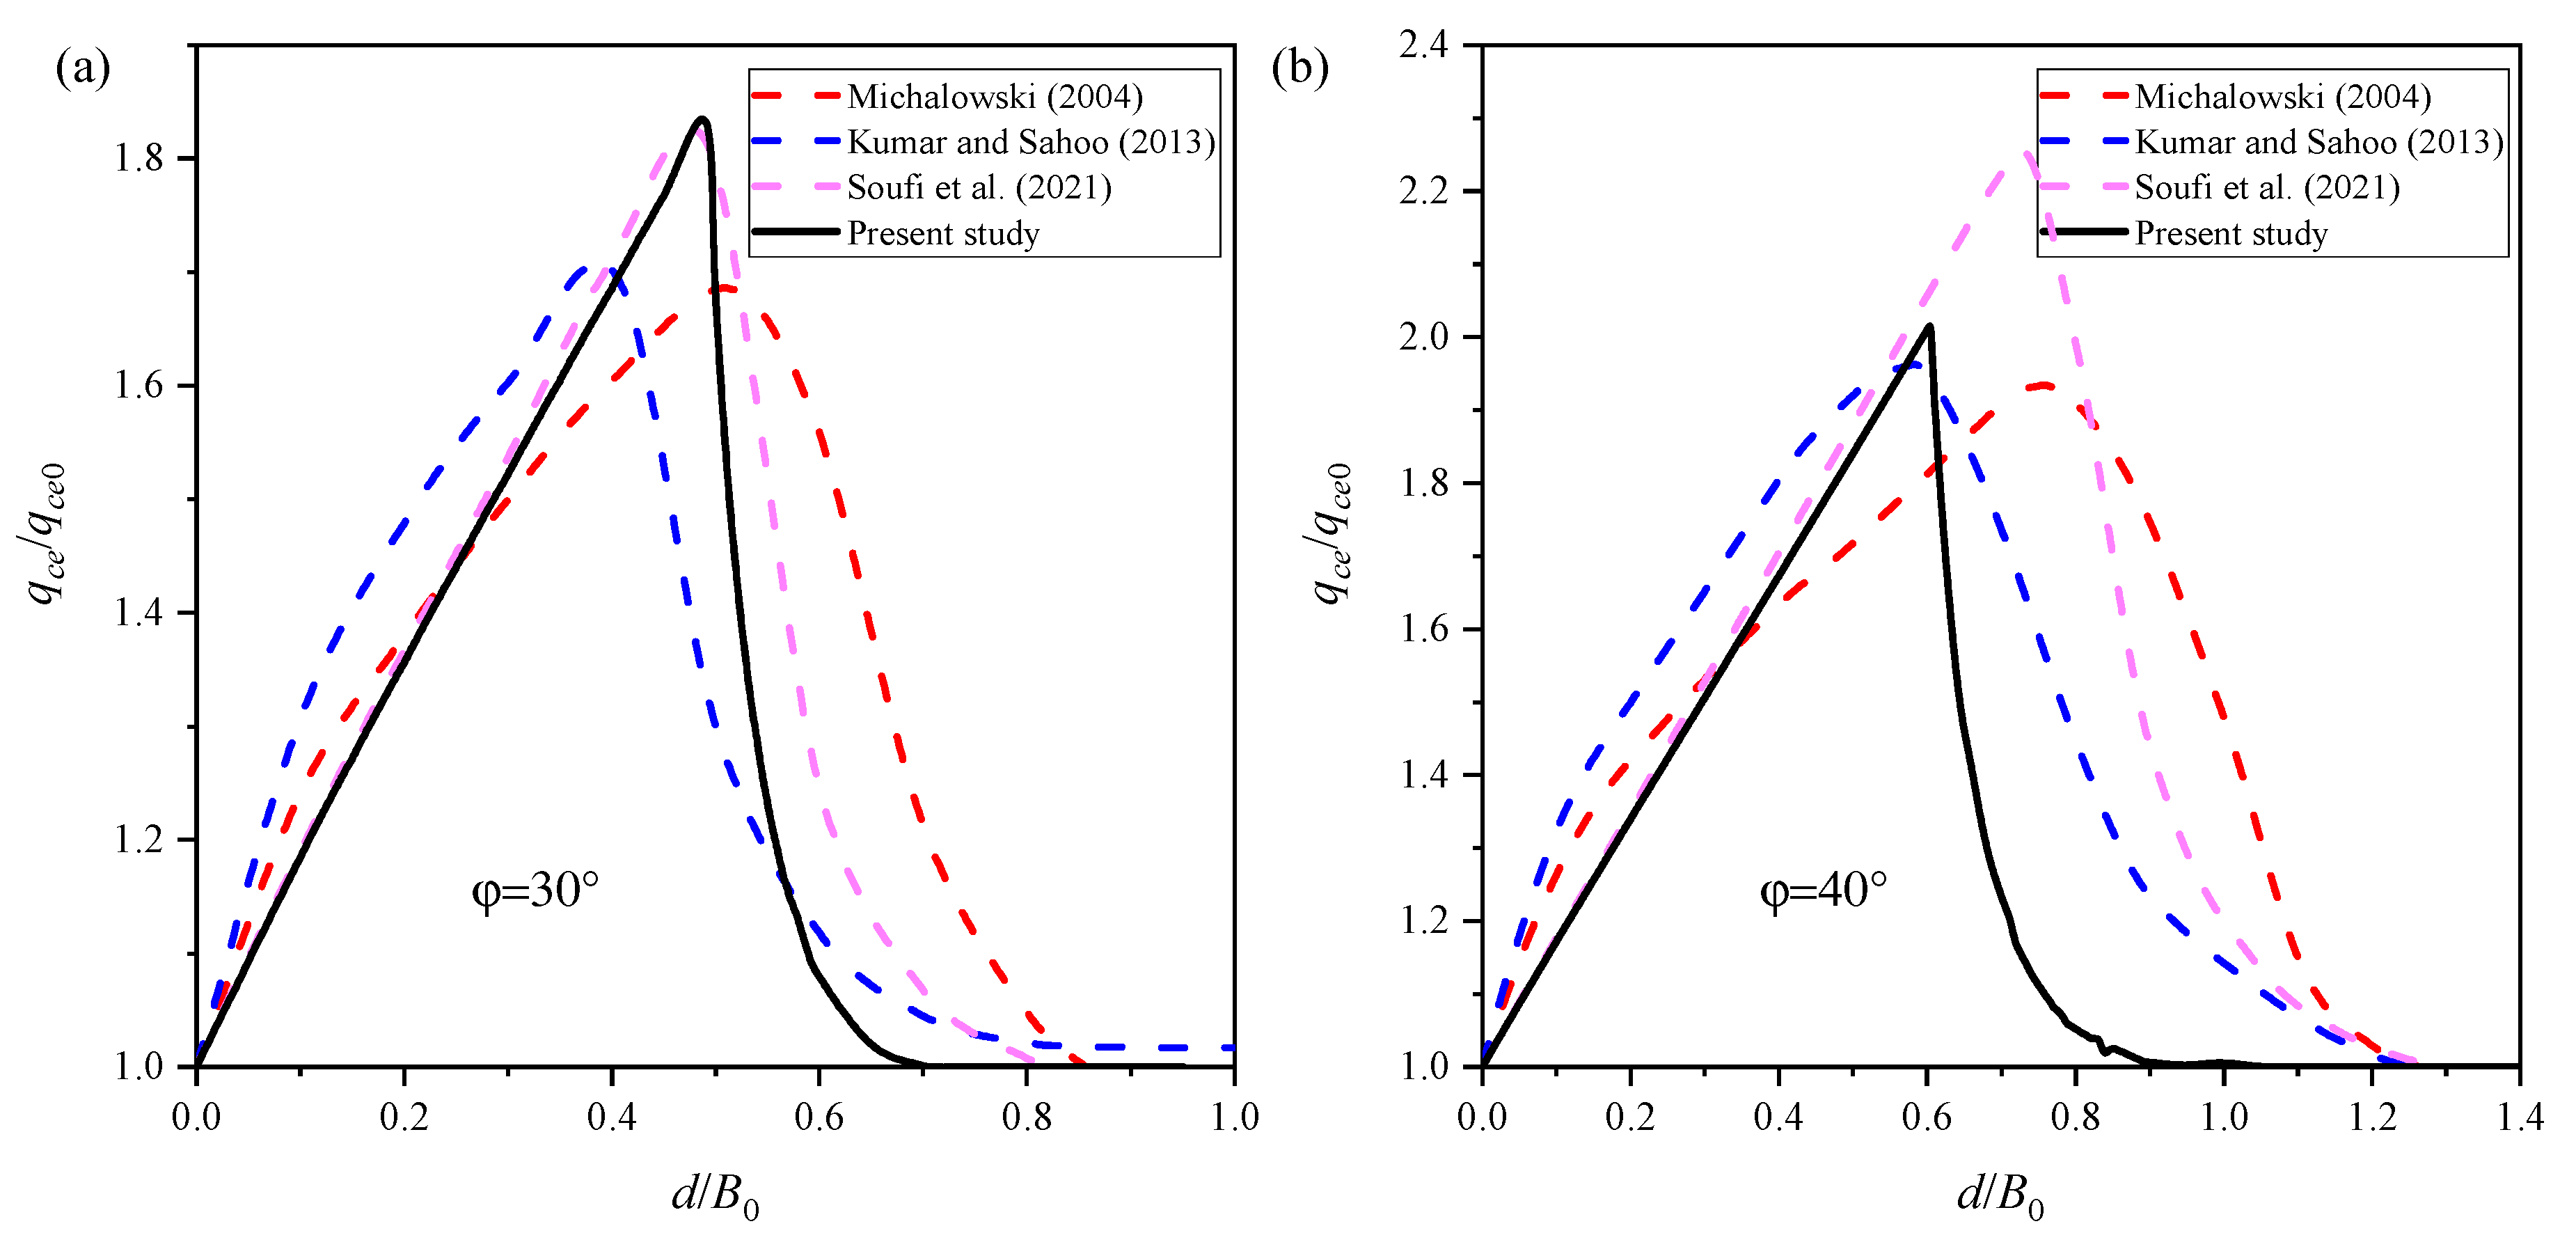
4.1. Comparison for Dry Soils without Reinforcement
4.2. Comparison for Dry Soils Considering Reinforcement
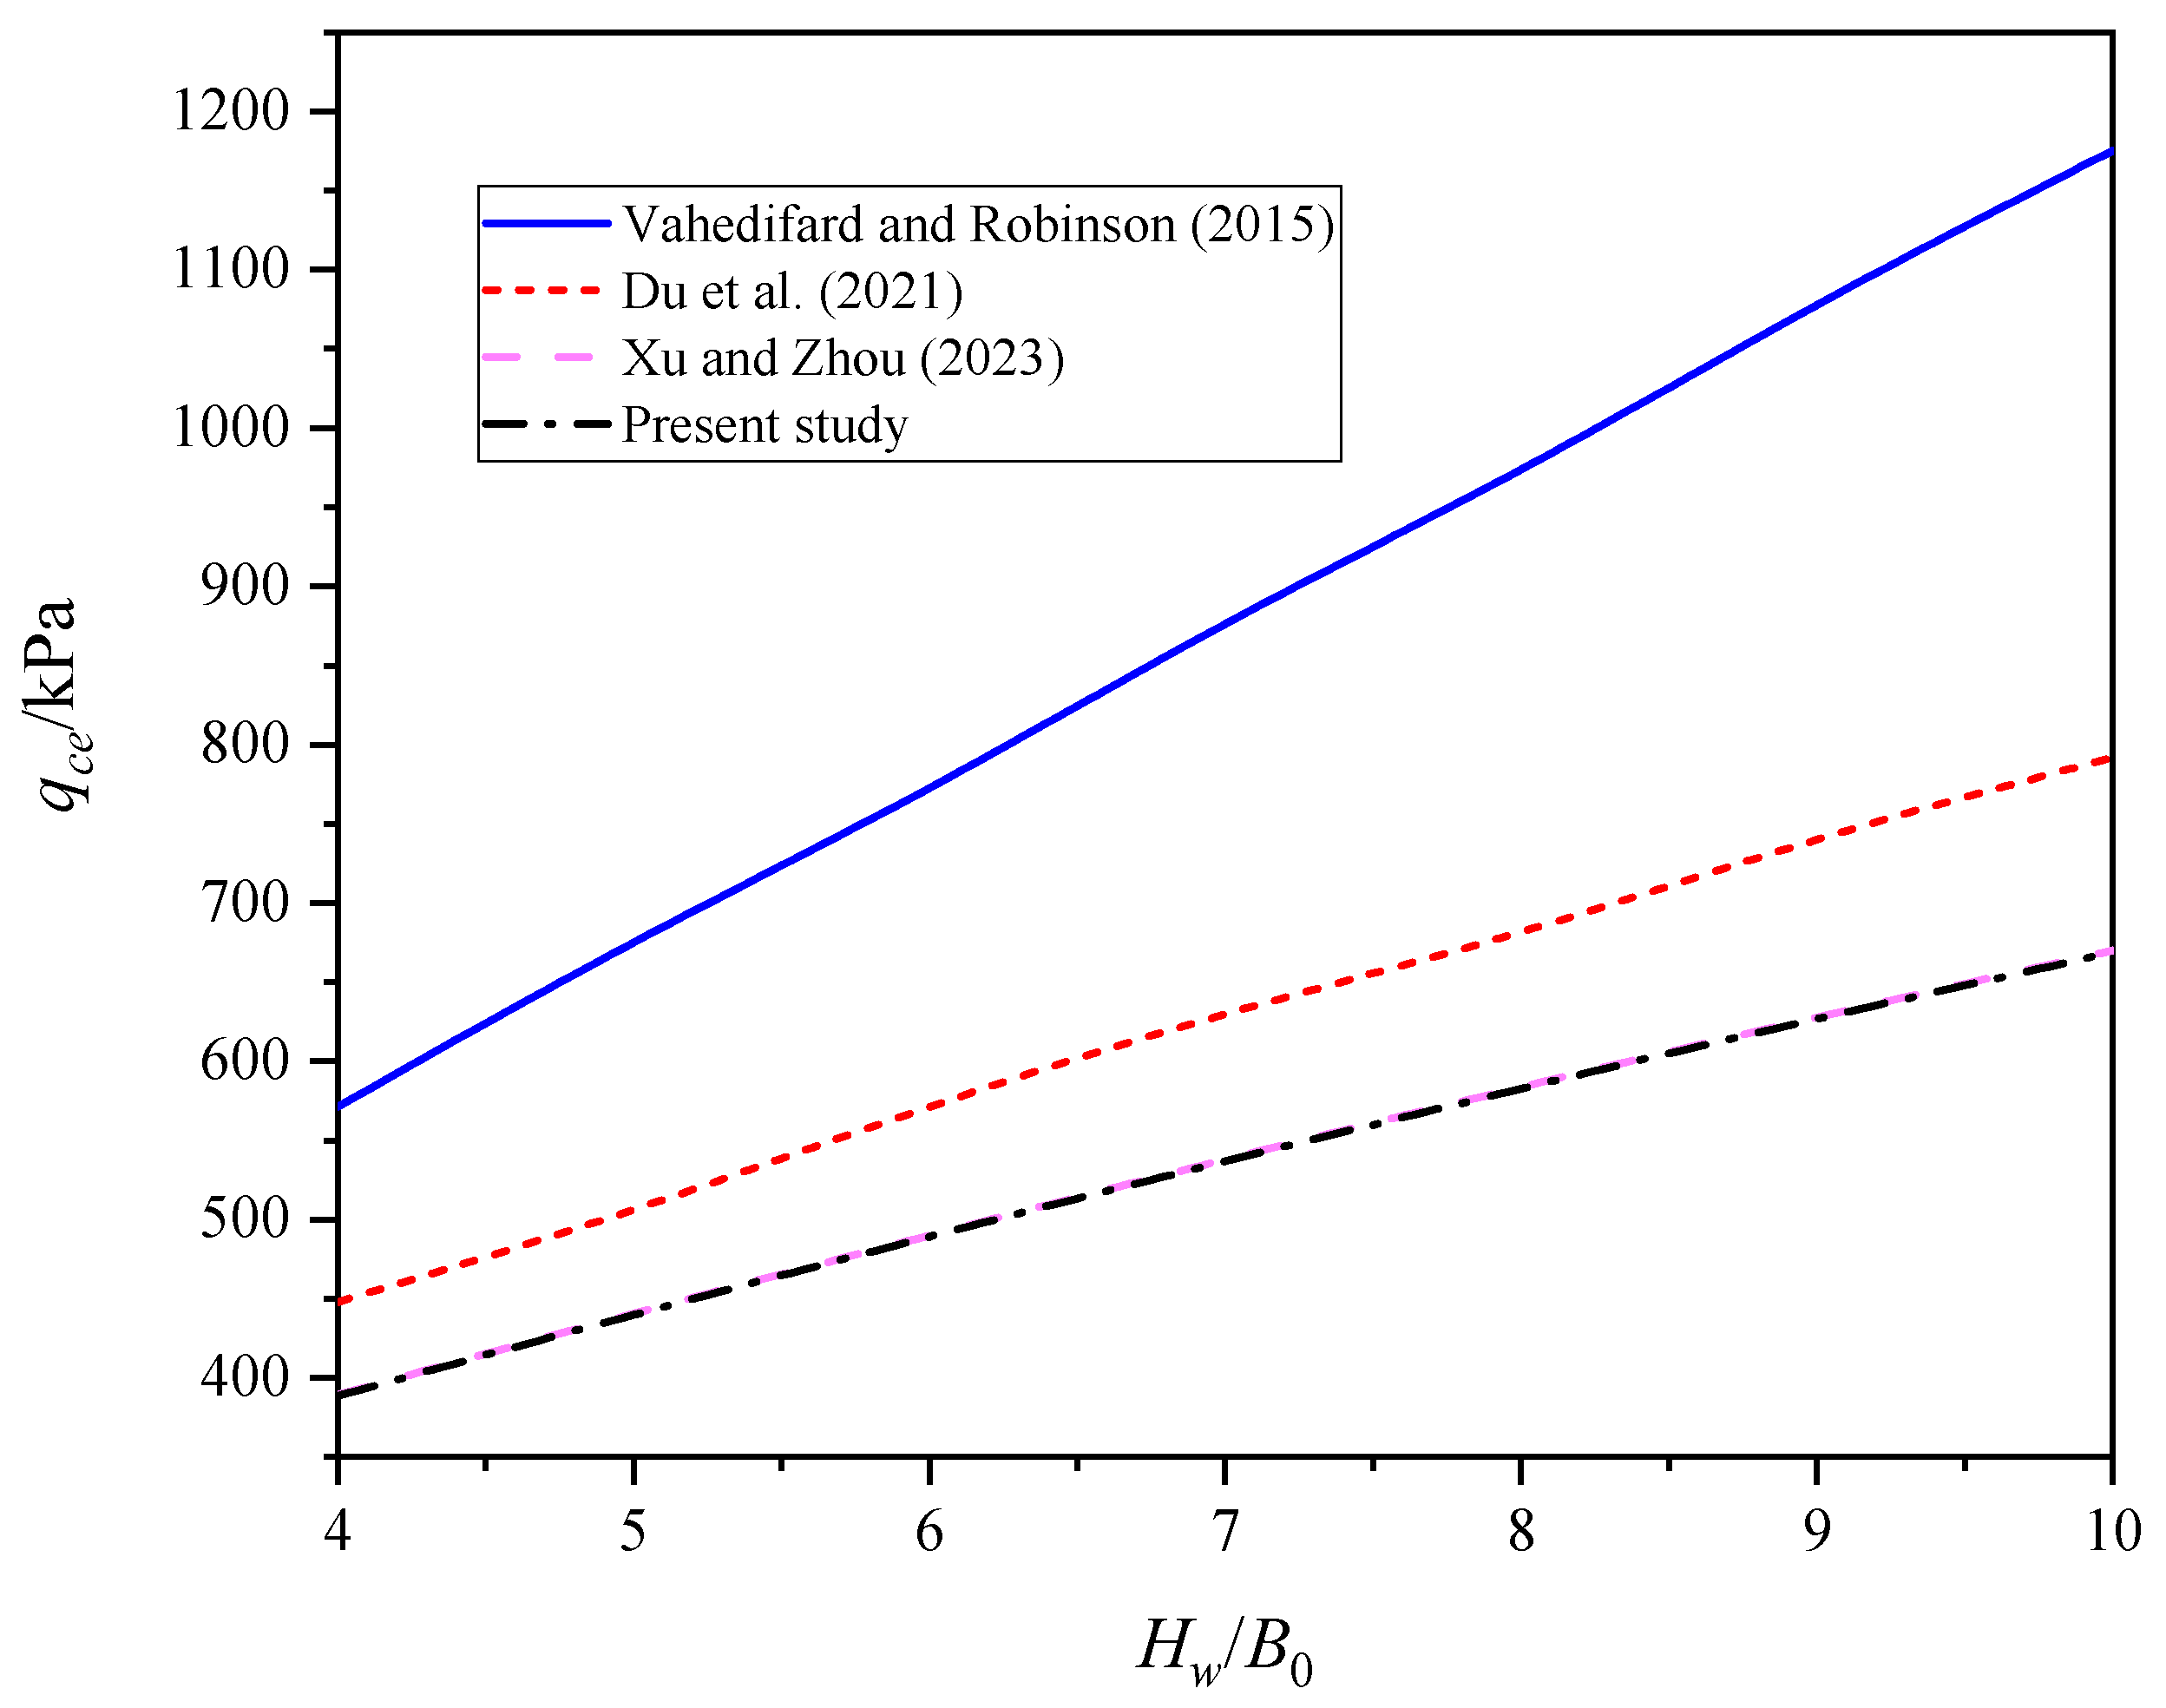
4.3. Comparison for Unsaturated Soils
5. Parametric Analysis and Discussion
5.1. Effect of
5.2. Effect of and
5.3. Effect of Steady Flow
6. Conclusions
- (1)
- Considering both the effect of reinforcement as well as the effect of matrix suction, analytical expressions for the bearing capacity of reinforced strip footings on unsaturated soils are given in this paper, and results are obtained for four typical unsaturated soils. In addition, the expressions apply to any unsaturated soil for which the relevant parameters can be given.
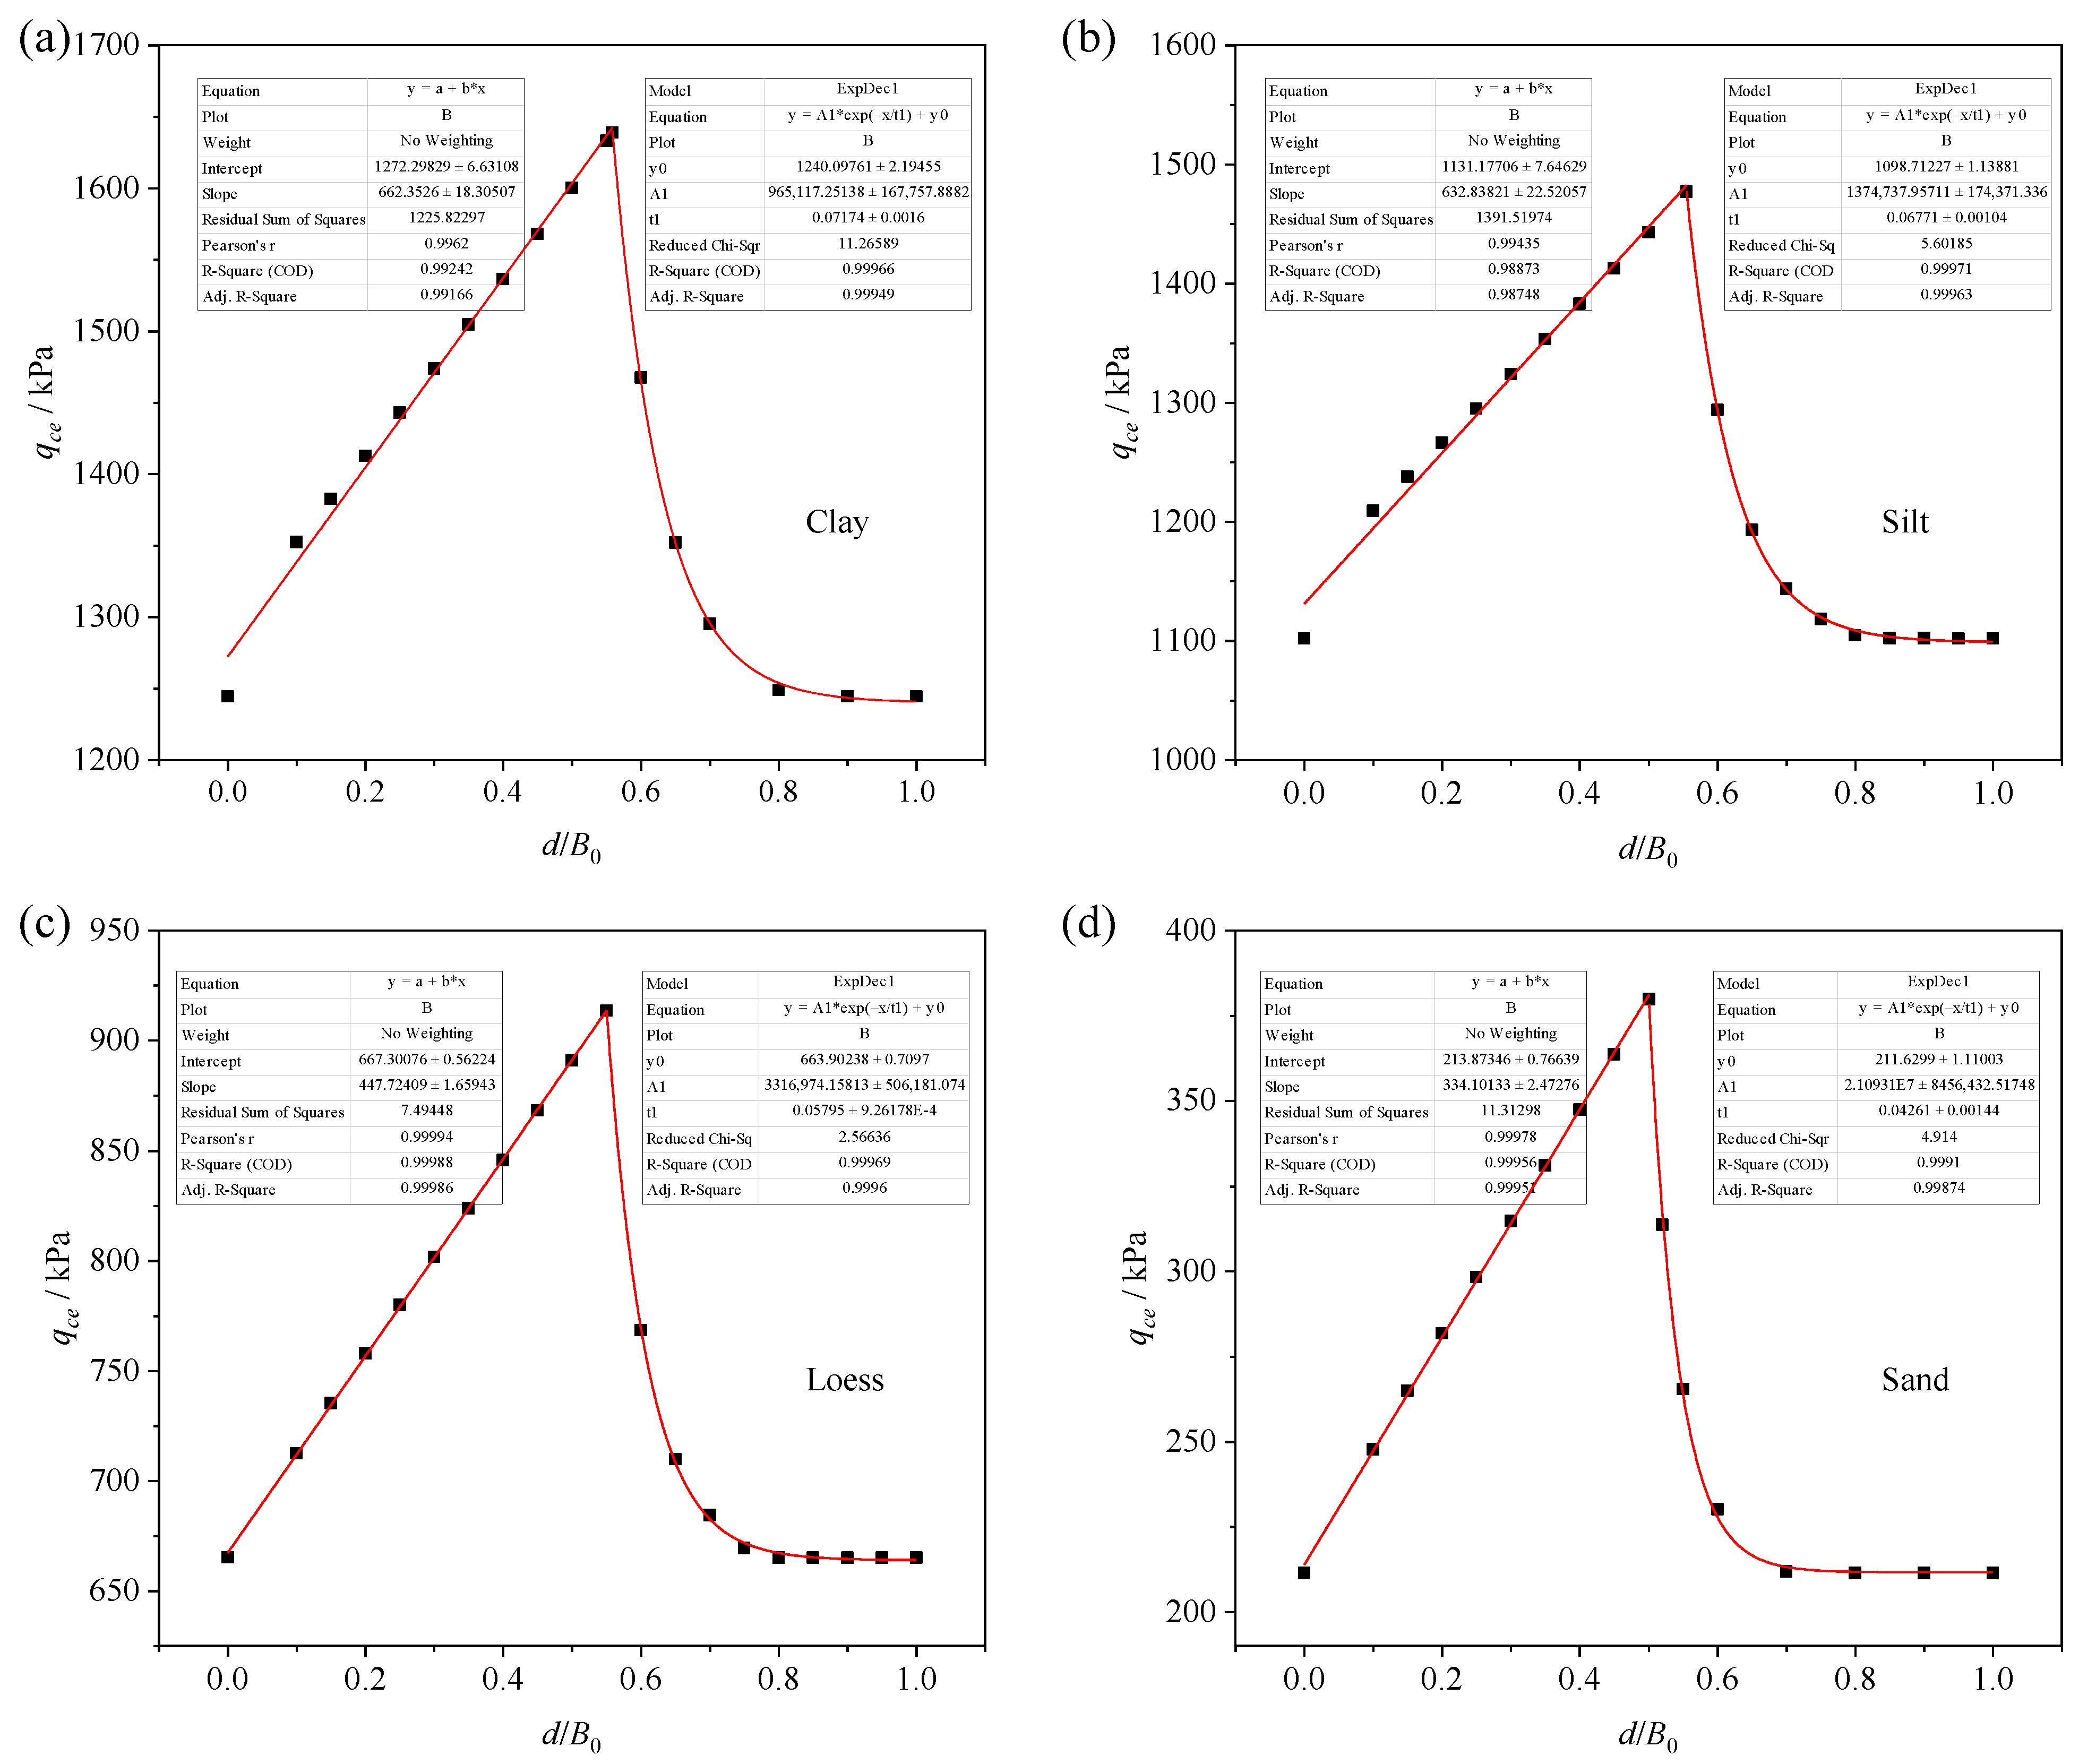
- (2)
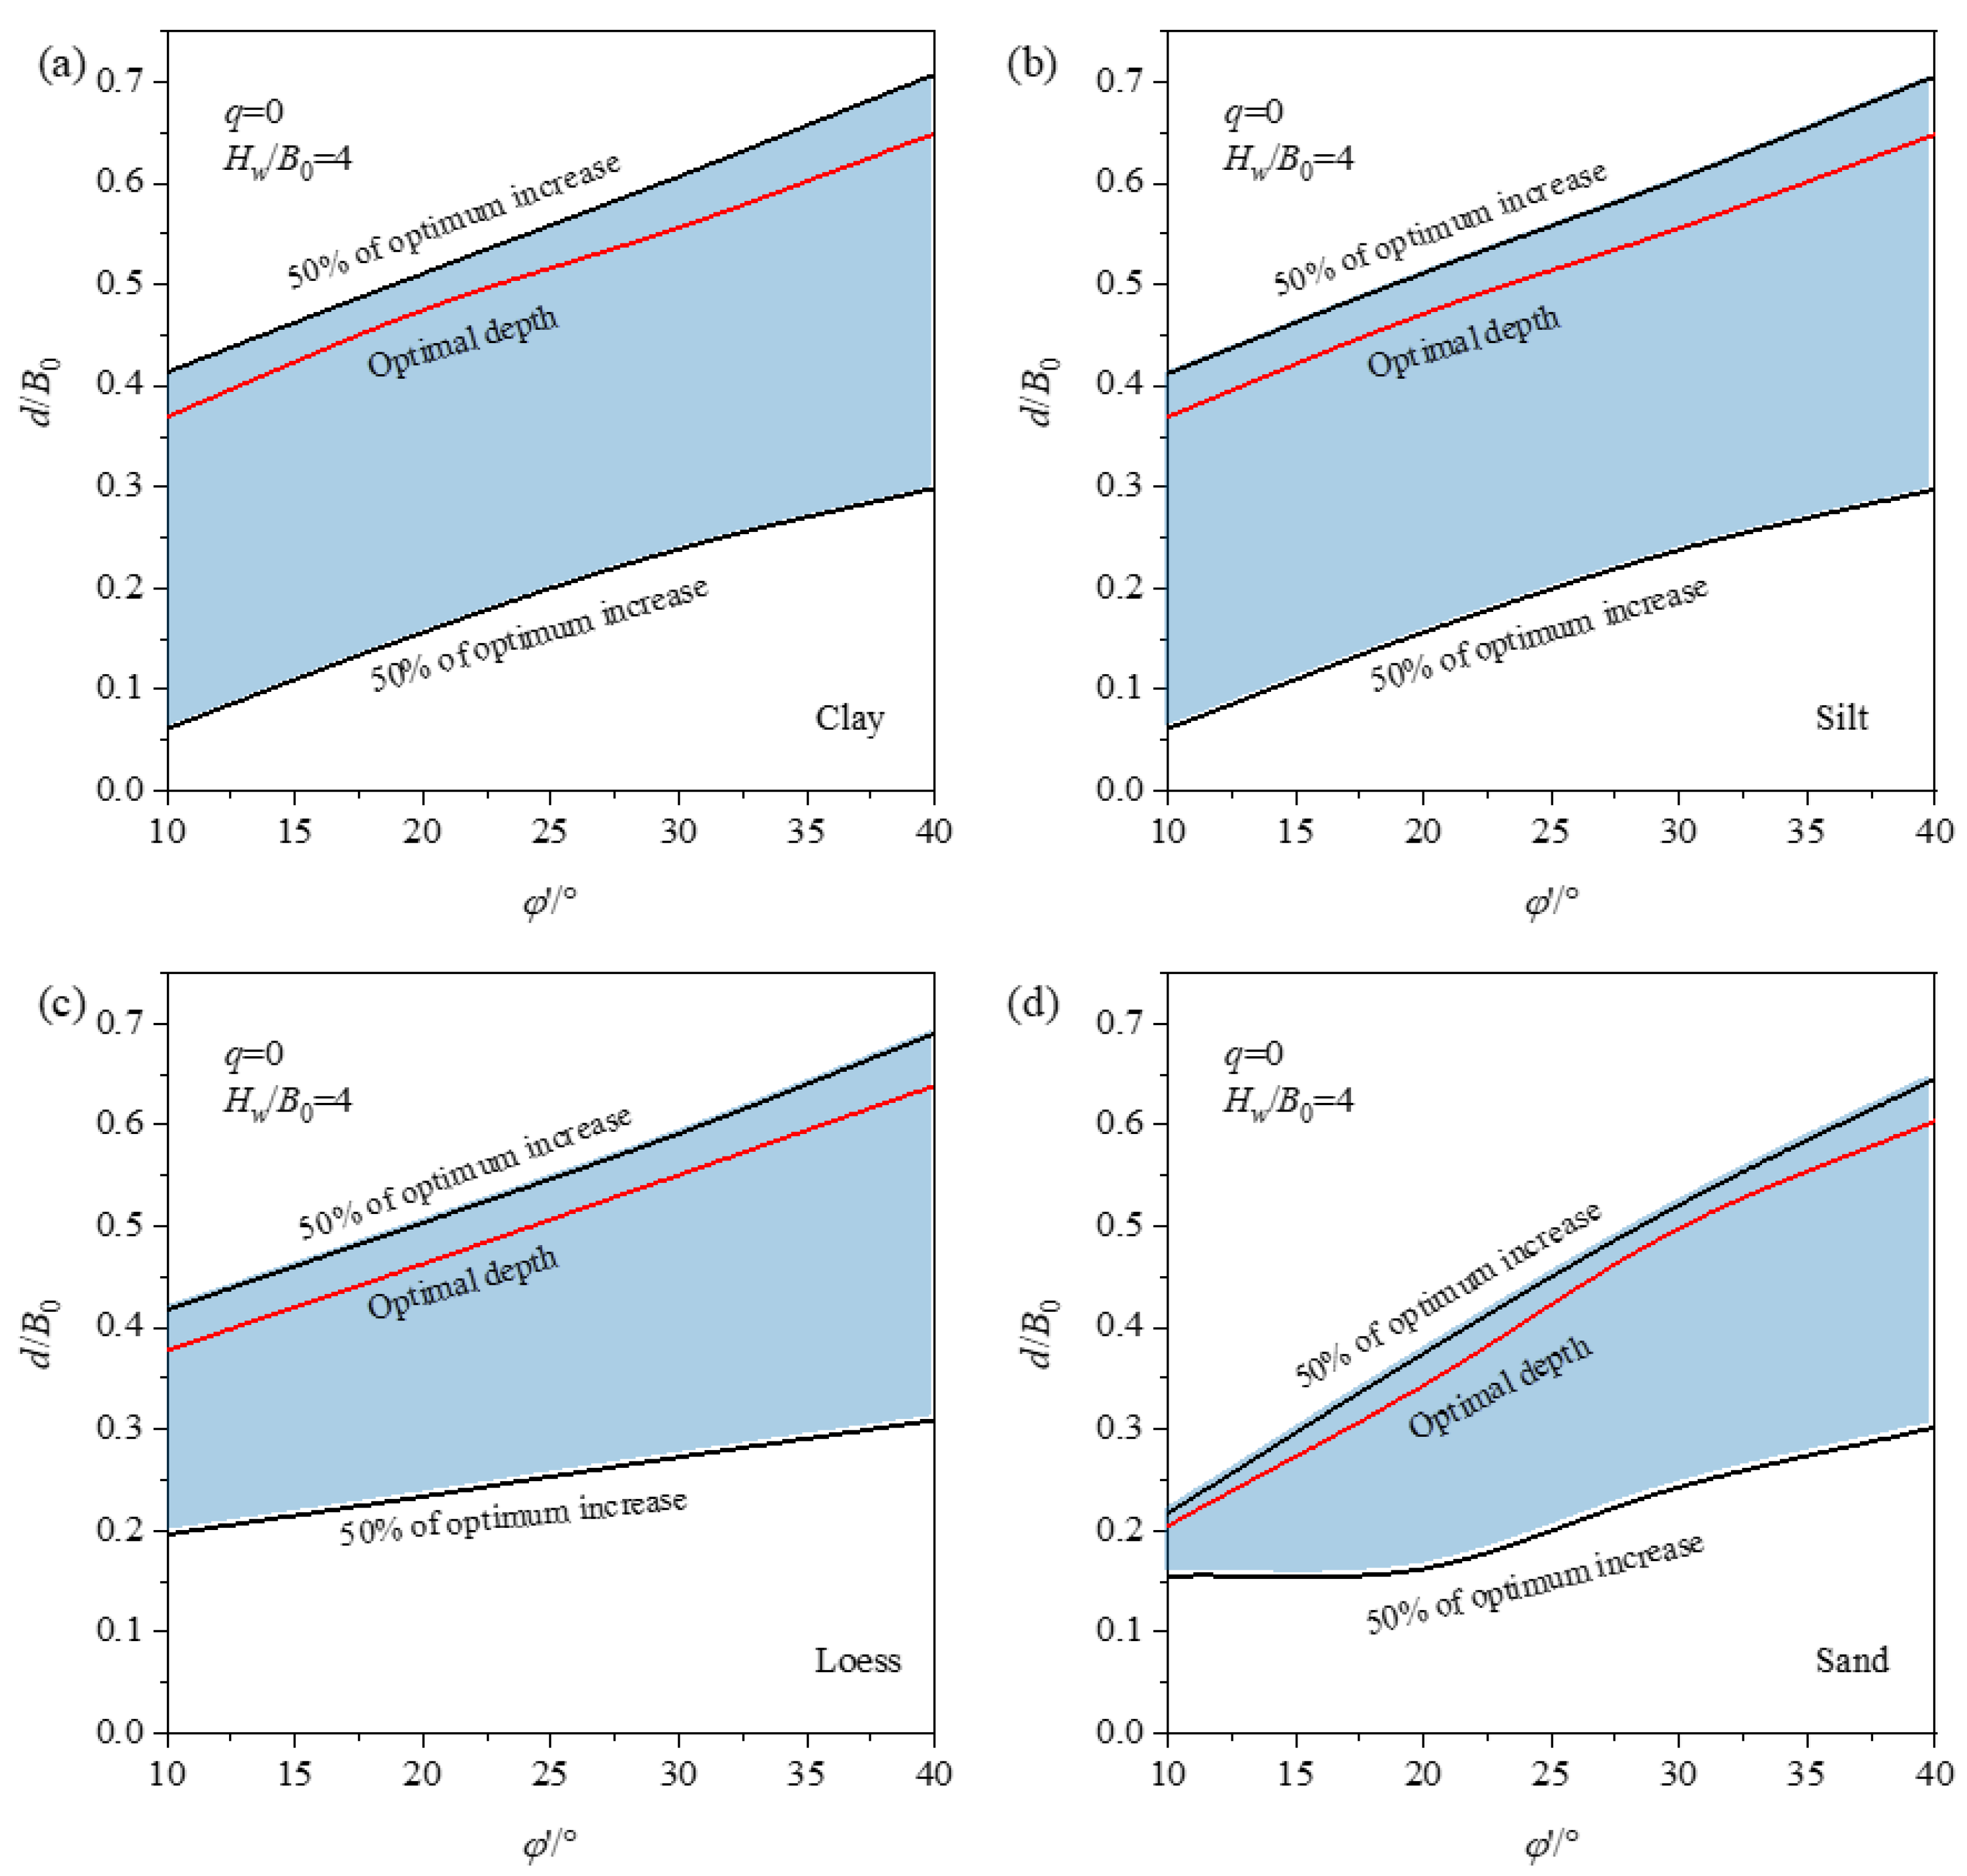
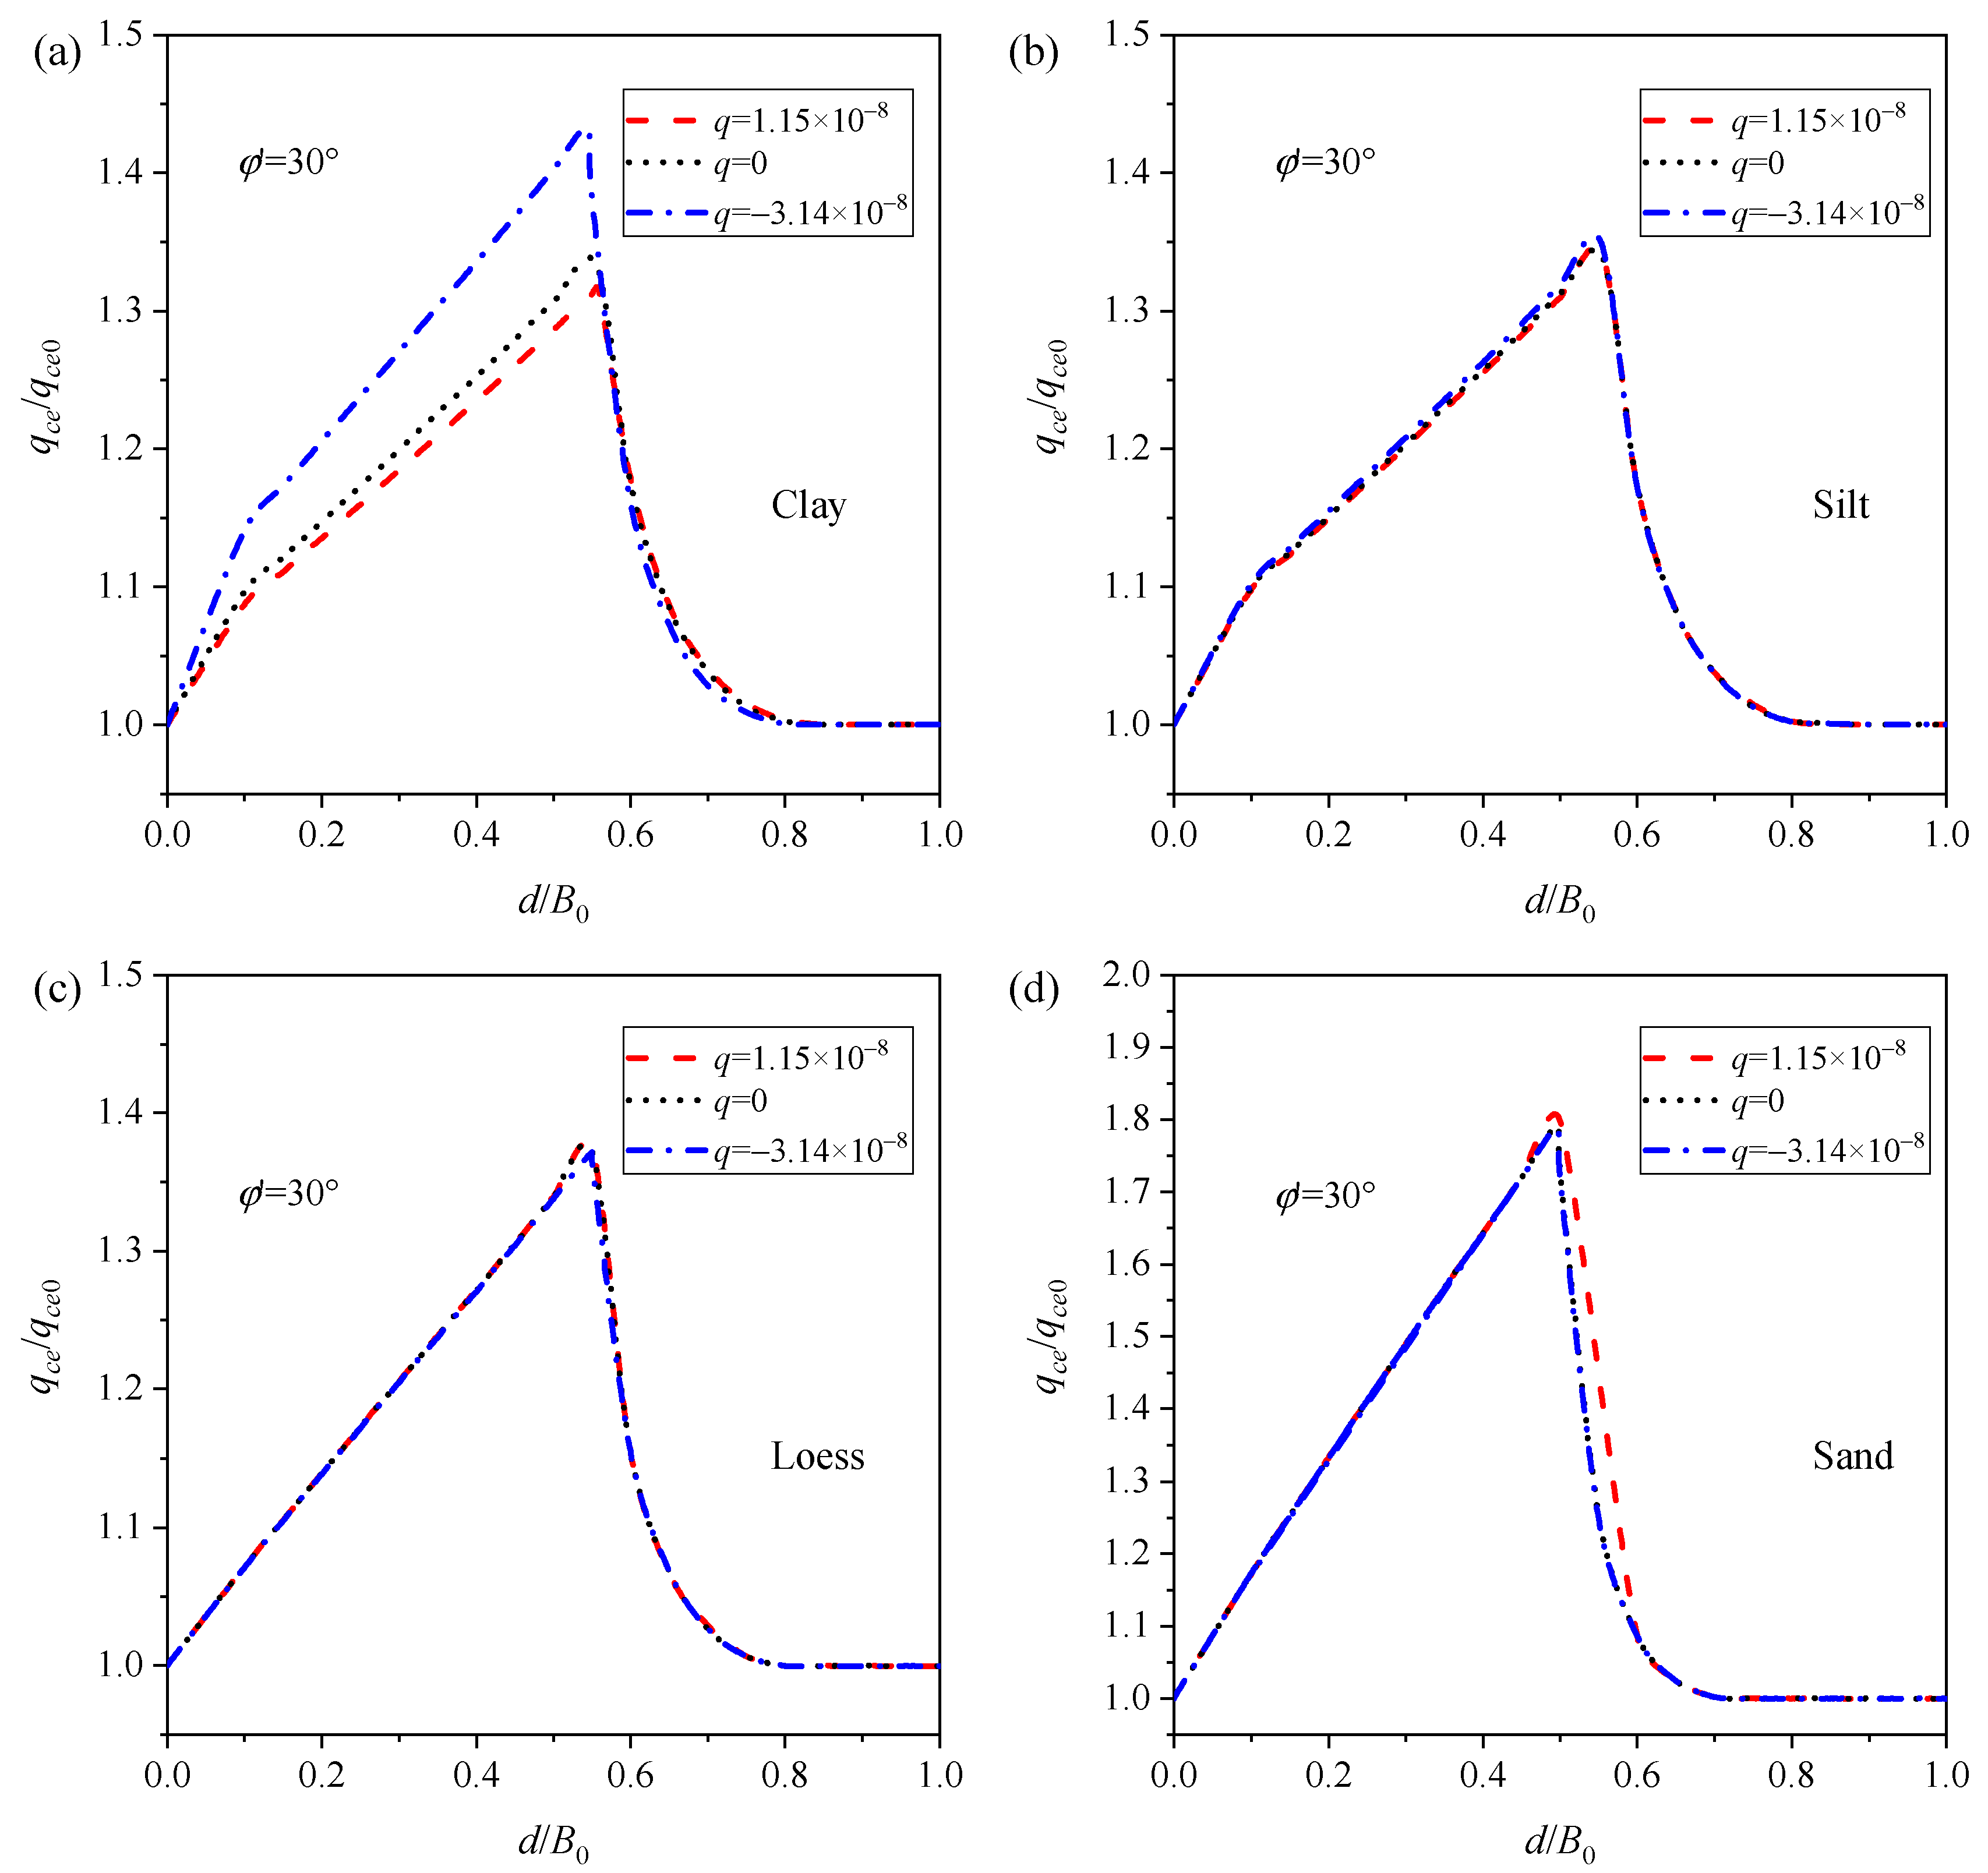
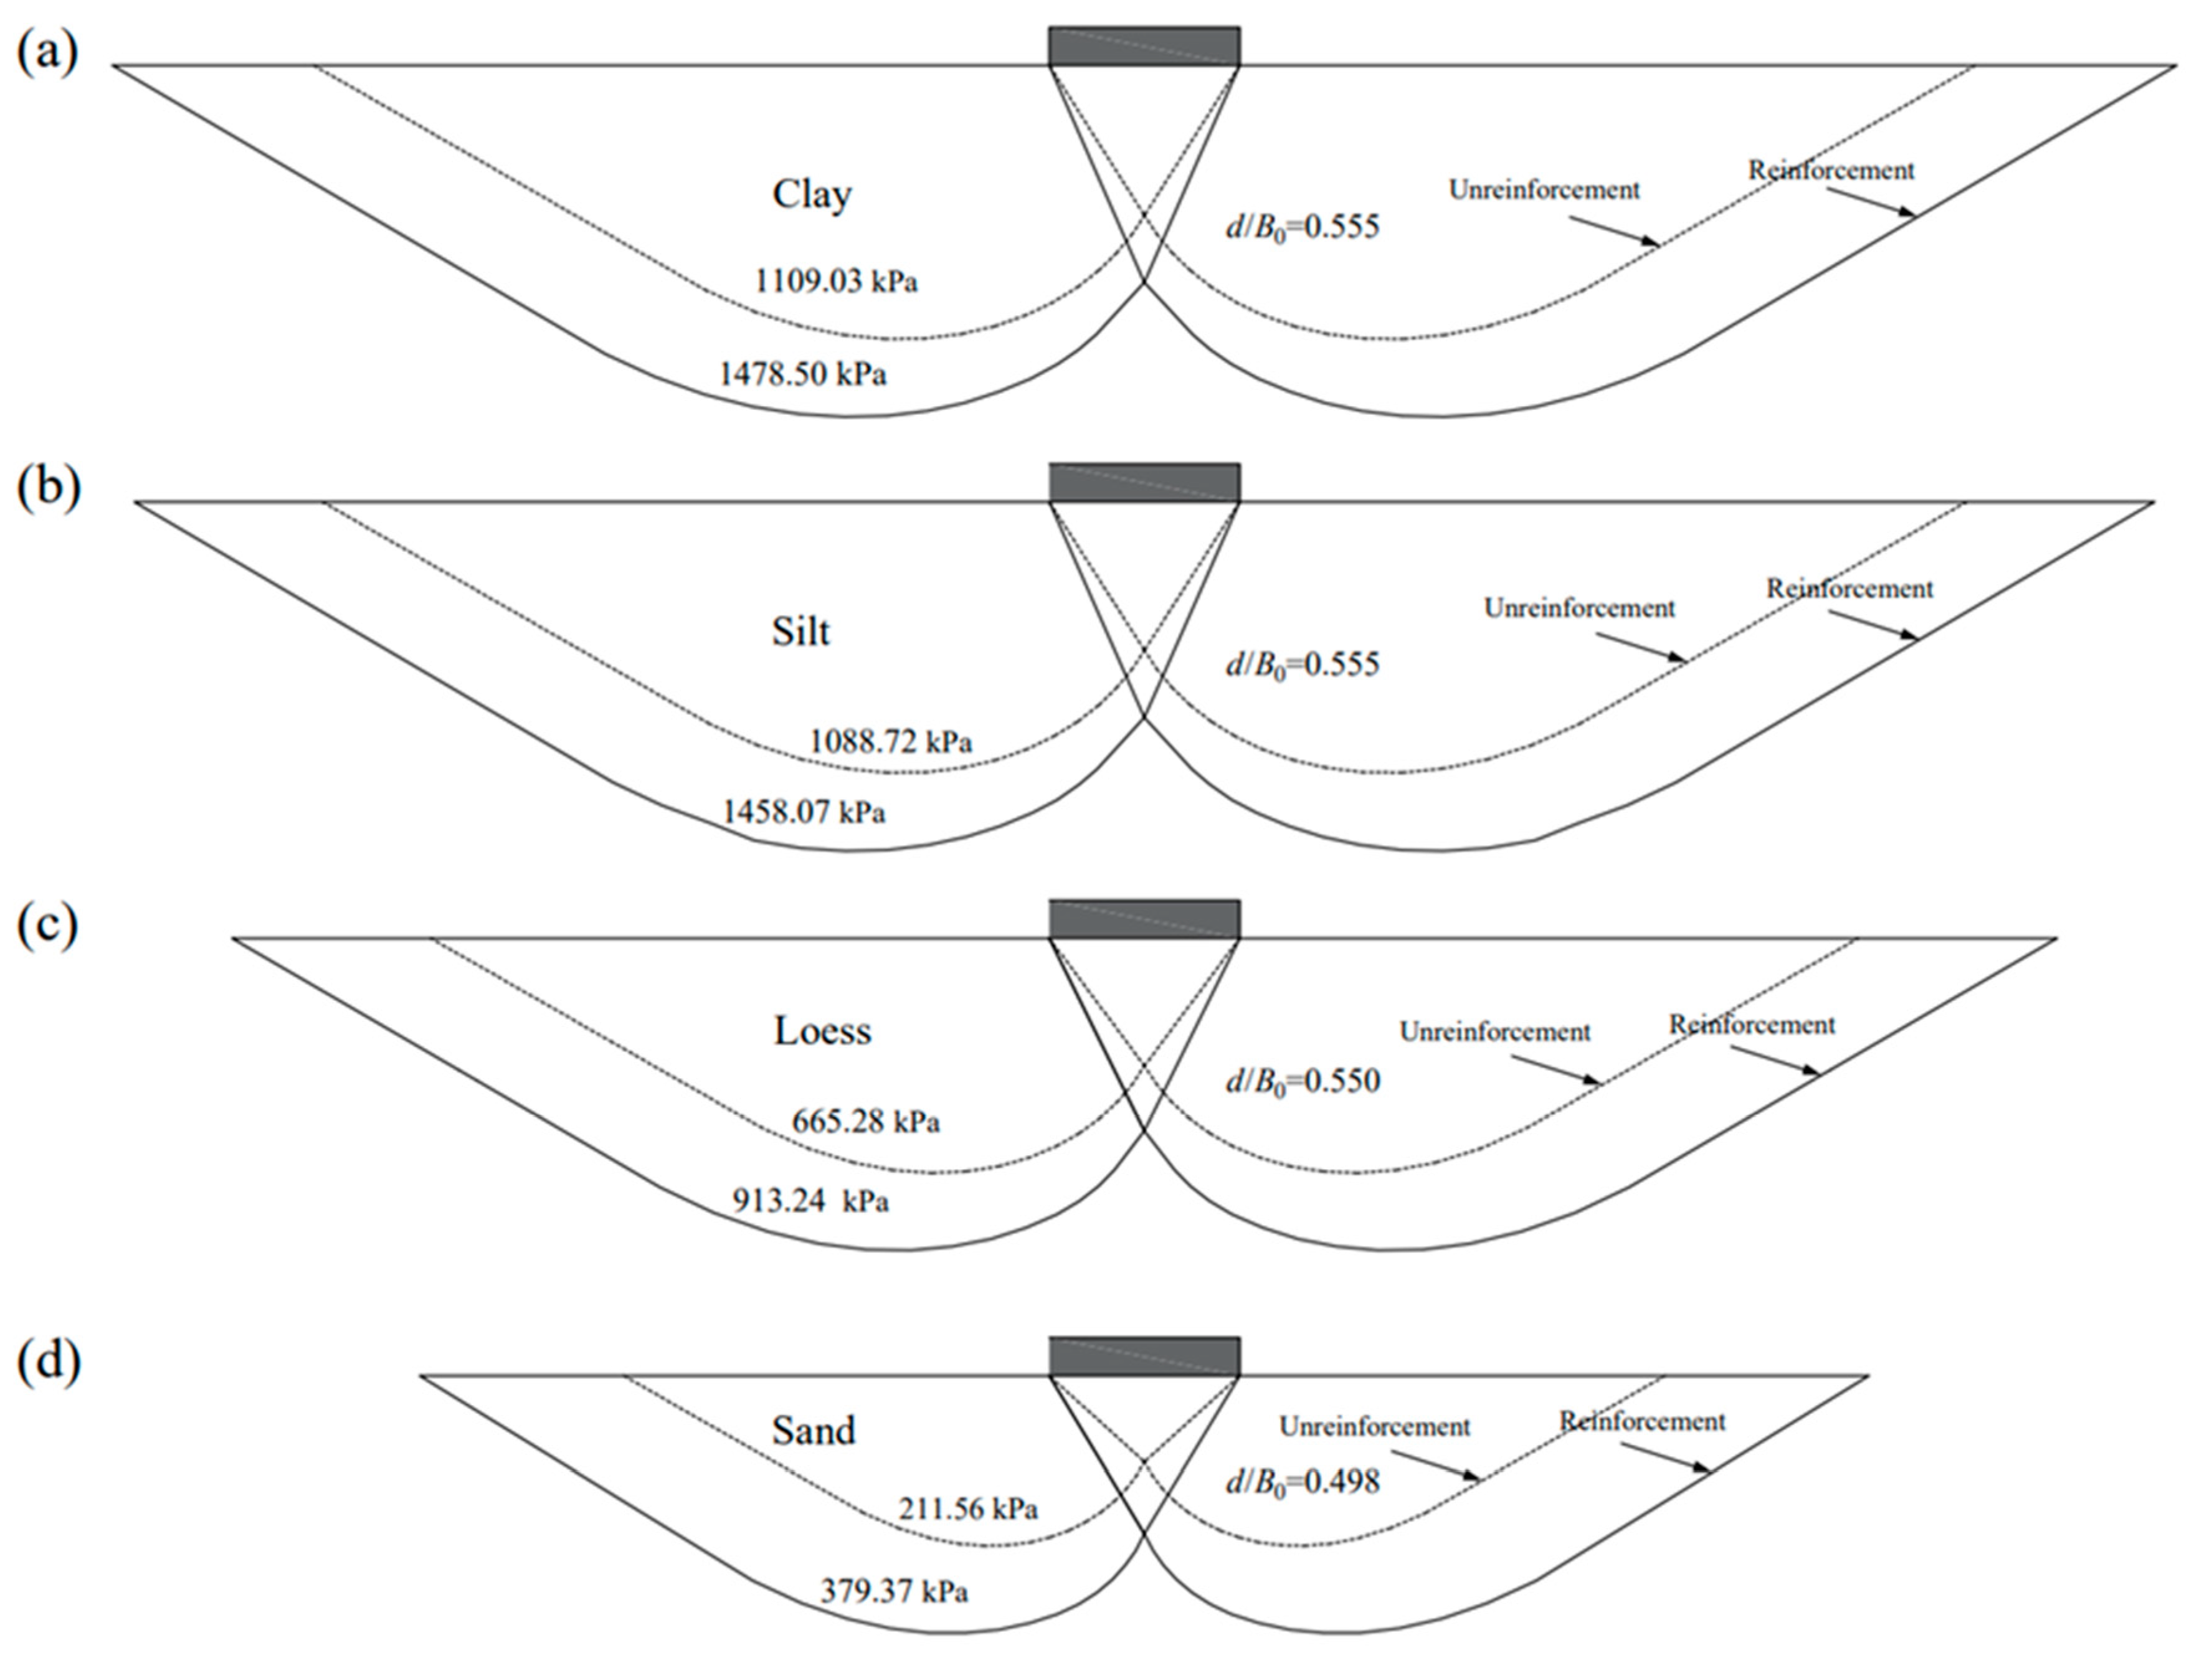
- The bearing capacity increases and then decreases with . In this paper, for four types of soils, the range of reinforcement embedment depth at 50% of the maximum increase in bearing capacity is given, as shown in Figure 12, which can be used in engineering practice.
- (3)
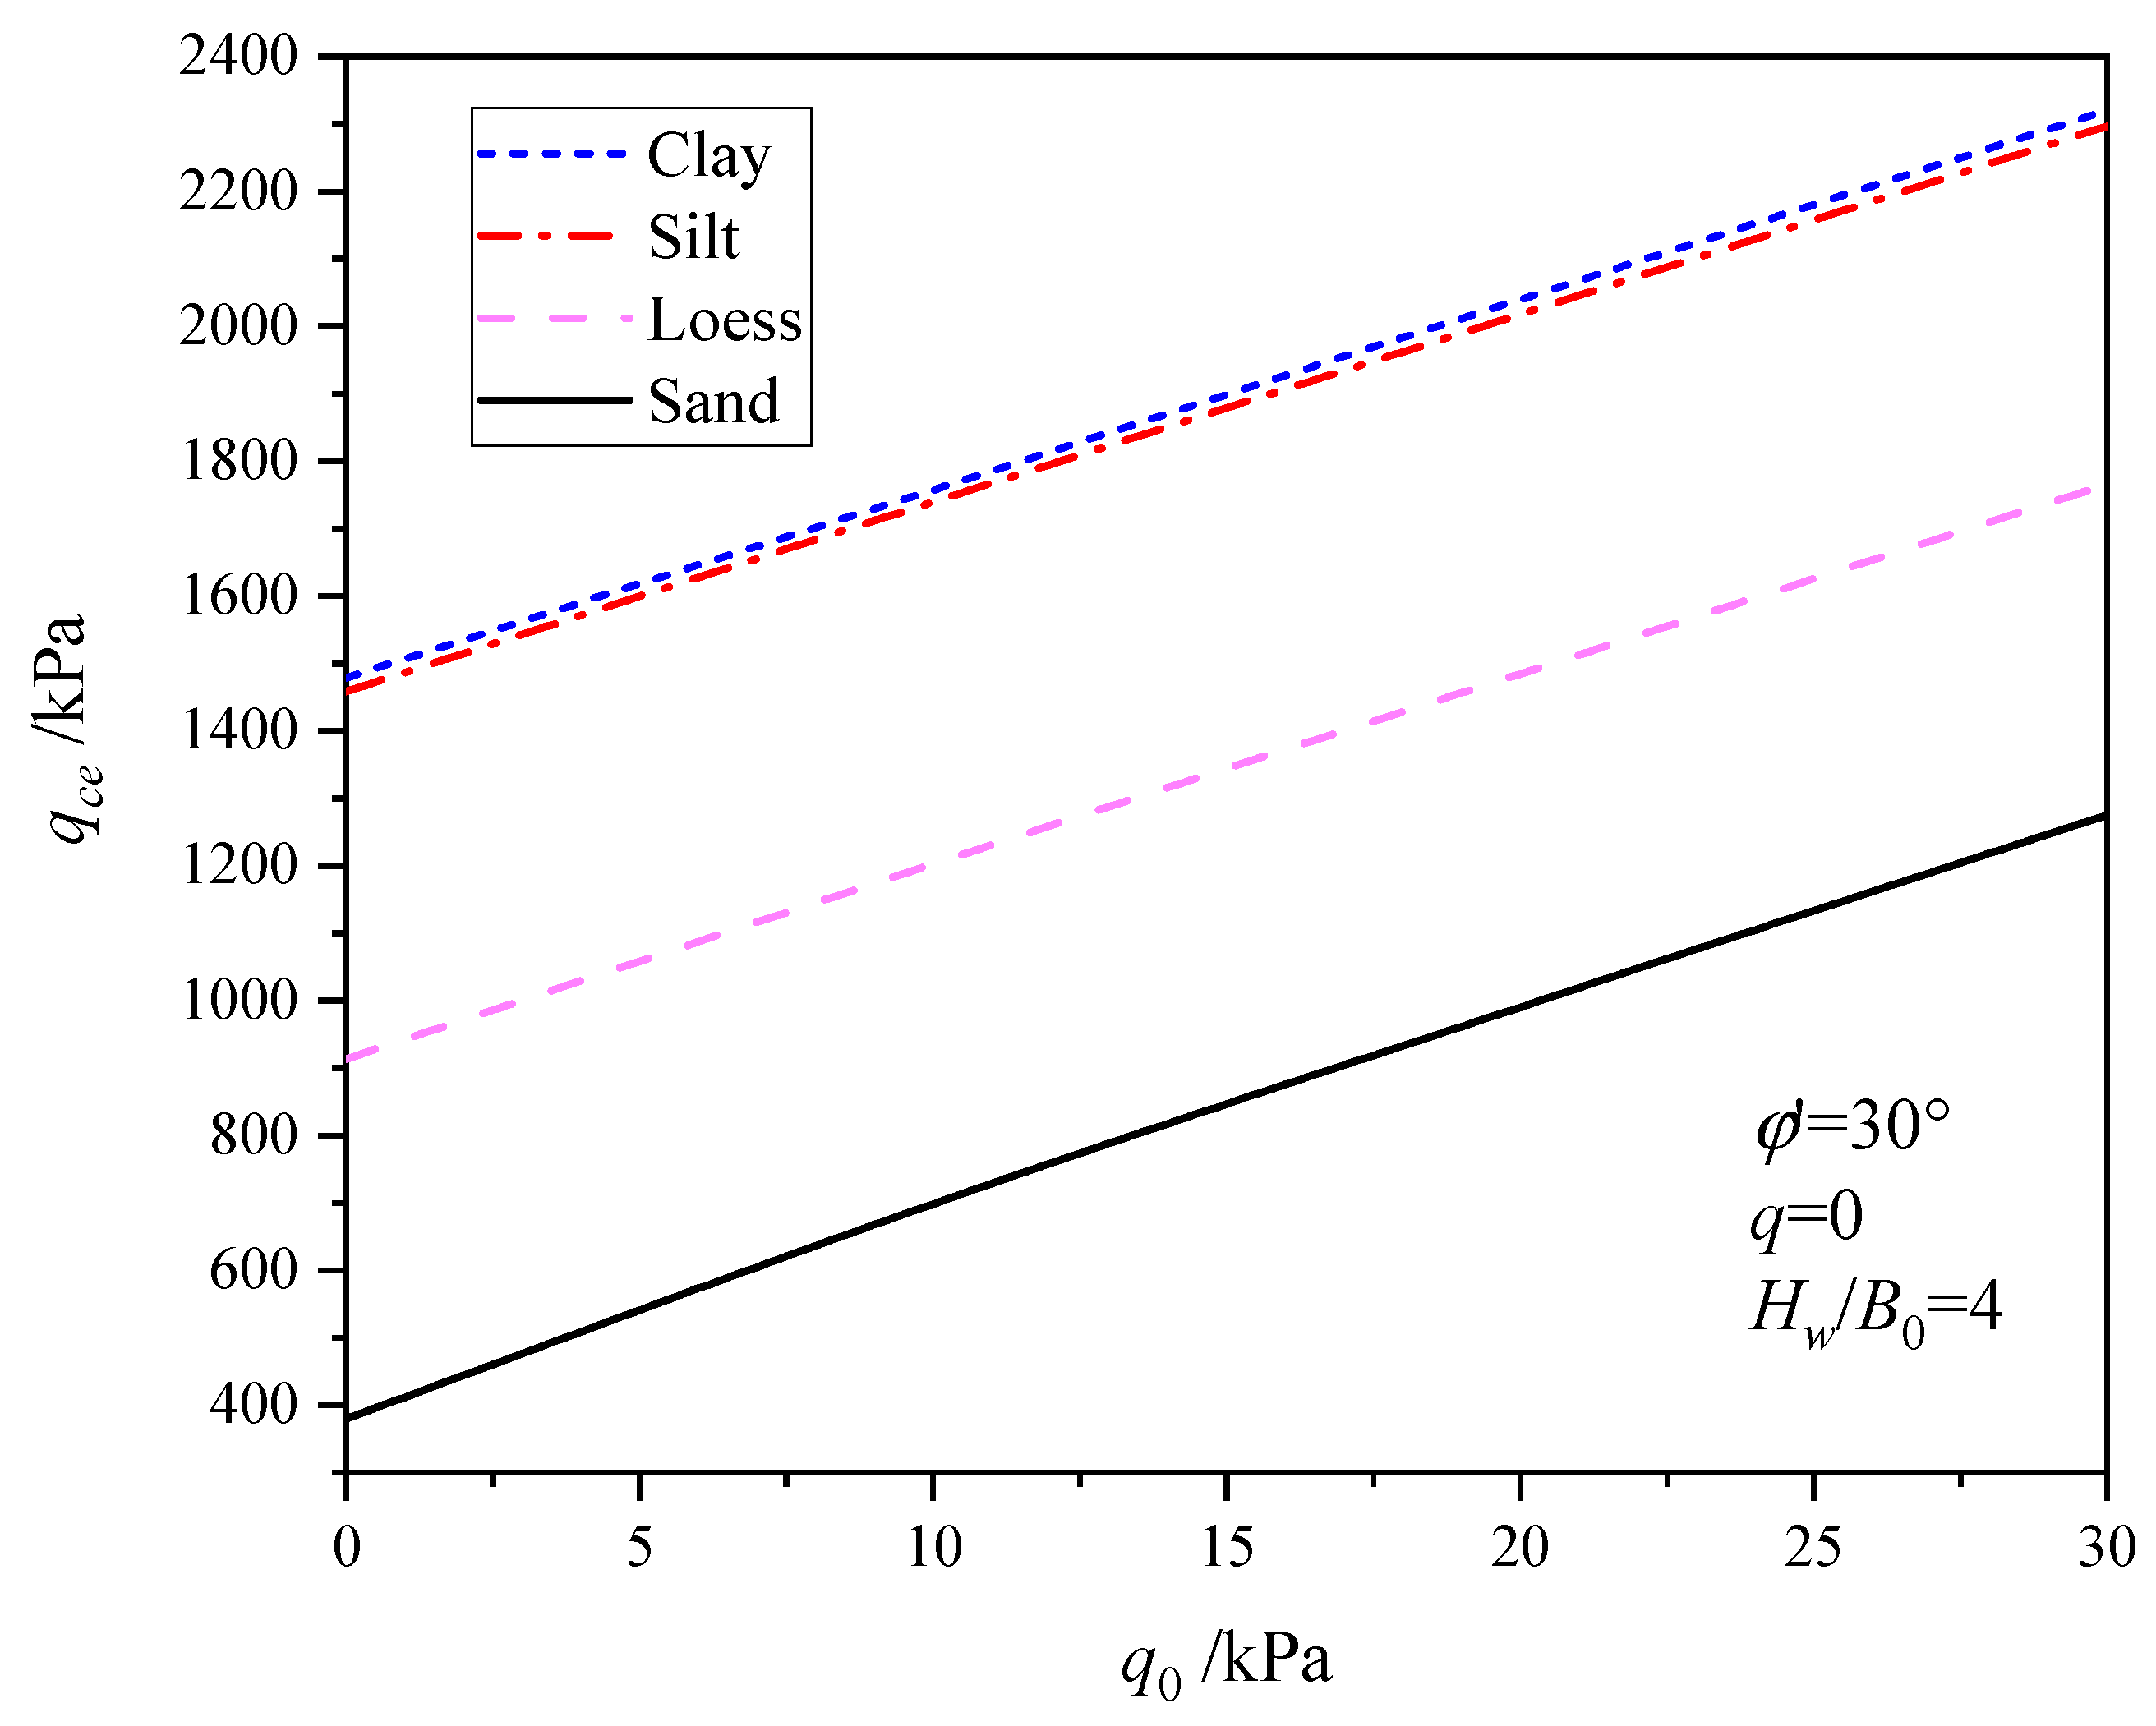
- The optimal bearing capacity increases with a uniform load . For sand, the optimal bearing capacity is increased by about 236% when is increased from 0 to 30 kPa. For loess, the optimal bearing capacity is increased by about 93%. And because the clay is similar to the silt, the optimal bearing capacity is increased by about 57%.
- (4)
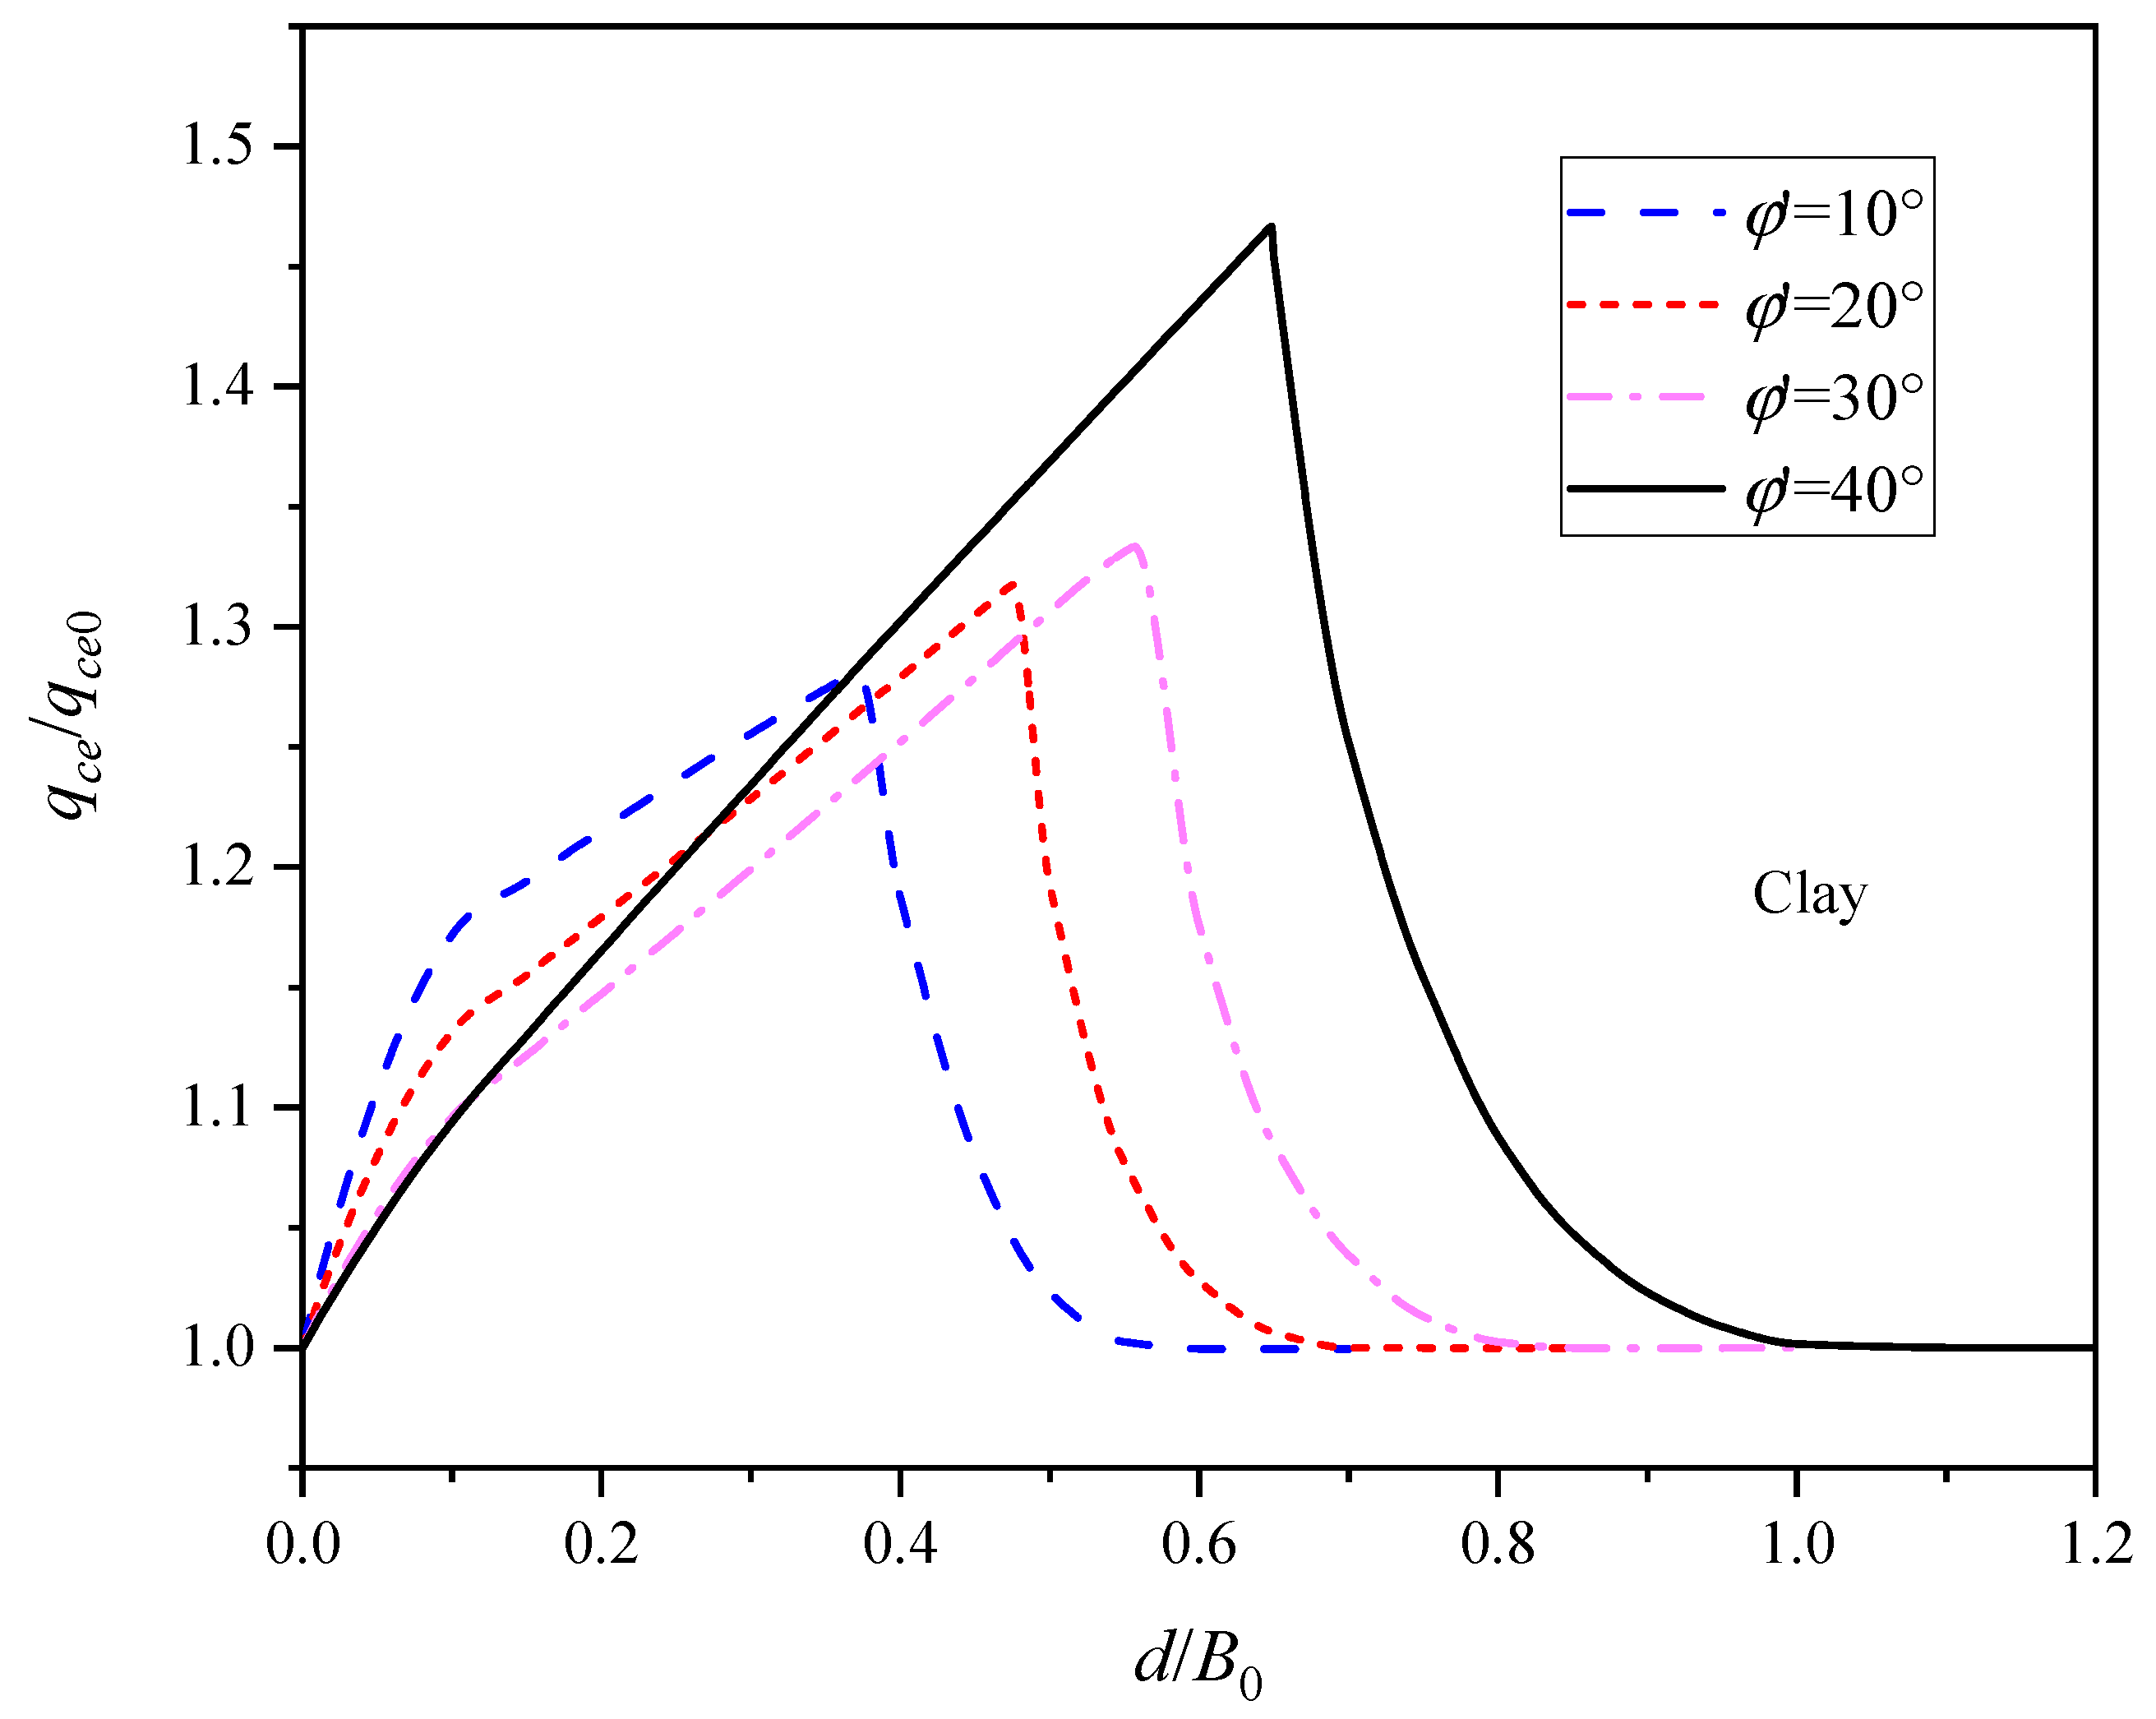
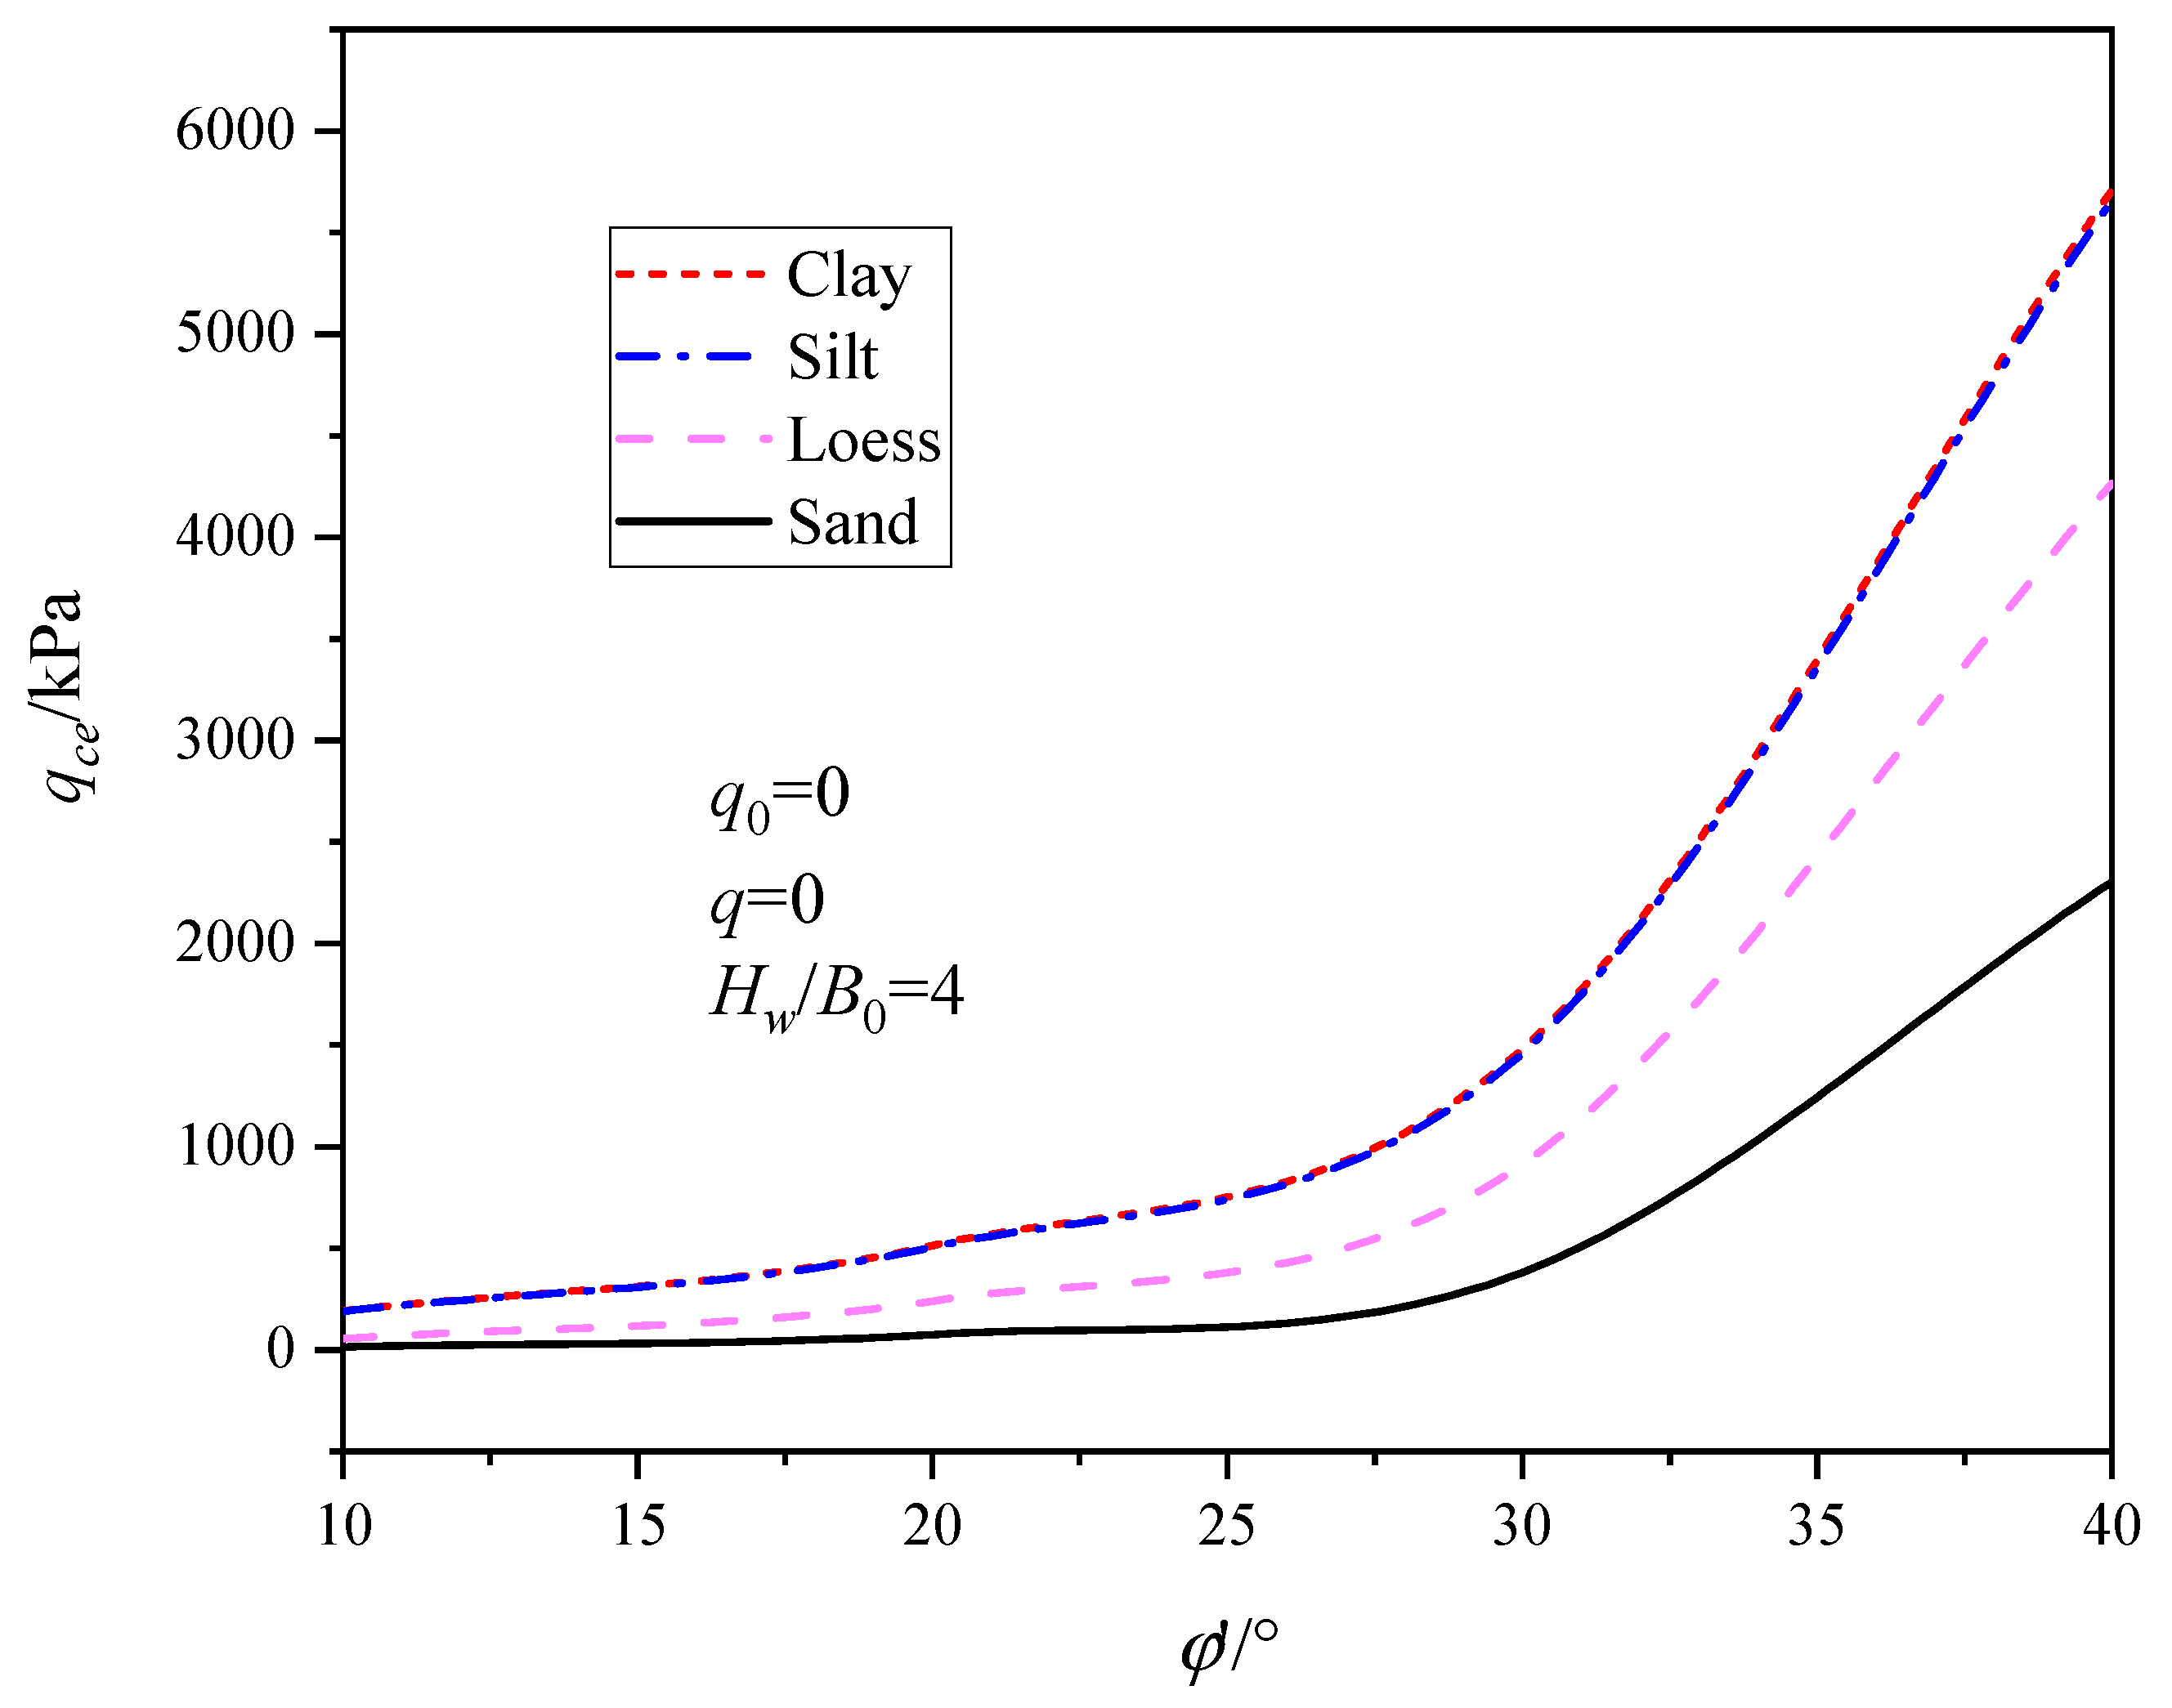
- For all four types of soils, the optimal bearing capacity increases with the effective internal friction angle . In addition, the effective internal friction angle significantly affects the optimal embedment depth of the reinforcement as well as the optimal bearing capacity ratio .
- (5)
- Compared to the no-flow case (), the evaporation case () increases the optimal bearing capacity and the infiltration case () decreases the optimal bearing capacity. The order of degree of influence of flow rate on the four unsaturated soils is as follows: Clay > Silt > Loess > Sand. In addition, for the clay, the optimal increases as the flow rate increases.
- (6)
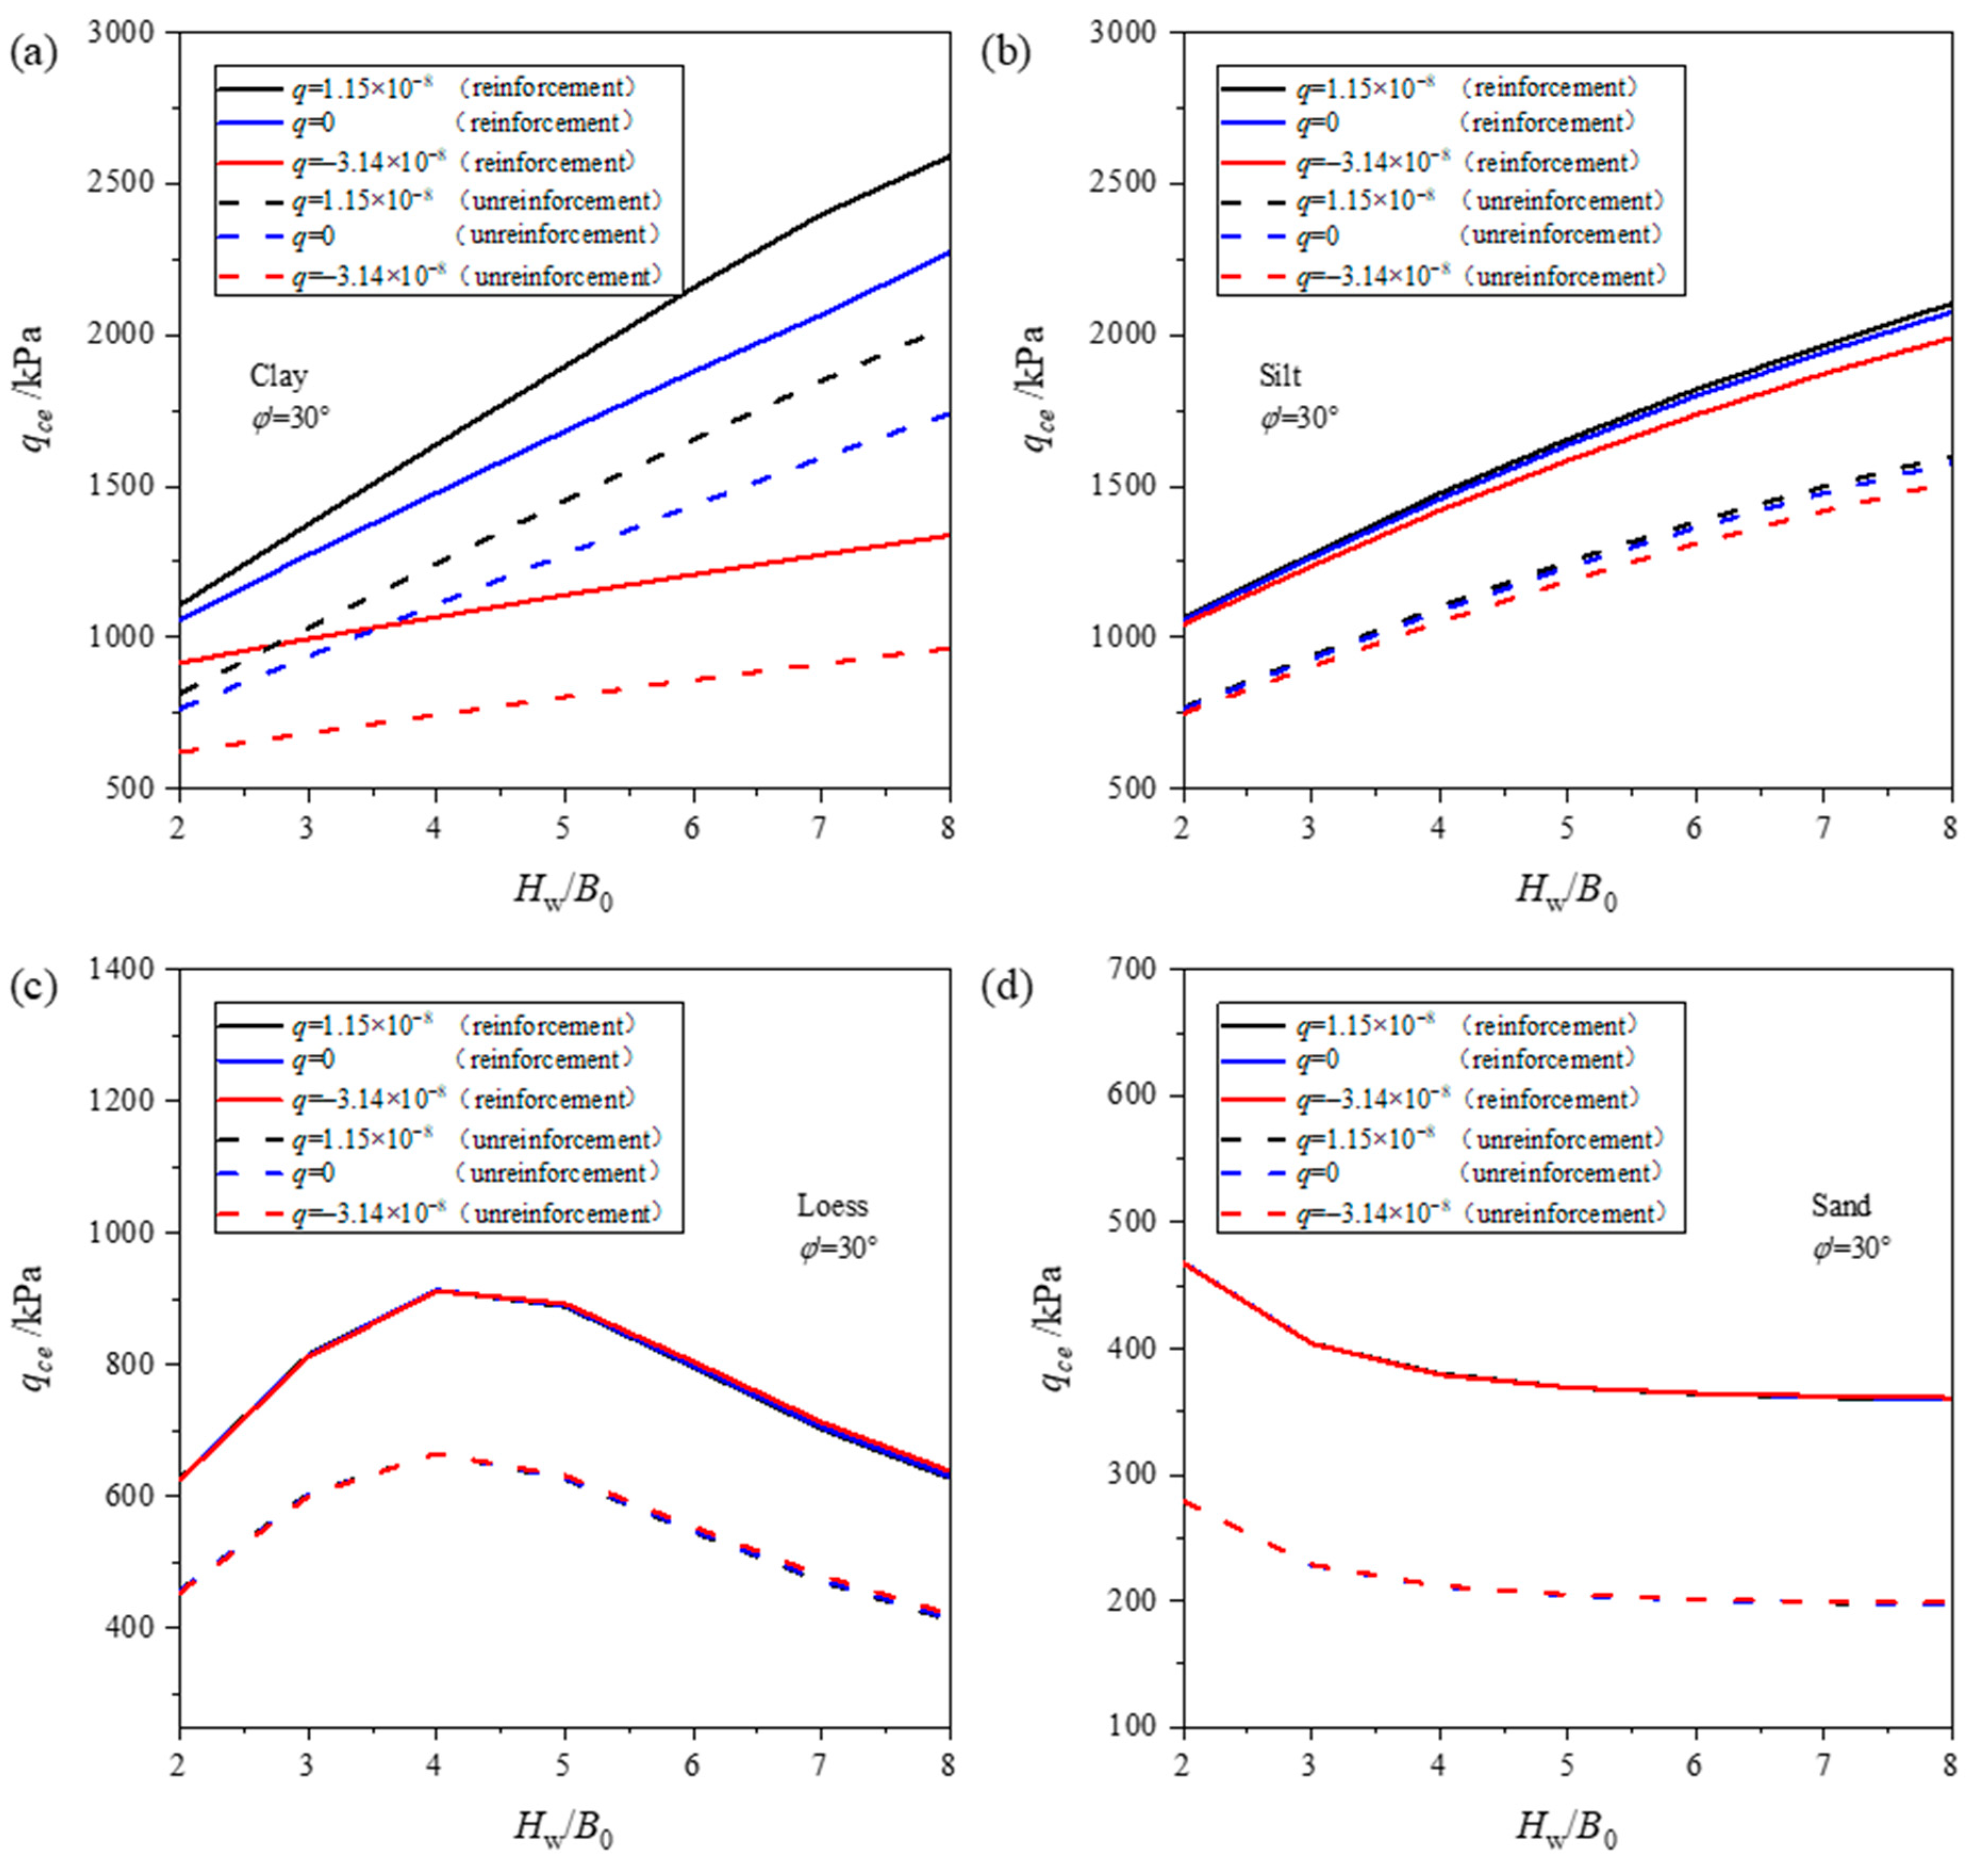
- For clay and silt, the optimal bearing capacity increases with an increasing water table . On the contrary, for the sand, the optimal decreases with increasing . However, for the loess, the optimal increases and then decreases, and the optimal bearing capacity is maximized when .
- (7)
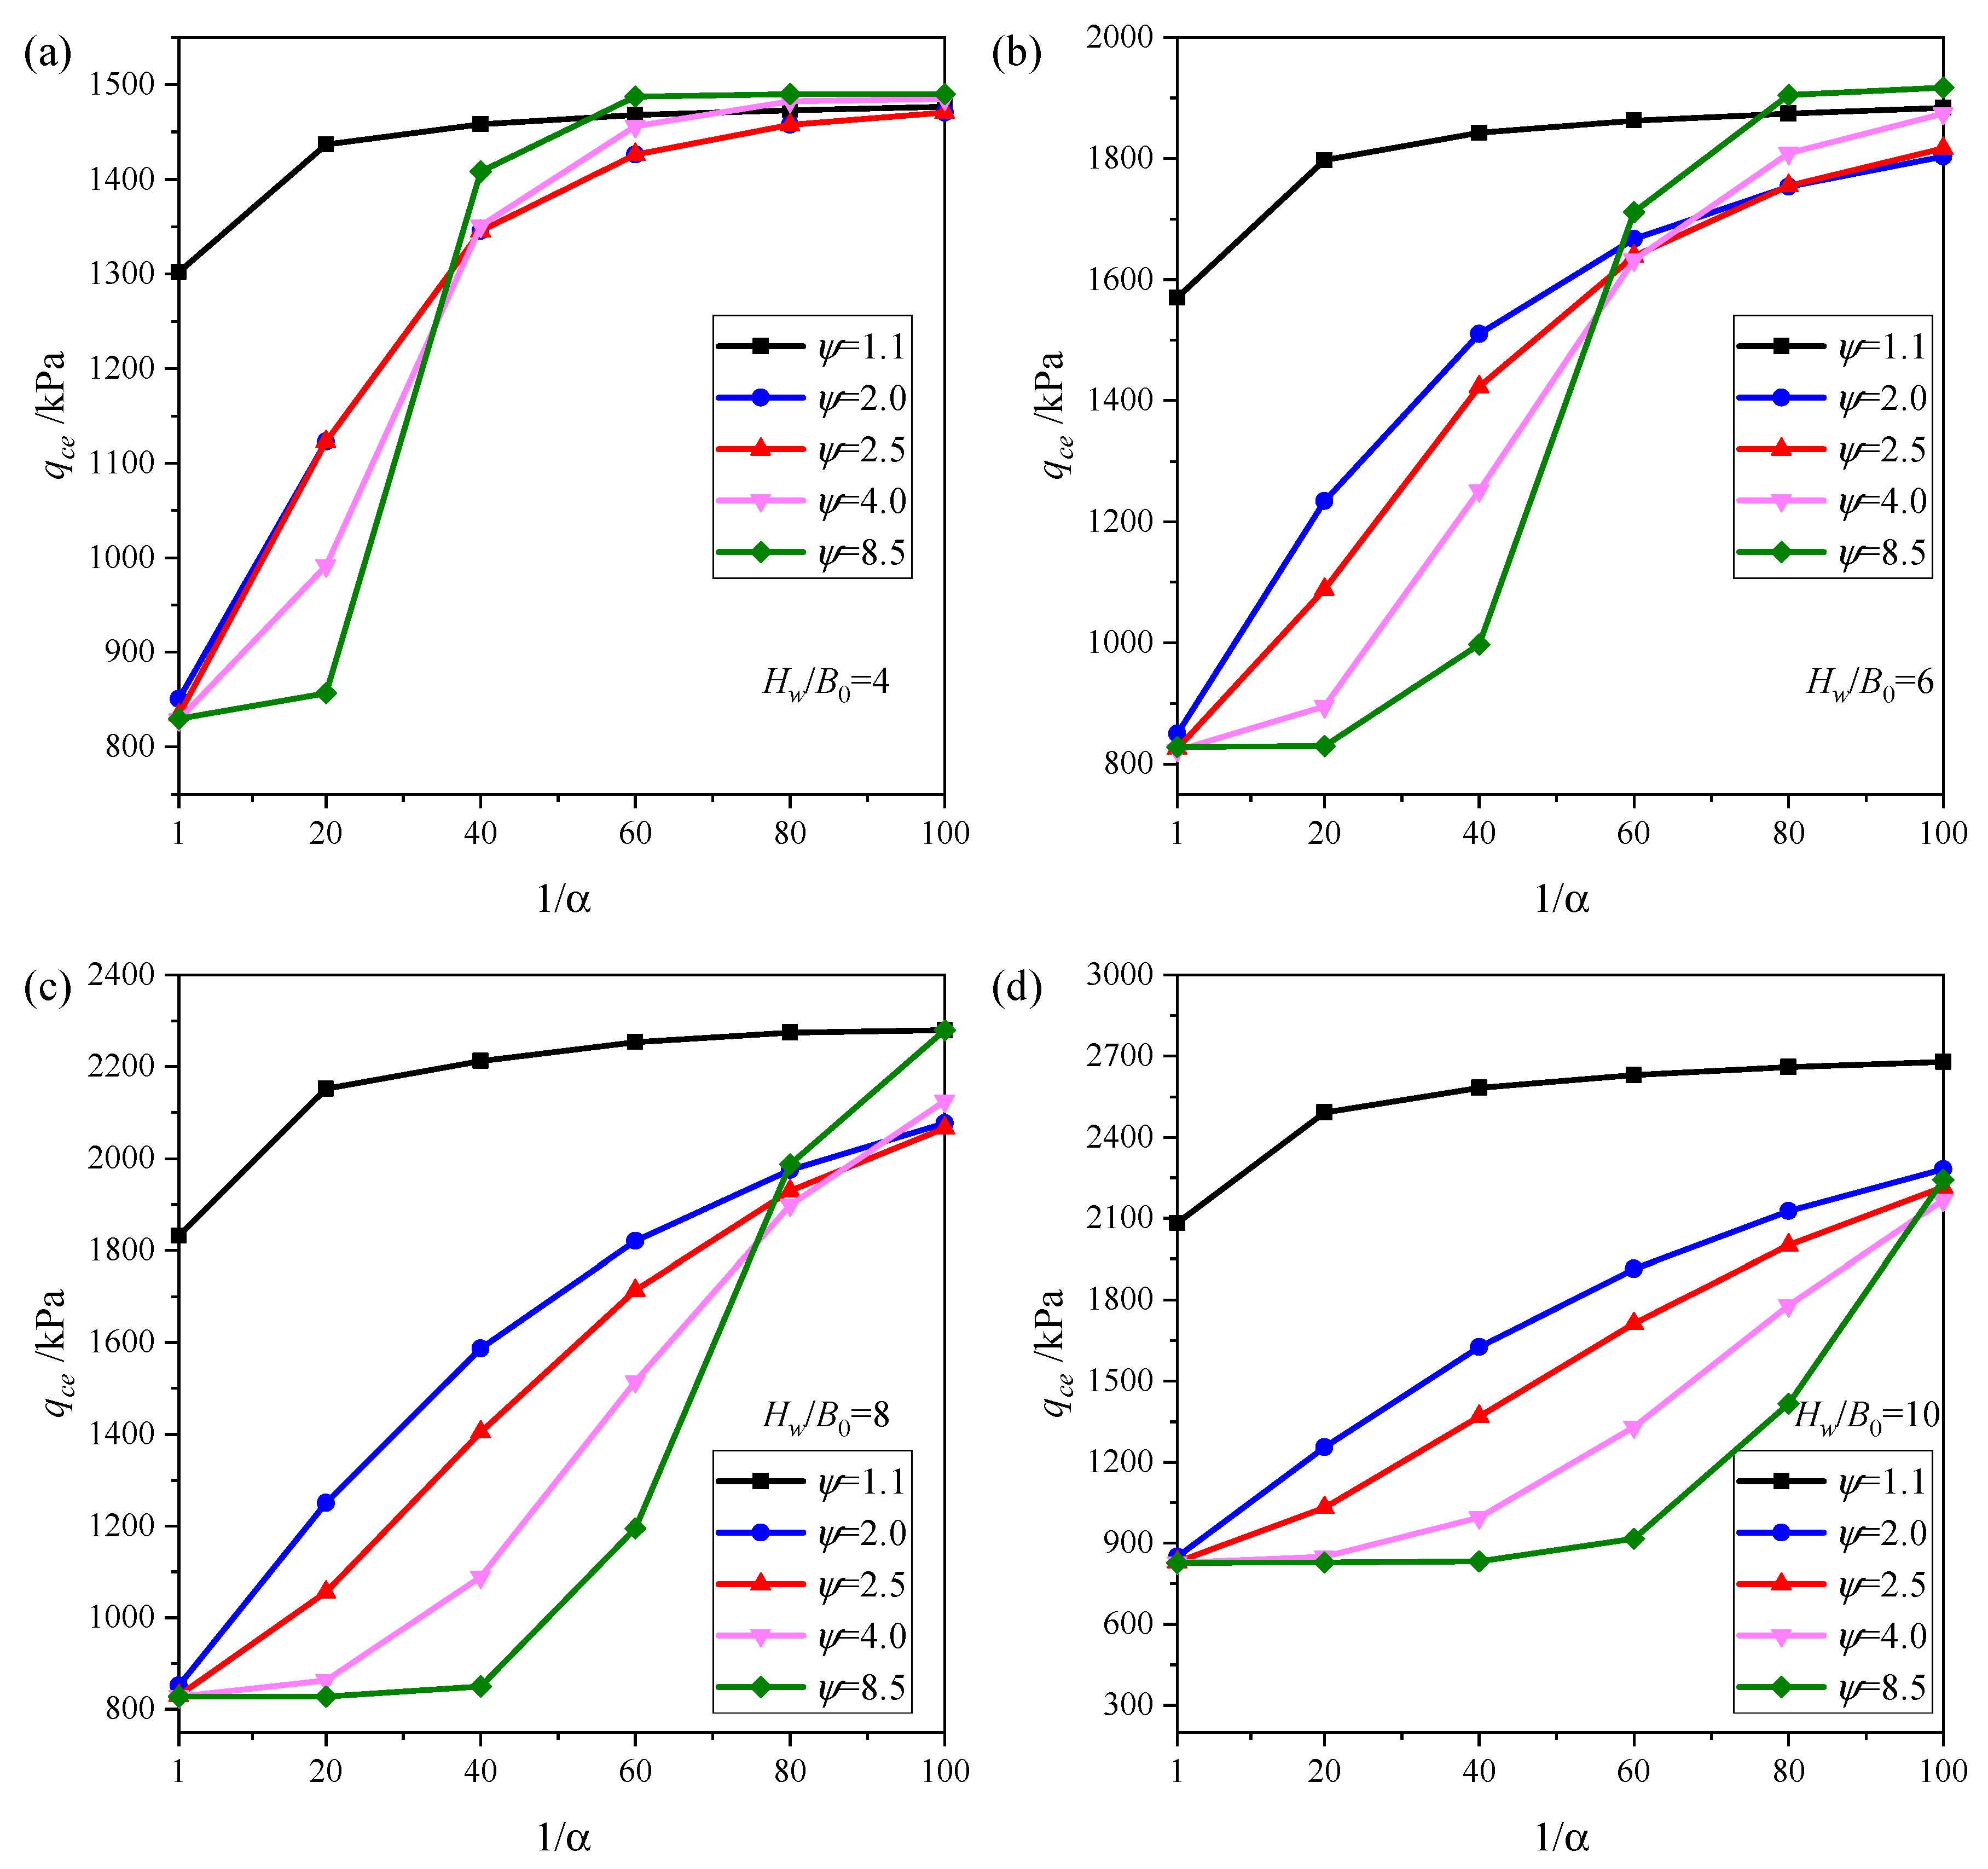
- For different values of , the increases with and eventually converges to a certain range. In addition, the larger is, the more slowly the optimal bearing capacity curve rises. For example, when and , the optimal bearing capacity increases by about 80% when goes from 1 to 100.
Author Contributions
Funding
Data Availability Statement
Conflicts of Interest
Appendix A
References
- Michalowski, R.L. Limit loads on reinforced foundation soils. J. Geotech. Geoenviron. Eng. 2004, 130, 381–390. [Google Scholar] [CrossRef]
- Manna, D.; Santhoshkumar, G.; Ghosh, P. Upper-bound limit load of rigid pavements resting on reinforced soil embankments–Kinematic approach. Transp. Geotech. 2021, 30, 100611. [Google Scholar] [CrossRef]
- Rezai Soufi, G.; Jamshidi Chenari, R.; Bathurst, R.J. Seismic bearing capacity of geosynthetic reinforced strip footings using upper bound limit analysis. Int. J. Geomech. 2022, 22, 04021300. [Google Scholar] [CrossRef]
- Yang, X.L.; Yin, J.H. Upper bound solution for ultimate bearing capacity with a modified Hoek-Brown failure criterion. Int. J. Rock Mech. Min. Sci. 2005, 42, 550–560. [Google Scholar] [CrossRef]
- Liu, J.; Xu, S.; Yang, X.L. Modified pseudo–dynamic bearing capacity of strip footing on rock masses. Comput. Geotech. 2022, 150, 104897. [Google Scholar] [CrossRef]
- Loret, B.; Khalili, N. A three-phase model for unsaturated soils. Int. J. Numer. Anal. Meth. Geomech. 2000, 24, 893–927. [Google Scholar] [CrossRef]
- Vanapalli, S.K.; Mohamed, F.M.O. Bearing capacity and settlement of footings in unsaturated sands. Int. J. Geomech. 2013, 5, 595–604. [Google Scholar] [CrossRef]
- Binquet, J.; Lee, K.L. Bearing capacity tests on reinforced earth slabs. J. Geotech. Eng. Div. 1975, 101, 1241–1255. [Google Scholar] [CrossRef]
- Huang, C.C.; Tatsuoka, F. Bearing capacity of reinforced horizontal sandy ground. Geotext. Geomembr. 1990, 9, 51–82. [Google Scholar] [CrossRef]
- Das, B.M.; Shin, E.C.; Omar, M.T. The bearing capacity of surface strip foundations on geogrid-reinforced sand and clay—A comparative study. Geotech. Geol. Eng. 1994, 12, 1–14. [Google Scholar] [CrossRef]
- Raja, M.N.A.; Shukla, S.K. Experimental study on repeatedly loaded foundation soil strengthened by wraparound geosynthetic reinforcement technique. J. Rock Mech. Geotech. Eng. 2021, 13, 899–911. [Google Scholar] [CrossRef]
- Chen, Q.; Abu-Farsakh, M.; Sharma, R.; Zhang, X. Laboratory investigation of behavior of foundations on geosynthetic-reinforced clayey soil. Transp. Res. Rec. J. Transp. Res. Board 2007, 2004, 28–38. [Google Scholar] [CrossRef]
- Ghazavi, M.; Lavasan, A.A. Interference effect of shallow foundations constructed on sand reinforced with geosynthetics. Geotext. Geomembr. 2008, 26, 404–415. [Google Scholar] [CrossRef]
- Binquet, J.; Lee, K.L. Bearing capacity analysis of reinforced earth slabs. J. Geotech. Eng. Div. 1975, 101, 1257–1276. [Google Scholar] [CrossRef]
- Kumar, A.; Saran, S. Bearing capacity of rectangular footing on reinforced soil. Geotech. Geol. Eng. 2003, 21, 201–224. [Google Scholar] [CrossRef]
- Yamamoto, K.; Otani, J. Bearing capacity and failure mechanism of reinforced foundations based on rigid-plastic finite element formulation. Geotext. Geomembr. 2002, 20, 367–393. [Google Scholar] [CrossRef]
- Maharaj, D.K. Nonlinear finite element analysis of strip footing on reinforced clay. Electron. J. Geotech. Eng. 2003, 8, 241–256. [Google Scholar]
- Izadi, A.; Nalkiashari, L.A.; Payan, M.; Chenari, R.J. Bearing capacity of shallow strip foundations on reinforced soil subjected to combined loading using upper bound theorem of finite element limit analysis and second-order cone programming. Comput. Geotech. 2023, 160, 105550. [Google Scholar] [CrossRef]
- Wang, Z.J.; Jacobs, F.; Ziegler, M.; Yang, G.Q. Visualisation and quantification of geogrid reinforcing effects under strip footing loads using discrete element method. Geotext. Geomembr. 2020, 48, 62–70. [Google Scholar] [CrossRef]
- Chen, J.F.; Bao, N.; Sun, R. Three-dimensional discrete-element-method analysis of behavior of geogrid-reinforced sand foundations under strip footing. Int. J. Geomech. 2022, 22, 04022134. [Google Scholar] [CrossRef]
- Nazeeh, K.M.; Sivakumar Babu, G.L. Reliability-based design of geogrid reinforced soil foundation using kriging surrogates. Geosynth. Int. 2022, 30, 350–363. [Google Scholar] [CrossRef]
- Banović, I.; Radnić, J.; Grgić, N. Geotechnical seismic isolation system based on sliding mechanism using stone pebble layer: Shake-table experiments. Shock. Vib. 2019, 2019, 9346232. [Google Scholar] [CrossRef]
- Su, L.; Lu, J.; Elgamal, A.; Arulmoli, A.K. Seismic performance of a pile-supported wharf: Three-dimensional finite element simulation. Soil Dyn. Earthq. Eng. 2017, 95, 167–179. [Google Scholar]
- Forcellini, D.; Alzabeebee, S. Seismic fragility assessment of geotechnical seismic isolation (GSI) for bridge configuration. Bull. Earthq. Eng. 2023, 21, 3969–3990. [Google Scholar] [CrossRef]
- Mortazavi Bak, H.; Noorbakhsh, M.; Halabian, A.M.; Rowshanzamir, M.; Hashemolhosseini, H. Application of the Taguchi method to enhance bearing capacity in geotechnical engineering: Case studies. Int. J. Geomech. 2021, 21, 04021167. [Google Scholar] [CrossRef]
- Zhang, L.L.; Fredlund, D.G.; Fredlund, M.D.; Wilson, G.W. Modeling the unsaturated soil zone in slope stability analysis. Can. Geotech. J. 2014, 51, 1384–1398. [Google Scholar] [CrossRef]
- Fredlund, D.G.; Morgenstern, N.R.; Widger, R.A. The shear strength of unsaturated soils. Can. Geotech. J. 1978, 15, 313–321. [Google Scholar] [CrossRef]
- Oloo, S.Y.; Fredlund, D.G.; Gan, J.K.M. Bearing capacity of unpaved roads. Can. Geotech. J. 1997, 34, 398–407. [Google Scholar] [CrossRef]
- Costa, Y.D.; Cintra, J.C.; Zornberg, J.C. Influence of matric suction on the results of plate load tests performed on a lateritic soil deposit. Can. Geotech. J. 2003, 2, 219–226. [Google Scholar]
- Vanapalli, S.K.; Mohamed, F.M.O. Bearing capacity of model footings in unsaturated soils. In Experimental Unsaturated Soil Mechanics; Schanz, T., Ed.; Springer: Berlin/Heidelberg, Germany, 2007; pp. 483–493. [Google Scholar]
- Oh, W.T.; Vanapalli, S.K. Modelling the applied vertical stress and settlement relationship of shallow foundations in saturated and unsaturated sands. Can. Geotech. J. 2011, 48, 425–438. [Google Scholar] [CrossRef]
- Lu, N.; Likos, W.J. Suction stress characteristic curve for unsaturated soil. J. Geotech. Geoenviron. Eng. 2006, 132, 131–142. [Google Scholar]
- Lu, N.; Godt, J.W.; Wu, D.T. A closed-form equation for effective stress in unsaturated soil. Water Resour. Res. 2010, 46, 8646. [Google Scholar]
- Vahedifard, F.; Robinson, J.D. Unified Method for Estimating the Ultimate Bearing Capacity of Shallow Foundations in Variably Saturated Soils under Steady Flow. J. Geotech. Geoenviron. Eng. 2016, 142, 1445. [Google Scholar]
- Du, D.; Zhuang, Y.; Sun, Q.; Yang, X.; Dias, D. Bearing capacity evaluation for shallow foundations on unsaturated soils using discretization technique. Comput. Geotech. 2021, 137, 104309. [Google Scholar]
- Xu, S.; Zhou, D. Seismic Bearing Capacity Solution for Strip Footings in Unsaturated Soils with Modified Pseudo-Dynamic Approach. Mathematics 2023, 11, 2692. [Google Scholar]
- Yang, X.L.; Huang, F. Collapse mechanism of shallow tunnel based on nonlinear Hoek–Brown failure criterion. Tunn. Undergr. Space Technol. 2011, 26, 686–691. [Google Scholar] [CrossRef]
- Yang, X.L.; Li, L.; Yin, J.H. Seismic and static stability analysis for rock slopes by a kinematical approach. Geotechnique 2004, 54, 543–549. [Google Scholar]
- Yang, X.L.; Wang, J.M. Ground movement prediction for tunnels using simplified procedure. Tunn. Undergr. Space Technol. 2011, 26, 462–471. [Google Scholar]
- Hou, C.T.; Zhong, J.H.; Yang, X.L. Three-dimensional stability assessments of a non-circular tunnel face reinforced by bolts under seepage flow conditions. Tunn. Undergr. Space Technol. 2023, 131, 104831. [Google Scholar]
- Hu, Y.N.; Ji, J.; Sun, Z.B.; Dias, D. First order reliability-based design optimization of 3D pile-reinforced slopes with Pareto optimality. Comput. Geotech. 2023, 162, 105635. [Google Scholar]
- Gardner, W.R. Some steady-state solutions of the unsaturated moisture flow equation with application to evaporation from a water table. Soil Sci. 1958, 85, 228–232. [Google Scholar]
- Soubra, A. Upper-bound solutions for bearing capacity of foundations. J. Geotech. Geoenviron. Eng. 1999, 125, 59–68. [Google Scholar]
- Kumar, J.; Sahoo, J.P. Bearing capacity of strip foundations reinforced with geogrid sheets by using upper bound finite-element limit analysis. Int. J. Numer. Anal. Methods Geomech. 2013, 37, 3258–3277. [Google Scholar]
- Kondrakhin, V.P.; Martyushev, N.V.; Klyuev, R.V.; Sorokova, S.N.; Efremenkov, E.A.; Valuev, D.V.; Mengxu, Q. Mathematical Modeling and Multi-Criteria Optimization of Design Parameters for the Gyratory Crusher. Mathematics 2023, 11, 2345. [Google Scholar]
- Negrin, I.; Kripka, M.; Yepes, V. Metamodel-assisted meta-heuristic design optimization of reinforced concrete frame structures considering soil-structure interaction. Eng. Struct. 2023, 293, 116657. [Google Scholar]


| Soil Types | |||||
|---|---|---|---|---|---|
| Clay | 0.005 | 2 | 10 | 18 | |
| Silt | 0.01 | 2 | 10 | 18 | |
| Loess | 0.025 | 4 | 0 | 18 | |
| Sand | 0.1 | 4 | 0 | 18 |
| Reduction (%) | ||
|---|---|---|
| 5 | 543.726 | |
| 6 | 171.674 | 68.43 |
| 7 | 128.795 | 24.98 |
| 8 | 122.934 | 4.55 |
| 9 | 121.572 | 1.11 |
| 10 | 120.993 | 0.48 |
| 11 | 120.580 | 0.34 |
| 12 | 120.270 | 0.26 |
| 13 | 120.032 | 0.20 |
| 14 | 119.844 | 0.16 |
| 15 | 119.694 | 0.13 |
| (°) | ||||||
|---|---|---|---|---|---|---|
| Soubra (1999) [42] | This Paper | Soubra (1999) [42] | This Paper | Soubra (1999) [42] | This Paper | |
| 0 | - | 1.00 | 1.00 | 5.15 | 5.42 | |
| 5 | - | 1.57 | 1.59 | 6.50 | 6.70 | |
| 10 | - | 2.47 | 2.50 | 8.36 | 8.53 | |
| 15 | 1.95 | 1.94 | 3.95 | 3.98 | 10.99 | 11.12 |
| 20 | 4.49 | 4.48 | 6.41 | 6.43 | 14.86 | 14.93 |
| 25 | 9.81 | 9.80 | 10.69 | 10.69 | 20.77 | 20.77 |
| 30 | 21.51 | 21.49 | 18.46 | 18.44 | 30.24 | 30.22 |
| 35 | 49.00 | 48.96 | 33.44 | 33.40 | 46.33 | 46.28 |
| 40 | 119.84 | 119.69 | 64.58 | 64.48 | 75.77 | 75.65 |
| 45 | 326.59 | 326.05 | 135.99 | 135.70 | 134.99 | 134.70 |
| 50 | 1042.48 | 1040.07 | 322.88 | 321.90 | 270.09 | 269.26 |
Disclaimer/Publisher’s Note: The statements, opinions and data contained in all publications are solely those of the individual author(s) and contributor(s) and not of MDPI and/or the editor(s). MDPI and/or the editor(s) disclaim responsibility for any injury to people or property resulting from any ideas, methods, instructions or products referred to in the content. |
© 2023 by the authors. Licensee MDPI, Basel, Switzerland. This article is an open access article distributed under the terms and conditions of the Creative Commons Attribution (CC BY) license (https://creativecommons.org/licenses/by/4.0/).
Share and Cite
Kang, X.; Zhou, D. Analytical Solution for Bearing Capacity of Reinforced Strip Footings on Unsaturated Soils under Steady Flow. Mathematics 2023, 11, 3746. https://doi.org/10.3390/math11173746
Kang X, Zhou D. Analytical Solution for Bearing Capacity of Reinforced Strip Footings on Unsaturated Soils under Steady Flow. Mathematics. 2023; 11(17):3746. https://doi.org/10.3390/math11173746
Chicago/Turabian StyleKang, Xudong, and De Zhou. 2023. "Analytical Solution for Bearing Capacity of Reinforced Strip Footings on Unsaturated Soils under Steady Flow" Mathematics 11, no. 17: 3746. https://doi.org/10.3390/math11173746
APA StyleKang, X., & Zhou, D. (2023). Analytical Solution for Bearing Capacity of Reinforced Strip Footings on Unsaturated Soils under Steady Flow. Mathematics, 11(17), 3746. https://doi.org/10.3390/math11173746