Article

Cervical Precancerous Lesion Image Enhancement Based on Retinex and Histogram Equalization

1
School of Integrated Circuits, Anhui University, Hefei 230601, China
2
Anhui Engineering Laboratory of Agro-Ecological Big Data, Hefei 230601, China
*
Author to whom correspondence should be addressed.
Mathematics 2023, 11(17), 3689; https://doi.org/10.3390/math11173689
Submission received: 23 July 2023 / Revised: 16 August 2023 / Accepted: 22 August 2023 / Published: 28 August 2023
(This article belongs to the Special Issue New Advances and Applications in Image Processing and Computer Vision)

Abstract

:
Cervical cancer is a prevalent chronic malignant tumor in gynecology, necessitating high-quality images of cervical precancerous lesions to enhance detection rates. Addressing the challenges of low contrast, uneven illumination, and indistinct lesion details in such images, this paper proposes an enhancement algorithm based on retinex and histogram equalization. First, the algorithm solves the color deviation problem by modifying the quantization formula of retinex theory. Then, the contrast-limited adaptive histogram equalization algorithm is selectively conducted on blue and green channels to avoid the problem of image visual quality reduction caused by drastic darkening of local dark areas. Next, a multi-scale detail enhancement algorithm is used to further sharpen the details. Finally, the problem of noise amplification and image distortion in the process of enhancement is alleviated by dynamic weighted fusion. The experimental results confirm the effectiveness of the proposed algorithm in optimizing brightness, enhancing contrast, sharpening details, and suppressing noise in cervical precancerous lesion images. The proposed algorithm has shown superior performance compared to other traditional methods based on objective indicators such as peak signal-to-noise ratio, detail-variance–background-variance, gray square mean deviation, contrast improvement index, and enhancement quality index.

1. Introduction

Ranked fourth in terms of both incidence and mortality, cervical cancer contributes significantly to the high number of female fatalities [1]. Fortunately, practice shows that the process from cervical precancerous lesions to invasive cancer can persist for 10–15 years [2]. In other words, early detection is of great importance for prognosis and treatment. With the development of colposcopy technology, colposcopy has been considered a main auxiliary approach to diagnose cervical intraepithelial lesions and can effectively improve the detection rate of cervical cancer [3]. However, due to the diversity of different vaginal internal environments and the limitations of human internal imaging technology, colposcopic images often have problems such as low contrast, uneven illumination, and blurred details. These problems will directly affect the accuracy of diagnosis. Theoretically, there are two ways to solve these problems with colposcopic images. One is to improve the hardware for colposcopy, but upgrading equipment often means high costs. The other is to use image processing technology, which could optimize the colposcopy image visual effect efficiently with a low cost. Medical image enhancement technology can not only improve the diagnosis rate of diseases, but also greatly help other subsequent medical image analysis tasks, such as specific structure segmentation, medical image classification, focus detection, and computer-aided diagnosis. Therefore, the development of medical image processing technology is very important. Over the decades, researchers have proposed a number of medical image enhancement methods.
These methods can be divided into two categories: traditional medical image enhancement methods and deep-learning-based medical image enhancement methods. Furthermore, traditional medical image enhancement algorithms can be divided into spatial-domain-based enhancement methods and frequency-domain-based enhancement methods according to different scopes of image processing [4]. Medical image enhancement methods based on the spatial domain mainly include histogram algorithms [5,6,7,8,9], filter algorithms [10,11,12,13,14], and algorithms based on retinex theory [15,16,17,18,19]. The medical image enhancement algorithm based on the frequency domain converts the image from the spatial domain to the frequency domain and enhances the image with a frequency domain filter. It mainly includes the enhancement algorithm based on the Fourier transform, wavelet transform, and local statistics [20,21,22,23,24]. Deep learning [25,26,27] technology has recently been developing rapidly in the field of medical image enhancement. It mainly uses convolutional neural networks, autoencoders, and generative adversarial networks to learn and enhance image features and has outstanding performance in image detail enhancement and color preservation. However, in the field of medical image enhancement, due to the different manifestations of different diseases, enhancement algorithms need to be targeted. Overall, there are few studies on images of cervical precancerous lesions. It should be noted that the doctor mainly makes a diagnosis based on the color, thickness, margin, and blood vessel morphology of the vinegar white epithelium after the acetic acid staining test during colposcopy. Thus, this paper proposed an enhancement method for cervical precancerous lesion images based on retinex and histogram equalization. Experimental results show that the proposed method has good effects on contrast enhancement, detail sharpening, color preservation, and noise reduction. Under the current situation, doctors are in urgent need of high-quality cervical lesion images, but the relevant research work is very few; the study of this paper is helpful for the diagnosis of cervical precancerous lesions and related computer-assisted therapy.
The primary works of this paper are as follows:
  • This paper introduces the channel peak ratio and average brightness into the quantization formula of retinex, effectively improving the issue of color distortion in the multi-scale retinex (MSR) algorithm when processing cervical precancerous lesion images. The improved MSR achieves the preliminary goal of image enhancement in a simple and efficient manner.
  • This paper selectively applies the contrast-limited adaptive histogram equalization (CLAHE) algorithm to the blue and green channels, which contain more detailed information, to improve the contrast between lesion areas and the background without excessive enhancement.
  • Based on the characteristics of cervical precancerous lesion images, this paper selectively adopts a pixel-based dynamic weighted fusion strategy to fuse the enhanced image with the original image. This approach effectively preserves details while reducing the amplification of noise during the image enhancement process.
The other parts of this paper are as follows: the second part introduces the related work and research status in the field of medical image enhancement; the third part describes the method proposed in detail; the fourth part includes experiments that are compared with traditional medical image enhancement algorithms; finally, the conclusion of this paper is drawn in the fifth part.

2. Related Work

In traditional medical image enhancement algorithms, histogram equalization (HE) [28] is one of the most commonly used methods. It is good at enhancing the image contrast by using a transformation function to make pixels of the output image relatively uniformly distributed. However, it usually leads to noise amplification and excessive enhancement problems. As a result, a contrast-limited adaptive histogram equalization (CLAHE) method [9] is proposed, which processes the image in blocks and uses a threshold to limit the contrast. Similarly, by introducing mean and variance to divide the image, a quad-histogram equalization algorithm [6] is proposed to avoid excessive enhancement. Chang et al. [29] proposed automatic contrast-limited adaptive histogram equalization with a dual gamma correction algorithm. This method redistributes the histogram of CLAHE blocks according to the dynamic range of each block and then uses double gamma correction to enhance the brightness, which effectively improves the contrast and brightness of the image. Subramani et al. [30] applied the fuzzy gray difference histogram equalization algorithm to MRI image enhancement, and it provided a clear path for the effective analysis of fine details and infected parts. Histogram-based algorithms need to be improved according to the characteristics of the processed images to achieve a relative balance in contrast, detail, and noise. Retinex theory [31] estimates and filters the incident component of the original image to decompose the reflected component that retains the original information of the substance itself to achieve image enhancement. Based on retinex theory, researchers successively proposed single-scale retinex (SSR) [32] and multi-scale retinex (MSR) [33] algorithms. MSR theory can overcome the problem of missing detail to a certain extent, but it still suffers from color deviation, local unbalanced enhancement, and the “halo” effect. Therefore, the researchers proposed multi-scale retinex with a color restoration algorithm (MSRCR) [34]. Although the algorithm can effectively improve the color deviation problem, the introduction of multiple experimental parameters increases the complexity and uncertainty of the algorithm. Fu et al. [35] proposed a weighted variational model to estimate the reflectance and light component of the image at the same time. In addition, for the purpose of optimizing the naturalness, the corrected light component is added to the reflection component. To further preserve the detail and color of the image, Wang et al. [36] used a guided filter to estimate the light component and then made use of bilateral gamma correction to adjust the image. The downside of this method is the unsatisfactory visual brightness. Based on the retinex theory, Wang et al. [37] introduced the inverse square law of illumination and proposed an algorithm for endoscope image enhancement with satisfactory brightness correction. The wavelet transform is derived from the Fourier transform and has a good ability to process and analyze local signals by adjusting the time and frequency resolution scale of the signals. Yang Y et al. [38] proposed an image enhancement method using the wavelet transform and Harr transform. They made use of the Harr transform to decompose all of the high-frequency images and enhanced the high-frequency component with different weights. It can enhance the details efficiently but becomes very computationally complex. In the method that is based on the improvement correction strategy in the wavelet transform domain [39], low-frequency components were processed by the improved gamma algorithm and the details were enhanced by the fuzzy contrast function. Image fusion is a highly effective visual correction technology that enables the integration of complementary advantages from various medical images. By fusing medical images, we can enhance image sharpness, eliminate noise and redundancy, and amplify distinctive image features. Thus, in recent years, many researchers have used image fusion technology to enhance medical images. Li et al. [40] categorized focused regions and unfocused regions with sparse coefficients and then combined them with a guided filter to implement image fusion, which effectively reduced the halo effect. To preserve the structural and textural information of the image, Chen et al. [41] proposed a novel medical image fusion method based on a rolling guidance filter. In addition, metaheuristic algorithms have been widely used in medical image enhancement due to their distinct advantages in multi-objective problem solving and parameter optimization. Daniel et al. [42] combined an enhanced cuckoo search algorithm with the optimum wavelet to enhance the contrast of medical images and achieved results worthy of reference. Zhou et al. [43] proposed a novel optimized method for medical image enhancement based on an improved shark smell optimization algorithm.
For deep-learning-based medical image enhancement algorithms, enhancement and denoising of low-dose CT images are fields in which deep neural networks are applied intensively. Xia et al. [27] proposed a novel algorithm aimed at low-dose CT images. Enhancement was introduced into a deep neural network consisting of multiple alternating enhancement modules and reverse projection modules. In the endoscopic image enhancement network, researchers used transfer learning to train a decomposed network model based on retinex theory and proposed a self-attention guided multi-scale pyramid network to obtain a satisfactory illumination component [44]. In contrast to fully supervised learning frameworks, some approaches apply unsupervised learning techniques to train neural network models without explicit labeling of training pairs. For example, an efficient unsupervised generative adversarial network was proposed to make the neural network free from data training [45]. It is characterized by the usage of information extracted from the input itself to regulate unpaired training. Fan et al. [46] built a decomposition network based on retinex theory and used a conditional generation network as the enhancement network. The method added a conditional entropy distance loss to prevent overfitting in the training process and achieved a good visual effect. However, medical image enhancement algorithms based on deep learning need the support of reliable and high-quality data sets and computational resources. On the other hand, its experimental results lack interpretability, which means insufficient reliability in medical diagnosis.

3. Methods

The object of this study is the imaging of cervical precancerous lesions taken by colposcope after acetic acid staining test. In Figure 1, acetic acid staining images of non-lesion, low-grade, and high-grade cervical precancerous lesions are shown from left to right. As shown in Figure 1a, the healthy cervical epidermis was smooth and was not stained by acetic acid. In the image of low-grade cervical precancerous lesions in the middle, the vinegar white epithelium (an abnormal colposcopic manifestation of whitening of the dense nuclear area after acetic acid application) presents a translucent and thin white state, and the lesion area is accompanied by small, punctured vessels or small mosaics. In the image of high-grade cervical precancerous lesions on the right, the vinegar white epithelium often presents a dense and strong white state, and the lesion area has thick punctate vessels and extensive irregular mosaic. In addition, the highly diseased cervical epidermis may even bleed or generate large, atypical blood vessels. In view of the above, the core of cervical precancerous lesion image enhancement is to enhance the vinegar white epithelium, vascular morphology, and lesion margins.
Figure 2 shows the overall flow of the proposed algorithm. The whole process mainly includes four parts. The execution sequence of these four parts will affect the final image quality to some extent. However, our proposed scheme, with the current order of algorithms, consistently achieved superior efficiency and performance compared to other combinations. First, the input image is decomposed into R, G, and B channels, and then the improved MSR algorithm is applied to each of the three channels to achieve preliminary enhancement of brightness, detail, and contrast. Next, the CLAHE algorithm, which introduces adaptive shear values, is applied to the G and B channels to further stretch the contrast. The R, G, and B channels are merged, and then the details are sharpened to further highlight the lesion features. Finally, to suppress noise, dynamic weighted fusion is implemented between the original image and the image after detail boosting. The proposed algorithm can effectively improve the quality of cervical precancerous lesion images and is described in detail below.

3.1. Enhancement Based on the Improved MSR

The retinex theory aims to enhance image brightness on the basis of optimizing the edges. According to this theory, a visual image can be divided into two components: the incident light component and the object reflection component. The reflection component is responsible for defining the inherent properties of the object. Therefore, the core of retinex theory is to remove the influence of the incident light component and preserve the reflection component. The MSR algorithm [33] is proposed on the basis of the SSR algorithm [32], and it combines the results of multi-scale Gaussian filter to compensate for the possible halo phenomenon and compensate for the absence of a light component. The formula is as follows:
log R x , y = k = 1 K ω k log R i x , y = k = 1 K ω k log S i x , y l o g ( L i ( x , y ) )
where S x , y is the visual image, R ( x , y ) is the reflection component, L ( x , y ) is the incident light component, k represents three different Gaussian surround function scales, i represents one of the channels from the R, G, B color space in the image, and ω k represents the weights corresponding to a three-scale Gaussian surround function. Generally, the value of each weight is one third.
The MSR algorithm needs to quantify the pixels to the range of 0–255 at the end. The quantization formula is as follows:
R M S R i x , y = V a l u e M i n M a x M i n 255 0
where V a l u e , M i n , and M a x are the pixel value, minimum, and maximum of log R x , y , respectively, and R M S R i x , y is the output image by the MSR algorithm.
However, linear quantization is much smoother than exponential curves. This causes the difference between the channels to be greatly reduced, which leads to color distortion of the output image. In this case, the MSRCR algorithm [34] is developed to adjust the color distortion resulting from the local enhancement of the image by adding a color recovery factor. The color recovery factor solves color problems by adjusting the proportional relationship among the three channels. It is expressed as follows:
R M S R C R i x , y = C i x , y R M S R i x , y
where i still represents one of the channels from the R, G, B color space in the image, and C i x , y is the color recovery factor of the i channel, which is used to adjust the ratio of the three channels.
Figure 3b,c are images processed by MSR and MSRCR, respectively. The MSRCR algorithm can repair the image color to a certain extent, but the processed image is still slightly white overall. The root cause of color distortion in the MSR algorithm is that the unified linear quantization reduces the dynamic range of pixels and the difference between each channel. Therefore, the problem of color distortion can be solved by modifying the quantization formula. In this paper, the ratio of the peak value of each channel to the sum of peak values for the three channels is introduced into the quantization formula. The average pixel value of the input image is used as the brightness compensation. The image processed by the improved MSR algorithm is shown in Figure 3d, whose color effect is the best among Figure 3b–d. The quantization formula is modified as follows:
R x , y = i R , G , B φ I p i I p R + I p G + I p B V a l u e i + I m e a n
where I p is the peak value of each channel, I m e a n is the average pixel of the input image, V a l u e i represents the pixel, and φ is a control parameter, which is set to 500. In the course of the experiment, a value exceeding 255 should be set to 255 to prevent overflow.
Compared with the MSRCR algorithm, the improved MSR algorithm can solve the color distortion problem existing in retinex theory more effectively. At the same time, it introduces only one control parameter, which means that higher quality images are obtained in a simpler way.

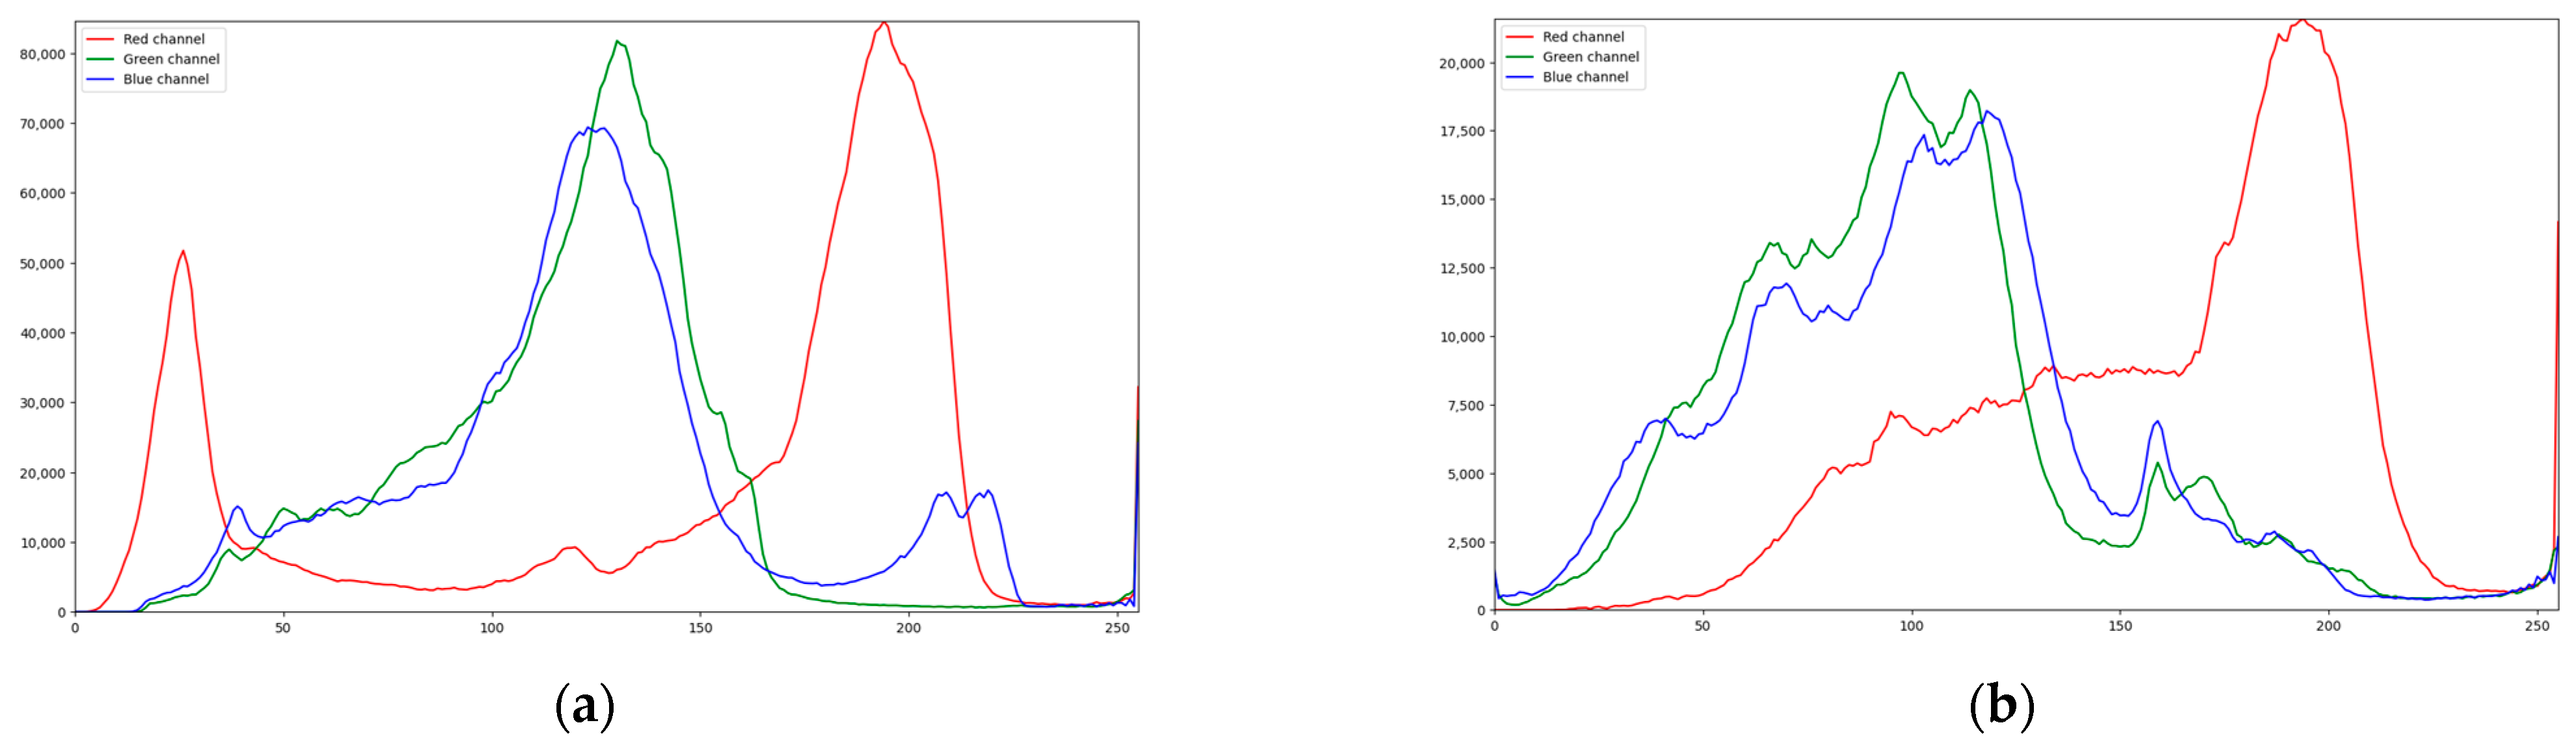
3.2. Enhancement Based on CLAHE

To further observe the acetowhite epithelium of the cervical precancerous lesion image, stretching the contrast is of great significance. Histogram equalization is the most commonly used contrast stretching algorithm. Its main idea is to adjust the distribution of the histogram to an approximately uniform distribution. It utilizes the cumulative density function of the image to improve the overall contrast. The cumulative distribution function is shown as follows:
S m = j = 0 m n j n ,   m = 1 ,   2 ,   ,   L 1
where m represents the gray level, n is the sum of the pixel number in the image, n j is the number of pixels in the current gray level, and L is the number of possible gray levels in the image. Using the cumulative distribution function, the pixels of the enhanced image can be calculated by the following formula:
p m = L 1 j = 0 m n j n ,   m = 1 ,   2 ,   ,   L 1
The global histogram equalization algorithm will lose details in the local bright or dark regions and amplify the global noise. The CLAHE algorithm [9] divides the image into several subregions for histogram equalization and introduces the clipping threshold to limit noise amplification. The detailed algorithm steps are shown as follows:
  • The input image is divided into 8 × 8 nonoverlapping subblocks, each of which contains M pixels;
  • Compute the histogram of the subblocks;
  • Set the clipping threshold;
  • For each subblock, use the excess pixels from the previous step to reallocate;
  • Each subblock is histogram-equalized;
  • The bilinear interpolation method is used to reconstruct the pixels.
In the CLAHE algorithm, the clipping threshold is proportional to the degree of contrast stretching. However, if the clipping threshold is too large, it will lead to excessive enhancement of the bright area. Thus, the clipping threshold is set to 1.4. Figure 4 shows the corresponding histograms of Figure 1b,c. It can be seen that the histograms of the G and B channels are similar, and the pixels are mostly concentrated in the range of 50 to 150. The pixels in the R channel are mostly concentrated in the range of 150 to 250. The distribution is related to the light absorption characteristics of the human mucosa. The blue and green channels in the images contain more detailed information about the blood vessels [47].
Figure 5 shows the B-channel image, G-channel image, and R-channel image for Figure 1b. Figure 6 shows the B-channel image, G-channel image, and R-channel image for Figure 1c. It is found that there are more details in the blue and green channels of cervical precancerous lesion images. According to Figure 4, Figure 5 and Figure 6, this paper applies CLAHE only to the G and B channels.
Figure 7 shows the results of performing the CLAHE on the R, G, B channels and G, B channels. It is found that if the R, G, B channels are all stretched, the local dark area in the image will darken sharply, which seriously affects the visual effect of the image. According to Figure 4, the local image darkening is caused by the fact that the pixels of the red channel are too concentrated in the range of 150–250, so that the pixels of the red channel are overstretched. By contrast, it can be seen that images created through the CLAHE algorithm on the G, B channels have a better visual effect.

3.3. Enhancement Based on Multi-Scale Detail Boosting

The details need to be boosted for the purpose of highlighting the local vascular morphology. In this paper, a multi-scale detail enhancement algorithm [48] is used to optimize the visual effects of local details by adding high-frequency components to the input image. A main advantage of the method is that it will not lead to halo or excessive saturation problems when boosting details. First, the input image is convolved with three Gaussian kernels of different scales to obtain blurred images. It is shown as follows:
B 1 = G 1 I * , B 2 = G 2 I * , B 3 = G 3 I * ,
where G 1 , G 2 , and G 3 are the Gaussian kernels with the corresponding standard deviations σ 1 = 1.0 , σ 2 = 2.0 , and σ 3 = 4.0 , respectively. Then, fine details D 1 , medium details D 2 , and rough details D 3 can be obtained according to the following formula:
D 1 = I * B 1 , D 2 = B 1 B 2 , D 3 = B 2 B 3
Next, the three detail images are weighted merged to obtain the overall detail image. It is shown as follows:
D * = 1 λ 1 sgn D 1 D 1 + λ 2 D 2 + λ 3 D 3 , λ 1 = 0.5 , λ 2 = 0.5 , λ 3 = 1.0 ,
where λ 1 , λ 2 , and λ 3 are the merged weights corresponding to the three detailed images. It should be noted that fine detail may lead to partial gray level saturation. Therefore, the multi-scale detail boosting algorithm uses the step function to reduce the positive component while enlarging the negative component. The step function is given by the following formula:
sgn x = 1 , x > 0 0 , x = 0 1 , x < 0
Through the compensation strategy, the balance of detail enhancement and saturation inhibition can be achieved. Finally, the overall detail image is added to the input image in this section.

3.4. Enhancement Based on Dynamic Weighted Fusion

Pixel-based fusion is the most basic fusion method and it shows unique advantages in details, edges, color optimization, and noise reduction. In this paper, the original image and the detail-enhanced image are dynamically weighted and fused based on pixels, to suppress noise and reduce distortion. Generally, precancerous lesions start from the opening of the cervix and spread outward. Colposcopy is aimed at the opening of the cervix to obtain images. It means that in the area near the opening of the cervix, more detailed information should be fused so that the doctor can make a correct diagnosis. Therefore, the fusion weights should change dynamically based on the distance between the pixel and the center of the image. The fusion strategy proposed in this paper can be given by the following formulas:
d i , j = i c x 2 + j c y 2
η i , j = d i , j c x 2 + c y 2 ρ
I f i , j = η i , j I o r i ( i , j ) + 1 η i , j I m b ( i , j )
where d i , j is the distance from position ( i , j ) to the image center, c x and c y represent the position of the image center, η i , j is the weight of the original image when fusing, I f i , j is the fused image, and I m b ( i , j ) is the detail-enhanced image, while ρ is a fixed parameter that is set to 3 based on the experimental results. According to the above fusion strategy, the weight of the original image is smaller in areas near the center of the image and larger in areas away from the center of the image. The weight of the detail-enhanced image changes in the opposite way. Under the pixel-based dynamic weighted fusion method, the image noise is effectively suppressed, and the details are well preserved.

4. Experimental Results and Discussion

In this section, the effectiveness of the proposed algorithm is verified by comparing the experimental results with those of six other traditional medical image enhancement algorithms. First, the setup of the experiment is introduced in Section 4.1. Then, the selection of parameters involved in the algorithm is introduced in Section 4.2. Finally, the experimental results are analyzed in Section 4.3.

4.1. Experimental Setup

The experimental operating system was Windows 10, 64-bit. Visual Studio 2017 and Visual Studio Code were used. To verify the applicability of the proposed algorithm to cervical precancerous lesion images, four images of cervical precancerous lesions from low to high lesion grades were selected as input images, as shown in Figure 6.
In Figure 8, Img1 and Img2 belong to low-grade lesions, while Img3 and Img4 belong to high-grade lesions. Img1 contains almost invisible vinegar white epithelium and small vascular mosaic. In Img2, a relatively thick vinegar white epithelium and a small number of tiny, punctured blood vessels near the cervical opening can be seen. In Img3, obvious vinegar white epithelium can be observed, with large and small punctured blood vessels distributed in the range of vinegar white epithelium, and some atypical blood vessels in development can be seen. The vinegar white epithelium in Img4 is very dense, while a large vascular mosaic and some obscure punctured vessels can be clearly seen.
Then, this paper selected MSR, MSRCR, image enhancement algorithm of electronic medical endoscope based on singular value equalization (IESVE) [49], endoscopic image enhancement algorithm based on luminance correction and fusion channel prior (LCLCP) [50], and research on endoscopic image enhancement algorithm based on contrast fusion (IECF) [51] to carry out comparative experiments. Starting from subjective and objective aspects, this paper used full-reference metrics and no-reference metrics for comprehensive evaluation.
The peak signal-to-noise ratio (PSNR) is a full-reference metric, that can be used to evaluate the distortion degree of the processed image. The value of PSNR is proportional to the image quality. It can be given as follows:
M S E = 1 m n i = 0 m 1 j = 0 n 1 I i , j O i , j 2
P S N R = 10 × l o g 10 M A X I 2 M S E
where M S E is the mean square error, I i , j and O i , j represent the original image and the processed image, respectively, and m and n are the height and width of the image, respectively, while M A X I denotes the maximum pixel value of image I .
The detail-variance–background-variance (DV–BV) of an image can be used to evaluate the degree of detail enhancement, which is a no-reference metric. When calculating the DV–BV value of an image, the first step is to convert the color image to a gray image. Then, the gray image is expanded and eroded to obtain two resulting images. These two resulting images are subtracted to obtain the detail image. The background image can be obtained by Gaussian blur (kernel size is 5) from the original grayscale image. The next step is to calculate the average square variance of the detail image and background image. Finally, the ratio of the two average square variance values is calculated to obtain the DV–BV value. The value of the DV–BV is also proportional to the detail enhancement degree of the image.
The gray square mean deviation (SMD2) is also a no-reference indicator to describe the clarity of the image. The larger the value is, the clearer the image is. It can be given as follows:
S M D 2 = i j | I i , j I i + 1 , j | × | I i , j I i , j + 1 |
where I i , j represents the input image.
Contrast improvement index (CII) is an index used to evaluate the effect of image contrast improvement. By calculating the contrast of the original image and the contrast of the enhanced image, and dividing their difference by the contrast of the original image, the contrast improvement index can be obtained. A higher value indicates a more significant improvement in contrast. The principle formula for calculating the contrast improvement index is as follows:
C I I = I m a x I m i n / I m a x + I m i n I m a x I m i n / I m a x + I m i n I m a x I m i n / I m a x + I m i n
where I m a x and I m a x represent the largest pixel of the original image and the enhanced image, respectively, while I m i n and I m i n represent the largest pixel of the original image and the enhanced image, respectively.
The image enhancement quality index (EQI) considers three key indicators: contrast, saturation, and brightness. This approach allows for a comprehensive evaluation that takes into account multiple visual features, aligning more closely with human perception of the enhancement effect. By considering these factors, the index provides a more holistic assessment of image quality.

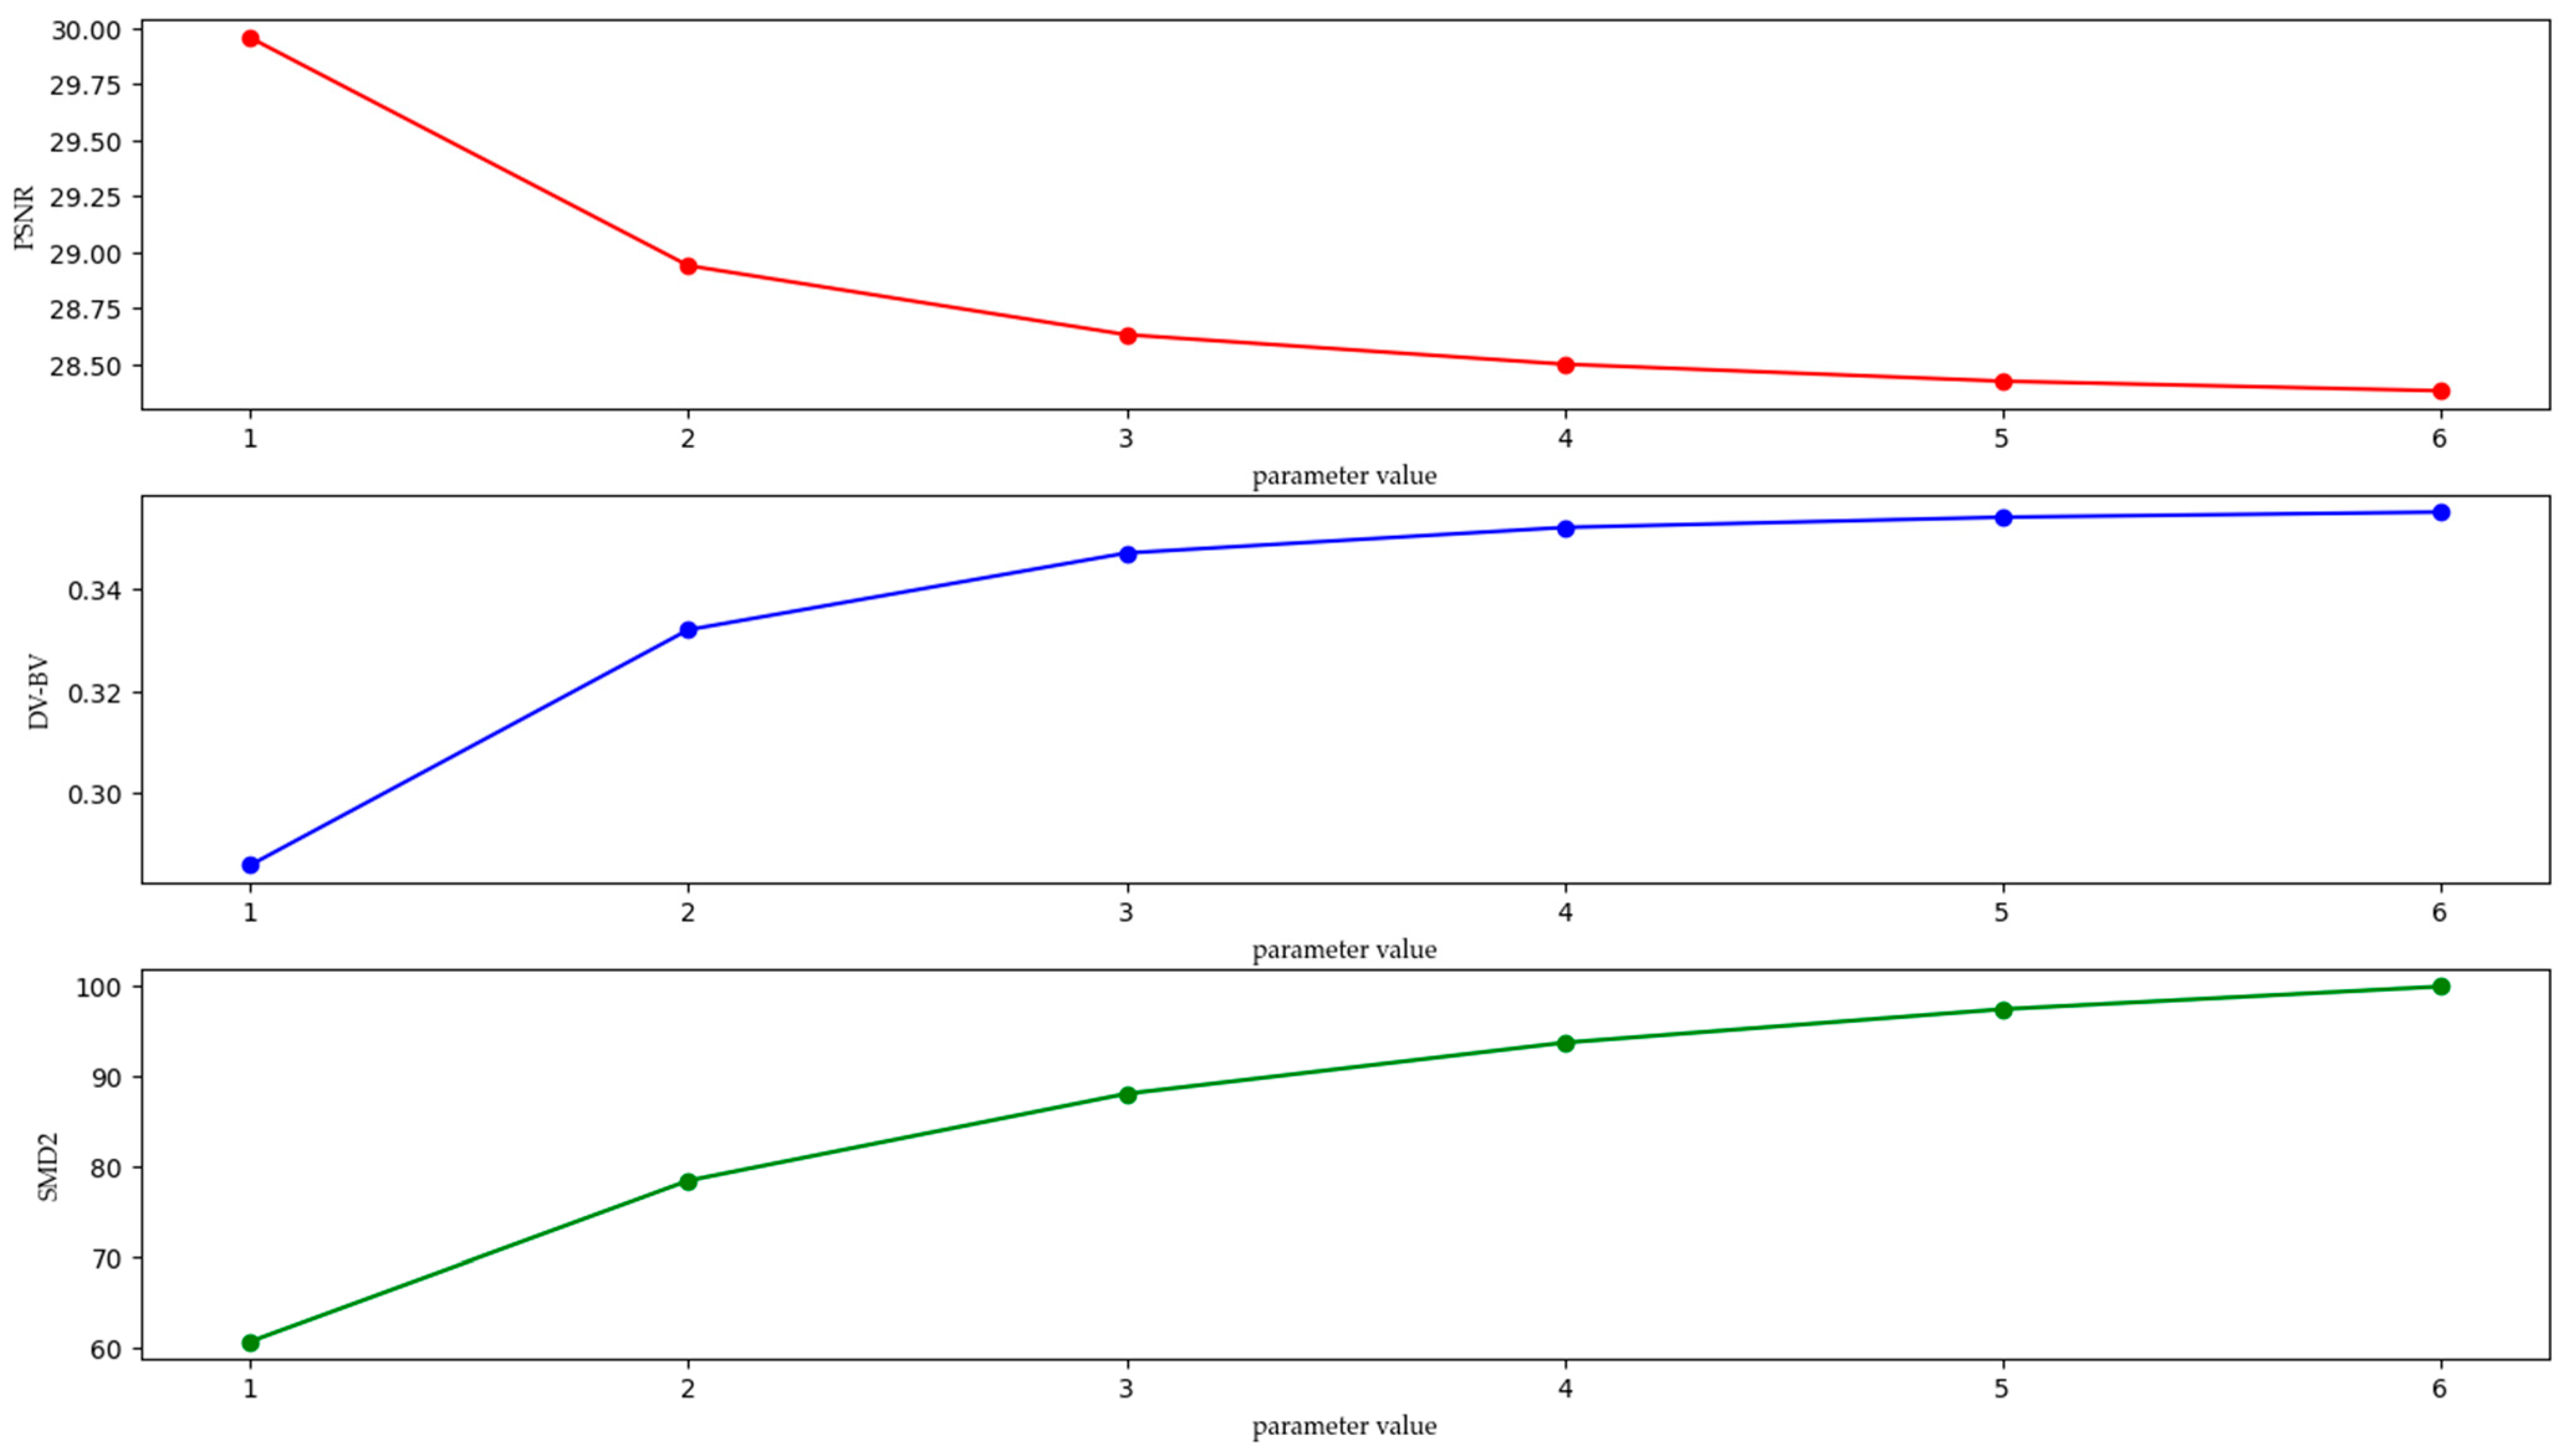
4.2. Selection of Parameters Involved in the Algorithm

4.2.1. Parameter φ

In Figure 9, it can be seen that an increase in the control parameter will improve the image enhancement effect. However, if the control parameter is too large, the degree of image distortion will increase, which can be demonstrated in Figure 10. Figure 10 shows the change trend of the average PSNR of 100 images with the increase of the parameter φ . When the parameter exceeds 500, PSNR begins to decline, which means that the image has a certain degree of distortion. Therefore, to balance image enhancement and avoiding distortion, the value of the control parameter is set to 500.

4.2.2. Parameter ρ

The parameter ρ can control the speed of fusion weights changing. In the cervical opening area, the greater the value, the more enhanced information will be fused into the fusion image. As can be seen in Figure 11, the noise reduction effect decreases as ρ increases. Figure 12 shows the trend of the three evaluation indicators with the increase in parameters. The decrease of PSNR indicates the increase in image noise and distortion. The increase in DV–BV and SMD2 indicate an increase in image details remaining. It can be seen from Figure 12 that the slope of indicators is highest when the parameter increases from 1 to 2. Therefore, to suppress noise and preserve detail at the same time, the parameter ρ is set to 3.

4.3. Subjective and Objective Evaluation

The proposed algorithm mainly consists of four steps. To explain its rationality, a vertical comparison analysis is carried out in this paper. Figure 12 draws the line charts of PSNR, DV–BV, and SMD2 of the four images obtained after each step. Figure 13a shows the variation trend of the PSNR values. The increase in PSNR at the end proves that the pixel-based dynamic weighted fusion step can effectively suppress the image noise and alleviate the image distortion caused by the enhancement process. Figure 13b describes the change in the third indicator, SMD2, whose change process is similar to that of DV–BV. It proves the validity and rationality of the first three steps from the perspective of image clarity. Although its values also decrease in pixel-based dynamic weighted fusion, it can be seen from the figure that the SMD2 value after the decrease is still significantly higher than that after applying CLAHE. Figure 13c shows the change in DV–BV. As seen from the figure, the value of DV–BV shows a gradual upward trend in the first three steps, which proves that the lesion details are continuously enhanced in the process of improved multi-scale retinex, CLAHE, and multi-scale detail enhancement. The decrease in the DV–BV value in the fusion process is an inevitable result of image noise reduction. Moreover, the final value of DV–BV is still higher than the value after the second step, which demonstrates the necessity of multi-scale detail enhancement.
For subjective evaluation, Figure 14, Figure 15, Figure 16 and Figure 17 show the results of Img1, Img2, Img3, and Img4 processed by different algorithms. Overall, the vinegar white epithelium, punctate vessels, and vascular mosaics were enhanced to different degrees. However, in the four images, the two algorithms based on retinex (MSR, MSRCR) caused serious color deviation, and the image showed a gray tone. By comparing the results of low-grade lesions and high-grade lesions, it can be found that the MSRCR algorithm has a better enhancement effect on thick vinegar white epithelium. Although the color distortion of the image after MSRCR is alleviated with the aid of the color recovery algorithm, the overall color deviation of the image is still serious. The LCLCP algorithm yielded satisfactory results in image Img3. However, in the remaining three images, there was significant distortion at the cervical opening and a significant decrease in image clarity. Although the IESVE algorithm enhances contrast and detail in focal areas, its impact is comparatively limited when compared to the proposed method. Examining the four outcomes, it becomes apparent that the IECF algorithm reduces the image brightness, leading to subpar image quality. The image processed by the CLAHE algorithm not only maintains its original color but also significantly enhances the lesion area. However, for some images, the CLAHE algorithm will have the problem of the appearance of dark regions due to local over-enhancement, which can be clearly seen in the processed images of Img2 and Img4. Through the comparison of experimental results, it can be clearly seen that the proposed algorithm is superior to the other six traditional medical image enhancement algorithms in terms of color preservation, contrast improvement, detail enhancement, and brightness optimization.
In terms of objective evaluation, this paper first evaluates the results of the horizontal comparison experiment. PSNR, DV–BV, SMD2, CII, and EQI are used to evaluate the quality of the output images of different algorithms, and the results are shown in Table 1, Table 2, Table 3, Table 4 and Table 5. As seen from Table 1, the proposed scheme has the highest PSNR in Img1, Img2, and Img4, and the IESVE algorithm has the highest PSNR in Img3. The results in Table 1 indicate that the proposed algorithm has a better effect on noise reduction and image distortion reduction, which is consistent with the subjective evaluation results.
From Table 2, it is evident that the proposed scheme yields DV–BV values that surpass those of other comparative experiments. This observation indicates a significant enhancement in image details following the application of this method.
Table 3 displays the calculation results of SMD2, highlighting the remarkable disparity between the proposed algorithm and other comparative experiments. The significantly larger SMD2 value obtained by the proposed algorithm implies a substantial improvement in image quality, resulting in enhanced clarity.
Table 4 shows the CII values of images processed by different algorithms. Through comparison, it can be found that there are three optimal values (Img2, Img3, and Img4) and one suboptimal value (Img1) after being processed by the proposed algorithm. It proves that the proposed algorithm is effective in improving image contrast.
As depicted in Figure 5, the proposed algorithm demonstrates superior results in Img2, Img3, and Img4 under the comprehensive evaluation index EQI when compared to other comparative experiments, with the IECF algorithm following closely behind. This outcome aligns with the findings of the subjective evaluation, indicating that the algorithm presented in this paper effectively enhances the visual effect of cervical precancerous lesion images.
Table 6 presents the time complexity of various algorithms. It is evident that classical algorithms (MSR, MSRCR, CLAHE) exhibit lower time complexity compared to the improved enhanced algorithms (IESVE, LCLCP, IECF, Proposed). Additionally, the proposed method demonstrates a lower time complexity in comparison to other improved algorithms. Considering that real-time requirements are not critical for the enhancement processing of cervical precancerous lesion images, the slightly higher time complexity of the proposed algorithm is deemed acceptable.
To verify the applicability of the proposed algorithm, 100 cervical precancerous lesion images with different lesion grades were used in the experiment to calculate the average values of PSNR, DV–BV, SMD2, CII, and EQI under different algorithms, as shown in Table 7. As demonstrated in Table 7, the objective evaluation index values associated with the algorithm presented in this paper surpass those of the comparative experiment. This clearly establishes that the proposed algorithm outperforms other comparison algorithms in terms of enhancing cervical precancerous lesions.
In conclusion, the subjective evaluation confirms that the proposed algorithm effectively enhances image contrast, sharpens lesion details, optimizes image brightness, and suppresses noise interference while preserving color. As a result, the visual effect is more conducive to the diagnostic process for doctors. The objective evaluation further substantiates the validity and stronger competitiveness of the proposed algorithm.

5. Conclusions

In this paper, an enhancement algorithm for cervical precancerous lesion images based on retinex and histogram equalization is proposed. The algorithm consists of four parts. In the first part, it solves the color deviation problem of the retinex algorithm by modifying the quantization formula. Using the improved multi-scale retinex algorithm, the brightness of the image is enhanced, and the details are initially sharpened. In the second part, the contrast is effectively stretched by the CLAHE algorithm, which can avoid excessive enhancement and suppress noise. It is worth noting that the CLAHE algorithm is specifically implemented in the blue and green channels according to the histogram distribution characteristics of cervical precancerous lesion images. In the third part, a multi-scale detail enhancement algorithm is used to enhance the high-frequency information in the image to highlight the details of the lesion area. The fourth part uses the pixel-based dynamic weighted fusion strategy to fuse the detail-enhanced image with the original image to reduce noise, improve the image distortion, and optimize the visual effect. The results of subjective and objective evaluations show that the proposed algorithm has a better enhancement effect on cervical precancerous lesion images.

Author Contributions

Methodology, Y.R.; software, Z.L.; validation, Z.L. and C.X.; resources, Y.R. and Z.L.; data curation, C.X.; writing—original draft preparation, Y.R.; writing—review and editing, Z.L.; visualization, Y.R.; supervision, Z.L.; project administration, Z.L.; funding acquisition, Z.L. All authors have read and agreed to the published version of the manuscript.

Funding

This research was funded by The National Key Research and Development Program of China (2019YFC0117800).

Data Availability Statement

No new data were created or analyzed in this study. Data sharing is not applicable to this article.

Acknowledgments

The cervical precancerous lesion images were provided by the First Affiliated Hospital of Anhui Medical University, Hefei Anhui, China, Gejishan Hospital of Wannan Medical College, Wuhu Anhui, China, and the First People’s Hospital of Fanchang District, Wuhu Anhui, China.

Conflicts of Interest

The authors declare no conflict of interest.

References

  1. Brisson, M.; Drolet, M. Global elimination of cervical cancer as a public health problem. Lancet Oncol. 2019, 20, 319–321. [Google Scholar] [CrossRef] [PubMed]
  2. Herfs, M.; Vargas, S.O.; Yamamoto, Y.; Howitt, B.E.; Nucci, M.R.; Hornick, J.L.; McKeon, F.D.; Xian, W.; Crum, C.P. A novel blueprint for ‘top down’ differentiation defines the cervical squamocolumnar junction during development, reproductive life, and neoplasia. J. Pathol. 2013, 229, 460–468. [Google Scholar] [CrossRef] [PubMed]
  3. Khan, M.J.; Werner, C.L.; Darragh, T.M.; Guido, R.S.; Mathews, C.; Moscicki, A.-B.; Mitchell, M.M.; Schiffman, M.; Wentzensen, N.; Massad, L.S.; et al. ASCCP Colposcopy Standards: Role of Colposcopy, Benefits, Potential Harms, and Terminology for Colposcopic Practice. J. Low. Genit. Tract Dis. 2017, 21, 223–229. [Google Scholar] [CrossRef] [PubMed]
  4. Singh, K.; Kapoor, R. Image enhancement using Exposure based Sub Image Histogram Equalization. Pattern Recognit. Lett. 2014, 36, 10–14. [Google Scholar] [CrossRef]
  5. Al-Ameen, Z.; Sulong, G.; Rehman, A.; Al-Dhelaan, A.; Saba, T.; Al-Rodhaan, M. An innovative technique for contrast enhancement of computed tomography images using normalized gamma-corrected contrast-limited adaptive histogram equalization. Eurasip J. Adv. Signal Process. 2015, 2015, 32. [Google Scholar] [CrossRef]
  6. Chang, Y.-T.; Wang, J.-T.; Yang, W.-H.; Chen, X.-W. Contrast enhancement in palm bone image using quad-histogram equalization. In Proceedings of the 2014 International Symposium on Computer, Consumer and Control (IS3C), Taichung, Taiwan, 10–12 June 2014; pp. 1091–1094. [Google Scholar] [CrossRef]
  7. Joseph, J.; Periyasamy, R. A fully customized enhancement scheme for controlling brightness error and contrast in magnetic resonance images. Biomed. Signal Process. Control 2018, 39, 271–283. [Google Scholar] [CrossRef]
  8. Palanisamy, G.; Ponnusamy, P.; Gopi, V.P. An improved luminosity and contrast enhancement framework for feature preservation in color fundus images. Signal Image Video Process. 2019, 13, 719–726. [Google Scholar] [CrossRef]
  9. Pizer, S.M.; Johnston, R.E.; Ericksen, J.P.; Yankaskas, B.C.; Muller, K.E. Contrast-limited adaptive histogram equalization: Speed and effectiveness. In Proceedings of the First Conference on Visualization in Biomedical Computing, Atlanta, GA, USA, 22–25 May 1990; pp. 337–345. [Google Scholar]
  10. Thirumala, K.; Pal, S.; Jain, T.; Umarikar, A.C. A classification method for multiple power quality disturbances using EWT based adaptive filtering and multiclass SVM. Neurocomputing 2019, 334, 265–274. [Google Scholar] [CrossRef]
  11. Oh, J.; Hwang, H. Feature Enhancement of Medical Images using Morphology-Based Homomorphic Filter and Differential Evolution Algorithm. Int. J. Control Autom. Syst. 2010, 8, 857–861. [Google Scholar] [CrossRef]
  12. Ajam, A.; Abd Aziz, A.; Asirvadam, V.S.; Izhar, L.I.; Muda, S. Cerebral Vessel Enhancement Using Bilateral and Hessian-Based Filter. In Proceedings of the 6th International Conference on Intelligent and Advanced Systems (ICIAS), Kuala Lumpur, Malaysia, 15–17 August 2016. [Google Scholar]
  13. Bhonsle, D.; Bagga, J.; Mishra, S.; Sahu, C.; Sahu, V.; Mishra, A. Reduction of Gaussian noise from Computed Tomography Images using Optimized Bilateral Filter by Enhanced Grasshopper Algorithm. In Proceedings of the 2nd IEEE International Conference on Advances in Electrical, Computing, Communication and Sustainable Technologies (IEEE ICAECT), Bhilai, India, 21–22 April 2022. [Google Scholar]
  14. Dhivyaprabha, T.T.; Jayashree, G.; Subashini, P. Medical Image Denoising Using Synergistic Fibroblast Optimization Based Weighted Median Filter. In Proceedings of the 2nd International Conference on Advances in Electronics, Computers and Communications (ICAECC), Bengaluru, India, 9–10 February 2018. [Google Scholar]
  15. Chen, C.; Zhang, J. Improved multi-scale Retinex enhancement algorithm of medical X ray images. Comput. Eng. Appl. 2015, 51, 191–195, 226. [Google Scholar] [CrossRef]
  16. Daway, E.G.; Abdulameer, F.S.; Daway, H.G. X-ray image enhancement using retinex algorithm based on color restoration. J. Eng. Sci. Technol. 2022, 17, 1276–1286. [Google Scholar]
  17. Huang, Y.; Liu, Z.; Zhao, Z. Enhancement of Ultrasonic Liver Images Based on Multi-Scale Retinex Model. J. Data Acquis. Process. 2013, 28, 597–601. [Google Scholar]
  18. Qin, Y.; Luo, F.; Li, M. A Medical Image Enhancement Method Based on Improved Multi-Scale Retinex Algorithm. J. Med. Imaging Health Inform. 2020, 10, 152–157. [Google Scholar] [CrossRef]
  19. Wang, W.B.; Zhou, L.J.; Fei, L. An improved algorithm based on retinex theory for x-ray medical image. Adv. Mater. Res. 2013, 772, 233–238. [Google Scholar] [CrossRef]
  20. Eilimnur, A.; Abdurusul, O.; Turghunjan; Abdukirim, T. An algorithm of medical image enhancement based on dyadic wavelet transform. Comput. Appl. Chem. 2012, 29, 951–954. [Google Scholar]
  21. Masud, M.; Sikder, N.; Nahid, A.-A.; Bairagi, A.K.; AlZain, M.A. A Machine Learning Approach to Diagnosing Lung and Colon Cancer Using a Deep Learning-Based Classification Framework. Sensors 2021, 21, 748. [Google Scholar] [CrossRef]
  22. Gupta, R.; Pachauri, R.; Singh, A. Despeckling of Ultrasound Images Using Modified Local Statistics Mean Variance Filter. CMES-Comput. Model. Eng. Sci. 2018, 114, 19–32. [Google Scholar] [CrossRef]
  23. Povoroznyuk, A.I.; Filatova, A.E.; Kozak, L.M.; Ignashchuk, O.V.; Kotyra, A.; Orshubekov, N.; Smailova, S.; Karnakova, G. Grayscale morphological filter based on local statistics. In Proceedings of the Conference on Photonics Applications in Astronomy, Communications, Industry, and High Energy Physics Experiments, Wilga, Poland, 28 May–6 June 2017. [Google Scholar]
  24. Zhao, F.; Zhao, J.; Zhao, W.; Qu, F.; Sui, L. Local region statistics combining multi-parameter intensity fitting module for medical image segmentation with intensity inhomogeneity and complex composition. Opt. Laser Technol. 2016, 82, 17–27. [Google Scholar] [CrossRef]
  25. Guo, J.; Wang, H.; Xue, X.; Li, M.; Ma, Z. Real-time classification on oral ulcer images with residual network and image enhancement. IET Image Process. 2022, 16, 641–646. [Google Scholar] [CrossRef]
  26. Ma, Y.; Liu, J.; Liu, Y.; Fu, H.; Hu, Y.; Cheng, J.; Qi, H.; Wu, Y.; Zhang, J.; Zhao, Y. Structure and Illumination Constrained GAN for Medical Image Enhancement. IEEE Trans. Med. Imaging 2021, 40, 3955–3967. [Google Scholar] [CrossRef]
  27. Xia, K.; Zhou, Q.; Jiang, Y.; Chen, B.; Gu, X. Deep residual neural network based image enhancement algorithm for low dose CT images. Multimed. Tools Appl. 2022, 81, 36007–36030. [Google Scholar] [CrossRef]
  28. Kaur, M.; Kaur, J.; Kaur, J. Survey of Contrast Enhancement Techniques based on Histogram Equalization. Int. J. Adv. Comput. Sci. Appl. 2011, 2, 137–141. [Google Scholar] [CrossRef]
  29. Chang, Y.; Jung, C.; Ke, P.; Song, H.; Hwang, J. Automatic Contrast-Limited Adaptive Histogram Equalization With Dual Gamma Correction. IEEE Access 2018, 6, 11782–11792. [Google Scholar] [CrossRef]
  30. Subramani, B.; Veluchamy, M. Fuzzy Gray Level Difference Histogram Equalization for Medical Image Enhancement. J. Med. Syst. 2020, 44, 103. [Google Scholar] [CrossRef] [PubMed]
  31. Land, E.H.; McCann, J.J. Lightness and retinex theory. J. Opt. Soc. Am. 1971, 61, 1–11. [Google Scholar] [CrossRef]
  32. Land, E.H. An alternative technique for the computation of the designator in the retinex theory of color-vision. Proc. Natl. Acad. Sci. USA 1986, 83, 3078–3080. [Google Scholar] [CrossRef]
  33. Rahman, Z.U.; Jobson, D.J.; Woodell, G.A. A multiscale retinex for color rendition and dynamic range compression. In Proceedings of the Conference on Applications of Digital Image Processing XIX, Denver, CO, USA, 7–9 August 1996; pp. 183–191. [Google Scholar]
  34. Rahman, Z.U.; Jobson, D.J.; Woodell, G.A. Retinex processing for automatic image enhancement. In Proceedings of the Conference on Human Vision and Electronic Imaging VII, San Jose, CA, USA, 21–24 January 2002; pp. 390–401. [Google Scholar]
  35. Fu, X.; Zeng, D.; Huang, Y.; Zhang, X.-P.; Ding, X. A weighted variational model for simultaneous reflectance and illumination estimation. In Proceedings of the 2016 IEEE Conference on Computer Vision and Pattern Recognition (CVPR), Seattle, WA, USA, 27–30 June 2016; pp. 2782–2790. [Google Scholar]
  36. Wang, D.; Yan, W.; Zhu, T.; Xie, Y.; Song, H.; Hu, X. An Adaptive Correction Algorithm for Non-Uniform Illumination Panoramic Images Based on the Improved Bilateral Gamma Function. In Proceedings of the International Conference on Digital Image Computing—Techniques and Applications (DICTA), Sydney, Australia, 29 November–1 December 2017; pp. 878–883. [Google Scholar]
  37. Wang, L.; Wu, B.; Wang, X.; Zhu, Q.; Xu, K. Endoscopic image luminance enhancement based on the inverse square law for illuminance and retinex. Int. J. Med. Robot. Comput. Assist. Surg. 2022, 18, e2396. [Google Scholar] [CrossRef]
  38. Yang, Y.; Su, Z.; Sun, L. Medical image enhancement algorithm based on wavelet transform. Electron. Lett. 2010, 46, 120–121. [Google Scholar] [CrossRef]
  39. Xia, K.-j.; Wang, J.-q.; Cai, J. A novel medical image enhancement algorithm based on improvement correction strategy in wavelet transform domain. Clust. Comput.-J. Netw. Softw. Tools Appl. 2019, 22, 10969–10977. [Google Scholar] [CrossRef]
  40. Li, Q.; Yang, X.; Wu, W.; Liu, K.; Jeon, G. Multi-Focus Image Fusion Method for Vision Sensor Systems via Dictionary Learning with Guided Filter. Sensors 2018, 18, 2143. [Google Scholar] [CrossRef]
  41. Chen, J.; Zhang, L.; Lu, L.; Li, Q.; Hu, M.; Yang, X. A novel medical image fusion method based on Rolling Guidance Filtering. Internet Things 2021, 14, 100172. [Google Scholar] [CrossRef]
  42. Daniel, E.; Anitha, J. Optimum wavelet based masking for the contrast enhancement of medical images using enhanced cuckoo search algorithm. Comput. Biol. Med. 2016, 71, 149–155. [Google Scholar] [CrossRef]
  43. Zhou, Y.; Ye, J.; Du, Y.; Sheykhahmad, F.R. New Improved Optimized Method for Medical Image Enhancement Based on Modified Shark Smell Optimization Algorithm. Sens. Imaging 2020, 21, 20. [Google Scholar] [CrossRef]
  44. An, Z.; Xu, C.; Qian, K.; Han, J.; Tan, W.; Wang, D.; Fang, Q. EIEN: Endoscopic Image Enhancement Network Based on Retinex Theory. Sensors 2022, 22, 5464. [Google Scholar] [CrossRef] [PubMed]
  45. Jiang, Y.; Gong, X.; Liu, D.; Cheng, Y.; Fang, C.; Shen, X.; Yang, J.; Zhou, P.; Wang, Z. EnlightenGAN: Deep Light Enhancement without Paired Supervision arXiv. IEEE Trans. Image Process. 2021, 30, 2340–2349. [Google Scholar]
  46. Fan, J.; Liu, J.; Xie, S.; Zhou, C.; Wu, Y. Cervical lesion image enhancement based on conditional entropy generative adversarial network framework. Methods 2022, 203, 523–532. [Google Scholar] [CrossRef]
  47. Jiang, H.; Zhang, K.; Yuan, B.; Wang, L. A vascular enhancement algorithm for endoscope image. Opto-Electron. Eng. 2019, 46, 180167-1. [Google Scholar]
  48. Kim, Y.; Koh, Y.J.; Lee, C.; Kim, S.; Kim, C.-S. Dark image enhancement based on pairwise target contrast and multi-scale detail boosting. In Proceedings of the IEEE International Conference on Image Processing (ICIP), Quebec City, QC, Canada, 27–30 September 2015; pp. 1404–1408. [Google Scholar]
  49. Li, K.; Xu, C.; Feng, B.; Liu, H.R. Brightness and Contrast Adjustment-Based Endoscopic Image Enhancement Technique. J. Small Microcomput. Syst. 2022, 43, 2375–2380. [Google Scholar] [CrossRef]
  50. An, Z.; Xu, C.; Feng, B.; Han, J. Endoscopic Image Enhancement Algorithm Based on Luminance Correction and Fusion Channel Prior. Comput. Sci. 2023, 50 (Suppl. S1), 298–304. [Google Scholar]
  51. Zhu, Y.; Xu, C.; Feng, B.; Fang, S. Research on Endoscopic Image Enhancement Algorithm Based on Contrast Fusion. In Proceedings of the 2021 IEEE 6th International Conference on Signal and Image Processing (ICSIP), Nanjing, China, 22–24 October 2021; pp. 210–215. [Google Scholar]
Figure 1. Images of different lesion grades after acetic acid staining test: (a) Normal cervical staining image; (b) Low-grade cervical staining image; (c) High-grade cervical staining image.
Mathematics 11 03689 g001
Figure 2. Overall flowchart of the proposed algorithm.
Mathematics 11 03689 g002
Figure 3. (a) original image; (b) image processed by MSR; (c) image processed by MSRCR; (d) image processed by the improved MSR.
Mathematics 11 03689 g003
Figure 4. (a) The histogram corresponding to Figure 1b; (b) The histogram corresponding to Figure 1c. The red curve represents the histogram of the R channel; the green curve represents the histogram of the G channel; and the blue curve represents the histogram of the B channel.
Mathematics 11 03689 g004
Figure 5. (a) B-channel image for Figure 1b; (b) G-channel image for Figure 1b; (c) R-channel image for Figure 1b.
Mathematics 11 03689 g005
Figure 6. (a) B-channel image for Figure 1c; (b) G-channel image for Figure 1c; (c) R-channel image for Figure 1c.
Mathematics 11 03689 g006
Figure 7. (a) Perform the CLAHE on R, G, B channels for Figure 1b; (b) Perform the CLAHE on G, B channels for Figure 1b; (c) Perform the CLAHE on R, G, B channels for Figure 1c; (d) Perform the CLAHE on G, B channels for Figure 1c.
Mathematics 11 03689 g007aMathematics 11 03689 g007b
Figure 8. (a) Img1, (b) Img2, (c) Img3, (d) Img4. Img1, Img2, Img3, and Img4 are four cervical precancerous lesion images whose lesion grade is increasing in turn.
Mathematics 11 03689 g008
Figure 9. Images obtained with different parameters: (a) φ = 400 ; (b) φ = 450 ; (c) φ = 500 ; (d) φ = 550 .
Mathematics 11 03689 g009
Figure 10. Line chart of PSNR with parameter variation.
Mathematics 11 03689 g010
Figure 11. Fusion images with different parameters: (a) ρ = 1 ; (b) ρ = 3 ; (c) ρ = 6.
Mathematics 11 03689 g011
Figure 12. The trend of PSNR, DV–BV, and SMD2 for fusion images with the increase in fusion parameters. The red line represents the variation of PSNR, the blue line represents the variation of DV-BV, and the green line represents the variation of SMD2.
Mathematics 11 03689 g012
Figure 13. The changing chart of objective evaluation indexes in the course of algorithm implementation. Red line indicates the change of Img1 corresponding to objective indicators, blue line indicates the change of Img2 corresponding to objective indicators, green line indicates the change of Img2 corresponding to objective indicators, and yellow line indicates the change of Img2 corresponding to objective indicators. The horizontal coordinate indicates the process of the algorithm, and the vertical coordinate indicates the index value. ORI represents the original image; M, MC, MCM, and MCMF represent the image after the first, second, third, and fourth steps in the whole proposed algorithm, respectively. (a) Line chart of PSNR change, (b) Line chart of SMD2 change, (c) Line chart of DV–BV change.
Mathematics 11 03689 g013
Figure 14. (a) Original image Img1, (b) MSR rendering for Img1, (c) MSRCR rendering for Img1, (d) IESVE rendering for Img1, (e) LCLCP rendering for Img1, (f) IECF rendering for Img1, (g) CLAHE rendering for Img1, (h) Proposed method rendering for Img1.
Mathematics 11 03689 g014
Figure 15. (a) Original image Img2, (b) MSR rendering for Img2, (c) MSRCR rendering for Img2, (d) IESVE rendering for Img2, (e) LCLCP rendering for Img2, (f) IECF rendering for Img2, (g) CLAHE rendering for Img2, (h) Proposed method rendering for Img2.
Mathematics 11 03689 g015aMathematics 11 03689 g015b
Figure 16. (a) Original image Img3, (b) MSR rendering for Img3, (c) MSRCR rendering for Img3, (d) IESVE rendering for Img3, (e) LCLCP rendering for Img3, (f) IECF rendering for Img3, (g) CLAHE rendering for Img3, (h) Proposed method rendering for Img3.
Mathematics 11 03689 g016
Figure 17. (a) Original image Img4, (b) MSR rendering for Img4, (c) MSRCR rendering for Img4, (d) IESVE rendering for Img4, (e) LCLCP rendering for Img4, (f) IECF rendering for Img4, (g) CLAHE rendering for Img4, (h) Proposed method rendering for Img4.
Mathematics 11 03689 g017
Table 1. PSNR calculation results. The best result is shown in bold.
Source ImagesMSRMSRCRIESVELCLCPIECFCLAHEProposed
Img128.82428.59529.65828.05927.32829.29929.664
Img228.07028.12229.65628.62727.34429.62129.657
Img328.52928.50430.54627.69527.44529.69929.824
Img428.80728.14729.24028.28027.34328.86529.532
Table 2. DV–BV calculation results. The best result is shown in bold.
Source ImagesMSRMSRCRIESVELCLCPIECFCLAHEProposed
Img10.1740.1310.1810.1050.2330.1800.316
Img20.1300.1200.0430.0350.0590.0460.323
Img30.0490.0410.0330.0230.0480.0310.094
Img40.1080.0700.1080.0580.1380.1060.197
Table 3. SMD2 calculation results. The best result is shown in bold.
Source ImagesMSRMSRCRIESVELCLCPIECFCLAHEProposed
Img125.73861.53941.76950.97162.62946.70578.928
Img210.17530.50118.66524.58831.31522.23831.880
Img33.94914.9206.34310.8439.6607.11916.197
Img417.97044.09726.73834.05243.11930.11255.879
Table 4. CII calculation results. The best result is shown in bold.
Source ImagesMSRMSRCRIESVELCLCPIECFCLAHEProposed
Img10.0620.3670.0420.2230.1080.0060.255
Img20.1740.3060.1470.3060.1210.2100.310
Img30.0180.8580.2341.0310.1520.3591.092
Img40.0490.2990.0090.2620.1630.0500.301
Table 5. EQI calculation results. The best result is shown in bold.
Source ImagesMSRMSRCRIESVELCLCPIECFCLAHEProposed
Img10.0680.0910.7450.6711.1010.5750.748
Img20.0090.0361.2110.9601.0510.8561.22
Img30.0030.0131.1030.8291.0460.9131.115
Img40.0680.1530.9750.9821.0760.5501.080
Table 6. Time complexity (unit: second). The best result is shown in bold.
Source ImagesMSRMSRCRIESVELCLCPIECFCLAHEProposed
Img11.492.11738.35210.4517.7291.033.72
Img26.3198.749367.18786.0938.1791.1215.68
Img33.7265.157158.42638.17621.5021.168.85
Img41.4741.96740.52510.3867.751.093.68
Table 7. The average PSNR, DV–BV, SMD2, CII, and EQI calculated from 100 pictures. The best result is shown in bold.
Source ImagesMSRMSRCRIESVELCLCPIECFCLAHEProposed
PSNR28.91628.07129.68928.25327.21528.81529.914
DV–BV0.0800.0610.0630.0790.0660.0860.193
SMD218.80635.01921.64428.79040.38430.38445.384
CII0.0560.3740.0910.6060.1670.4060.628
EQI0.0270.0760.8620.8130.9290.7970.988
Disclaimer/Publisher’s Note: The statements, opinions and data contained in all publications are solely those of the individual author(s) and contributor(s) and not of MDPI and/or the editor(s). MDPI and/or the editor(s) disclaim responsibility for any injury to people or property resulting from any ideas, methods, instructions or products referred to in the content.

