Abstract
Due to the contactless operation of cookware on induction heating systems, the temperature of the cookware is measured remotely using thermal sensors placed on the center of the coil. Hence, the measurement error of these sensors increases if the cookware placement is not centered on the top of the coil. Therefore, this study presents a new data-driven anomaly detection method to detect overheated cookware using the thermal sensor of the case temperature of the inverter module. This method utilizes the long short-term memory (LSTM)-based autoencoder (AE) to learn from large training data of temperatures of cookware and the inverter. The learning of the LSTM-AE model is achieved by minimizing the residual error between the input and reconstructed input data. Then, the maximum residual error can be set to be a threshold value between the normal and abnormal operation. Finally, the learned LSTM-AE model is tested using new testing data that include both normal and abnormal cases. The testing results revealed that the LSTM-AE model can detect cookware overheating by using the inverter temperature only. In addition, the LSTM-AE model can detect the faults in the inverter side, such as poor air ventilation and a faulted cooling fan. Furthermore, we utilized different deep learning algorithms, such as the recurrent neural network (RNN) and the fully connected layers, in the internal layers of the AE. The results demonstrated that the LSTM-AE could detect anomalies earlier than the other models.
MSC:
68T07
1. Introduction
Currently, induction heating (IH) technology is becoming a competitive thermal energy source to minimize the carbon footprint and offer efficient energy management for domestic, commercial, or industrial consumers [1,2]. The IH system has several merits [3]: (i) high efficiency compared to gas or other electric heating because the cookware itself converts the electrical power into heat [4]; (ii) zero carbon emissions with thermal energy production [5]; (iii) fast and controlled heating by controlling the amount of electrical power [6]; (iv) better user safety due to contactless cookware operation [7]; and (v) a compact size. On the other hand, the IH system is vulnerable to several challenges, such as (i) the area of the coil covered by the cookware [8], (ii) user misbehavior that can have a significant impact on gap variations between the cookware and coil [9], (iii) the selection of the proper power input concerning the size of the cookware or the amount of food being cooked, and (iv) the bad environment (humidity and temperature) that causes fast degradation and the failure of IH system components [10].
For the IH system research area, researchers have mainly focused on the development of resonant inverter topologies [11], control systems, the induction coil design [9], and the equivalent load estimation of the coil–cookware load [12]. In IH systems, there are three common resonant inverter topologies [11]: single-switch quasi-resonant [13], half-bridge, and full-bridge inverters. The control system performs several functions [8]: including output power control, soft-switching operations to reduce switching losses [14], security and protection, and cookware load recognition [12]. In [15], a model predictive control based on a deep neural network is applied for the resonant inverter of the IH system. In [16], unsupervised learning was applied to recognize the material and size of the cookware. In [17], a high-efficiency multi-output resonant inverter topology with zero voltage switching and front-end power factor correction is proposed for domestic IH systems [18]. In [19,20], double and multi-coil architectures were proposed for optimal magnetic coupling between the induction coil and cookware. For safety and protection in IH systems, control systems are still using a conventional method based on the preset threshold value (e.g., 1.2 × rated value) to detect anomalies. However, these conventional methods ignored the time series trajectory of anomalies that lead to system failure.
A recent literature survey indicates that advanced statistical- and learning-based methods have been applied for early anomaly detection (AD) in different operating systems. Statistical-based AD methods included the moving average [21], cumulative sum [22], and Hoeffding test methods [23]. Learning-based AD methods included clustering algorithms, such as K-means [24], K-nearest neighbor (KNN) [25], and support vector machines (SVM) [26]; supervised learning algorithms, such as artificial neural networks [27]; unsupervised learning algorithms, such as an autoencoder (AE) [28]; and a combination of these techniques (e.g., ANN-AEs [29]). Learning-based methods are data-driven models that can learn from large amounts of data collected under normal operating conditions. Recently, these AD methods have been widely applied across different engineering disciplines. Castellani et al. [30] hybridized K-means clustering, KNN, and AE for AD in a real-world electricity- and ventilation-equipped building. Li et al. [28] utilized temporal convolutional networks and AE to detect anomalies in bearings. Wu et al. [31] implemented the long short-term memory (LSTM) and Gaussian Bayes models for AD in the industrial IoT. Musleh et al. [32] utilized LSTM and AE for AD in the electrical power grid. Kumar et al. [33] utilized a transfer learning-based model to detect the faults of bearings. Despite the existence of numerous anomaly detection methods, as shown in Table 1, there is a research gap in the application of anomaly detection in IH systems.

Table 1.
Literature survey of applied anomaly detection approaches.
IH systems are prone to different anomalies caused by poor environmental conditions, such as humidity and temperature, or by the misbehavior of users, which can cause safety risks and the rapid degradation of IH system components. Therefore, this paper proposes a new AD methodology to detect anomalies in the inverter and the cookware sides of the IH system. This methodology utilized the LSTM neural network and AE method to develop a learning model to predict the temperatures of the cookware and inverter module. Then, by comparing the error between the predicted and measured temperatures with the threshold value, the control system can detect the anomalies at early stages. To the best knowledge of the authors, this study is novel and has not been conducted previously.
In general, the main contributions of this paper can be summarized as follows (1) developing a data-driven model based on LSTM-AE to detect anomalies in the induction cooking system; (2) detecting cookware overheating using the measured case temperature of inverter module; (3) developing further data-driven models based on the recurrent neural network and fully connected layers; and (4) the findings revealed that the LSTM-AE is more efficient to detect the anomalies based on the pattern behavior.
The rest of this paper is organized as follows: Section 2 describes the components of the three-phase IH system and the mathematical modeling of the temperatures of the IGBT and cookware. Section 3 introduces the LSTM-AE model and explains the structure of LSTM cells and autoencoder. Section 4 presents the proposed anomaly detection methodology. Section 5 shows the results and discussion of applying the proposed LSTM-AE for anomaly detection in the IH system.
2. Three-Phase Induction Heating System
An induction heating (IH) system converts the low-frequency AC electrical source (50/60 Hz) into a high-frequency AC electrical output (20–100 kHz), as shown in Figure 1a. A three-phase electrical AC source is used for the IH system with high power ratings. A three-phase full-bridge diode rectifier converts the AC voltage to a DC voltage. A DC link capacitor is used to reduce the ripple of the rectifier’s DC output voltage. The half-bridge inverter module is then used to convert the DC voltage to a high-frequency AC voltage. This inverter module is made up of two insulated-gate bipolar transistors (IGBTs) and two antiparallel diodes. The high-frequency AC output is obtained by regulating the switching frequency of the IGBTs using pulse width modulation (PWM). Following that, the output high-frequency AC current, io, passes through the coil, L1, producing a high-frequency alternating magnetic field that induces eddy currents, ie, that pass through the resistance of the bottom surface of the cookware, Rs, as shown in Figure 1b. The equivalent on-state model of IGBT is an on-state voltage, vCE, and on-state resistance, ron. Figure 1c shows the equivalent resistance, Req, and inductance, Leq, of the magnetically coupled induction coil and cookware load [6].
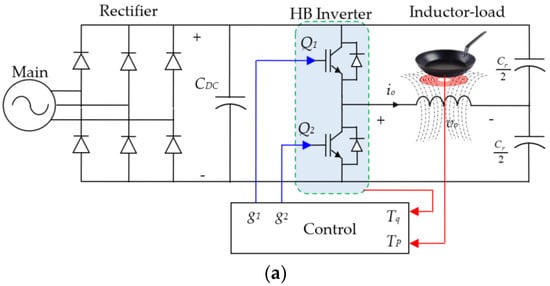

Figure 1.
Electrical circuit diagram of three-phase induction heating system; (a) AC/DC/AC circuit; (b) magnetic coupling of the coil–cookware; and (c) equivalent impedance of coil–cookware.
2.1. Cookware Temperature
As shown in (1), the density of the eddy current increases as the skin depth of the bottom surface of the cookware decreases. The skin depth value is reduced by increasing the frequency of eddy currents, f, and using ferromagnetic materials with high relative magnetic permeability, μr. Furthermore, as shown in (3), the surface cookware resistance, Rs, is affected by the cookware’s resistivity, ρ, and the skin depth, δ. Therefore, the lower the skin depth, the higher the resistance, and the higher the eddy currents [41], the more power losses, which means more heat is dissipated at the cookware or pan surface, Qp, as in (4). Given that the heat conversion occurs at the surface of the cookware itself, the efficiency of the IH system is very high [4].
where m, TP, and CP are the mass of cookware (kg), pan temperature (°C), and specific heat capacity (J/(kg.°C)), respectively. Figure 1c shows the equivalent resistance of the coil cookware that is calculated in [42], as in (5).
where ω, R1, L1, L2, and M, are the angular frequency (rad/s), coil resistance (Ω), coil inductance (μH), cookware inductance (μH), and mutual inductance (μH). The power loss in Rs due to the eddy current is equivalent to the power loss in Req due to io, as in (6). Then, the change in pan temperature (TP) is estimated as in (7) [43] which depends on different parameters, such as the frequency, the electrical and magnetic properties of the pan material, pan size, the output current (io), and Req.
2.2. Inverter Module Temperature
The total power losses, PL, of the half-bridge inverter module include the power losses of IGBTs, PQ, and the power losses of diodes, PD, as in (8). PQ is very high compared to PD due to switching losses. PQ depends on the collector–emitter voltage, vCE, and the output current, io, as shown in (9). These losses increase the junction temperature of the IGBT, which changes the case temperature of the IGBT module, Tq, as shown in (10) [44].
where D and Zth are the duty cycle of the IGBTs and the thermal impedance between the junction of the IGBT and the heat sink, respectively.
From (6) and (9), it is obvious that TP and Tq are controlled by the amount of output current, io. Therefore, the control system regulates the gate signals of IGBTs based on the feedback temperatures TP and Tq, as shown in Figure 1a.
However, we cannot find a fixed mathematical expression for both temperatures because there is no fixed cookware and no fixed liquid level inside it. Therefore, the learning algorithms are the best choice to predict these temperatures based on learned models using large training data for TP and Tq.
3. LSTM-AE Model
In this work, we collect large amounts of unlabeled time series data under indeterminate operating conditions, such as different power control variations, different users’ behaviors, turning on and off the cooling fans, etc. Therefore, the unsupervised autoencoder (AE) learning method is utilized. However, these AEs learn inaccurately with temporal-based time series data. Therefore, long short-term memory (LSTM) neural networks are used as stacked layers inside the autoencoder.
3.1. LSTM Cell Structure
LSTM is proposed in [45] to add the long-term memory state (cell state) capability to the short-term memory capability of RNN. Figure 2 depicts the structure of an LSTM cell, which includes input, output, and logic gates. Firstly, the LSTM cell starts with a forget gate which is responsible for forgetting or preserving the previous cell state data, ct−1. The forget decision is made by passing the input data, xt, and the previous hidden state, ht−1, through a sigmoid activation function, whose output value, ft, is between [0,1], as shown in (11) and (12).
where W and b are the weight and bias of gates, respectively.
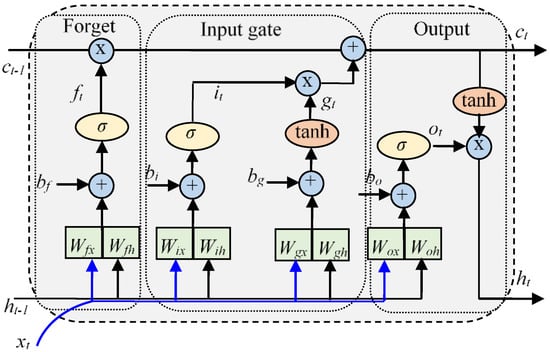
Figure 2.
The inner structure of the LSTM cell.
Secondly, the input gate generates a new memory state, gt, by feeding xt and ht-1 into the tanh activation function, as in (13) and (14). At the same time, the input gate will decide which parts of gt will be forgotten by generating an input state, it, as in (15). Then, the new memory cell state, ct, is achieved as in (16).
Finally, the output gate produces the new hidden state, ht, based on the newly updated memory cell state and the output state, ot, as in (17) and (18).
3.2. Autoencoder Structure
Autoencoders (AEs) are unsupervised learning methods that are employed for constructing a data-driven model based on unlabeled data. The AE model learns by reconstructing the input data and reducing the reconstruction loss between the input and output. Figure 3 shows the structure of AE, which includes the encoder, latent layer, and decoder layers, respectively. In this work, the encoder consists of two LSTM layers that include 128 and 64 units, respectively. The latent layer is the repeat vector function that repeats the output of the encoder to fit the input of the decoder. The decoder layer includes two LSTM layers that consist of 64 and 128 units, respectively. Finally, the output of the decoder will be converted to time series distribution using the input data. The LSTM-AE model learns from the training data by reducing the reconstruction loss () value between input data (xt) and output data (). In this work, the reconstruction loss function is the mean absolute error (MAE), as in (19). In addition, the Adam optimizer is used to find the optimal weight (W*) and bias (b*) matrices for LSTM unit model learning.
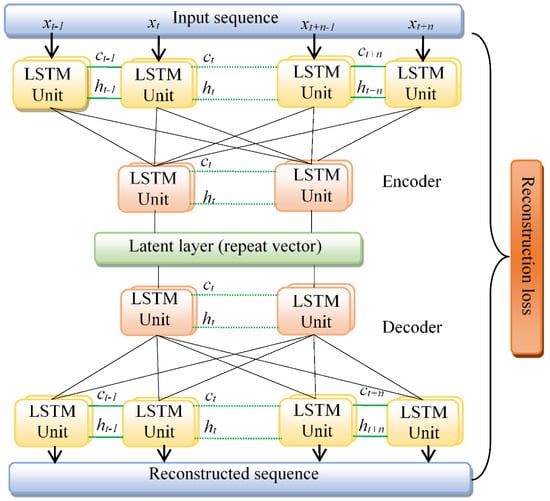
Figure 3.
LSTM-AE architecture.
4. Early Anomaly Detection Methodology
In this work, we describe the methodology of developing an early anomaly detection (AD) algorithm for the IH system. First, we train and tune the hyperparameters of the LSTM-AE model using training data. Second, we deploy and test the learned LSTM-AE model using testing data.
4.1. Training Methodology
Figure 4 shows the training methodology of the proposed LSTM-AE model. Firstly, we need to collect large training data that consist of two features xt = [Tp, Tq]. The training data are collected during the normal operation of the IH system under different users’ behavior and different sizes and materials of cookware. After that, the training data are normalized using the maximum–minimum scaler, as in Equation (20). Then, the LSTM-AE model will learn by reducing the residual error between the input data (xt) and the reconstructed output data (). Then, the threshold value is chosen to be the maximum residual error. Finally, the learned LSTM-AE model will be deployed to detect anomalies by reconstructing the input data and comparing the residual error with the threshold value to detect the anomaly, as shown in Figure 5.

Figure 4.
Training methodology of LSTM-AE and finding threshold value.

Figure 5.
Deployment and testing of learned LSTM-AE for anomaly detection.
4.2. Deployment Methodology
In the section, the learned LSTM-AE model can be deployed to monitor the time series measurement of temperatures of the inverter and pot. Figure 5 shows the deployment process of the learned LSTM-AE model for anomaly detection. First, the measured data will be normalized and prepared for the input of LSTM-AE. After that, the learned LSTM-AE model will reconstruct the input data and output the time series residual errors between the reconstructed and input data. Finally, these residual errors will be compared with the threshold value (τ). If the residual error is bigger than the threshold value then the alarm signal of anomaly detection will be produced, otherwise, the system is normal.
5. Experimental Results and Discussions
To apply the data-driven AD method to the IH application, we need to collect a large amount of training data. Firstly, we need to make a laboratory setup including a three-phase IH system, thermocouple sensors, and data acquisition devices. In this work, we utilize a 15-kW three-phase IH system, as shown in Figure 6. The equivalent circuit of the electrical power board of the IH system is shown in Figure 1. This IH system converts the 50/60 Hz and 380 V AC input into a 500 V DC output using a three-phase diode bridge rectifier. After that, the DC link capacitor (CDC = 30 μF) will reduce the ripple of the DC voltage. Then, the half-bridge resonant inverter module will convert the DC voltage into a high-frequency AC voltage. This inverter module (TPM200GB120KHN) consists of two IGBTs and two antiparallel diodes, as shown in Figure 1. The output of this inverter is connected to the induction coil and mid-point resonant capacitor (Cr = 1.4 μF). The equivalent resistance and inductance of the induction coil of the IH system at no load are 0.3 Ω and 85 μH, respectively. The snubber capacitor (Csn = 30 nF) is connected in parallel with the IGBT to limit the rising rate of the switching voltage. There are eight power levels (6.4–15 kW) for this IH system and the user can select any level using the selection switch on the interface board. The high switching frequency of IGBTs varies from 50 kHz at the lowest power level to 20 kHz at the highest power level. Thermocouples are used to measure the temperatures of the pot and inverter module; then, these measurements are recorded using a data acquisition system (DAQ) as shown in Figure 6.
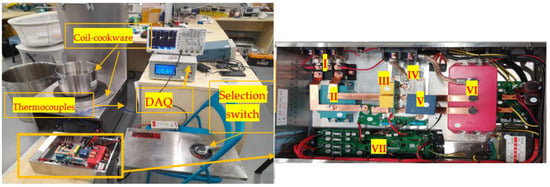
Figure 6.
Experimental setup of a 15-kW three-phase induction heating system. (I) Three-phase bridge diode rectifier; (II) DC-link capacitor; (III) Snubber capacitors; (IV) half-bridge inverter module; (V) filter capacitor; (VI) high-voltage mid-point resonant capacitor; and (VII) control board.
5.1. Data Collection
As shown in Equations (7) and (10), the temperatures of the pot and inverter (TP and Tq) both depend on the value of the output current. Therefore, we assume that we can detect the anomalies on the pot side by monitoring the inverter temperature. So, we install thermocouple sensors at the bottom surfaces of the pots and inverter modules. Then, we measure TP and Tq under different normal and abnormal operating conditions.
5.1.1. Training Data Collection
To develop a robust data-driven model, it should be trained with training data that include two features, Tp and Tq, under most of the possible operating conditions of the IH system. Therefore, in this work, we collect the training data under different normal operating conditions, such as (1) different sizes and materials of pots; (2) the selection of different power levels (PL1–PL8) using a selection switch; (3) the different water levels inside the cookware (100%, 60%, and 30%); and (4) the different behaviors and abruptions of users. We collect these data separately then we combine all the data to create large time series data with a total time duration of around 80,000 s, as shown in Figure 7a,b, where we can notice heating and cooling for all conditions. It is noticeable that the rising rate of temperatures within time intervals 4.3 × 10⁴ s and 6.7 × 10⁴ s increases with the increase in selected power level (PL1, PL2, … PL8). For inverter temperature, we notice the existence of zigzag patterns due to the on–off operation of the cooling fan, where the set-point temperature of the fan working is 50 °C. For different cookware sizes, we notice the temperature rises between time intervals 0 × 104 s and 1 × 10⁴ s. For different water levels, we notice the temperature rises between the time intervals 2 × 10⁴ s and 3 × 10⁴ s. For different behaviors of users, we can notice the temperature rise between time intervals 3 × 10⁴ s and 4 × 10⁴ s.
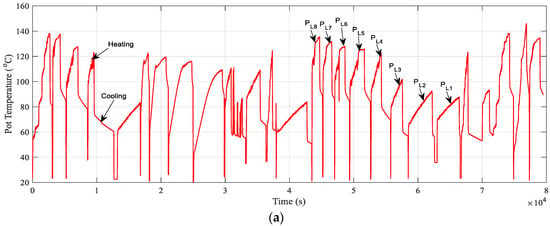
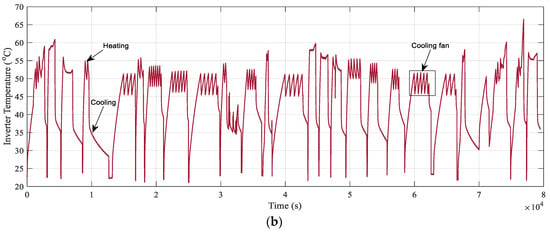
Figure 7.
Normal operating temperatures for (a) the pot and (b) the inverter module.
5.1.2. Testing Data Collection
To verify the effectiveness of the learned LSTM-AE model in anomaly detection, we collect new testing data that include different anomalies on both sides of the inverter and pot, as shown in Figure 8a,b. These anomalies are in the early stages of possible different time series trajectories to failure or user hazards.
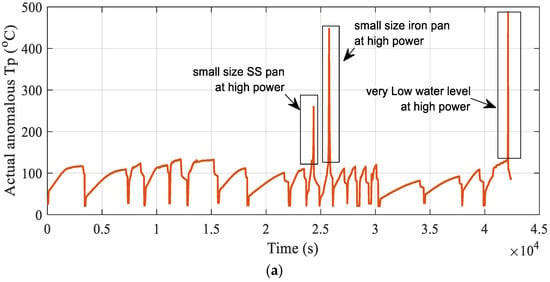
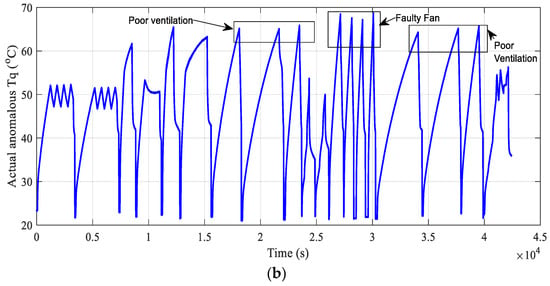
Figure 8.
Normal and abnormal operating temperatures for (a) the pot and (b) the inverter.
On the pot side, overheating can occur due to the usage of small cookware with inappropriate power levels or due to the small amount of water with a high power level. The overheated cookware can cause hazards to the users and, at the same time, can cause the maloperation of the IH system itself. Figure 8a shows the collected data on pot temperature which include the normal temperatures and abnormal overheating that exceeded 400 °C.
On the inverter module, the overheating of system components, such as the inverter module, will cause fast degradation and maybe permanent failure. Therefore, cooling fans are used to maintain the temperature as low as possible. However, poor air ventilation due to the inappropriate placement or faulted fan will lead to the system overheating. Therefore, early detection of these anomalies will prevent system failure. In this work, we collect data on inverter temperature under normal cooling and abnormal cooling conditions, as shown in Figure 8b. It is noticeable that with a bad cooling system, the inverter temperature will keep rising compared to the normal cooling system. Finally, all collected data at different operating conditions are merged into a single time series data with a total time of approximately 43,000 s.
5.2. Training Results
This work uses the deep learning algorithm of the open-source library in Python, Keras, which is the interface of the TensorFlow platform. The training experiments are executed on Windows 10 64 bits on a core i7-9750H, 16 GB RAM Laptop.
After that, the collected training data xt = [TP, Tq] under different normal operating conditions are used to train the LSTM-AE model. Firstly, we normalize TP and Tq by the values of 100 °C and 50 °C, respectively. After that, these data are prepared for training the LSTM-AE model using the minimum–maximum scaler, as in (20).
Then, these time series data are converted to a three-dimensional array (80,000, 2, 1) to fit the input of the LSTM network. Then, the weight and base parameters of the LSTM layers are updated using the Adam optimizer by minimizing the loss function, mean absolute error (MAE). The convergence curves of the loss function during training and validation show the existence of overfitting, as shown in Figure 9a. Therefore, to reduce the overfitting and underfitting, we applied the random search tuner in Keras to tune the hyperparameters of the LSTM-AE model, as shown in Table 2. Figure 9b shows the improvement of the convergence curves of training and validating the loss function. Both training and validation losses converge to the minimum value very fast, approximately around 20 epochs. This indicates that the proposed LSTM-AE model is well-learned. Figure 8 shows the comparison between the input and output training data.
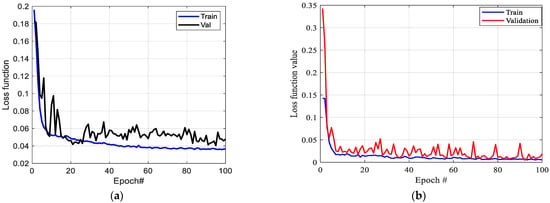
Figure 9.
Convergence of training and validation loss values of LSTM-AE for (a) manual tuning and (b) optimized tuning.

Table 2.
Optimal tuned hyper-parameters of the LSTM-AE model.
5.3. Predicting Training Data
To verify the effectiveness of the learned LSTM-AE model to reconstruct the input data, we apply the learned LSTM-AE to predict the training data using the predict function in Keras. Figure 10a shows the comparison between the predicted (red line) and measured (black line) pot temperatures (Tp) which are normalized by 100 °C. Figure 10b compares the predicted (red line) and measured (black line) inverter temperatures (Tq) which are normalized by 50 °C. It is obvious that the LSTM-AE model is able to trace the time series variations of heating and cooling operating conditions of pot and inverter temperatures curves.
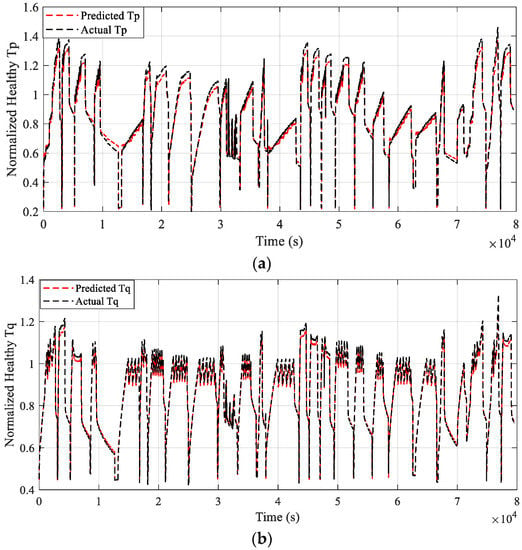
Figure 10.
Predicted and measured normal temperatures for (a) the pot and (b) the inverter.
5.4. Threshold Selection
Although the learned LSTM-AE model is trained and validated using large amounts of normal data, there is a residual error between the predicted and measured data. This residual error is the absolute error, as in (21). Figure 11 shows the histogram of residual errors for pot and inverter module temperatures. The maximum residual error is selected to be the threshold value for anomaly detection in the IH system. Figure 11a shows that the most counted number of residual errors of TP is less than 0.06 and the threshold value is set to 0.08512. Figure 11b shows that the most frequently counted number of residual errors of Tq is less than 0.04 and the threshold value is 0.0919.
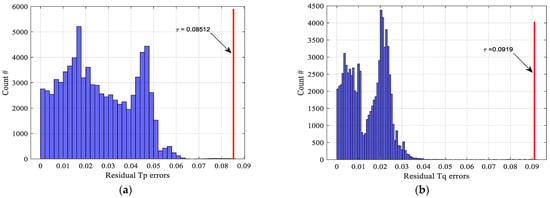
Figure 11.
Residual error counts and threshold value selection for (a) the pot side; and (b) the inverter side.
5.5. Testing The Learned LSTM-AE Model
In this section, the learned LSTM-AE model is applied to predict the testing data that is explained above in Section 5.1.2 and calculate the residual error between the predicted and measured data. Then, the residual errors are compared with the threshold values in Section 5.3. Figure 12a compares the threshold value with the time series residual error between the predicted and measured pot temperatures, Tp. If the residual error is bigger than the threshold value, e.g., overheating, the proposed AD algorithm will detect and alarm the existence of anomalous cases, as shown in Figure 12b. Furthermore, to verify the effectiveness of the learned LSTM-AE model, the predicted and measured temperatures are compared as in Figure 12b.
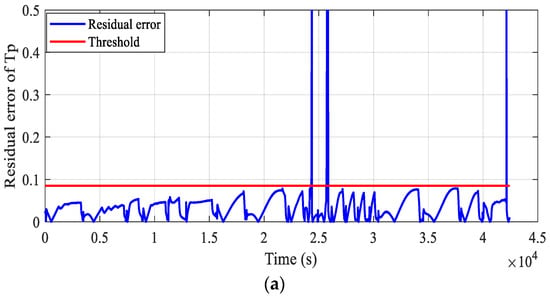
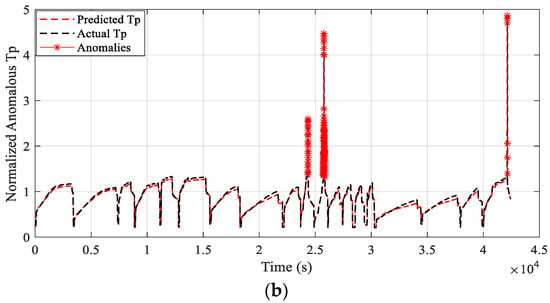
Figure 12.
Anomaly detection in the pot side: (a) the residual error and (b) the anomaly label.
Furthermore, on the inverter side, the learned LSTM-AE model is applied to detect the anomalies. The testing data in Section 5.1.2 are used to verify the robustness of the learned LSTM-AE model. Figure 13a compares the threshold value with the time series residual error between the predicted and measured inverter temperature. If the residual error is bigger than the threshold value, the proposed AD model will consider it as an anomaly and send alarms. Figure 13b labels the anomalies (red stars) on the times-series trajectories of predicted and measured inverter temperatures, Tq.
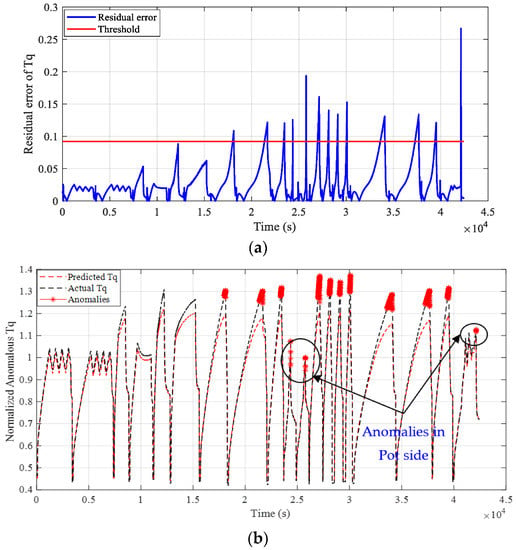
Figure 13.
Anomaly detection on the inverter side: (a) the residual error and (b) the anomaly label.
In addition to the anomalies in the inverter side, the proposed AD model can detect the anomalies in the pot side based on the inverter temperature, as shown in Figure 13b. Although the inverter temperature is still small during the pot overheating, the anomaly is detected because of the abnormal trajectory behavior of the inverter temperature.
5.6. Comparison with Other Models
In this work, the temperatures in the IH system vary with time, the behavior of users, the type of cookware, and input power. The collected temperatures have spatial and temporal correlations. Therefore, we selected the LSTM neural network because it has a long memory cell besides its short memory cell, which enables it to trace the abrupt variations of the time-series trajectory of the measured temperatures. To verify the efficacy of the LSTM-AE model, we compared it with other learned AE models based on the recurrent neural network (RNN) and the dense neural network (DNN). Figure 14a,b depicts the convergence of training and validation loss functions of the RNN-AE and dense-AE models. Figure 15a,b shows the anomaly detection on the inverter side using the RNN-AE and the dense-AE models. Unlike the LSTM-AE model, these models are not able to detect anomalies in the pot side based on the inverter temperature.
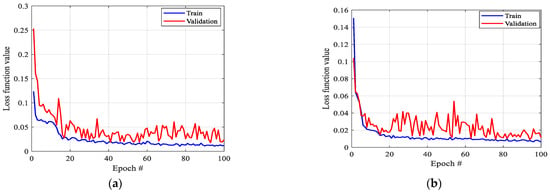
Figure 14.
Convergence of losses functions using (a) RNN-AE and (b) dense-AE.
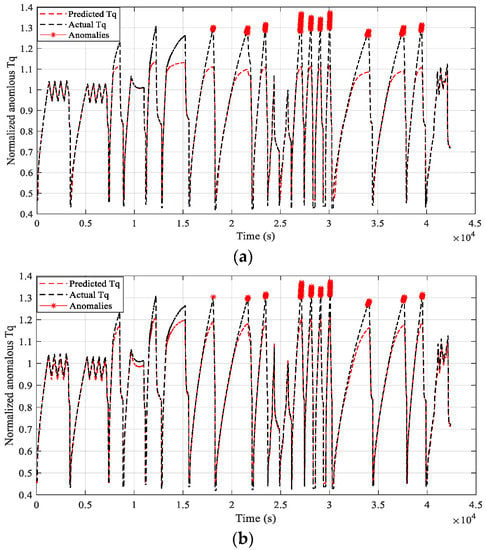
Figure 15.
Anomalies in the inverter side using (a) the RNN-AE and (b) the dense-AE.
Figure 16 presents a clear comparison between the LSTM-AE model and other models, namely the RNN-AE and dense-AE models. We selected a sample of anomalies in the inverter side between the time intervals 26,900 s and 27,200 s. It is obvious that the LSTM-AE model detected the anomalies earlier than the other models: approximately 20 s earlier than the RNN-AE model and 50 s earlier than the dense-AE model.
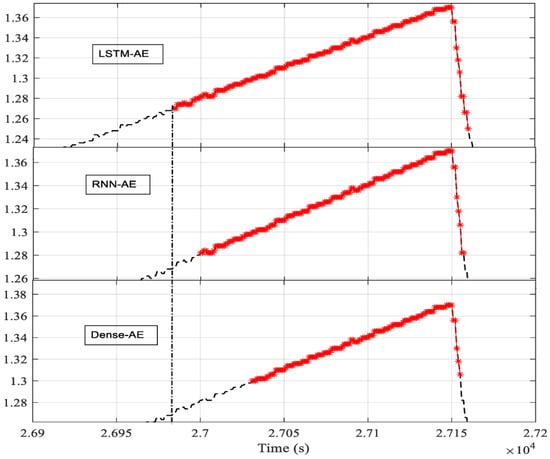
Figure 16.
Early anomaly detection comparison between three models (red stars mean anomalies).
6. Conclusions
This article introduced a data-driven model for detecting anomalies in induction heating systems using an autoencoder (AE) based on long short-term memory (LSTM) neural networks. The proposed model, called LSTM-AE, was trained on normal data of the collected temperatures of the inverter module and several pots. These data were obtained by monitoring the temperatures under various normal operating conditions, such as different pot materials and sizes, user behaviors, power levels, and water levels. Then, the learned LSTM-AE model should be able to detect anomalies by comparing a threshold value with the residual errors between the predicted and measured data.
To test the effectiveness of the LSTM-AE model, we collected new testing data containing anomalies and normal operations on the pot and inverter sides. Then, we applied the LSTM-AE model to detect anomalies in the testing data. The obtained results showed that the LSTM-AE model is able to detect anomalies earlier than other models, such as RNN-AE and dense-AE models.
Furthermore, the results proved that the LSTM-AE model is able to detect pot overheating using the measured inverter temperature; however, other methods could not. This is because LSTM is able to trace time series trajectories of inverter temperatures better than other deep learning algorithms.
Author Contributions
Conceptualization, M.H.Q. and S.K.; methodology, M.H.Q. and S.K.; software, M.H.Q. and S.K.; validation, M.H.Q. and S.K.; formal analysis, C.-M.L. and A.L.; investigation, K.H.L. and C.-M.L.; resources, C.-M.L. and A.L.; data curation, M.H.Q. and S.K.; writing—original draft preparation, M.H.Q.; writing—review and editing, S.K., K.H.L. and C.-M.L.; visualization, K.H.L. and C.-M.L.; supervision, K.H.L., C.-M.L. and A.L.; project administration, K.H.L. and C.-M.L. All authors have read and agreed to the published version of the manuscript.
Funding
This research received no external funding.
Acknowledgments
This work is supported by the Centre for Advances in Reliability and Safety (CAiRS) admitted under the AIR@InnoHK Research Cluster.
Conflicts of Interest
The authors declare no conflict of interest.
References
- Mai, T.; Steinberg, D.; Logan, J.; Bielen, D.; Eurek, K.; McMillan, C. An Electrified Future: Initial Scenarios and Future Research for U.S. Energy and Electricity Systems. IEEE Power Energy Mag. 2018, 16, 34–47. [Google Scholar] [CrossRef]
- Zhou, M.; Liu, H.; Peng, L.; Qin, Y.; Chen, D.; Zhang, L.; Mauzerall, D.L. Environmental benefits and household costs of clean heating options in northern China. Nat. Sustain. 2022, 5, 329–338. [Google Scholar] [CrossRef]
- Lucia, O.; Acero, J.; Carretero, C.; Burdio, J.M. Induction Heating Appliances: Toward More Flexible Cooking Surfaces. IEEE Ind. Electron. Mag. 2013, 7, 35–47. [Google Scholar] [CrossRef]
- Cabeza-Gil, I.; Calvo, B.; Grasa, J.; Franco, C.; Llorente, S.; Martínez, M.A. Thermal analysis of a cooking pan with a power control induction system. Appl. Therm. Eng. 2020, 180, 115789. [Google Scholar] [CrossRef]
- Díaz Moreno, J.M.; García Vázquez, C.; González Montesinos, M.T.; Ortegón Gallego, F.; Viglialoro, G. Industrial Steel Heat Treating: Numerical Simulation of Induction Heating and Aquaquenching Cooling with Mechanical Effects. Mathematics 2021, 9, 1203. [Google Scholar] [CrossRef]
- Elsaady, W.; Moughton, C.; Nasser, A.; Lacovides, H. Coupled numerical modelling and experimental analysis of domestic induction heating systems. Appl. Therm. Eng. 2023, 227, 120170. [Google Scholar] [CrossRef]
- Goman, V.; Prakht, V.; Dmitrievskii, V.; Sarapulov, F. Analysis of Coupled Thermal and Electromagnetic Processes in Linear Induction Motors Based on a Three-Dimensional Thermal Model. Mathematics 2022, 10, 114. [Google Scholar] [CrossRef]
- Jang, E.; Kwon, M.J.; Park, S.M.; Ahn, H.M.; Lee, B.K. Analysis and Design of Flexible-Surface Induction-Heating Cooktop with GaN-HEMT-Based Multiple Inverter System. IEEE Trans. Power Electron. 2022, 37, 12865–12876. [Google Scholar] [CrossRef]
- Patidar, B.; Hussain, M.M.; Jha, S.K.; Dikshit, B.; Sharma, A. Modelling and experimental demonstration of a litz coil-based high-temperature induction heating system for melting application. IET Electr. Power Appl. 2018, 12, 161–168. [Google Scholar] [CrossRef]
- Cao, L.-X.; Yin, T.; Jin, M.-X.; He, Z.-Z. Flexible circulated-cooling liquid metal coil for induction heating. Appl. Therm. Eng. 2019, 162, 114260. [Google Scholar] [CrossRef]
- Vishnuram, P.; Ramachandiran, G.; Ramasamy, S.; Dayalan, S. A comprehensive overview of power converter topologies for induction heating applications. Int. Trans. Electr. Energy Syst. 2020, 30, e12554. [Google Scholar] [CrossRef]
- Villa, J.; Barragán, L.A.; Artigas, J.I.; Navarro, D.; Domínguez, A.; Cabeza, T. SoC-Based In-Cycle Load Identification of Induction Heating Appliances. IEEE Trans. Ind. Electron. 2021, 68, 6762–6772. [Google Scholar] [CrossRef]
- Sarnago, H.; Burdio, J.M.; Lucia, O. Dual-Output Extended-Power-Range Quasi-Resonant Inverter for Induction Heating Appliances. IEEE Trans. Power Electron. 2023, 38, 3385–3397. [Google Scholar] [CrossRef]
- Sarnago, H.; Burdío, J.M.; Lucía, Ó. High-Performance and Cost-Effective ZCS Matrix Resonant Inverter for Total Active Surface Induction Heating Appliances. IEEE Trans. Power Electron. 2019, 34, 117–125. [Google Scholar] [CrossRef]
- Lucia, S.; Navarro, D.; Karg, B.; Sarnago, H.; Lucía, Ó. Deep Learning-Based Model Predictive Control for Resonant Power Converters. IEEE Trans. Ind. Inform. 2021, 17, 409–420. [Google Scholar] [CrossRef]
- Qais, M.H.; Loo, K.H.; Liu, J.; Lai, C.-M. Least Mean Square-Based Fuzzy c-Means Clustering for Load Recognition of Induction Heating. IEEE Trans. Instrum. Meas. 2022, 71, 3196702. [Google Scholar] [CrossRef]
- Pérez-Tarragona, M.; Sarnago, H.; Lucía, Ó.; Burdío, J.M. Power factor correction stage and matrix zero voltage switching resonant inverter for domestic induction heating appliances. IET Power Electron. 2022, 15, 1134–1143. [Google Scholar] [CrossRef]
- Sun, R.; Shi, Y.; Bing, Z.; Li, Q.; Wang, R. Metal transfer and thermal characteristics in drop-on-demand deposition using ultra-high frequency induction heating technology. Appl. Therm. Eng. 2019, 149, 731–744. [Google Scholar] [CrossRef]
- Sanz, F.; Sagues, C.; Llorente, S. Induction Heating Appliance with a Mobile Double-Coil Inductor. IEEE Trans. Ind. Appl. 2015, 51, 1945–1952. [Google Scholar] [CrossRef]
- Lucía, Ó.; Sarnago, H.; Burdío, J.M. Soft-Stop Optimal Trajectory Control for Improved Performance of the Series-Resonant Multiinverter for Domestic Induction Heating Applications. IEEE Trans. Ind. Electron. 2015, 62, 6251–6259. [Google Scholar] [CrossRef]
- Zhou, Z.-G.; Tang, P. Improving time series anomaly detection based on exponentially weighted moving average (EWMA) of season-trend model residuals. In Proceedings of the 2016 IEEE International Geoscience and Remote Sensing Symposium (IGARSS), Beijing, China, 10–15 July 2016; pp. 3414–3417. [Google Scholar]
- Mi, J.; Hou, Y.; He, W.; He, C.; Zhao, H.; Huang, W. A nonparametric cumulative sum-based fault detection method for rolling bearings using high-level extended isolated forest. IEEE Sens. J. 2022, 23, 2443–2455. [Google Scholar] [CrossRef]
- Zhang, J.; Paschalidis, I.C. Statistical Anomaly Detection via Composite Hypothesis Testing for Markov Models. IEEE Trans. Signal Process. 2018, 66, 589–602. [Google Scholar] [CrossRef]
- Haider, S.N.; Zhao, Q.; Li, X. Data driven battery anomaly detection based on shape based clustering for the data centers class. J. Energy Storage 2020, 29, 101479. [Google Scholar] [CrossRef]
- Liu, H.; Xu, X.; Li, E.; Zhang, S.; Li, X. Anomaly Detection with Representative Neighbors. IEEE Trans. Neural Netw. Learn. Syst. 2021, 34, 2831–2841. [Google Scholar] [CrossRef] [PubMed]
- Akpinar, M.; Adak, M.F.; Guvenc, G. SVM-based anomaly detection in remote working: Intelligent software SmartRadar. Appl. Soft Comput. 2021, 109, 107457. [Google Scholar] [CrossRef]
- Tsukada, M.; Kondo, M.; Matsutani, H. A Neural Network-Based On-Device Learning Anomaly Detector for Edge Devices. IEEE Trans. Comput. 2020, 69, 1027–1044. [Google Scholar] [CrossRef]
- Li, Z.; Sun, Y.; Yang, L.; Zhao, Z.; Chen, X. Unsupervised Machine Anomaly Detection Using Autoencoder and Temporal Convolutional Network. IEEE Trans. Instrum. Meas. 2022, 71, 3212547. [Google Scholar] [CrossRef]
- Cui, M.; Wang, J.; Yue, M. Machine Learning-Based Anomaly Detection for Load Forecasting Under Cyberattacks. IEEE Trans. Smart Grid 2019, 10, 5724–5734. [Google Scholar] [CrossRef]
- Castellani, A.; Schmitt, S.; Squartini, S. Real-World Anomaly Detection by Using Digital Twin Systems and Weakly Supervised Learning. IEEE Trans. Ind. Inform. 2021, 17, 4733–4742. [Google Scholar] [CrossRef]
- Wu, D.; Jiang, Z.; Xie, X.; Wei, X.; Yu, W.; Li, R. LSTM Learning with Bayesian and Gaussian Processing for Anomaly Detection in Industrial IoT. IEEE Trans. Ind. Inform. 2020, 16, 5244–5253. [Google Scholar] [CrossRef]
- Musleh, A.S.; Chen, G.; Dong, Z.Y.; Wang, C.; Chen, S. Attack Detection in Automatic Generation Control Systems using LSTM-Based Stacked Autoencoders. IEEE Trans. Ind. Inform. 2023, 19, 153–165. [Google Scholar] [CrossRef]
- Kumar, P.; Kumar, P.; Hati, A.S.; Kim, H.S. Deep Transfer Learning Framework for Bearing Fault Detection in Motors. Mathematics 2022, 10, 4683. [Google Scholar] [CrossRef]
- Li, W.; Shang, Z.; Zhang, J.; Gao, M.; Qian, S. A novel unsupervised anomaly detection method for rotating machinery based on memory augmented temporal convolutional autoencoder. Eng. Appl. Artif. Intell. 2023, 123, 106312. [Google Scholar] [CrossRef]
- Shanmuganathan, V.; Suresh, A. LSTM-Markov based efficient anomaly detection algorithm for IoT environment. Appl. Soft Comput. 2023, 136, 110054. [Google Scholar] [CrossRef]
- Raza, A.; Tran, K.P.; Koehl, L.; Li, S. AnoFed: Adaptive anomaly detection for digital health using transformer-based federated learning and support vector data description. Eng. Appl. Artif. Intell. 2023, 121, 106051. [Google Scholar] [CrossRef]
- Sun, C.; He, Z.; Lin, H.; Cai, L.; Cai, H.; Gao, M. Anomaly detection of power battery pack using gated recurrent units based variational autoencoder. Appl. Soft Comput. 2023, 132, 109903. [Google Scholar] [CrossRef]
- Copiaco, A.; Himeur, Y.; Amira, A.; Mansoor, W.; Fadli, F.; Atalla, S.; Sohail, S.S. An innovative deep anomaly detection of building energy consumption using energy time-series images. Eng. Appl. Artif. Intell. 2023, 119, 105775. [Google Scholar] [CrossRef]
- Fu, S.; Zhong, S.; Lin, L.; Zhao, M. A re-optimized deep auto-encoder for gas turbine unsupervised anomaly detection. Eng. Appl. Artif. Intell. 2021, 101, 104199. [Google Scholar] [CrossRef]
- El Sayed, M.S.; Le-Khac, N.-A.; Azer, M.A.; Jurcut, A.D. A Flow-Based Anomaly Detection Approach with Feature Selection Method Against DDoS Attacks in SDNs. IEEE Trans. Cogn. Commun. Netw. 2022, 8, 1862–1880. [Google Scholar] [CrossRef]
- Jin, Y.; Yang, N.; Xu, X. Innovative induction heating technology based on transformer theory: Inner heating of electrolyte solution via alternating magnetic field. Appl. Therm. Eng. 2020, 179, 115732. [Google Scholar] [CrossRef]
- Plumed, E.; Lope, I.; Acero, J. Induction Heating Adaptation of a Different-Sized Load With Matching Secondary Inductor to Achieve Uniform Heating and Enhance Vertical Displacement. IEEE Trans. Power Electron. 2021, 36, 6929–6942. [Google Scholar] [CrossRef]
- Liu, H.-C.; Chang, Y.-L.; Lin, C.-W.; Chen, Y.-Y.; Lin, C.-W.; Lin, Y.-C.; Huang, M.-S.; Hsu, H.-Y. Experimental and numerical multidisciplinary methodology to investigate the thermal efficiency of boiling pot on induction system. Case Stud. Therm. Eng. 2022, 36, 102199. [Google Scholar] [CrossRef]
- Li, W.; Li, G.; Sun, Z.; Wang, Q. Real-time estimation of junction temperature in IGBT inverter with a simple parameterized power loss model. Microelectron. Reliab. 2021, 127, 114409. [Google Scholar] [CrossRef]
- Hochreiter, S.; Schmidhuber, J. Long Short-Term Memory. Neural Comput. 1997, 9, 1735–1780. [Google Scholar] [CrossRef] [PubMed]
Disclaimer/Publisher’s Note: The statements, opinions and data contained in all publications are solely those of the individual author(s) and contributor(s) and not of MDPI and/or the editor(s). MDPI and/or the editor(s) disclaim responsibility for any injury to people or property resulting from any ideas, methods, instructions or products referred to in the content. |
© 2023 by the authors. Licensee MDPI, Basel, Switzerland. This article is an open access article distributed under the terms and conditions of the Creative Commons Attribution (CC BY) license (https://creativecommons.org/licenses/by/4.0/).