1. Introduction
In recent times, the human population has been facing numerous health issues, including fitness problems, improper eating habits, mental health disorders, and more. Maintaining a healthy diet not only makes us feel good but also provides us with increased energy, improved overall health and well-being, and a boost in mood. Both physical and mental fitness are crucial aspects of a fulfilling life. By adopting a balanced diet and incorporating regular exercise into our routines, we can enhance our health and fitness levels. The personalized health monitoring framework, coupled with a diet and fitness recommendation system, offers a novel solution to modern healthcare by integrating technology with individualized health tracking and management. Its primary goal is to provide users with a streamlined and effective approach to monitoring their dietary and fitness habits while also offering personalized recommendations and guidance to help them achieve their health goals [
1]. Given the rising prevalence of chronic diseases and lifestyle-related health concerns, a personalized health monitoring framework empowers individuals to take control of their health and improve their overall well-being. The authors in ref. [
2] made use of recent technological advancements to facilitate the transformation of traditional healthcare systems into smart healthcare systems. They leveraged wearable devices and connectivity to enhance healthcare management through improved efficiency, convenience, and personalization.
The main objective of the IoT-based Framework for Personalized Health Assessment and Recommendations using Machine Learning is to leverage IoT technology to create a framework that can assess an individual’s health status and provide personalized recommendations. This framework aims to utilize machine learning algorithms to analyze data collected from various IoT devices, such as wearable sensors and health monitoring devices [
3]. By analyzing this data, the framework can assess an individual’s health condition and generate personalized recommendations for improving their well-being [
4]. The ultimate goal is to enable personalized healthcare interventions based on real-time monitoring and analysis of IoT-generated data.
The IoT-based framework for personalized health assessment and recommendations utilizes machine learning algorithms to analyze data from IoT devices and provide personalized health recommendations. The framework collects data from wearable sensors and health monitoring devices, applying machine learning techniques to extract relevant features and identify patterns or anomalies. Based on this analysis, the framework assesses an individual’s health status, detects potential risks, and evaluates overall well-being [
5]. Using machine learning, personalized recommendations are generated by considering the health assessment results, medical history, lifestyle, and preferences [
6]. The framework continuously learns and adapts, refining the recommendations based on user feedback, with the ultimate goal of improving individual health outcomes.
Several potential benefits could be reaped through an IoT-based framework for personalized health, including personalized approaches to health management, early detection and prevention of diseases, continuous monitoring of health conditions, data-driven insights into individual health patterns, and enhanced efficiency and convenience in accessing personalized care [
7]. By leveraging machine learning and real-time data from IoT devices, the framework provides tailored health assessments and recommendations that cater to individuals’ specific needs and goals [
8]. This proactive approach enables early intervention, promotes preventive measures, and empowers individuals to actively participate in their own well-being.
The recommendation system utilizes various factors, including user-provided information, to filter and prioritize relevant data. By analyzing physical attributes such as age, gender, height, weight, and body fat percentage, as well as individual preferences such as weight loss or gain, the system can identify suitable matches between users and resources. Moreover, the system takes into consideration physiological factors such as body temperature, oxygen levels, and heart rate to generate personalized recommendations [
9]. Sensors are utilized to gather this data, which is then compared with an extensive database of information. Based on the results, the system suggests appropriate food choices and diet plans for the user.
The key contributions made in the article are as follows:
Development of a comprehensive framework capable of assessing an individual’s existing health conditions and providing customized workouts and diet recommendations.
Collection and analysis of health parameters related to various health indicators, with the data being augmented and balanced using machine learning algorithms prior to analysis.
Utilization of machine learning algorithms to analyze health parameters and provide recommendations for balanced diets and exercises through two-stage classifiers.
Creation of an interactive web platform that facilitates easy interaction with the developed framework.
Emphasis on promoting a healthy lifestyle and providing individuals with tailored diet and workout recommendations to support this goal.
The article’s structure and outline are outlined in
Section 1, which covers the general framework of the health monitoring system.
Section 2 discusses related works on health frameworks, wearables, diet recommendations, and the algorithms used, aiming to enhance classification accuracy.
Section 3 delves into the technical aspects, including hardware components such as health data sensors, software formulation encompassing visualization plots and balancing modules, and the provision of diet and exercise advice.
Section 4 focuses on the systematic examination and interpretation of confusion matrices, prediction models, and test plots for various machine learning algorithms. Comparative tables analyzing the classification and accuracy results are provided.
Section 5 explores the challenges and constraints encountered throughout the project, covering aspects such as data gathering, data analysis, hardware design, software development, and emerging technologies. Finally, the framework analysis is summarized in
Section 6.
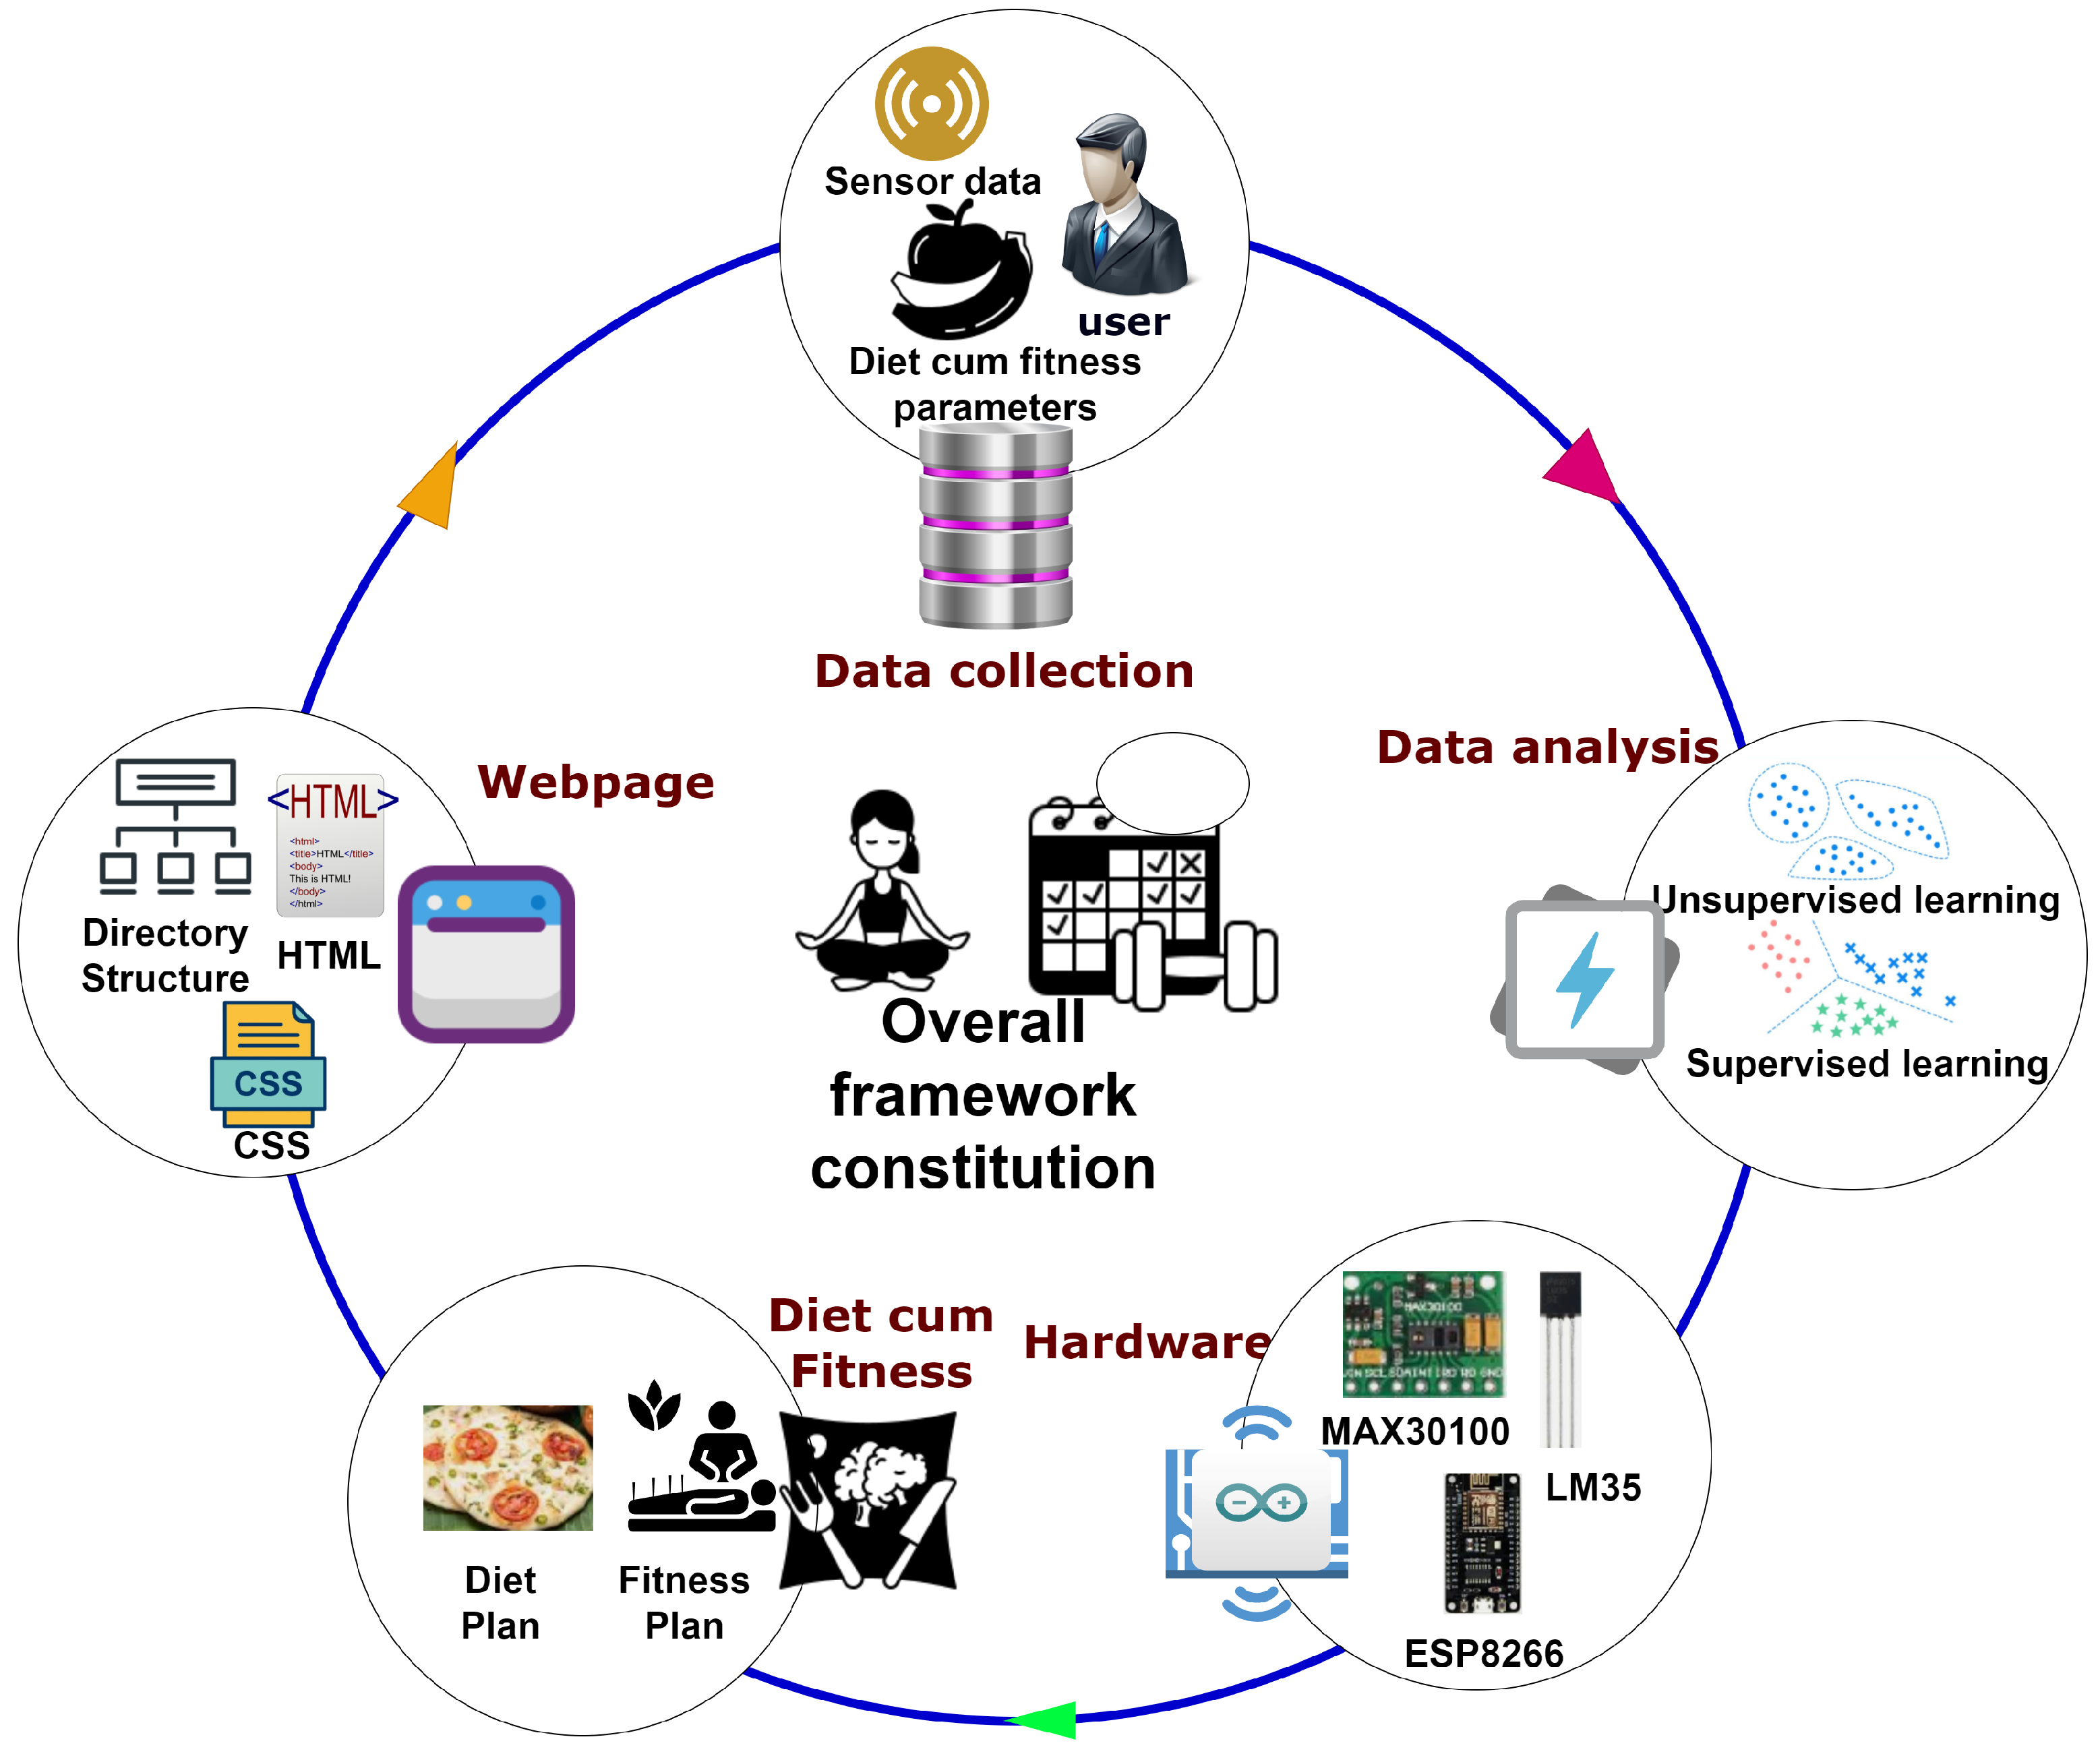
Figure 1 shows the overall framework and major constituents of a typical diet and fitness recommendation system.
2. Related Works
In this section, various approaches, techniques, and methodologies proposed by researchers and practitioners in the field of health monitoring and recommendation systems are discussed. The section aims to provide readers with a deeper understanding of the current state of the art, identify gaps in existing research, and highlight opportunities for further exploration and innovation in this field.
Yu et al. [
10] proposed a cloud-fusion fitness IoT architecture that includes multimodal information acquisition in the fitness IoT perception layer, multi-stage provider satisfactory assurance of health IoT based on human LAN, and emotional perception and emotional interaction in health IoT. The paper explains the fundamental concepts and principal additives of the multimodal sensing information series, which is divided into three subsystems: the primary platform subsystem, the application platform subsystem, and the unique application subsystem. The UMMP protocol is used in the primary subsystem, and the application platform subsystem provides a user login function and different display interfaces and features according to the user’s attributes. Additionally, the paper uses the Wavelet transform to represent signals using finite-length or fast-decaying oscillating waveforms. The feasibility and performance of the QoS framework proposed in this paper are evaluated through computer simulations. Furthermore, the authors mentioned that the paper also proposes a sustainable physiological signal collection based on smart garments to provide high comfort. However, security and privacy concerns still pose major challenges for medical IoT technology [
11]. A comparison table of various technologies is presented in
Table 1.
The authors in ref. [
12] described a method for providing exercise recommendations to clients. The wearable device utilizes reed switches as placement sensors to measure step length and frequency and incorporates Arduino, ESP8266, and Bluetooth technologies. The data collected is transmitted using message queuing telemetry delivery (MQTT) and uploaded to cloud databases. The HTML-based process is then transmitted via TCP. Communication software is employed to develop chatbots for an improved user experience. Proper exercise can enhance flexibility, strength, muscular endurance, and cardiovascular fitness, particularly for women who have irregular exercise habits.
According to the research by Zheng et al. [
13], the IoT community faces various resource constraints. To overcome these issues, the authors propose an IoT-based implementation of universal HMM that can monitor human physiological health and chronic diseases. In resource-limited environments, the forwarding application enables communication between adjacent nodes, and in a resource-constrained environment, it adopts an incentive approach. The authors also introduce a universal HMM system and a step-by-step scheme for denoising, baseline drift filtering, and feature point detection. Bhuiyan et al. [
14] also present an online system that measures, monitors, and reports people’s health conditions from anywhere. The system can transmit sensitive health information to medical centers and caregivers in real-time, provide the patient’s past statistical records, and has an emergency button. The system collects data from sensors, processes it, and saves it to the cloud server. The interaction module fetches health data from the cloud server and presents it to authenticated users. The implementation was tested on several cases and achieved excellent accuracy. Thus, it has a high potential for use in rural and urban areas in developing countries.
Table 1.
Comparison table on various technology.
Table 1.
Comparison table on various technology.
| Health Parameter | Technology | Description and Algorithm Used | Sensors Used | Real-Time Monitoring | Adults User Ready | Contributions and Limitations |
|---|
| Heart Rate (HR) Monitoring | Bracelet (2020) | The heart rate is monitored from the wrist of the athlete. ECG can be used to analyze and extract heart rate from the smart bracelet. Abnormal data will produce an alarm to check the health status [15]. | Heart rate sensor and step acceleration sensor mma9555lr1 | Yes | No | Overcome accuracy limitations due to potential motion artifacts and variability in sensor placement. |
| Oxygen saturation of blood | Neck device (2021) | The development and testing of a neck-worn photoplethysmography device to determine the long-term detection of cardiac and respiratory responses during sleep. The PPG and PSG systems are used [16]. | PPG sensor, accelerometer | Yes | Yes | Address challenges in capturing accurate signals due to potential motion artifacts. |
| Physical activities, Temperature | Wearable device (2021) | The physical activity and health of a pregnant woman are monitored by wearable sensors from various parts of the body. The Algorithms such as Supervised Machine Learning and KNN classifiers are used [17]. | Temperature sensor, accelerometer, gyroscope. | Yes | No | Acknowledging the limitation of potential accuracy and reliability issues associated with sensor placement. |
| Heart Rate (HR) Monitoring | Smartwatch (2022) | The data such as heart rate, Blood oxygen level, Respiratory rate, and distance are taken from the chest and wrist of swimmers. The accuracy and precision are compared between three smartwatches [18] | PPG sensor, accelerometers (MAX86141) | Yes | Yes | Incomplete physiological assessment with the focus on specific body regions. |
| Heart Rate (HR) Monitoring | Smartwatch (2022) | The constant monitoring of the users’ physiological and psychological data is collected from the smartwatch. The Decision Tree, Random Forest, Naive Bayes, Neural networks, SVM, and K-nearest neighbors algorithms are being used [15]. | Health summary metric sensors | Yes | Yes | Acknowledge the limitation of potential omission of contextual and external influences that can affect the overall analysis. |
| Inertial monitoring | Tags (2023), Wearables | Real-time signals collected by the sensors are processed by the CNN classifier from ARM. Then the RCM module calculates the number of repetitions, activities, and statistics of duration. Then it provides proper sports exercises [19]. | Inertial sensor | Yes | Yes | The reliance on real-time signals collected by sensors and processed by a CNN classifier is addressed using synthetic data. |
Giorgi et al. [
20] explain how smartphones can be used to monitor a person’s fitness. The authors take into account several factors, such as the design of the data acquisition block, the selection of wearable sensors, the minimization of data that local wearable sensors must send to the smartphone, the extraction of meaningful features from the analyzed signal, and the implementation of reliable event detection algorithms. Typically, IoT systems for monitoring physiological parameters use wearable devices for data acquisition. Wearable devices can be organized into a Wireless Body Sensor Network (WBSN), unlike traditional Wireless Sensor Networks (WSNs). A smartphone can act as either a data logger or a data processor. The process involves data acquisition and data reduction. To compress the data, a lightweight temporal compression algorithm is proposed for the environment.
Chiang et al. [
21] have proposed a method to measure and control high blood pressure, or hypertension, using wearables. They have developed a personalized model for blood pressure and lifestyle factors by using machine learning techniques such as Fitbit Charge HR and Omron Evolv. The Random Forest (RF) model is used to predict lifestyle and blood pressure statistics, and to improve the accuracy of RF, Random Forest with Feature Selection (RFFS) is used. To capture the periodicity of the trend of previous blood pressures and create new features, the Autoregressive Integrated Moving Average (ARIMA) model is used. The Extreme Learning Machine (ELM) is used for blood pressure and heart rate prediction. The data is collected remotely through application programming interfaces (APIs) for 24/48/72 h. Their proposed RFSV personalized model outperforms other machine learning techniques in terms of prediction accuracy, such as 10.1% and 6.2% in terms of MAE for SBP and DBP, 10.9% and 7.5% in terms of MAPE for SBP and DBP, 14.4% and 10.4% in terms of RMSE, for SBP and DBP, respectively. Finally, the recommendation is received, and the blood pressure is reduced by 3.8 and 2.3 for systolic and diastolic BP, respectively.
In their study, Jiang et al. [
22] suggested the need for isolating suspected cases in order to control epidemics. To achieve this, they proposed an IoT-based architecture that includes a body temperature monitoring device with thermography. The system employs a risk level, a thermal imaging sensor to detect the cause, and a cloud database for future access to the data. The BeagleBoard-xM module is used to integrate all the monitoring data, which is then transmitted to the cloud for further analysis via a 3G communication module. However, the authors note that environmental conditions can affect the accuracy of the system. To address this, they plan to incorporate an expert decision system that can provide real-time predictions of the spread of infectious diseases. Xu [
23] has proposed an IoT-based electrocardiogram (ECG) monitoring framework for continuous cardiovascular health tracking. To ensure secure data transmission, Lightweight IoT (LSIOT) and lightweight access control (LAC) were introduced. The ECG signals obtained from the MIT-BIH Arrhythmia Database and PhysioNet Challenges Database and ECG signals generated during various physical activities were analyzed and verified in real-time. Serhani et al. [
24] highlighted that ECG signals determine the heart’s health by assessing the cardiac output (CO) at the initial diagnostic stage, and the physician is recommended accordingly. The ECG databases and convolutional neural networks (CNN) classifiers are used to predict heart disorders such as arrhythmia, providing an accuracy of 86.23% via ML techniques. Sun et al. [
25] proposed a heartbeat classification method called BeatClass based on sustainable deep learning. The system comprises two stacked bidirectional long short-term memory networks (Bi-LSTMs) named Rist and Morty for classification and a generative adversarial network (GAN) called MorphGAN to improve the morphological and contextual understanding of heartbeats in rare classes. The F1-scores for N, S, and V heartbeat categorization are 0.6%, 16.0%, and 1.8% higher than the most effective baseline technique for measuring ECG.
Shubam et al. [
26] developed a diet recommendation system for individuals with varying health concerns who aim to lose or gain weight. The system includes a food recommendation system for diabetic patients that utilizes K-mean clustering and Self-Organizing Map for food clustering analysis. The dataset is divided into three categories: Lunch_Data, Breakfast_Data, and Dinner_Data. K-means is used to cluster foods according to calorie content, and the Random Forest algorithm is used to categorize the foods according to Body Mass Index (BMI). The system provides a balanced diet plan and nutritional guidance through a website that has been created for this purpose. The authors report that their proposed system effectively increases the provision of a balanced diet plan and nutritional guidance to individuals with varying health concerns.
Mogaveera and colleagues [
27] developed a system that provides healthier diet and exercise plans to enhance the user’s health by monitoring their fitness parameters. The system takes into consideration the user’s lifestyle, height, weight, sex, age, and activity level. The input data is collected using a decision tree algorithm, and the Random Forest algorithm is used to check the ECG of an affected person with an accuracy of 60–70%. The system uses the USDA Food Composition Database to recommend the Mauritian diet for hypertensive patients and the Health Calabria Food Database for patients with chronic diseases. The accuracy of the recommendations is evaluated using advanced ID3 and C4.5 Decision Tree algorithms, where C4.5 outperforms ID3. The system can classify diabetes, blood pressure, and thyroid disease and recommend food diets using C4.5 with high efficiency.
Hsiao et al. [
28] proposed a nutrient-based diet plan that allows for self-tracking and gives users personalized recommendations about their diet. The system calculates the user’s BMI based on their age, sex, metabolic rate, and physical activity, and provides dietary and exercise advice accordingly. The system is smartphone-based and suggests meals based on mathematical formulations that consider the user’s nutritional goals, budget, and meal preferences. To ensure the diet meets specific constraints, such as nutritional, diversity, and regional constraints, the system will automatically identify other well-converged and well-distributed Pareto-optimal fronts. Additionally, the user can update their preferred dishes in the system to further customize their meal recommendations.
Satija et al. [
29] introduced an innovative IoT-enabled electrocardiogram (ECG) telemetry system that takes signal quality into account for continuous monitoring of cardiac health. The system comprises three modules: ECG signal sensing, automatic signal quality assessment (SQA), and signal-quality aware (SQAw) ECG evaluation and transmission module. The main objective is to propose and improve a lightweight ECG SQA technique that can classify the acquired ECG signal into acceptable or unacceptable classes in real-time for use in various applications. This wireless healthcare monitoring technique involves several steps, such as Baseline Wander Removal and Abrupt Change Detection, followed by ECG signal Absence Detection and HF Noise Detection. The proposed quality-aware IoT paradigm has enormous potential for evaluating the medical acceptability of ECG signals and enhancing the accuracy and reliability of unsupervised diagnosis systems.
Kim et al. [
30] proposed an adaptive load control algorithm that aims to ensure that ZigBee sensors’ delay does not exceed a tolerable time period in ZigBee-based WBAN/WiFi coexistence environments. Their proposed algorithm mitigates the impact of WiFi interference and guarantees the delay performance of ZigBee-based WBANs in various scenarios. In a different study, Jassas et al. [
31] designed and implemented an e-health smart networked system to provide medical information to healthcare providers, especially in emergency situations, prevent the use of inaccurate data, and increase hospital bed capacity during public events. The system uses wireless sensor networks (WSNs) to collect physical parameters from patients’ bodies and transfer them wirelessly to the healthcare staff. This approach ensures the provision of real-time data, prevents the use of inaccurate data, and enables the monitoring of a large number of patients simultaneously.
Ismail et. al. [
32] conducted a study on disease prediction and identification of abnormal health conditions using intelligent data retrieval and classification models. To address this, they utilized the convolutional neural network (CNN), which can effectively extract knowledge from unstructured medical records. They proposed a CNN-regular target detection and recognition model based on the Pearson correlation coefficient and regular pattern behavior. By collecting data from IoT devices and transferring it to a medical database system, the appropriate service can be accurately specified for the right patient at the right time. The study focused on chronic disease-related health problems and lifestyle habits. The accuracy and effectiveness of the CNN model will be influenced by future data quantification techniques, necessitating the use of various raw data preparation techniques.
Alkeem et al. [
33] focused on the integration of new technology to provide patients with more flexibility in monitoring their medical records and accessing them remotely through the cloud. The authors recognized that privacy and security concerns related to healthcare data are numerous and addressed these concerns by proposing a model that incorporates both cloud computing and healthcare technologies. The paper also discussed security issues such as MITM, eavesdropping, and modification attacks and evaluated the system’s accuracy and robustness using the Scyther verification tool. Meanwhile, Mao et al. [
34] noted that AI-based diagnostic systems are rapidly evolving, but clinicians are less familiar with them. They presented their work on building an artificial intelligence medical service model and designing its information flow, general logic, and service implementation method. Simulation results showed that their algorithm model outperformed the two traditional models.
Zhao et al. [
35] proposed a system to securely collect and store electronic health records (EHRs) of patients from hospitals, which are then encrypted and transmitted to a cloud server. The Center for Disease Control (CDC) can periodically query the cloud server to identify patients with similar or increased symptoms, which may indicate the presence of contagious diseases. To ensure the security of the cloud server, the authors proposed using a novel cryptographic algorithm called public-key encryption with DFET (PKE-DFET), which can compare the underlying messages of two ciphertexts without decoding them by selectively disregarding bits in certain positions using Viète’s formula. The authors noted that IoT can be useful in preventing the spread of infectious diseases by providing an early warning system. However, interconnected IoT systems and data advancements are required to achieve this.
Baig et al. [
36] created and implemented models for the Smart Health Monitoring System and provided a comprehensive assessment of its effectiveness, clinical acceptability, strategies, and recommendations. The aim was to evaluate the current state of smart health monitoring systems and conduct a thorough market analysis. Over fifty monitoring systems were selected, classified into various categories, and compared. The paper addresses both the potential challenges and current issues that healthcare professionals face.
3. Methodology
In this section, we provide a detailed description of the study design, data collection procedures, algorithms, and statistical analysis techniques used to develop the framework. We also elaborate on a comprehensive explanation of the process followed to achieve the research objectives, enabling other researchers to replicate the study and validate the findings.
3.1. Significant Healthcare Parameters
The significance of monitoring health parameters in adults cannot be overstated. With the increase in chronic diseases and sedentary lifestyles, it has become crucial to track our physical health and make necessary adjustments to our habits. The following are the key parameters that need to be considered when assessing health issues.
3.1.1. Heart Rate
The pulse rate, also known as the heart rate, refers to the number of times the heart beats per minute. According to the American Heart Association (AHA), the normal pulse rate for adults typically ranges between 60 and 100 beats per minute (bpm). However, various factors such as age, smoking habits, physical fitness, air temperature, family history of cardiovascular disease, emotional state, medication use, body size, and proportions can influence an individual’s pulse rate. Moreover, men and women may have different normal pulse rates. When the pulse rate exceeds 100 bpm, it may indicate tachycardia, which can be caused by several factors, including stress, alcohol consumption, high blood pressure, hyperthyroidism, poor blood flow, and electrolyte imbalance. A study by Santos et al. [
37] explores the latest research on online monitoring, detection, and diagnosis support for cardiovascular diseases within the context of the Internet of Health Things by examining heart rate data.
3.1.2. Oxygen Level
The blood oxygen level, also known as SpO2, is measured using an oximeter. The normal range for adults typically falls between 80 and 100 mm of mercury (mm Hg), or 95% to 100% saturation, as indicated by a study by Olmedo et al. [
38]. Abnormal oxygen levels can indicate underlying conditions such as heart disease, chronic obstructive pulmonary disease (COPD), and bronchial asthma. Proper diet and fitness can help manage these conditions and improve overall health. Hypoxemia, a condition where the blood oxygen level falls below normal, can lead to symptoms such as shortness of breath, chest pain, confusion, headache, and rapid heartbeat.
3.1.3. Temperature
The normal body temperature is typically considered to be 98.6 °F (37 °C), although slight variations above or below this value do not necessarily indicate illness. Several factors, including age, gender, time of day, and activity level, can affect body temperature. There can be significant differences in body temperature among healthy adults, with the daily average temperature varying by 0.25 to 0.5 °C. According to the American College of Critical Care Medicine, a temperature of 100.9 °F (38.3 °C) or higher is considered a fever.
3.1.4. Body Mass Index (BMI)
BMI is a measure of body fat based on a person’s weight in kilograms or pounds divided by their height in meters squared or feet. While a high BMI may indicate high body fat, it cannot be used to diagnose a person’s body fat or health status. However, it can help identify weight categories that may lead to health problems. Losing weight requires more than just reducing calorie intake. Therefore, in this study, the user’s height and weight are collected separately to calculate the BMI, as shown in Equation (
1), which is then used to provide personalized recommendations on diet and fitness.
Considering the aforementioned health parameters, the health monitoring framework in this study has been developed.
3.2. Hardware Formulation
In this phase, the hardware setup and real-time sensor data access are described. To begin, the latest versions of the Arduino Software should be installed, and the sensor library and pin definitions should be imported. The sensors are then placed in their designated positions, and their data is gathered. A transformer is used to control the current supply and provide DC current to the sensors, Arduino, and ESP8266. Real-time sensor data is collected on the Arduino, which is connected to the TTL for accessing data flow to the web server.
For monitoring an individual’s pulse rate, a sensor is connected to the Arduino, and the system collects real-time data that varies based on each person’s unique physiology. The MAX30100 sensor is used to collect real-time data on an individual’s oxygen levels, which is then sent to the Arduino for analysis. If oxygen levels are abnormal, recommendations for a healthy diet and fitness regimen may be given. The LM35 temperature sensor is used to collect real-time temperature data from individuals, which is sent to the Arduino for analysis. Based on this information, suitable recommendations for diet and fitness can be provided.
Here, the framework developed for monitoring the health of individuals aged 17–24 is based on the analysis of a generated dataset.
Figure 2 shows the block diagram of the framework, which utilizes the Max30100 sensor for detecting blood oxygen levels and pulse rate and the LM35 sensor for measuring body temperature. The Arduino UNO is responsible for collecting and displaying the sensor data on an LCD screen, which can be accessed in real-time via an RS32 serial connection and a front-end/back-end interface. To assess one’s health state (fit, medium risk, and high risk), an ML algorithm is used on the backend. Depending on the health state, personalized recommendations for diet and exercise are provided [
39].
3.3. Software Formulation
In addition to the data acquired from the developed hardware module, additional datasets are generated using Python code and subsequently converted to Excel sheets. A data frame is created in Excel, which initially includes multiple health metrics such as heart rate, oxygen saturation, BMI, body temperature, range, and outcome. Using itertools, a data frame is constructed with different parameter combinations, and lists are created for each parameter with various ranges. Python produces the range and result columns using specific requirements, and each parameter is categorized using an ordinal range. These columns are appended to the data frame according to the ranges and conditions used. Finally, the data frame is converted to the Excel format.
The dataset contains a total of approximately 984,000 samples. Among these, around 688,800 samples were utilized for training purposes, and the remaining 295,200 samples were employed for testing. The ratio of training to testing data was maintained at 70:30, where 70% of the total data was used for training while the remaining 30% was reserved for testing.
The developed framework for adult healthcare incorporates a single kit that uses Arduino and digital output to integrate Max30100 for measuring heart rate and oxygen level, as well as LM35 for detecting body temperature. The digital outputs are transformed into real-time data and transmitted directly to the local host using a request button created using the Flask web framework, as well as the front and back ends. The health status is further analyzed, and recommendations for diet and exercise are made accordingly.
3.3.1. Dataset Visualization
A visualization of the results is presented in a count plot, as shown in
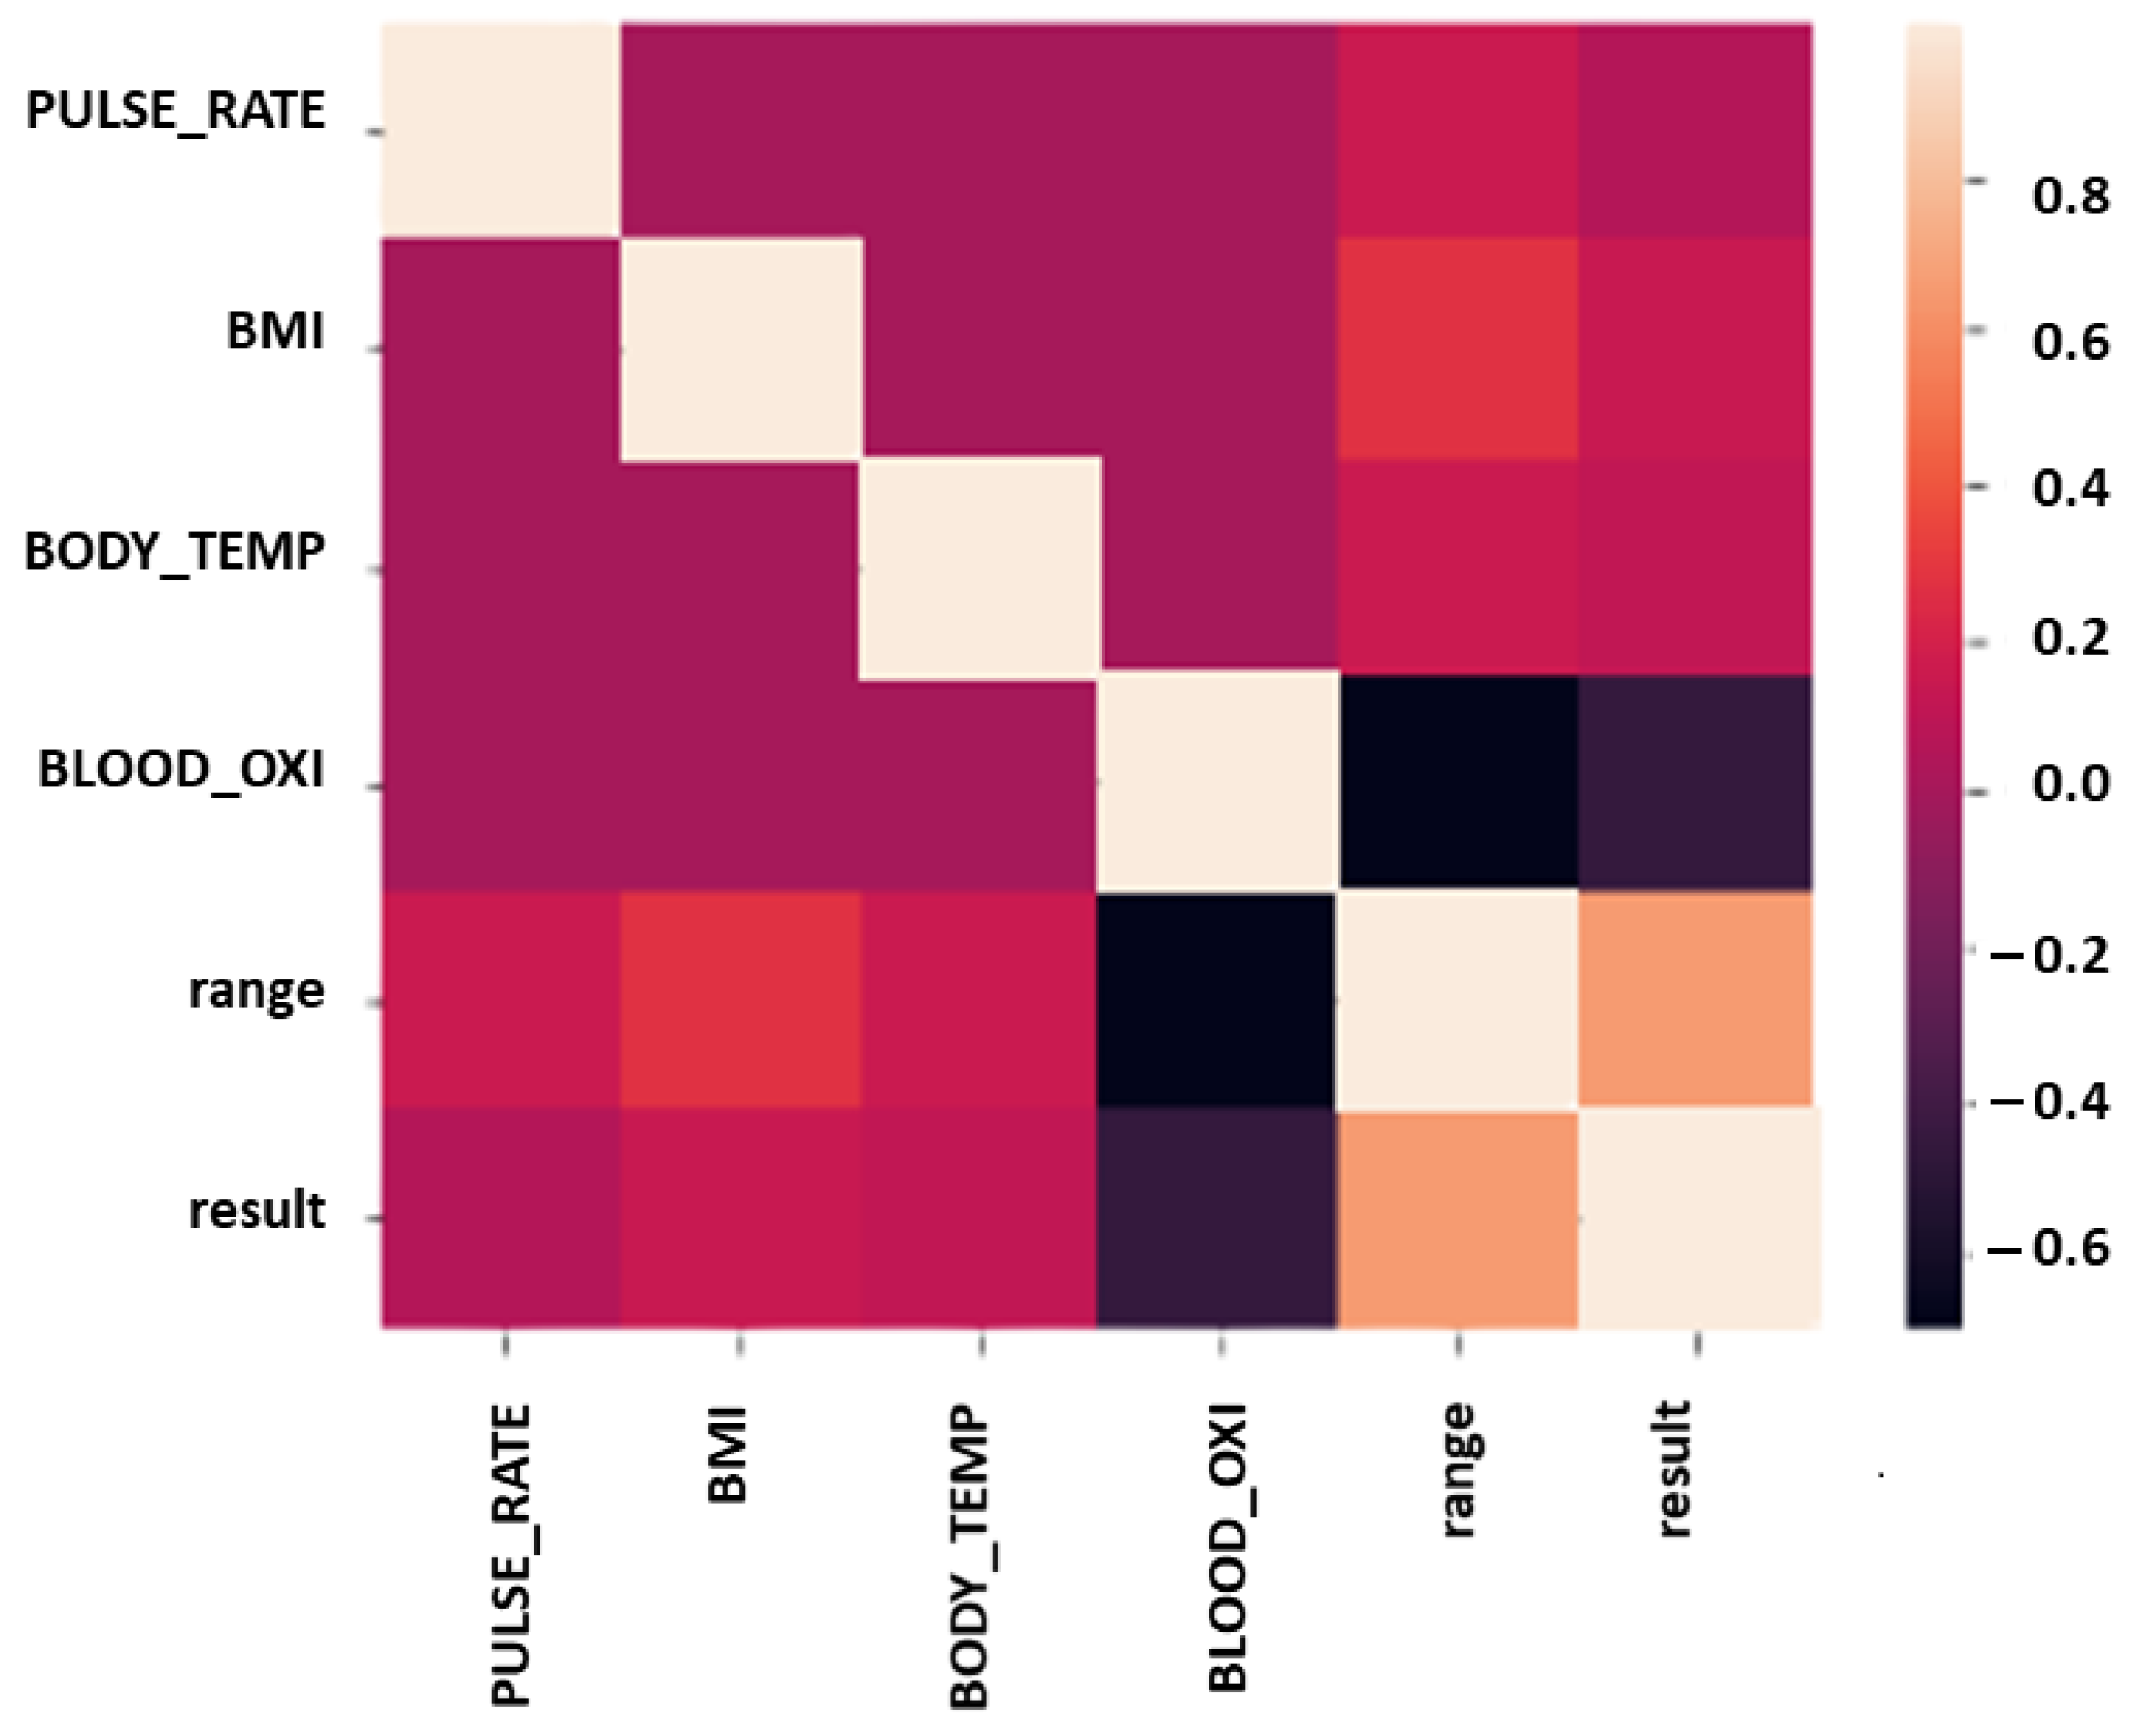
Figure 3a, with a value of 1 indicating fit, 2 indicating medium risk, and 3 indicating high risk. The range value is calculated based on the health parameter range analysis, which shows how many individuals are classified as fit, medium risk, and high risk. Out of the total 984,000 samples, 869 are fit, 32,791 are at medium risk, and 261,540 are at high risk. The use of a heat map, as shown in
Figure 4, is a common data visualization tool that utilizes colors to indicate the magnitude of a particular value within a data set. The diagonal value of the heat map represents a probability of 1, and there is a 0.5 correlation between BMI and range. Heat maps can also be used to evaluate the relationship between parameters.
This study’s dataset distribution is illustrated in a pie chart, as shown in
Figure 3b. Among the total samples, 88.65% were classified as high risk, 11.05% as medium risk, and only 0.30% were considered fit, where labels 1, 2, and 3 indicate fit, medium risk, and high risk, respectively.
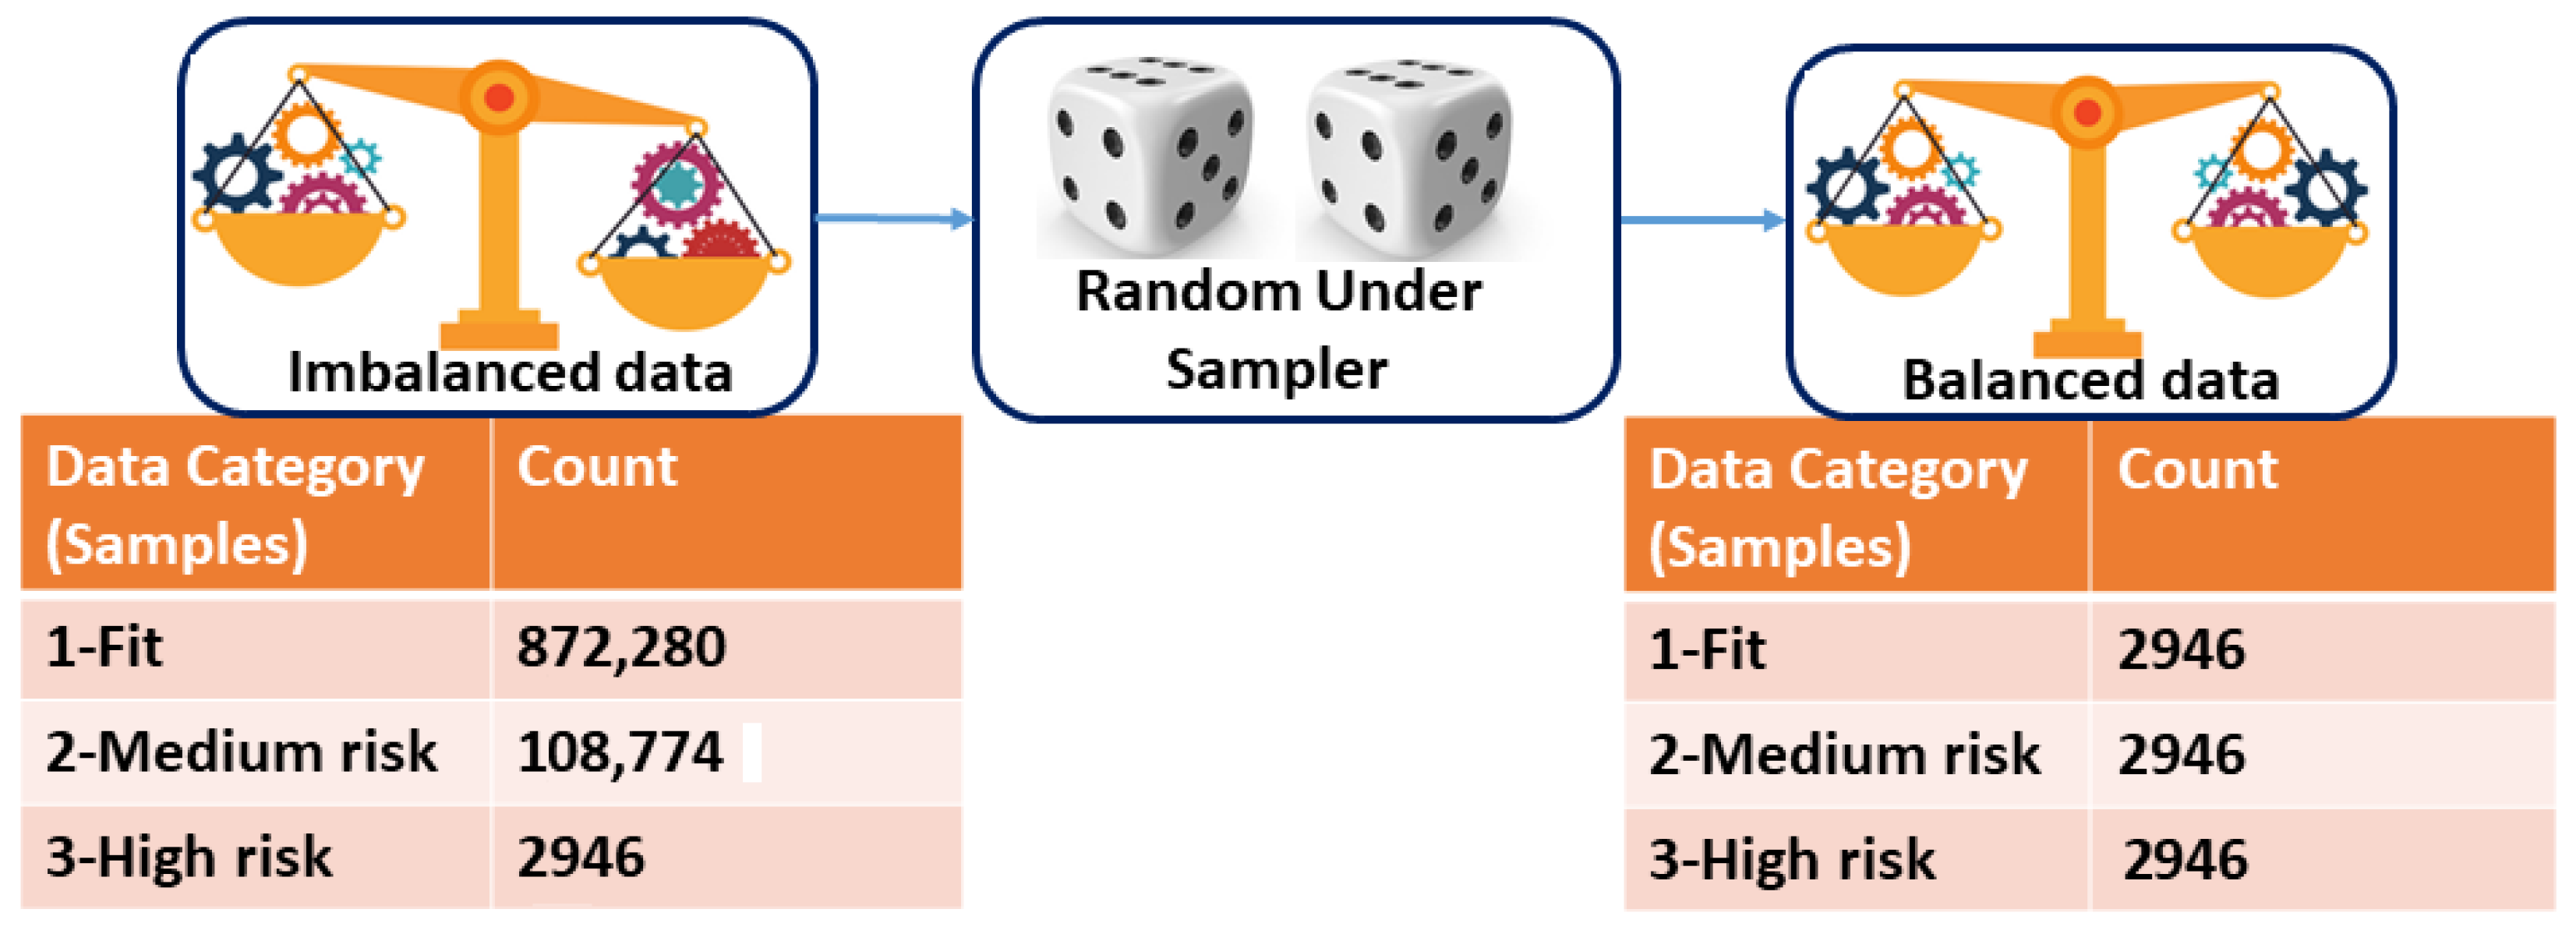
3.3.2. Dataset Imbalance
To balance the dataset, the random up-sampler and imbalance package were used in Jupyter Notebook since the results were unevenly scattered in the produced dataset. The conversion flow is illustrated in
Figure 5.
3.3.3. ML Algorithm Introduction
Random Forest: RF is a powerful machine-learning algorithm that utilizes multiple decision trees to make more precise predictions. By aggregating the predictions of multiple decision trees, it can increase the overall accuracy of the model. It has proven to be an effective method for various healthcare applications, such as predicting disease diagnosis and identifying risk factors for certain health conditions [
40]. With the help of RF, healthcare professionals can make informed decisions and provide personalized treatment plans based on the patient’s unique health conditions. Additionally, RF has also been used to make dietary recommendations for individuals based on their health data. By analyzing various health metrics, such as BMI and body temperature, RF can suggest appropriate diet plans and exercise regimens to help individuals maintain a healthy lifestyle.
CatBoost: CatBoost is a machine learning algorithm that uses gradient-boosted decision trees as its foundation. During training, the algorithm builds a series of decision trees sequentially, with each subsequent tree constructed to minimize the loss compared with the preceding trees. The number of trees to be constructed is determined by the initial settings. CatBoost has proven to be a useful tool in healthcare and can be used for tasks such as predicting disease outcomes and identifying patients at high risk for certain conditions [
41]. In addition, it can be used in conjunction with diet and exercise data to make personalized recommendations for individuals looking to improve their health. By analyzing a patient’s health metrics and lifestyle factors, CatBoost can suggest specific changes to their diet and exercise routine that can lead to significant improvements in their overall health and well-being.
One of the notable advantages of the CatBoost algorithm is its ability to simplify the model-building process, making it effortless. When dealing with datasets that contain categorical features, converting them into a numerical format can often be a challenging task. In such scenarios, opting for CatBoost can significantly enhance the ease of constructing the learning model. Additionally, CatBoost is known for its remarkable speed, surpassing many other machine learning algorithms. It is also expected to deliver optimized and faster operations, whether executed on a GPU or CPU.
Logistic Regression: Logistic Regression is a widely used algorithm in healthcare applications for predicting the probability of binary outcomes, such as whether a patient is likely to develop a particular disease or not. It is a simple yet powerful algorithm that is easy to interpret and implement. The logistic function used in this algorithm maps any input value to a probability value between 0 and 1, allowing for easy decision-making based on the predicted probability. Logistic Regression can be used in diet recommendation systems to predict the likelihood of a patient being overweight or obese and to tailor diet and exercise plans accordingly.
MLP: A feed-forward artificial neural network that produces a set of outputs from a collection of inputs is called a multilayer perceptron (MLP). A directed network connecting the input nodes of the input layers to the output layers—known as an MLP—distinguishes an MLP from other models.
3.3.4. Performance Standards
Performance standards such as precision, recall, F1 score, and accuracy are crucial when using machine learning for healthcare applications. These measures help evaluate the effectiveness of a model in predicting outcomes, diagnosing diseases, and recommending treatments. In healthcare, it is essential to have high precision and recall rates, as incorrect predictions or diagnoses can have serious consequences.
Precision: the proportion of true positives to the total of false positives and true negatives
Recall: the ratio of forecasts that came true as opposed to all other predictions.
F1 score: The F1 score incorporates measures into a single metric that goes from 0 to 1 and accounts for both Precision and Recall.
Accuracy: the proportion of accurate predictions to all other predictions.
3.3.5. Diet and Fitness Recommendation
The development of a diet and fitness app that uses real-time sensor data involves the use of the Flask web framework and HTML. The app has a request button on the front end, which, when pressed, invokes real-time data from the sensor to the app after 10 s. The app then suggests diet and exercise plans for individuals classified as fit, medium-risk, or high-risk based on the interpreted digital output from the sensor. The sensor data is stored as a list, and pickle files are created and utilized in the Flask web framework, which runs in a Jupyter notebook and produces a local host. The Catboost classifier, which yields the maximum accuracy, is employed in this process, and it can be used to generate a personalized diet and exercise plan.
5. Discussion
5.1. Advantages and Disadvantages
The IoT-based framework for personalized health assessment and recommendations offers several advantages. It provides personalized health assessments and recommendations tailored to individual needs, enhancing the effectiveness and relevance of interventions. The framework enables early detection of health risks, allowing for timely intervention and preventive measures. Continuous monitoring through IoT devices facilitates proactive health management and adjustments to lifestyle choices or treatment plans. Additionally, the analysis of IoT-generated data using machine learning techniques provides valuable data-driven insights, empowering individuals with a deeper understanding of their health and supporting informed decision-making.
However, there are certain disadvantages to consider. Privacy and security risks associated with the collection and analysis of personal health data require robust data protection measures. The effectiveness of the framework depends on the availability and reliability of IoT devices and infrastructure, which may be susceptible to technical issues or connectivity problems. Limited accessibility to IoT technologies and digital literacy can create disparities in healthcare access and outcomes. Ethical considerations, such as responsible data handling and obtaining informed consent, are crucial to ensuring the ethical use of personal health data and maintaining trust. Addressing these disadvantages through comprehensive measures is essential to maximizing the benefits and minimizing the risks associated with the IoT-based framework for personalized health assessment and recommendations.
5.2. Challenges and Trends
During the course of this project, several challenges were encountered due to various technological development aspects. Despite significant advancements in assessing health parameters today, there are still limitations on what can be measured accurately, such as pulse rate, oxygen level, and temperature. Additionally, since manually creating a personal dataset using different algorithms, it is not possible to achieve 100% accuracy in all dataset values, which is a significant challenge. Another challenge is the lack of availability of a comprehensive dataset, which may be addressed by incorporating more data sets. Moreover, understanding hardware and machine learning modules has been a challenge. Nonetheless, the project ensures the security and safety of individual data. Finally, difficulties were encountered in achieving higher accuracy using different machine learning algorithms.
The development of an individual nutrition plan posed several challenges, particularly when obtaining datasets of nutrient-rich foods from South India. Not only is it difficult to acquire real-time data, but it also takes a significant amount of time for nutritionists to create a menu that adheres to complex restrictions. Planning a diet that meets an individual’s nutrient requirements can be even more challenging when multiple nutrient limits need to be considered. Similarly, creating a workout plan that aligns with an individual’s specific information was difficult.
5.3. Emerging Technologies
One of the recent trends in healthcare monitoring is the application of Artificial Intelligence (AI) to analyze large volumes of patient data and offer customized recommendations based on their unique health history and requirements. Additionally, Virtual Reality (VR) technology is utilized to provide patients with immersive experiences that can assist them in improving their adherence to dietary guidelines and fitness. Furthermore, a combination of conventional medicine and complementary therapies, such as acupuncture and herbal medicine, known as Integrative medicine, along with telemedicine, is gaining popularity among healthcare practitioners and patients [
10].
Wearable devices, such as fitness trackers, smartwatches, and health monitors, have gained popularity in recent years for their ability to track a variety of health metrics, including heart rate, steps taken, sleep quality, and different diseases such as Psychological Illness, Metabolic Disorders, Coronavirus Diseases, Fatty Liver Diseases, Neurological Disorders, Stress, and Cardiovascular Diseases [
46]. These devices also provide personalized diet and fitness recommendations based on the collected data. In addition, the integration of novelty detectors with Virtual Reality (VR) and IoT devices is leading to more sustainable rehabilitation in health systems [
47]. For people in remote areas or with limited access to healthcare services, video conferencing for personalized coaching has emerged as a new technology that can be used to improve their health. An automatic appointment and the health status of the patient can be sent in the form of an SMS to the physician, and video conferencing can be achieved between the patient and the physician. Smart scales, which can measure weight, body fat percentage, and other metrics, can also sync with mobile apps and provide personalized recommendations based on the collected data.
5.4. Limitations
Regrettably, several typical restrictions exist in current approaches and systems for diet management and advice. Moreover, numerous Android and iOS apps are designed for physical training and health recommendations, but few of them suggest dietary recommendations. Neither wearable devices nor mobile apps for healthcare self-management were assessed. While healthcare monitoring systems can propose personalized recommendations based on an individual’s specific requirements, many do not consider individual variances such as age, gender, and medical history. Additionally, it may only concentrate on a limited number of health metrics, such as nutrition and physical activity, while disregarding other essential health aspects, including mental health and stress reduction. Finally, personal health information collection always carries the risk of data leaks and privacy breaches.


 ,
, 


