Robust Surveillance Schemes Based on Proportional Hazard Model for Monitoring Reliability Data
Abstract
:1. Introduction
2. Model and Assumptions of the Process
3. Process Monitoring Procedures
4. Performance Evaluation and Comparison
4.1. Estimation of Model Parameters
4.2. Performance Comparison Criteria
4.3. Performance Evaluation
5. Illustrative Examples
6. Conclusions
Author Contributions
Funding
Data Availability Statement
Acknowledgments
Conflicts of Interest
Notations
| X | First stage variable |
| Mean of the first stage variable | |
| Variance of the first stage variable | |
| T | Second stage variable |
| Shape parameter of the second stage variable | |
| s | Scale parameter of the second stage variable |
| Base-line hazard function | |
| Base-line survival function | |
| Covariate function | |
| r | Residual |
| k | Turning constant |
| CUSUM statistic at time j | |
| Weight function at time j | |
| Conditional hazard function | |
| Conditional survival function | |
| Control limit for the CUSUM chart | |
| EWMA statistic at time j | |
| Control limit for the EWMA chart | |
| smoothing parameter | |
| In-control mean | |
| Regression coefficient | |
| Shift | |
| Minimum value of shifts | |
| Maximum value of shifts |
References
- Karim, M.R.; Islam, M.A.; Karim, M.R.; Islam, M.A. Reliability and Survival Analyses: Concepts and Definitions. In Reliability and Survival Analysis; Springer: Singapore, 2019; pp. 1–11. [Google Scholar]
- Kleinbaum, D.G.; Klein, M. Survival Analysis a Self-Learning Text; Springer: Berlin/Heidelberg, Germany, 1996. [Google Scholar]
- Liberto, D. What Is Survival Analysis? 2021. Available online: https://www.investopedia.com/terms/s/survival-analysis.asp (accessed on 24 February 2023).
- Park, C.; Tsui, K.L. A profile monitoring of the multi-stage process. Qual. Technol. Quant. Manag. 2019, 16, 407–423. [Google Scholar] [CrossRef]
- Kalaei, M.; Atashgar, K.; Niaki, S.T.A.; Soleimani, P. Phase I monitoring of simple linear profiles in multistage processes with cascade property. Int. J. Adv. Manuf. Technol. 2018, 94, 1745–1757. [Google Scholar] [CrossRef]
- Rodríguez, G. Lecture Notes on Generalized Linear Models. 2007. Available online: https://grodri.github.io/glms/notes/ (accessed on 24 February 2023).
- Hawkins, D.M. Regression adjustment for variables in multivariate quality control. J. Qual. Technol. 1993, 25, 170–182. [Google Scholar] [CrossRef]
- Sulek, J.M.; Marucheck, A.; Lind, M.R. Measuring performance in multi-stage service operations: An application of cause selecting control charts. J. Oper. Manag. 2006, 24, 711–727. [Google Scholar] [CrossRef]
- Asadzadeh, S.; Aghaei, A.; Yang, S.F. Monitoring and diagnosing multistage processes: A review of cause selecting control charts. J. Ind. Syst. Eng. 2008, 2, 214–235. [Google Scholar]
- Zheng, R.; Wang, J.; Zhang, Y. A hybrid repair-replacement policy in the proportional hazards model. Eur. J. Oper. Res. 2023, 304, 1011–1021. [Google Scholar] [CrossRef]
- Biswas, P.; Kalbfleisch, J.D. A risk-adjusted CUSUM in continuous time based on the Cox’s model. Stat. Med. 2008, 27, 3382–3406. [Google Scholar] [CrossRef] [PubMed]
- Nabeel, M.; Ali, S.; Shah, I. Robust proportional hazard-based monitoring schemes for reliability data. Qual. Reliab. Eng. Int. 2021, 37, 3347–3361. [Google Scholar] [CrossRef]
- Sego, L.H.; Reynolds, M.R., Jr.; Woodall, W.H. Risk-adjusted monitoring of survival times. Stat. Med. 2009, 28, 1386–1401. [Google Scholar] [CrossRef]
- Olteanu, D.A. Cumulative Sum Control Charts for Censored Reliability Data. Ph.D. Thesis, Virginia Tech, Blacksburg, VA, USA, 2010. [Google Scholar]
- Asadzadeh, S.; Aghaie, A. Improving the product reliability in multistage manufacturing and service operations. Qual. Reliab. Eng. Int. 2012, 28, 397–407. [Google Scholar] [CrossRef]
- Goodarzi, A.; Amiri, A.; Asadzadeh, S. Monitoring the censored lognormal reliability data in a three-stage process using AFT model. J. Ind. Eng. Int. 2017, 13, 67–80. [Google Scholar] [CrossRef]
- Zhang, L.; Gan, F.F.; Loke, C.K. Phase I study of surgical performances with risk-adjusted Shewhart control charts. Qual. Technol. Quant. Manag. 2012, 9, 375–382. [Google Scholar] [CrossRef]
- Wang, F.K.; Cheng, X.B. An exponentially weighted moving average chart based on likelihood-ratio test for monitoring Weibull mean and variance with subgroups. Qual. Reliab. Eng. Int. 2017, 33, 2409–2421. [Google Scholar] [CrossRef]
- Asadzadeh, S.; Baghaei, A. Robust AFT-based monitoring procedures for reliability data. Qual. Technol. Quant. Manag. 2020, 17, 1–15. [Google Scholar] [CrossRef]
- Ding, N.; He, Z.; Shi, L.; Qu, L. A new risk-adjusted EWMA control chart based on survival time for monitoring surgical outcome quality. Qual. Reliab. Eng. Int. 2021, 37, 1650–1663. [Google Scholar] [CrossRef]
- Ali, S.; Shamim, R.; Shah, I.; Alrweili, H.; Marcon, G. Memory-type control charts for censored reliability data. Qual. Reliab. Eng. Int. 2023, 3, 1–20. [Google Scholar] [CrossRef]
- Kazemi, S.; Noorossana, R.; Rasouli, M.; Nayebpour, M.R.; Heidari, K. Monitoring therapeutic processes using risk-adjusted multivariate Tukey’s CUSUM control chart. Qual. Reliab. Eng. Int. 2021, 37, 2818–2833. [Google Scholar] [CrossRef]
- Asif, F.; Noor-ul Amin, M. Adaptive risk adjusted exponentially weighted moving average control chart based on accelerated failure time regression. Qual. Reliab. Eng. Int. 2022, 38, 4169–4181. [Google Scholar] [CrossRef]
- Vasconcelos, R.M.; Quinino, R.C.; Ho, L.L.; Cruz, F.R. About Shewhart control charts to monitor the Weibull mean based on a Gamma distribution. Qual. Reliab. Eng. Int. 2022, 38, 4210–4222. [Google Scholar] [CrossRef]
- Nabeel, M.; Ali, S.; Shah, I. Proportional hazard-based robust monitoring schemes using logistic distribution. Qual. Reliab. Eng. Int. 2022, 38, 3304–3321. [Google Scholar] [CrossRef]
- Park, C.; Lee, J. Monitoring profiles in multistage processes using the multivariate multiple regression model. Qual. Reliab. Eng. Int. 2022, 38, 3437–3450. [Google Scholar] [CrossRef]
- Fox, J.; Weisberg, S. An R Companion to Applied Regression, 3rd ed.; SAGE Publications: Thousand Oaks, CA, USA, 2018. [Google Scholar]
- Susanti, Y.; Pratiwi, H.; Sulistijowati, S.; Twenty, L. M estimation, S estimation, and MM estimation in robust regression. Int. J. Pure Appl. Math. 2014, 91, 349–360. [Google Scholar] [CrossRef]
- Cabana, E.; Lillo, R.E. Robust multivariate control chart based on shrinkage for individual observations. J. Qual. Technol. 2022, 54, 415–440. [Google Scholar] [CrossRef]
- Rousseeuw, P.; Yohai, V. Robust regression by means of S-estimators. In Robust and Nonlinear Time Series Analysis; Springer: Berlin/Heidelberg, Germany, 1984; pp. 256–272. [Google Scholar]
- Yohai, V.J. High breakdown-point and high efficiency robust estimates for regression. Ann. Stat. 1987, 15, 642–656. [Google Scholar] [CrossRef]
- Wisnowski, J.W.; Simpson, J.R.; Montgomery, D.C. An improved compound estimator for robust regression. Commun. Stat. Simul. Comput. 2002, 31, 653–672. [Google Scholar] [CrossRef]
- Asadzadeh, S.; Zerehsaz, Y.; Saghaei, A.; Aghaie, A. Compound-estimator based cause-selecting control chart for monitoring multistage processes. Commun. Stat. Simul. Comput. 2011, 40, 322–344. [Google Scholar] [CrossRef]
- Jearkpaporn, D.; Montgomery, D.; Runger, G.; Borror, C. Model-based process monitoring using robust generalized linear models. Int. J. Prod. Res. 2005, 43, 1337–1354. [Google Scholar] [CrossRef]
- Shu, L.; Tsung, F.; Tsui, K.L. Run-length performance of regression control charts with estimated parameters. J. Qual. Technol. 2004, 36, 280–292. [Google Scholar] [CrossRef]
- Ampanthong, P.; Suwattee, P. Robust estimation of regression coefficients with outliers. Thail. Stat. 2010, 8, 183–205. [Google Scholar]
- Alma, Ö.G. Comparison of robust regression methods in linear regression. Int. J. Contemp. Math. Sci. 2011, 6, 409–421. [Google Scholar]
- Mutlu, N.; Sazak, H.S. The Comparison of the Estimators for the Parameters of the General Linear Regression Model via Simulation and Two Real Life Data Examples. Süleyman Demirel Üniv. Fen Bilim. Enstitüsü Derg. 2019, 23, 119–130. [Google Scholar] [CrossRef]
- Onur, T.; Cetin, M. The comparing of S-estimator and M-estimators in linear regression. Gazi Univ. J. Sci. 2011, 24, 747–752. [Google Scholar]
- Kumar, N.; Jaiswal, S. Use of median-based estimator to construct Phase II exponential chart. Qual. Reliab. Eng. Int. 2020, 36, 2044–2056. [Google Scholar] [CrossRef]
- Maleki, F.; Mehri, S.; Aghaie, A.; Shahriari, H. Robust T2 control chart using median-based estimators. Qual. Reliab. Eng. Int. 2020, 36, 2187–2201. [Google Scholar] [CrossRef]
- Cabana, E.; Lillo, R.E.; Laniado, H. Robust regression based on shrinkage with application to Living Environment Deprivation. Stoch. Environ. Res. Risk Assess. 2020, 34, 293–310. [Google Scholar] [CrossRef]
- Cabana, E.; Lillo, R.E.; Laniado, H. Multivariate outlier detection based on a robust Mahalanobis distance with shrinkage estimators. Stat. Pap. 2021, 62, 1583–1609. [Google Scholar] [CrossRef]
- Nadarajah, S.; Haghighi, F. An extension of the exponential distribution. Stat. J. Theor. Appl. Stat. 2011, 45, 543–558. [Google Scholar] [CrossRef]
- George, B.; Seals, S.; Aban, I. Survival analysis and regression models. J. Nucl. Cardiol. 2014, 21, 686–694. [Google Scholar] [CrossRef]
- Faruk, A. The comparison of proportional hazards and accelerated failure time models in analyzing the first birth interval survival data. In Proceedings of the Journal of Physics: Conference Series; IOP Publishing: Bristol, UK, 2018; Volume 974, p. 012008. [Google Scholar]
- Kumar, D.; Klefsjö, B. Proportional hazards model: A review. Reliab. Eng. Syst. Saf. 1994, 44, 177–188. [Google Scholar] [CrossRef]
- Lawless, J.F. Statistical Models and Methods for Lifetime Data; John Wiley & Sons: Hoboken, NJ, USA, 2011; Volume 362. [Google Scholar]
- Qiu, P. Introduction to Statistical Process Control; Chapman & Hall/CRC Texts in Statistical Science; Taylor & Francis: Boca Raton, FL, USA, 2014. [Google Scholar]
- Montgomery, D.C. Introduction to Statistical Quality Control; John Wiley & Sons: Hoboken, NJ, USA, 2009. [Google Scholar]
- R Core Team. R: A Language and Environment for Statistical Computing; R Foundation for Statistical Computing: Vienna, Austria, 2021. [Google Scholar]
- Ali, S.; Pievatolo, A. High quality process monitoring using a class of inter-arrival time distributions of the renewal process. Comput. Ind. Eng. 2016, 94, 45–62. [Google Scholar] [CrossRef]
- Sood, H. Compressive Strength of Cement Concrete Cubes. 2013. Available online: https://www.youtube.com/watch?v=e8bH26-3PCw (accessed on 13 March 2022).
- Dua, D.; Graff, C. UCI Machine Learning Repository. 2017. Available online: http://archive.ics.uci.edu/ml (accessed on 23 September 2021).
- Yeh, I.C. Modeling of strength of high-performance concrete using artificial neural networks. Cem. Concr. Res. 1998, 28, 1797–1808. [Google Scholar] [CrossRef]
- Mishra, G. Workability of Concrete—Types and Effects on Concrete Strength. 2018. Available online: https://theconstructor.org/concrete/workability-of-concrete-types-strength/11739/ (accessed on 21 February 2023).
- TeamCivil. Cohesiveness and Consistency of Concrete. 2021. Available online: https://www.civilengineeringforum.me/cohesiveness-and-consistency-of-concrete/ (accessed on 23 December 2022).
- Bala. Consistency Test of Cement—Test Procedure and Importance. 2021. Available online: https://civilplanets.com/consistency-test-of-cement/#:~:text=The%20cement%20reacts%20with%20water,to%20the%20concrete%20or%20mortar (accessed on 13 November 2022).
- Yeh, I.C. Modeling slump flow of concrete using second-order regressions and artificial neural networks. Cem. Concr. Compos. 2007, 29, 474–480. [Google Scholar] [CrossRef]

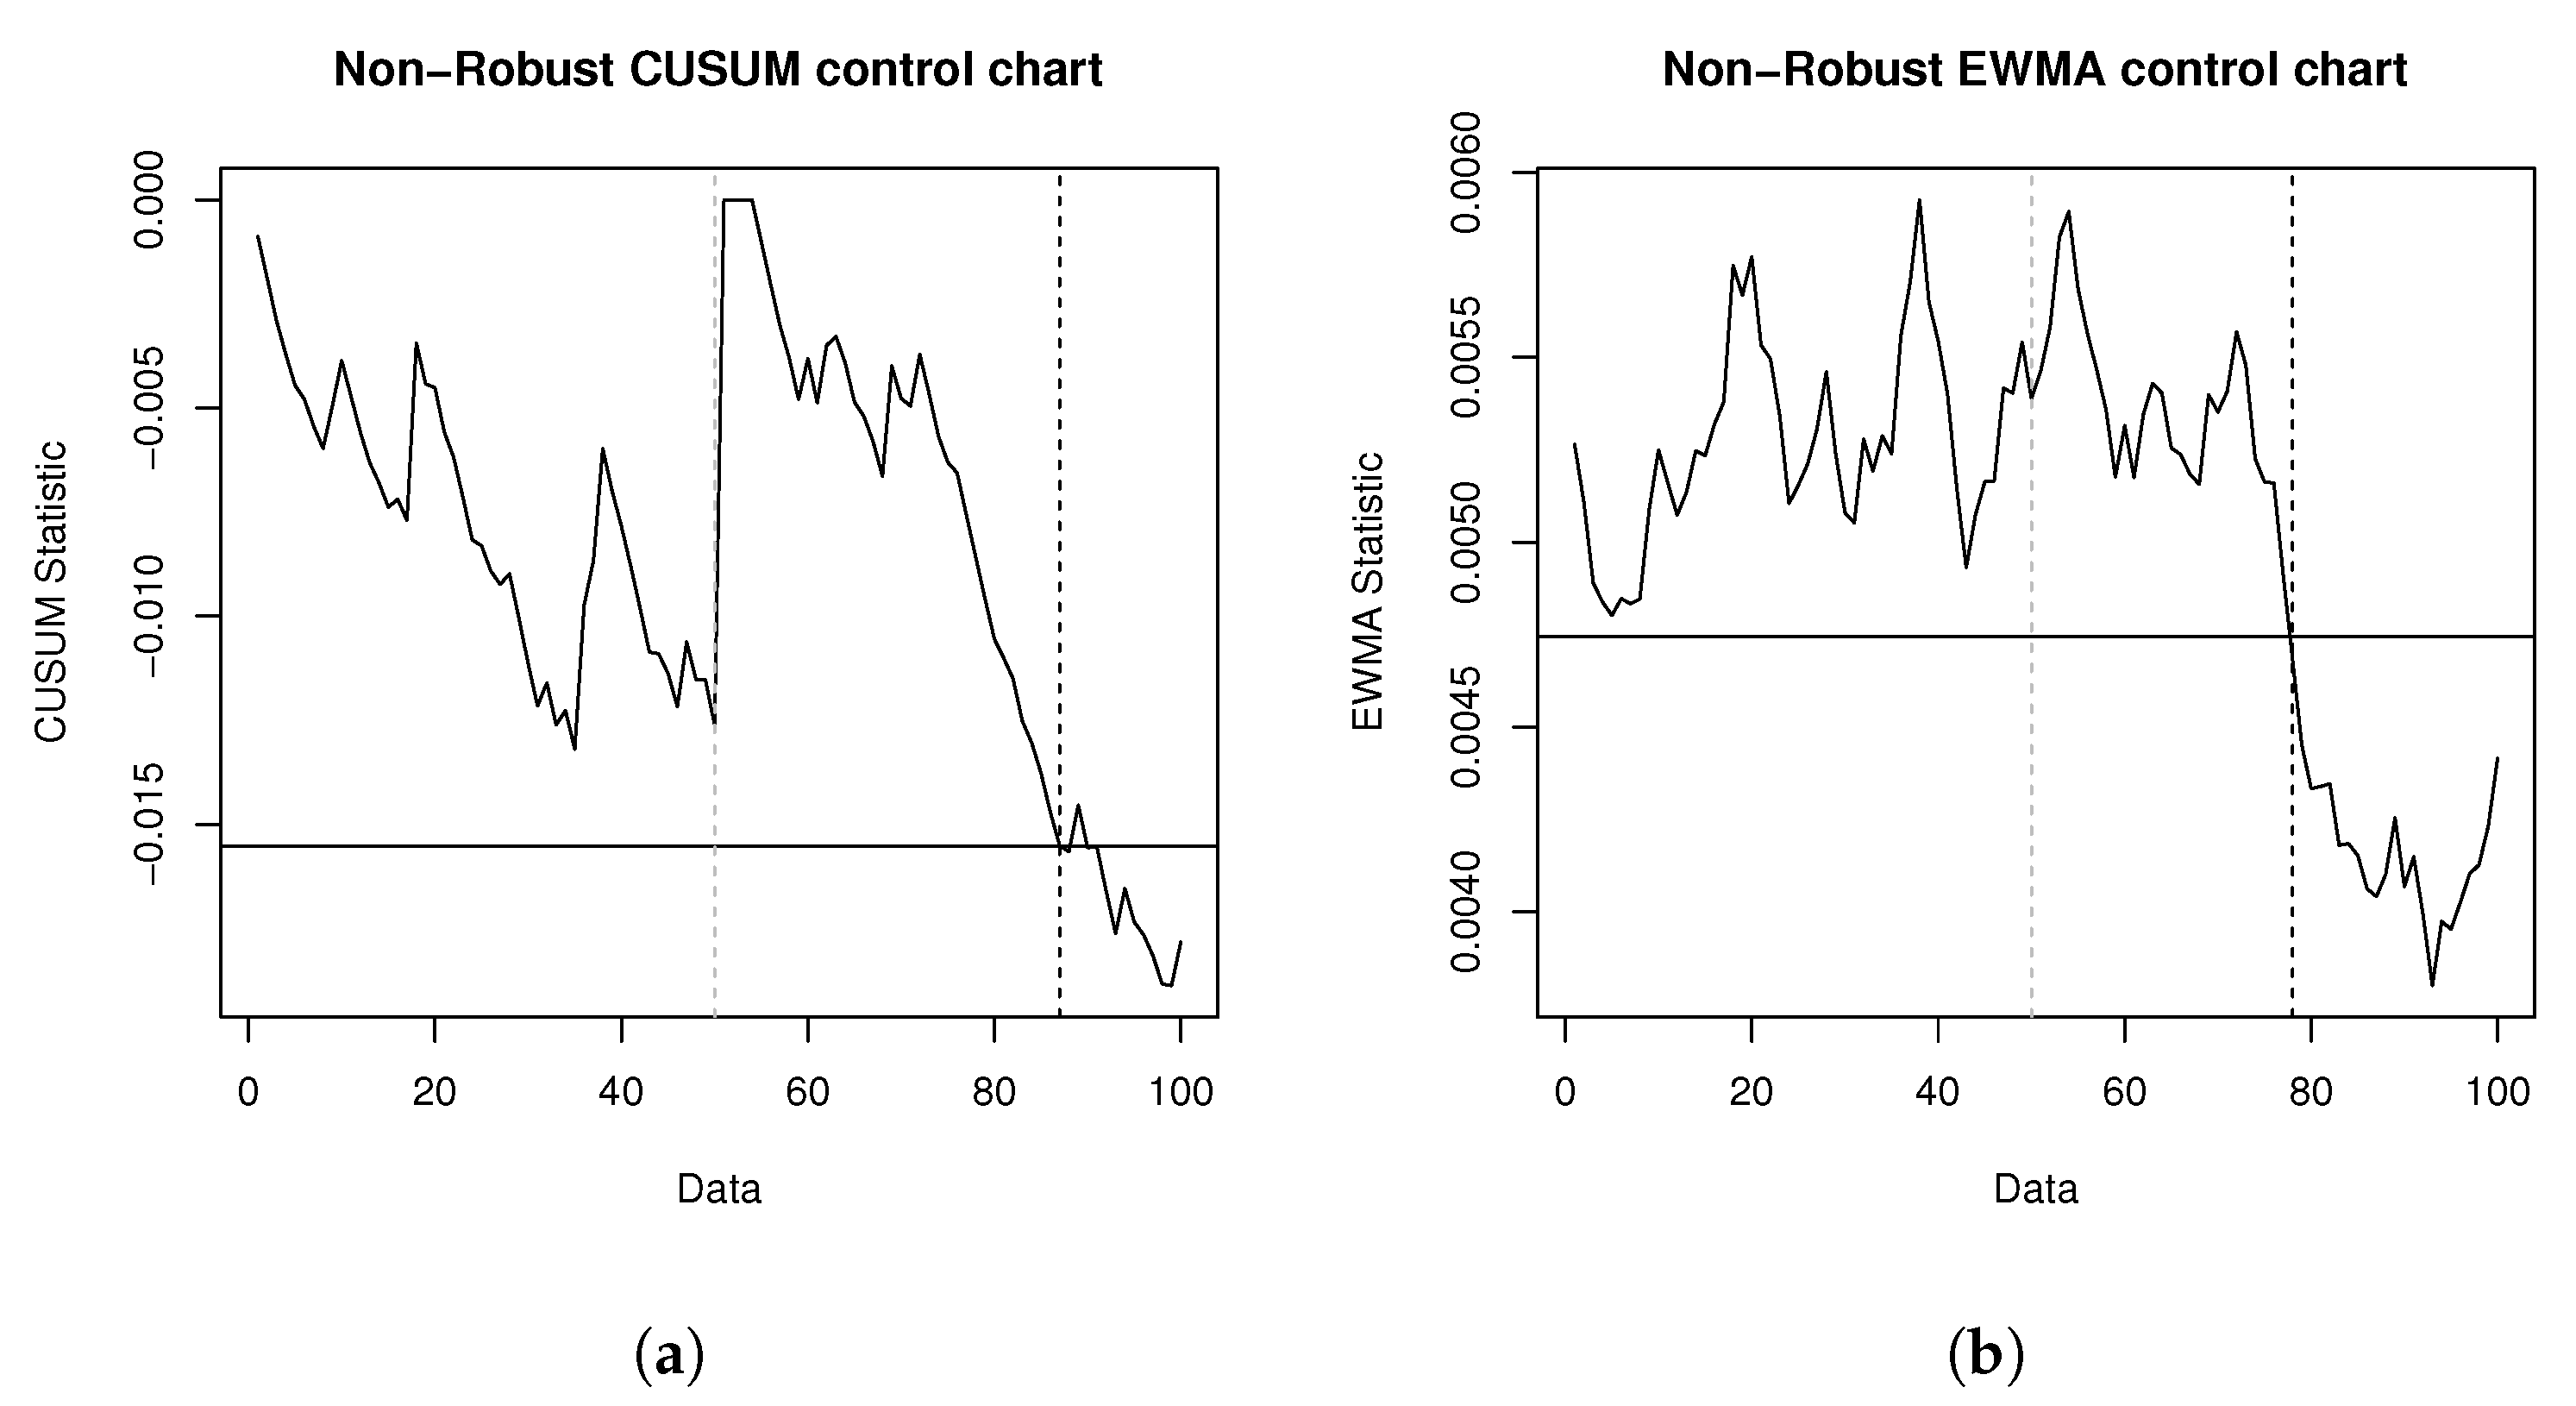
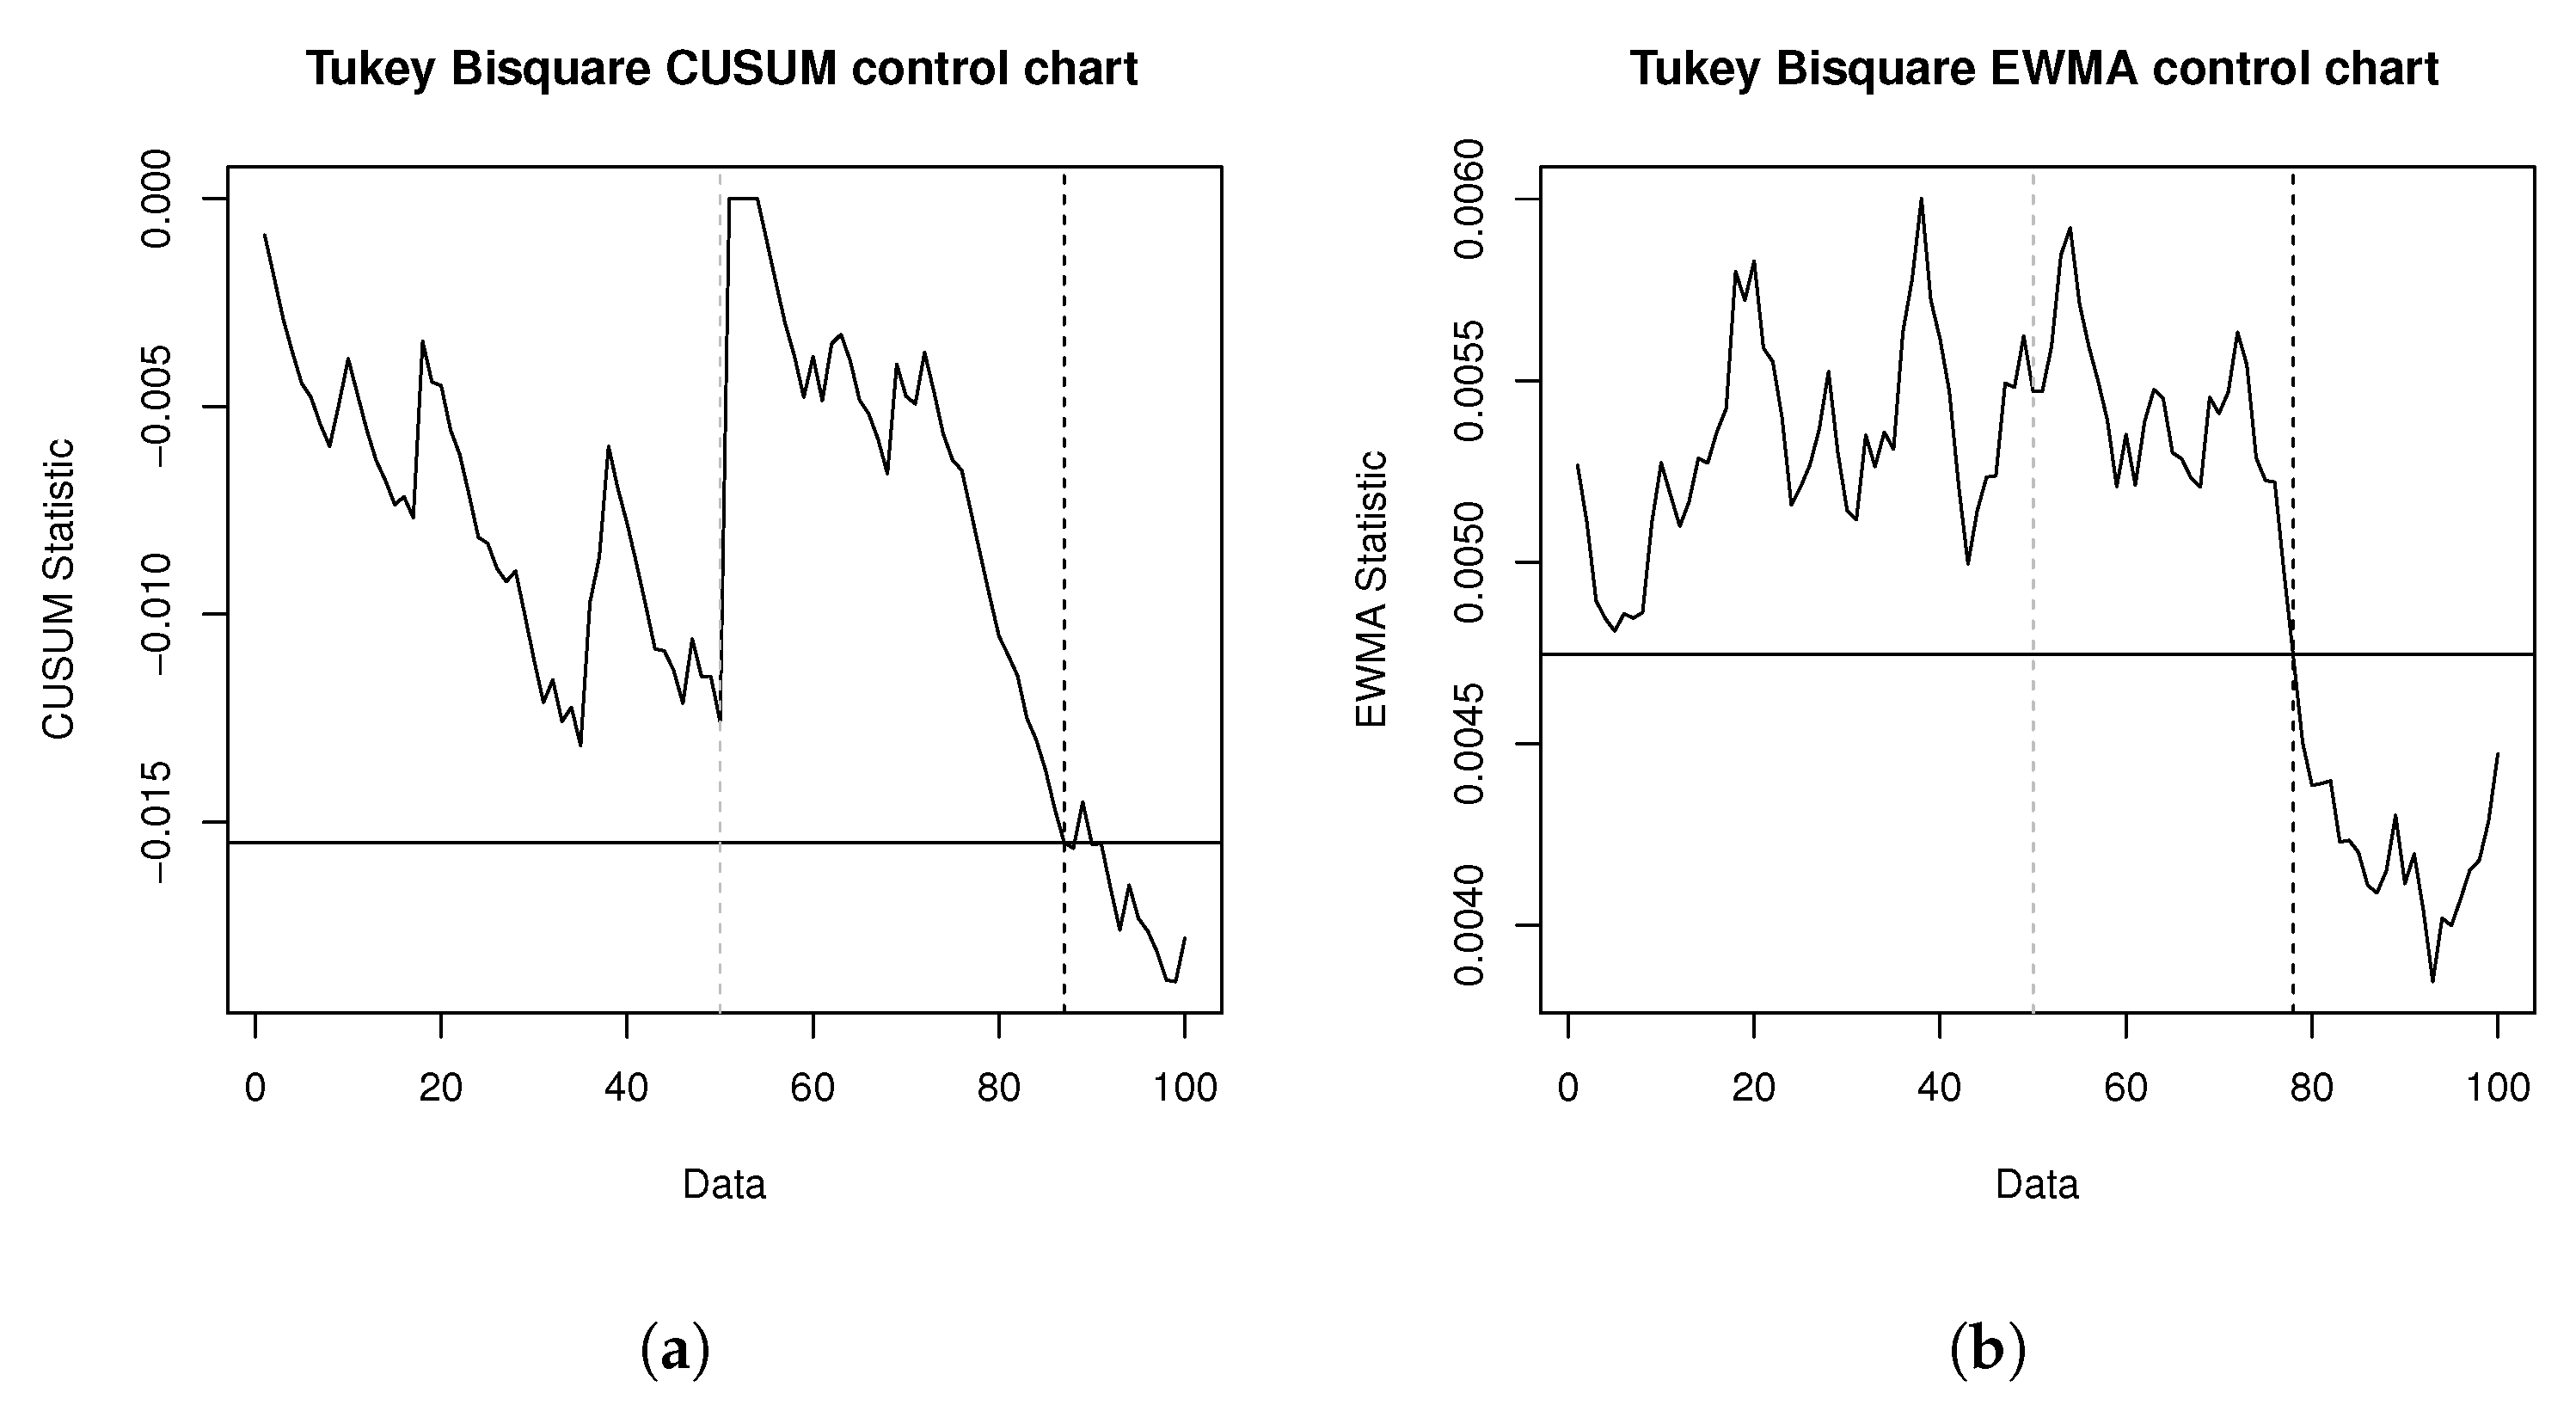
| Scenario | S.E () | |
|---|---|---|
| Non-robust | ||
| Robust (Huber) | ||
| Robust (Tukey bi-square) |
| 1 | 0.975 | 0.95 | 0.9 | 0.85 | 0.8 | 0.75 | 0.7 | EQL | PCI | |||
|---|---|---|---|---|---|---|---|---|---|---|---|---|
| Non-robust scenario | ||||||||||||
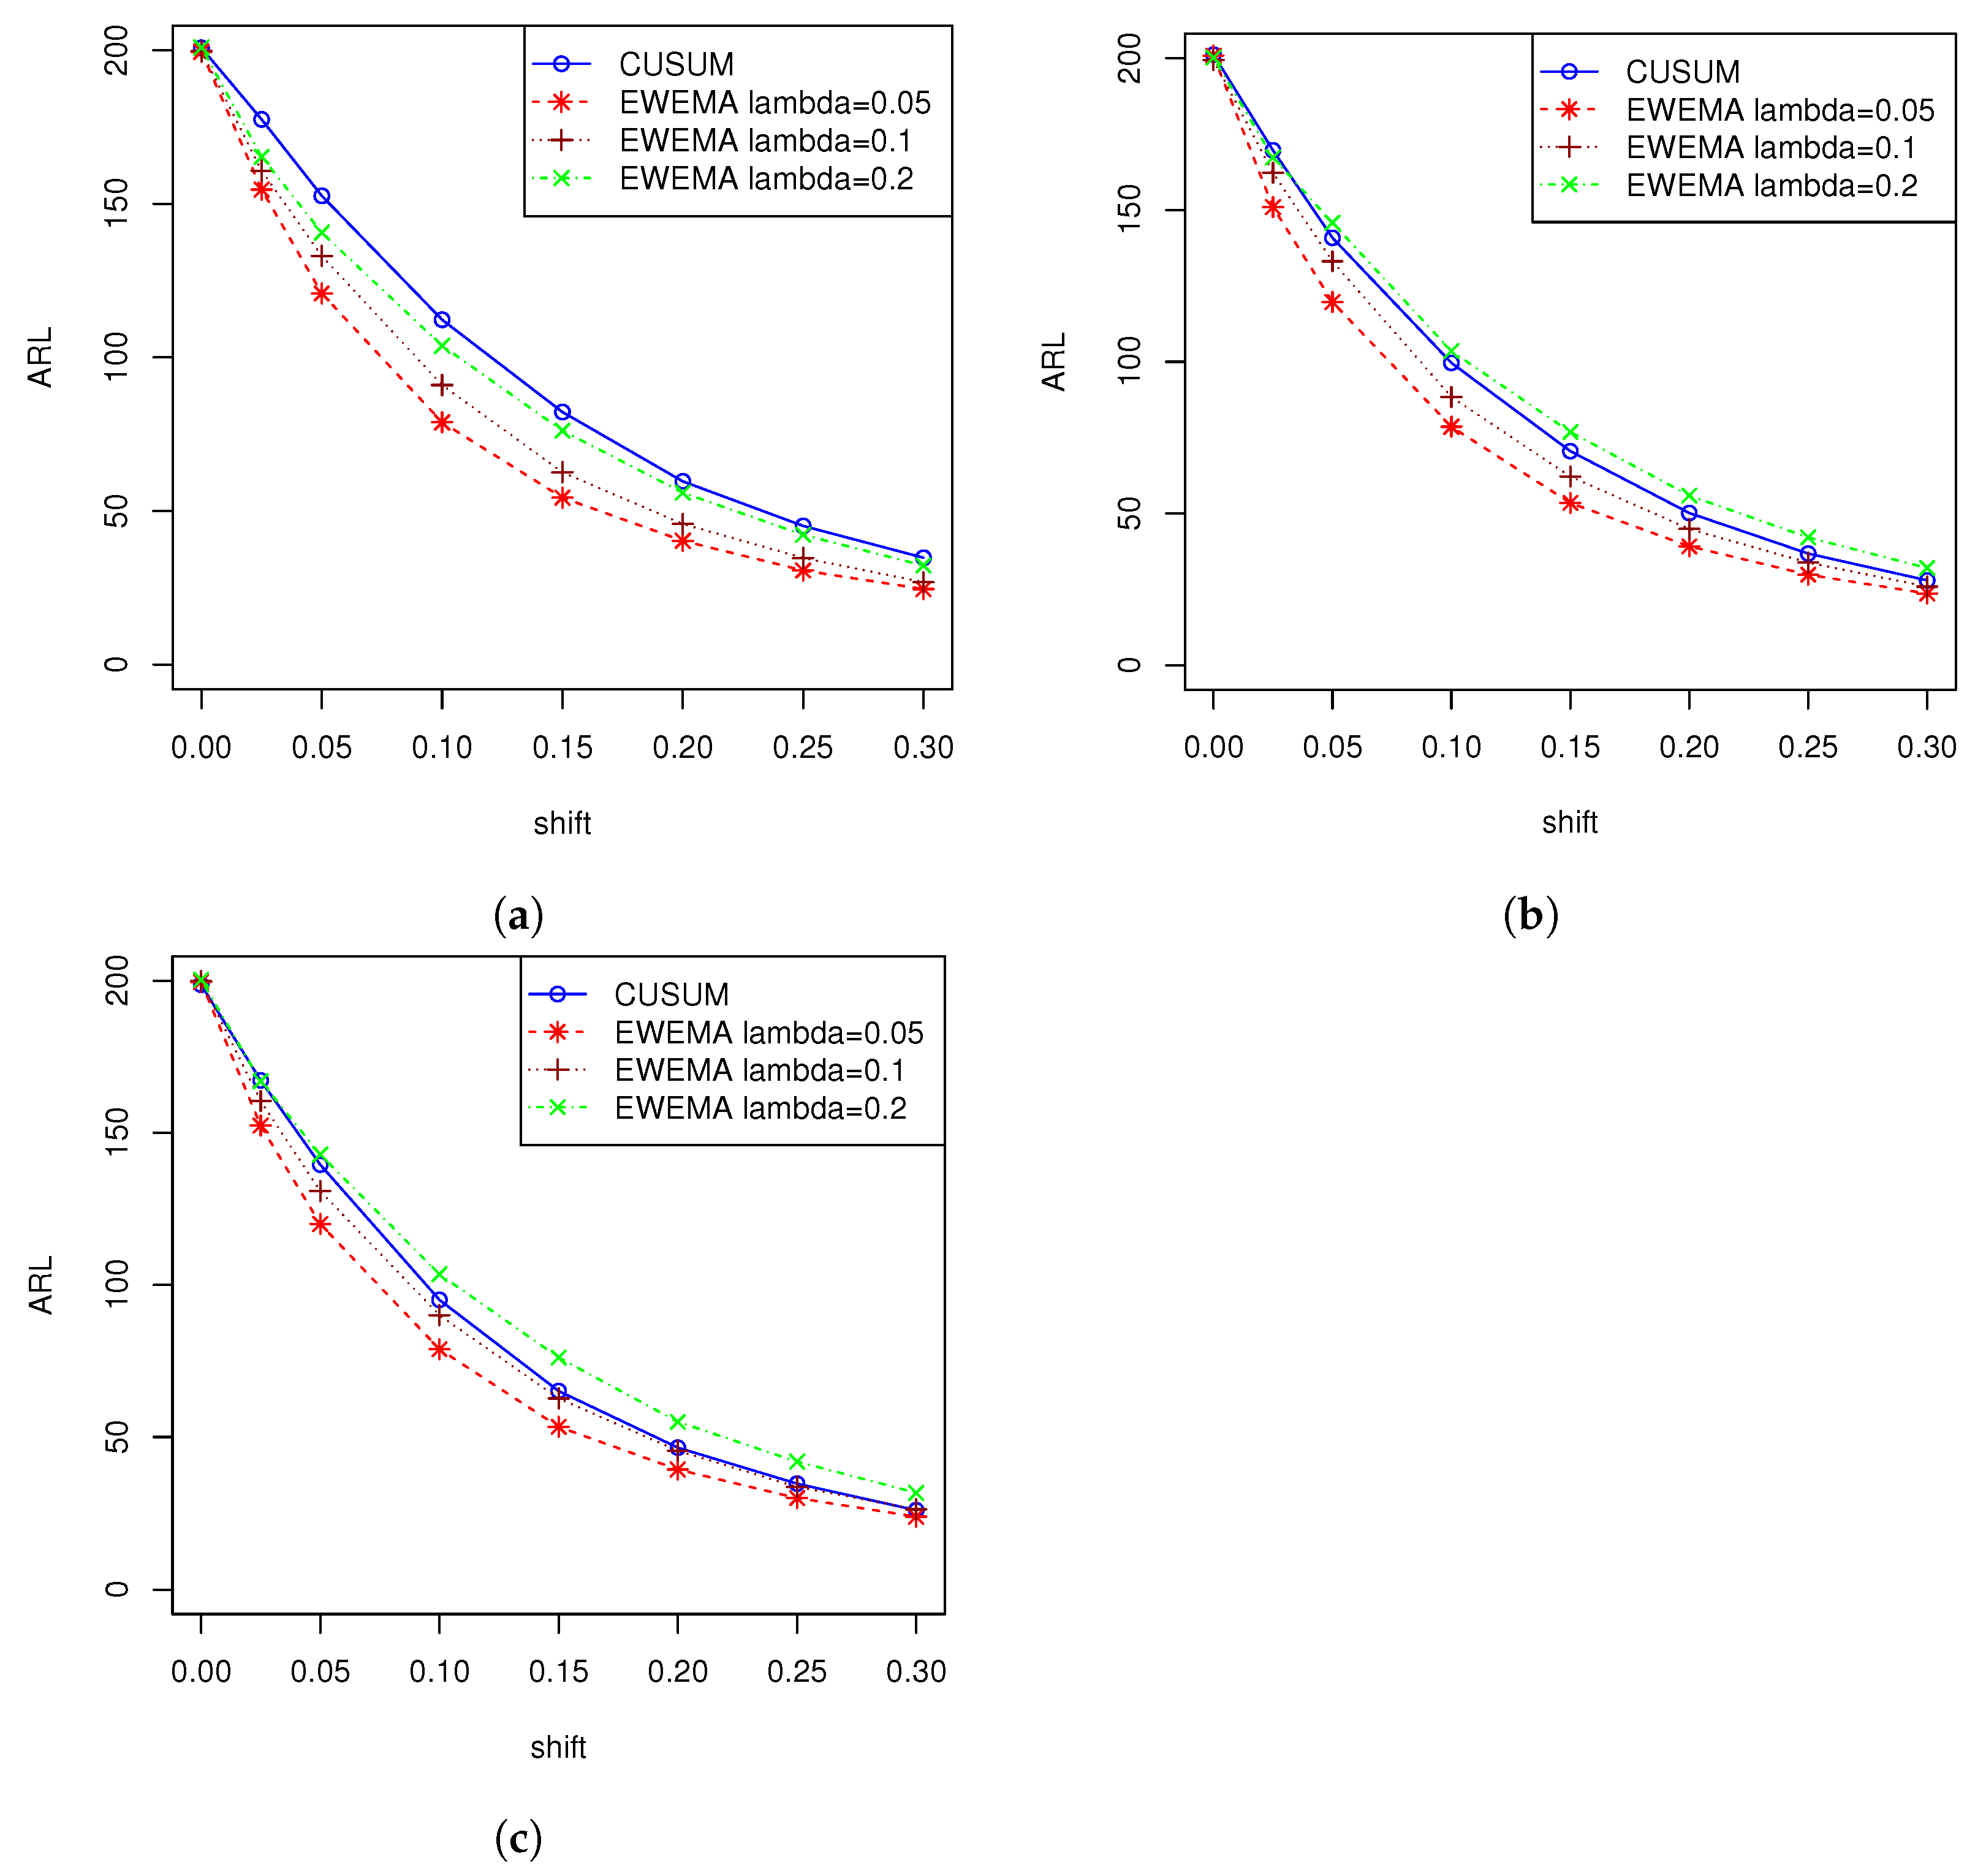
| CUSUM | ARL | 200.7443 | 177.465 | 152.5909 | 112.2530 | 82.2053 | 59.6388 | 45.1340 | 34.7939 | 1.6864 | 1.4611 | |
| SD | 165.6702 | 145.2413 | 123.1018 | 87.2894 | 61.6965 | 43.0580 | 30.8276 | 23.0219 | ||||
| 55.0000 | 77.0000 | 66.0000 | 51.0000 | 39.0000 | 47.0000 | 24.0000 | 19.0000 | |||||
| 200.7443 | 177.465 | 152.5909 | 112.2530 | 82.2053 | 59.6388 | 45.1340 | 34.7939 | |||||
| 265.0000 | 233.0000 | 201.0000 | 146.0000 | 108.0000 | 77.0000 | 57.0000 | 44.0000 | |||||
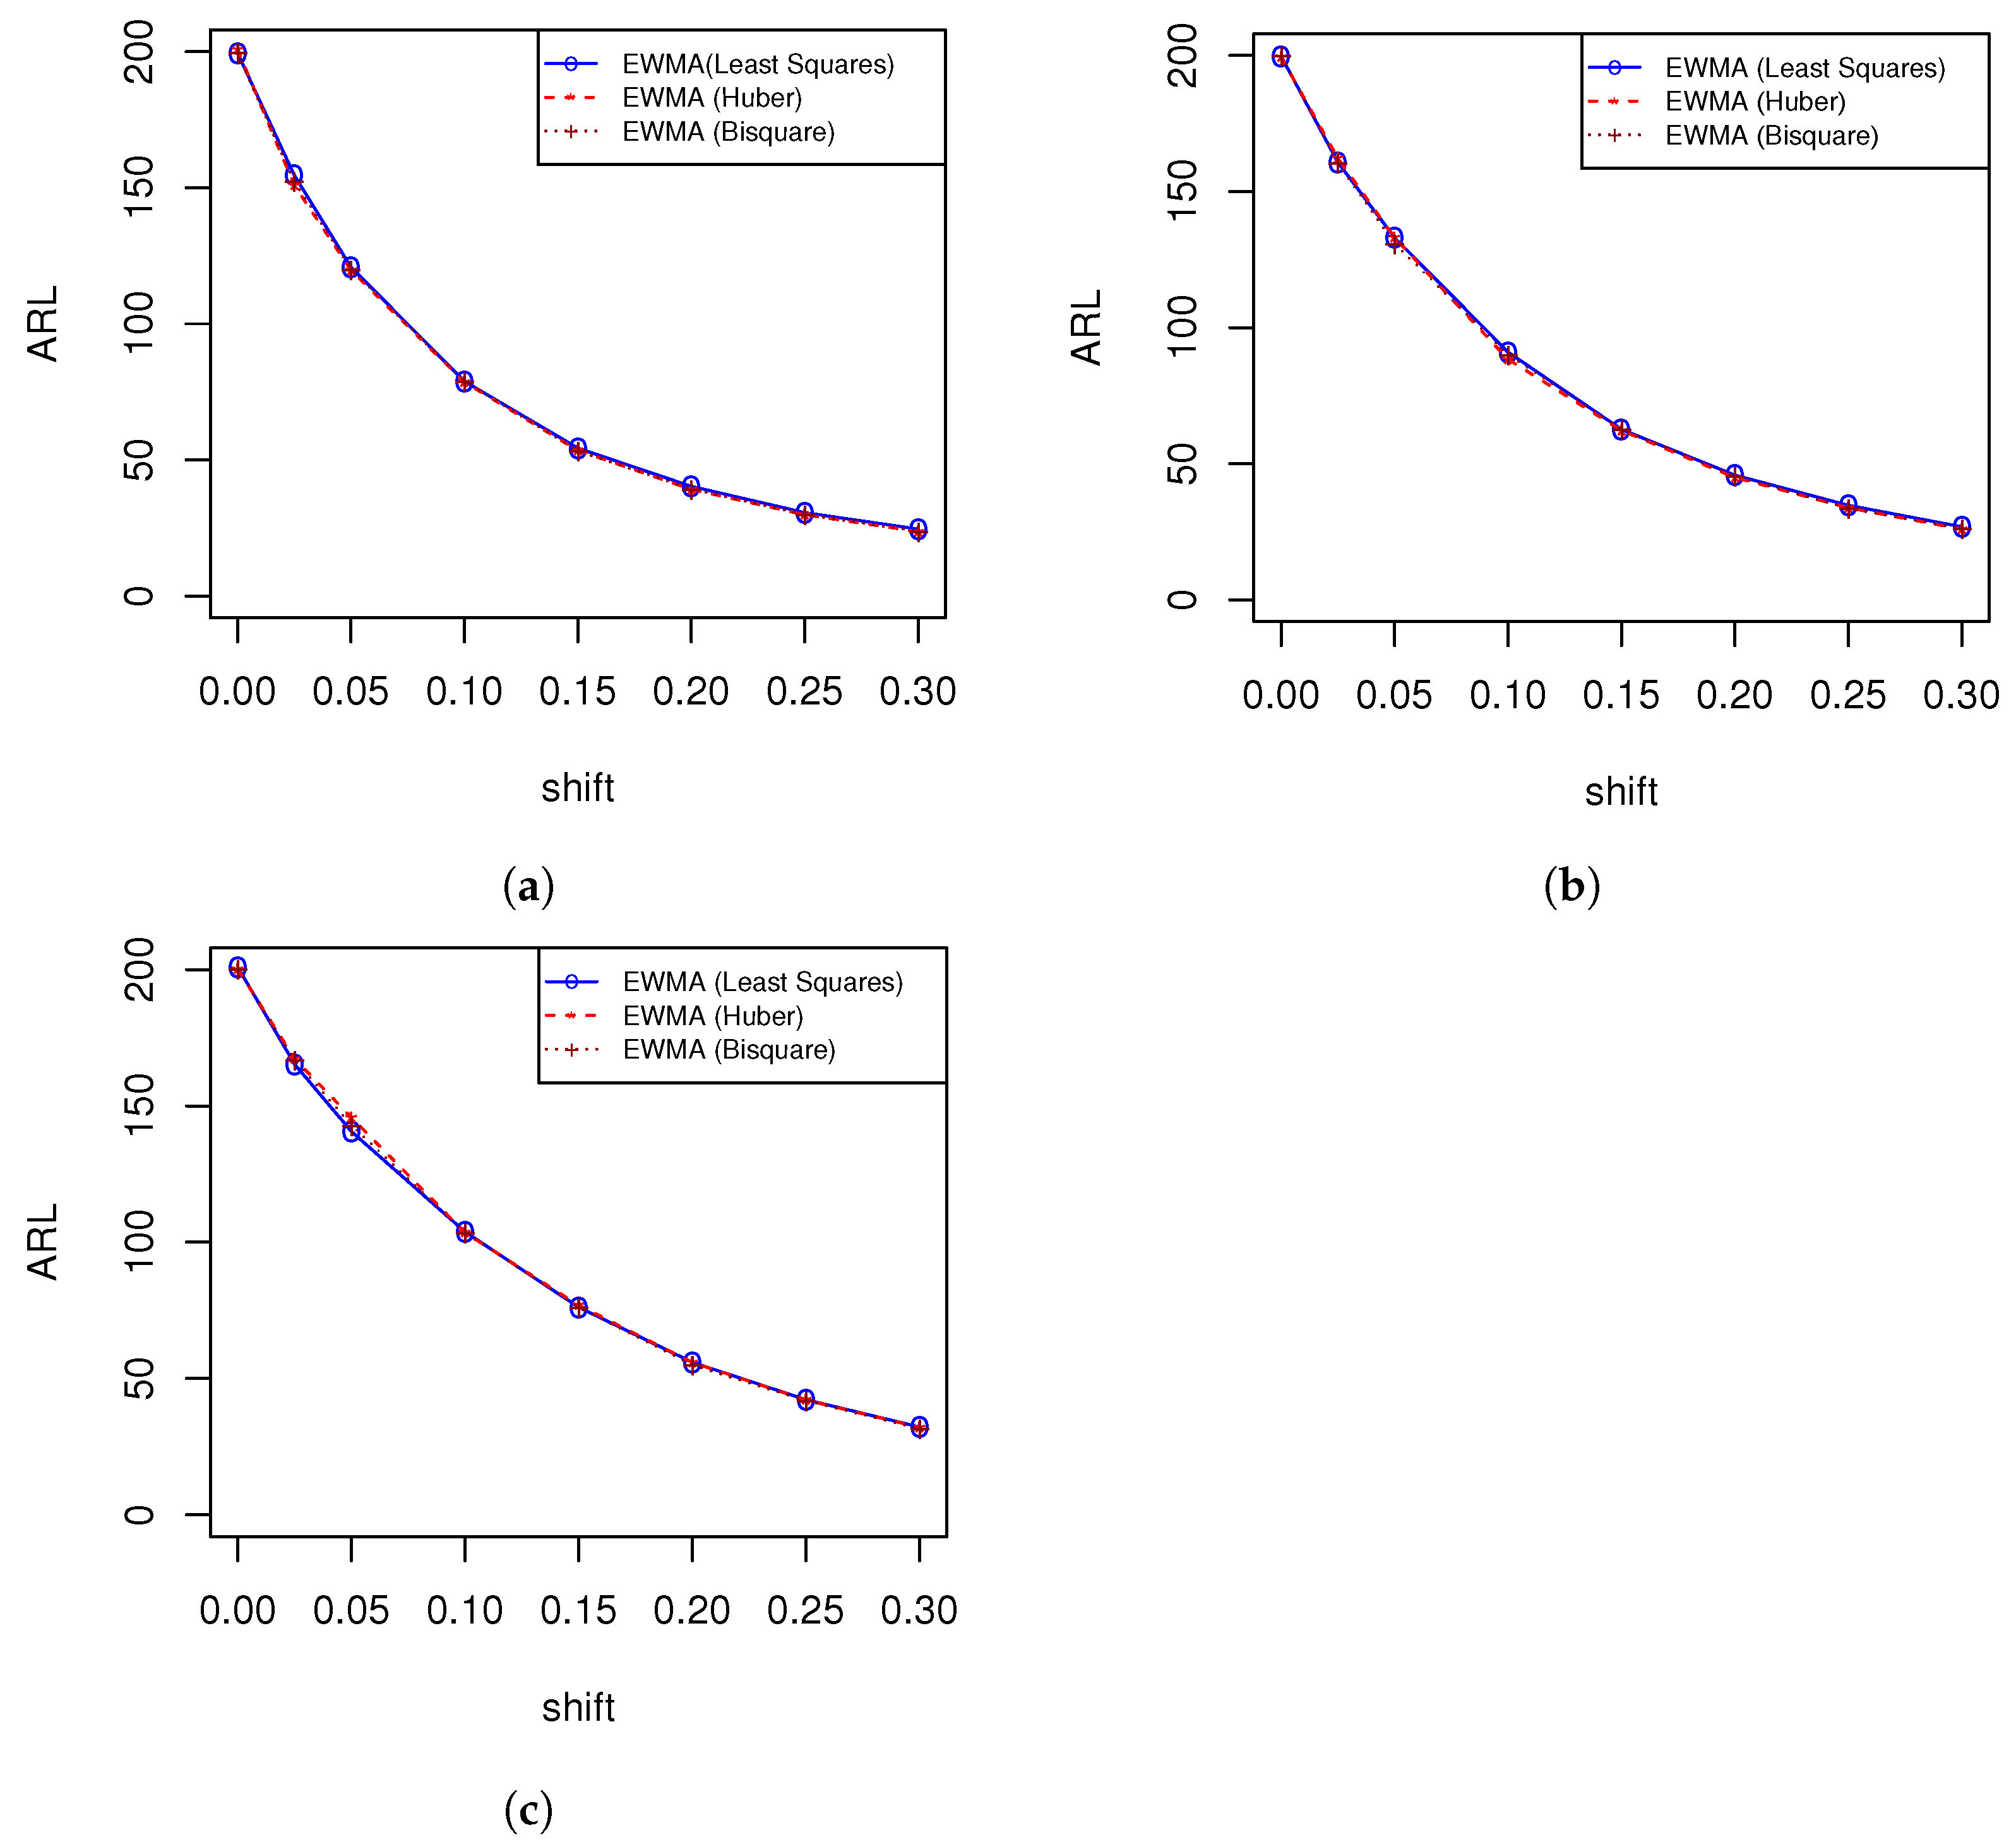
| EWMA | ARL | 199.5043 | 154.6325 | 120.8129 | 78.8784 | 54.3385 | 40.2960 | 30.6520 | 24.5845 | 1.1542 | 1.0000 | |
| SD | 190.8764 | 147.6743 | 112.9557 | 68.9558 | 43.4726 | 29.0869 | 19.7133 | 13.9121 | ||||
| 62.0000 | 50.0000 | 41.0000 | 30.0000 | 24.0000 | 20.0000 | 17.0000 | 15.0000 | |||||
| 199.5043 | 154.6325 | 120.8129 | 78.8784 | 54.3385 | 40.2960 | 30.6520 | 24.5845 | |||||
| 274.0000 | 211.0000 | 162.0000 | 106.0000 | 71.0000 | 52.0000 | 39.0000 | 31.0000 | |||||
| ARL | 199.7100 | 160.7357 | 133.0093 | 90.9987 | 62.6067 | 45.7976 | 34.7260 | 26.8265 | 1.3080 | 1.1333 | ||
| SD | 193.6052 | 151.2406 | 125.7737 | 81.8185 | 53.6595 | 36.2904 | 25.9265 | 18.4091 | ||||
| 62.0000 | 52.0000 | 44.0000 | 33.0000 | 24.0000 | 20.0000 | 16.0000 | 14.0000 | |||||
| 199.7100 | 160.7357 | 133.0093 | 90.9987 | 62.6067 | 45.7976 | 34.7260 | 26.8265 | |||||
| 277.0000 | 222.0000 | 180.0000 | 124.0000 | 84.0000 | 60.0000 | 45.0000 | 34.0000 | |||||
| ARL | 200.8715 | 165.2947 | 140.6019 | 103.8111 | 76.1626 | 55.9641 | 42.2472 | 32.2309 | 1.5709 | 1.3610 | ||
| SD | 197.5640 | 158.6682 | 134.8404 | 96.8044 | 69.7239 | 50.0309 | 36.3282 | 25.7809 | ||||
| 59.0000 | 53.0000 | 45.0000 | 34.0000 | 26.0000 | 21.0000 | 17.0000 | 14.0000 | |||||
| 200.8715 | 165.2947 | 140.6019 | 103.8111 | 76.1626 | 55.9641 | 42.2472 | 32.2309 | |||||
| 277.0000 | 226.0000 | 194.000 | 144.0000 | 104.0000 | 75.0000 | 56.0000 | 43.0000 | |||||
| 1 | 0.975 | 0.95 | 0.9 | 0.85 | 0.8 | 0.75 | 0.7 | EQL | PCI | |||
| EWMA | ARL | 199.9123 | 165.6395 | 137.7184 | 94.5257 | 68.1334 | 50.2377 | 38.2298 | 31.0543 | 1.4317 | 1.2404 | |
| with reflecting barrier | SD | 186.8441 | 150.7021 | 121.5976 | 80.4225 | 52.8940 | 35.6086 | 24.0687 | 17.5112 | |||
| 68.0000 | 59.0000 | 51.0000 | 38.7500 | 31.0000 | 25.0000 | 21.0000 | 19.0000 | |||||
| 199.9123 | 165.6395 | 137.7184 | 94.5257 | 68.1334 | 50.2377 | 38.2298 | 31.0543 | |||||
| 271.0000 | 223.0000 | 185.0000 | 124.0000 | 88.0000 | 64.0000 | 48.0000 | 38.0000 | |||||
| ARL | 201.5071 | 171.3319 | 145.3346 | 103.6928 | 77.4990 | 56.5839 | 42.6646 | 33.1553 | 1.5933 | 1.3804 | ||
| SD | 194.0158 | 160.1877 | 133.9086 | 93.1039 | 67.3644 | 46.6611 | 32,2181 | 23.2945 | ||||
| 65.0000 | 57.0000 | 50.0000 | 38.0000 | 30.0000 | 24.0000 | 20.0000 | 17.0000 | |||||
| 201.5071 | 171.3319 | 145.3346 | 103.6928 | 77.4990 | 56.5839 | 42.6646 | 33.1553 | |||||
| 273.2000 | 233.0000 | 198.0000 | 139.0000 | 103.0000 | 74.0000 | 55.0000 | 42.0000 | |||||
| ARL | 199.7246 | 175.8626 | 152.8292 | 117.6264 | 89.2111 | 67.3432 | 51.6096 | 39.6198 | 1.7372 | 1.5051 | ||
| SD | 189.7030 | 170.0812 | 145.6179 | 110.8450 | 81.4139 | 60.3279 | 44.5509 | 33.04623 | ||||
| 64.0000 | 55.0000 | 49.3800 | 39.0000 | 31.0000 | 25.0000 | 20.0000 | 16.0000 | |||||
| 199.7246 | 175.8626 | 152.8292 | 117.6264 | 89.2111 | 67.3432 | 51.6096 | 39.6198 | |||||
| 273.2000 | 241.0000 | 209.0000 | 161.0000 | 122.0000 | 91.0000 | 69.0000 | 52.0000 | |||||
| Robust scenario based on Huber function | ||||||||||||
| CUSUM | ARL | 201.1451 | 169.6328 | 140.8195 | 99.6323 | 70.5558 | 50.1916 | 36.8214 | 28.0148 | 1.4163 | 1.2546 | |
| SD | 166.2194 | 137.3228 | 111.9262 | 76.8709 | 52.6802 | 36.1056 | 24.9941 | 18.0536 | ||||
| 84.0000 | 74.0000 | 63.0000 | 46.0000 | 34.0000 | 25.0000 | 19.0000 | 15.0000 | |||||
| 201.1451 | 169.6328 | 140.8195 | 99.6323 | 70.5558 | 50.1916 | 36.8214 | 28.0148 | |||||
| 265.0000 | 221.0000 | 185.2000 | 130.0000 | 90.0000 | 64.0000 | 47.0000 | 35.0000 | |||||
| EWMA | ARL | 200.8337 | 150.9337 | 119.7106 | 78.6085 | 53.5001 | 39.2193 | 29.8674 | 23.6825 | 1.1289 | 1.0000 | |
| SD | 195.4095 | 144.8701 | 110.8733 | 69.4721 | 42.4874 | 28.0109 | 18.8696 | 13.1857 | ||||
| 61.0000 | 49.0000 | 41.0000 | 30.0000 | 24.0000 | 20.0000 | 16.0000 | 14.0000 | |||||
| 200.8337 | 150.9337 | 119.7106 | 78.6085 | 53.5001 | 39.2193 | 29.8674 | 23.6825 | |||||
| 279.0000 | 207.0000 | 162.2000 | 105.0000 | 70.0000 | 50.0000 | 38.0000 | 29.0000 | |||||
| ARL | 199.4049 | 162.2354 | 133.0822 | 88.3851 | 62.2124 | 44.9408 | 33.8370 | 25.9593 | 1.2827 | 1.1362 | ||
| SD | 195.3274 | 144.8592 | 125.1256 | 81.2541 | 54.0456 | 36.1379 | 25.3104 | 17.5833 | ||||
| 61.0000 | 51.0000 | 44.0000 | 31.0000 | 24.0000 | 20.0000 | 16.0000 | 14.0000 | |||||
| 199.4049 | 162.2354 | 133.0822 | 88.3851 | 62.2124 | 44.9408 | 33.8370 | 25.9593 | |||||
| 274.0000 | 221.0000 | 183.2000 | 117.0000 | 82.0000 | 59.0000 | 44.0000 | 33.0000 | |||||
| ARL | 200.1266 | 167.2870 | 145.7537 | 103.5113 | 76.8572 | 55.9620 | 42.1337 | 32.0882 | 1.5746 | 1.3948 | ||
| SD | 193.2887 | 161.6693 | 140.2150 | 96.2823 | 69.6910 | 49.9447 | 35.3759 | 25.6641 | ||||
| 61.0000 | 52.0000 | 46.0000 | 34.0000 | 27.0000 | 21.0000 | 17.0000 | 14.0000 | |||||
| 200.1266 | 167.2870 | 145.7537 | 103.5113 | 76.8572 | 55.9620 | 42.1337 | 32.0882 | |||||
| 280.0000 | 232.0000 | 199.0000 | 141.0000 | 105.0000 | 75.0000 | 56.0000 | 42.0000 | |||||
| EWMA | ARL | 198.9547 | 164.6895 | 134.0704 | 95.0891 | 67.1230 | 49.5734 | 37.8907 | 30.2922 | 1.4138 | 1.2524 | |
| with reflecting barrier | SD | 185.7313 | 152.2588 | 120.2918 | 80.8726 | 52.1491 | 35.2607 | 24.0434 | 16.7665 | |||
| 68.0000 | 58.0000 | 49.7500 | 38.0000 | 31.0000 | 25.0000 | 21.0000 | 18.0000 | |||||
| 198.9547 | 164.6895 | 134.0704 | 95.0891 | 67.1230 | 49.5734 | 37.8907 | 30.2922 | |||||
| 268.0000 | 222.0000 | 180.0000 | 127.0000 | 87.0000 | 64.0000 | 47.0000 | 38.0000 | |||||
| ARL | 199.5805 | 169.4613 | 143.1575 | 104.5654 | 74.7270 | 55.0920 | 41.8321 | 31.9012 | 1.5547 | 1.3772 | ||
| SD | 191.5354 | 159.4234 | 132.4548 | 95.0874 | 63.4440 | 44.6270 | 31.6745 | 22.2395 | ||||
| 64.0000 | 56.0000 | 49.0000 | 38.0000 | 29.0000 | 23.0000 | 20.0000 | 16.0000 | |||||
| 199.4805 | 169.4613 | 143.1575 | 104.5654 | 74.7270 | 55.0920 | 41.8321 | 31.9012 | |||||
| 269.0000 | 231.2000 | 193.0000 | 140.0000 | 100.0000 | 73.0000 | 54.0000 | 41.0000 | |||||
| ARL | 199.2833 | 171.7889 | 155.2576 | 117.8723 | 88.2755 | 67.2280 | 51.2123 | 39.2312 | 1.8648 | 1.6519 | ||
| SD | 191.5813 | 165.2328 | 150.6022 | 111.0126 | 80.4561 | 61.0228 | 44.7726 | 32.4167 | ||||
| 63.0000 | 55.0000 | 50.0000 | 39.0000 | 31.0000 | 24.0000 | 19.0000 | 16.0000 | |||||
| 199.2833 | 171.7889 | 155.2576 | 117.8723 | 88.2755 | 67.2280 | 51.2123 | 39.2312 | |||||
| 273.0000 | 233.0000 | 210.0000 | 159.0000 | 119.0000 | 90.0000 | 69.0000 | 52.0000 | |||||
| Robust scenario based on Tukey bi-square function | ||||||||||||
| CUSUM | ARL | 198.6599 | 167.2256 | 139.5164 | 95.0839 | 65.1233 | 46.5104 | 34.6734 | 25.9419 | 1.3268 | 1.1730 | |
| SD | 161.8994 | 135.0049 | 112.5885 | 74.1585 | 48.3893 | 33.1497 | 23.8619 | 16.7490 | ||||
| 85.0000 | 73.0000 | 60.0000 | 43.0000 | 31.0000 | 23.0000 | 18.0000 | 14.0000 | |||||
| 198.6599 | 167.2256 | 139.5164 | 95.0839 | 65.1233 | 46.5104 | 34.6734 | 25.9419 | |||||
| 262.0000 | 219.0000 | 183.0000 | 124.0000 | 83.0000 | 60.0000 | 44.0000 | 33.0000 | |||||
| EWMA | ARL | 199.6212 | 152.3438 | 120.0416 | 78.8739 | 53.3664 | 39.3274 | 29.9474 | 23.8362 | 1.1311 | 1.0000 | |
| SD | 193.9231 | 144.6941 | 113.4220 | 68.4978 | 42.2735 | 27.9959 | 18.8809 | 13.3006 | ||||
| 59.0000 | 48.0000 | 40.0000 | 30.0000 | 23.0000 | 20.0000 | 16.0000 | 14.0000 | |||||
| 199.6212 | 152.3438 | 120.0416 | 78.8739 | 53.3664 | 39.3274 | 29.9474 | 23.8362 | |||||
| 277.0000 | 212.0000 | 163.0000 | 106.0000 | 70.0000 | 50.0000 | 38.0000 | 30.0000 | |||||
| ARL | 199.9025 | 160.4655 | 130.8211 | 90.0447 | 62.7029 | 45.5106 | 33.6244 | 26.2518 | 1.5871 | 1.4031 | ||
| SD | 190.4568 | 154.3083 | 125.9188 | 81.6334 | 54.4819 | 36.8057 | 24.8628 | 17.4120 | ||||
| 61.0000 | 50.0000 | 42.0000 | 32.0000 | 24.0000 | 19.0000 | 16.0000 | 14.0000 | |||||
| 199.9025 | 160.4655 | 130.8211 | 90.0447 | 62.7029 | 45.5106 | 33.6244 | 26.2518 | |||||
| 274.0000 | 221.0000 | 174.0000 | 122.0000 | 83.0000 | 60.0000 | 44.0000 | 33.0000 | |||||
| ARL | 200.2844 | 166.9600 | 142.8648 | 103.5326 | 76.1354 | 54.9989 | 41.9356 | 31.6754 | 1.5603 | 1.3795 | ||
| SD | 197.3578 | 162.6991 | 135.2637 | 98.5446 | 68.8390 | 48.8380 | 36.0554 | 25.4658 | ||||
| 61.0000 | 52.0000 | 46.0000 | 34.0000 | 27.0000 | 21.0000 | 17.0000 | 14.0000 | |||||
| 200.2844 | 166.9600 | 142.8648 | 103.5326 | 76.1354 | 54.9989 | 41.9356 | 31.6754 | |||||
| 273.0000 | 231.0000 | 197.2000 | 139.0000 | 103.0000 | 74.0000 | 56.0000 | 41.0000 | |||||
| EWMA | ARL | 198.2270 | 165.7226 | 138.2534 | 95.9348 | 67.3676 | 49.7240 | 37.8654 | 30.1437 | 1.4179 | 1.2536 | |
| with reflecting barrier | SD | 185.2698 | 152.0990 | 121.4520 | 81.2702 | 51.6793 | 35.3376 | 23.9713 | 16.8474 | |||
| 67.0000 | 58.0000 | 51.0000 | 39.0000 | 30.0000 | 25.0000 | 21.0000 | 18.0000 | |||||
| 198.2270 | 165.7226 | 138.2534 | 95.9348 | 67.3676 | 49.7240 | 37.8654 | 30.1437 | |||||
| 269.0000 | 223.0000 | 185.0000 | 126.0000 | 89.0000 | 63.0000 | 47.0000 | 37.0000 | |||||
| ARL | 199.5478 | 170.5499 | 147.4620 | 104.0158 | 76.3843 | 55.9152 | 42.0644 | 32.8232 | 1.5763 | 1.3936 | ||
| SD | 192.9706 | 159.1970 | 135.8105 | 92.2968 | 65.9376 | 45.4057 | 31.3486 | 22.9317 | ||||
| 64.0000 | 57.0000 | 49.0000 | 38.0000 | 29.0000 | 24.0000 | 20.0000 | 17.0000 | |||||
| 199.5478 | 170.5499 | 147.4620 | 104.0158 | 76.3843 | 55.9152 | 42.0644 | 32.8232 | |||||
| 273.0000 | 232.0000 | 202.0000 | 141.0000 | 103.0000 | 74.0000 | 55.0000 | 42.0000 | |||||
| ARL | 199.2022 | 176.5519 | 151.4087 | 116.0709 | 87.8592 | 67.6121 | 51.3464 | 38.9756 | 1.8609 | 1.6452 | ||
| SD | 191.4593 | 167.6931 | 143.9507 | 110.1907 | 80.0792 | 61.5244 | 44.3267 | 32.1573 | ||||
| 61.0000 | 56.0000 | 48.0000 | 38.0000 | 31.0000 | 24.0000 | 19.0000 | 16.0000 | |||||
| 199.2022 | 176.5519 | 151.4087 | 116.0709 | 87.8592 | 67.6121 | 51.3464 | 38.9756 | |||||
| 276.0000 | 242.0000 | 209.0000 | 155.0000 | 118.0000 | 91.0000 | 69.0000 | 51.0000 | |||||
| 1 | 0.975 | 0.95 | 0.9 | 0.85 | 0.8 | 0.75 | 0.7 | |||
|---|---|---|---|---|---|---|---|---|---|---|
| CUSUM | ARL | 198.6599 | 167.2256 | 139.5164 | 95.0839 | 65.1233 | 46.5104 | 34.6734 | 25.9419 | |
| S.D | 161.8994 | 135.0049 | 112.5885 | 74.1585 | 48.3893 | 33.1497 | 23.8619 | 16.7490 | ||
| Q1 | 85.0000 | 73.0000 | 60.0000 | 43.0000 | 31.0000 | 23.0000 | 18.0000 | 14.0000 | ||
| Q3 | 262.0000 | 219.0000 | 183.0000 | 124.0000 | 83.0000 | 60.0000 | 44.0000 | 33.0000 | ||
| CUSUM | ARL | 199.4822 | 169.7044 | 137.4374 | 93.1159 | 63.2452 | 44.0059 | 32.9774 | 24.5984 | |
| S.D | 163.4584 | 139.6599 | 109.3847 | 71.2261 | 46.5578 | 30.4992 | 22.2035 | 15.8303 | ||
| Q1 | 85.0000 | 72.0000 | 59.0000 | 42.0000 | 30.0000 | 22.0000 | 17.0000 | 14.0000 | ||
| Q3 | 259.0000 | 222.0000 | 181.0000 | 121.0000 | 82.0000 | 57.0000 | 42.0000 | 31.0000 | ||
| CUSUM | ARL | 199.5094 | 170.5114 | 141.2416 | 97.189 | 66.9093 | 48.2992 | 35.8364 | 27.1819 | |
| S.D | 158.0576 | 140.6099 | 115.2269 | 76.3812 | 48.7513 | 34.5305 | 23.9865 | 17.4026 | ||
| Q1 | 85.0000 | 71.0000 | 63.0000 | 44.0000 | 32.0000 | 24.0000 | 19.0000 | 15.0000 | ||
| Q3 | 265.0000 | 223.0000 | 185.0000 | 126.0000 | 87.0000 | 62.0000 | 45.0000 | 34.0000 | ||
Disclaimer/Publisher’s Note: The statements, opinions and data contained in all publications are solely those of the individual author(s) and contributor(s) and not of MDPI and/or the editor(s). MDPI and/or the editor(s) disclaim responsibility for any injury to people or property resulting from any ideas, methods, instructions or products referred to in the content. |
© 2023 by the authors. Licensee MDPI, Basel, Switzerland. This article is an open access article distributed under the terms and conditions of the Creative Commons Attribution (CC BY) license (https://creativecommons.org/licenses/by/4.0/).
Share and Cite
Nabeel, M.; Ali, S.; Shah, I.; Almazah, M.M.A.; Al-Duais, F.S. Robust Surveillance Schemes Based on Proportional Hazard Model for Monitoring Reliability Data. Mathematics 2023, 11, 2480. https://doi.org/10.3390/math11112480
Nabeel M, Ali S, Shah I, Almazah MMA, Al-Duais FS. Robust Surveillance Schemes Based on Proportional Hazard Model for Monitoring Reliability Data. Mathematics. 2023; 11(11):2480. https://doi.org/10.3390/math11112480
Chicago/Turabian StyleNabeel, Moezza, Sajid Ali, Ismail Shah, Mohammed M. A. Almazah, and Fuad S. Al-Duais. 2023. "Robust Surveillance Schemes Based on Proportional Hazard Model for Monitoring Reliability Data" Mathematics 11, no. 11: 2480. https://doi.org/10.3390/math11112480
APA StyleNabeel, M., Ali, S., Shah, I., Almazah, M. M. A., & Al-Duais, F. S. (2023). Robust Surveillance Schemes Based on Proportional Hazard Model for Monitoring Reliability Data. Mathematics, 11(11), 2480. https://doi.org/10.3390/math11112480


