Article

ELCT-YOLO: An Efficient One-Stage Model for Automatic Lung Tumor Detection Based on CT Images

1
Hebei Key Laboratory of Industrial Intelligent Perception, College of Artificial Intelligence, North China University of Science and Technology, Tangshan 063210, China
2
Telecommunications Research Centre (TRC), University of Limerick, V94 T9PX Limerick, Ireland
3
Department of Computing, Xi’an Jiaotong-Liverpool University, Suzhou 215000, China
4
School of Biomedical Engineering, Shenzhen University Health Science Center, Shenzhen 518060, China
5
Department of Computer Systems, University of Plovdiv “Paisii Hilendarski”, 4000 Plovdiv, Bulgaria
6
Institute of Mathematics and Informatics—Bulgarian Academy of Sciences, 1040 Sofia, Bulgaria
*
Authors to whom correspondence should be addressed.
Mathematics 2023, 11(10), 2344; https://doi.org/10.3390/math11102344
Submission received: 9 April 2023 / Revised: 6 May 2023 / Accepted: 15 May 2023 / Published: 17 May 2023
(This article belongs to the Special Issue Statistical Data Modeling and Machine Learning with Applications II)

Abstract

:
Research on lung cancer automatic detection using deep learning algorithms has achieved good results but, due to the complexity of tumor edge features and possible changes in tumor positions, it is still a great challenge to diagnose patients with lung tumors based on computed tomography (CT) images. In order to solve the problem of scales and meet the requirements of real-time detection, an efficient one-stage model for automatic lung tumor detection in CT Images, called ELCT-YOLO, is presented in this paper. Instead of deepening the backbone or relying on a complex feature fusion network, ELCT-YOLO uses a specially designed neck structure, which is suitable to enhance the multi-scale representation ability of the entire feature layer. At the same time, in order to solve the problem of lacking a receptive field after decoupling, the proposed model uses a novel Cascaded Refinement Scheme (CRS), composed of two different types of receptive field enhancement modules (RFEMs), which enables expanding the effective receptive field and aggregate multi-scale context information, thus improving the tumor detection performance of the model. The experimental results show that the proposed ELCT-YOLO model has strong ability in expressing multi-scale information and good robustness in detecting lung tumors of various sizes.

1. Introduction

Lung cancer is a common disease that has a higher mortality rate than other cancers. It is the main cause of cancer death [1]. According to the American Cancer Society, the number of new lung cancer cases in the United States is expected to reach 238,340 this year, with 127,070 deaths because of this. Computed tomography (CT) imaging is the most commonly employed method for detecting lung diseases [2,3]. Regular CT screening for people at high risk of developing lung cancer can reduce the risk of dying from this disease. Professional doctors can diagnose lung cancer according to the morphological characteristics of the lesions in CT images. However, CT scans produce huge amounts of image data, which increases the difficulty of performing proper disease diagnosis. Furthermore, doctors may make a wrong diagnosis due to long work shifts and monotonous working. In addition, even experienced doctors and experts can easily miss some small potential lesions. Therefore, automatic detection of lung tumors, based on CT images, needs to be further advanced for improving the quality of diagnosis.
Accurate detection of lung cancer is a challenging task. On the one hand, the tumors have complex edge features and may change their position [4]. As illustrated in Figure 1a, showing the CT chest images of patients with lung cancers, the texture, gray scale, and shape of tumors are important for clinical staging and pathological classification [5]. On the other hand, redundant image information causes difficulties in the detection task. For example, the images of abundant blood vessels, bronchi, and tiny nodules in the lung interfere with the unique features of tumors. In addition, tumors have different sizes (Figure 1b) and different types of tumors have different growth rates. For example, the multiplication rate of lung squamous cell carcinoma is lower than that of lung adenocarcinoma. Moreover, tumors of the same type have different sizes at different stages of their development [6]. In addition, a tumor naturally has different sizes in multiple CT scanning slices. The challenge brought by the difference in tumor sizes seriously limits the accuracy of existing methods for tumor detection.
To date, a lot of work has been done on automatic detection of lung lesions. The early computer-aided lung cancer detection methods mainly relied on an artificially designed feature extractor. Feature extractor can obtain the gray scale, texture and other morphological features of a tumor in an image, which are subsequently fed into a Support Vector Machine (SVM) or AdaBoost for classification. However, the artificially designed features cannot well correspond to the highly variable tumor size, position, and edge, thus limiting the detection ability of these methods [7]. Recently, as deep learning has been increasingly applied in various medical and health care fields, and many researchers have devoted themselves to the study of lung tumor detection based on deep neural networks (DNNs) [8,9]. Unlike traditional methods relying on artificial design, DNNs have a large number of parameters and can fit semantic features better.
Gong et al. [10] used a deep residual network to identify lung adenocarcinoma in CT images, and obtained comparable or even superior outcomes compared to radiologists. Mei et al. [11] conducted experiments on the PN9 dataset to detect lung nodules in CT scans using a slice-aware network. The results showed that the proposed SANet outperformed other 2D and 3D convolutional neural network (CNN) methods and significantly reduced the false positive rate (FPR) for lung nodules. Xu et al. [12] designed a slice-grouped domain attention (SGDA) module that can be easily embedded into existing backbone networks to improve the detection network’s generalization ability. Su et al. [13] used the Bag of Visual Words (BoVW) and a convolutional recurrent neural network (CRNN) to detect lung tumors in CT images. The model first segments the CT images into smaller nano-segments using biocompatibility techniques, and then classifies the nano-segments using deep learning techniques. Mousavi et al. [14] introduced a detection approach based on a deep neural network for identifying COVID-19 and other lung infections. More specifically, their method involves using a deep neural network to extract features from chest X-ray images, employing an LSTM network for sequence modeling, and utilizing a SoftMax classifier for image classification. This method shows excellent performance in detecting COVID-19 and can help radiologists make diagnoses quickly. In [15], Mei et al. utilized a depth-wise over-parameterized convolutional layer to construct a residual unit in the backbone network, leading to improved feature representation ability of the network. Moreover, the study also implemented enhancements in the confidence loss function and focal loss to handle the significant imbalance between positive and negative samples during training. It is noteworthy that this method focuses on the efficiency and practicability of the detector. Version 4 of You Only Look Once (YOLO), i.e., YOLOv4, was used as a benchmark for this method but there have been few studies using YOLO to detect lung tumors so far.
Although many processing methods exist for automated detection of lung tumors in CT images, the variability of tumor size is less considered. As indicated above, the size of lung tumors exhibits variability, thus posing challenges for precise tumor detection. As the multi-scale issue constrains the efficacy of prevalent detection methods, some researchers have paid attention to this issue and proposed improvements to the existing methods. Causey et al. [16] utilized 3D convolution in combination with Spatial Pyramid Pooling (SPP) to develop a lung cancer detection algorithm, which enabled reducing the FPR based on the National Lung Screening Trial (NLST) data cohort used for testing, whereby the area under the curve (AUC) value reached 0.892, proving that the detection performance is better than that of using only 3D convolution. Compared with detecting 2D slices one by one, 3D convolution can be used to obtain rich space and volume information in adjacent slices, and models can be generalized to sparsely annotated datasets. However, 3D convolution consumes more computer memory than conventional convolution. Other studies have proposed feature pyramid networks (FPNs), whereby the recognition of small-size tumors depends on features from the shallow network, while the top-level network has more abundant semantic information, which is important for the accurate classification of tumors. The purpose of FPN is to connect the feature maps spanning different layers, so as to restore the low-resolution information of the deep feature map and enhance the semantic information of the shallow feature map. In order to effectively integrate multi-scale information, Guo et al. [17] fused feature maps at different layers. In [18], Guo and Bai construct a FPN to detect multi-scale lung nodules, thus significantly improving the accuracy of small lung nodule detection. In [19], by applying a bi-directional FPN (BiFPN), the feature fusion structure of YOLOv5 was improved, and a fusion path was added between features at the same layer. Some other improvements of feature fusion network have also achieved good results in other tasks [20]. The original FPN structure and its variants adopt complex cross-scale connections to obtain a stronger multi-scale representation ability. Although helpful for improving multi-scale tumor detection, this operation requires more parameters and increases computational expenses, so it is contrary to the general expectation of a highly efficient detector.
Taking inspiration from the previous work, we have considered a real-world hospital scenario where a large volume of CT data is available, but hardware resources are limited. To reduce hardware costs while maintaining the speed of tumor detection, we have selected YOLOv7 as the underlying framework as it can achieve good balance between accuracy and tumor detection speed without requiring generation of candidate boxes, as opposed to the two-stage detection models. In this paper, we propose a novel one-stage detection model, called ELCT-YOLO, based on the popular YOLOv7-tiny network architecture [21], for solving the problem of multi-scale lung tumor detection in CT scan slices. For ELCT-YOLO, firstly, we designed a Decoupled Neck (DENeck) structure to improve the multi-scale feature representation ability of the model. Different from the previous design scheme of feature fusion structure [22,23], we do not stack a large number of basic structures, nor build a complex topology. We propose the idea of decoupling the feature layer into a high-semantic region and low-semantic region, as to reduce semantic conflict in the fusion process. Secondly, we propose a Cascaded Refinement Scheme (CRS), which includes a group of Receptive Field Enhancement Modules (RFEMs) to explore rich context information. Using atrous convolution, we constructed two multi-scale sensing structures, namely a Series RFEM (SRFEM) and a Parallel RFEM (PRFEM). In order to expand the effective receptive field, these serial structures use a series of atrous convolutions with different sampling rates. At the same time, a residual connection was applied to alleviate the grid artifacts as per [24]. The achieved parallel structure can construct complementary receptive fields, in which each branch matches the amount of information based on its own receptive field. In addition, we studied the performance of different cascaded schemes through experiments.
The main contributions of this paper can be summarized as follows:
  • In order to solve the problem of multi-scale detection, a novel neck structure, called DENeck, is designed and proposed to effectively model the dependency between feature layers and improve the detection performance by using complementary features with similar semantic information. In addition, compared with the original FPN structure, the design of DENeck is more efficient in terms of the number of parameters used.
  • A novel CRS structure is designed and proposed to improve the robustness of variable-size tumor detection by collecting rich context information. At the same time, an effective receptive field is constructed to refine the tumor features.
  • It is proposed to integrate the spatial pyramid pooling—fast (SPPF) module of YOLOv5 [25] at the top of the original YOLOv7-tiny backbone network in order to extract important context features by utilizing a smaller number of parameters and using multiple small-size cascaded pooling kernels, in order to increase further the model’s operational speed and enrich the representation ability of feature maps.

2. Related Work

Deep learning-based object detection methods have significance value in medical applications, such as breast cancer detection [26], retinal lesion detection [27], rectal cancer detection [28], and lung nodule detection [29]. Many of the methods listed above rely on the YOLO family as their foundation, demonstrating a very fast processing speed. Although the YOLO family has a good speed–precision balance, it is not effective in detecting lesions with scale changes in CT images. In the next subsections, we first introduce the YOLO principles and then introduce the current popular methods to deal with multi-scale problems, namely, the feature pyramids and exploring multi-scale context information [30].

2.1. The YOLO Family

Two major types of deep learning models are currently employed for object detection. The first kind pertains to object detection models that rely on region proposals, such as Regions with CNN (R-CNN), Fast R-CNN, Faster R-CNN, and Mask R-CNN. The second type are object detection models that use regression analysis for detection, such as the YOLO series and SSD series. While the accuracy of two-stage object detection models has improved significantly over time, their detection speed is limited by their structure [31]. The YOLO model [32] was the pioneering one-stage detector in the field of deep learning, as proposed by Redmon et al. in 2015. The main dissimilarity between one-stage and two-stage object detectors relates to the fact that the former do not have a candidate region recommendation stage, which enables them to directly determine the object category and get the position of detection boxes in one stage. Due to YOLO’s good speed–precision balance, YOLO’s related research has always received much attention. With the introduction of subsequent versions of YOLO, its performance continues to improve.
The second version of YOLO, YOLOv2 [33], uses Darknet-19 as a backbone network, removes the full connection layer, and uses a pooling method to obtain fixed-size feature vectors. A 13 × 13 feature map is obtained after down-sampling of a 416 × 416 input image 5 times. YOLOv2 uses the ImageNet dataset and the Common Objects in COntext (COCO) dataset to train the detector and locate the position of objects in the detection dataset, and utilizes the classification dataset to increase the categories of objects recognized by the detector. This joint training method overcomes the limitation of object detection tasks in terms of categories.
To enhance multi-scale prediction accuracy, YOLOv3 [34] introduces a FPN, using the feature maps of C3, C4, and C5 in Darknet-53 and combined horizontal connections. Finally, the model generates prediction maps for three different scales, enabling it to detect objects of various sizes, including large, medium, and small ones. By using a K-means clustering algorithm, YOLOv3 analyzes the information in the ground truth box of the training dataset to obtain nine types of prior bounding boxes, which can cover the objects of multiple scales in the dataset. Each prediction branch uses anchors to generate three kinds of prediction boxes for the object falling into the region, and finally uses a non-maximum suppression algorithm to filter the prediction box set. Compared with the previous two versions, YOLOv3 improves the detection ability and positioning accuracy of small objects.
YOLOv4 [35] uses CSPDarknet-53 as a backbone network, which combines DarketNet-53 with a Cross-Stage Partial Network (CSPNet). The neck of YOLOv4 uses SPP and Path Aggregation Network (PANet) modules. The fundamental concept of the SPP module is to leverage the average pooling operation of different sizes to extract features, which helps obtain rich context information. PANet reduces the transmission path of information by propagating positional information from lower to higher levels. Unlike the original PANet, YOLOv4 replaces the original shortcut connection with the tensor concat. In addition, YOLOv4 also uses Mosaic and other data enhancement methods.
Jocher et al. [25] introduced YOLOv5, which is the first version of YOLO to use Pytorch. Due to the mature ecosystem of Pytorch, YOLOv5 deployment is simpler. YOLOv5 adds adaptive anchor box calculation. When the best possible recall is less than 0.98, the K-means clustering algorithm is utilized to determine the most suitable size for the anchor boxes. YOLOv5 uses an SPPF module to replace the SPP module. In Figure 2, SPPF employs several cascaded pooling kernels of small sizes instead of the single pooling kernel of large size used in the SPP module, which further improves the operational speed. In the subsequent neck module, YOLOv5 replaces the ordinary convolution with CSP_2X structure to enhance feature fusion.
YOLOv6 [36] also focuses on detection accuracy and reasoning efficiency. YOLOv6-s can achieve an average precision (AP) of 0.431 on COCO and a reasoning speed of 520 frames per second (FPS) on Tesla T4 graphics cards. Based on the Re-parameterization VGG (RepVGG) style, YOLOv6 uses re-parameterized and more efficient networks, namely EfficientRep in the backbone and a Re-parameterization Path Aggregation Network (Rep-PAN) in the neck. The Decoupled Head is optimized, which reduces the additional delay overhead brought by the decoupled head method while maintaining good accuracy. In terms of training strategy, YOLOv6 adopts the anchor-free paradigm, supplemented by a simplified optimal transport assignment (SimOTA) label allocation strategy and a SIoU [37] bounding box regression loss in order to further improve the detection accuracy.
YOLOv7 [21] enhances the network’s learning ability without breaking the original gradient flow by utilizing an extended efficient layer aggregation network (E-ELAN) module (Figure 3). In addition, YOLOv7 utilizes architecture optimization methods to enhance object detection accuracy without increasing the reasoning costs, redesigns the re-parameterized convolution by analyzing the gradient flow propagation path, introduces an auxiliary head to improve its performance, and employs a new deep supervision label allocation strategy. The ELCT-YOLO model, proposed in this paper, is based on improvements of the popular YOLOv7-tiny network architecture [21], as described further in Section 3.
YOLOv8, the latest version of YOLO, has achieved a significant improvement in both detection accuracy and speed, lifting the object detection to a new level. YOLOv8 is not only compatible with all previous YOLO versions, but also adopts the latest anchor-free paradigm, which reduces the computational load and breaks away from the width and height limit of fixed anchor boxes. However, the author of YOLOv8 has not published a paper to explain its advantages in detail.

2.2. Multi-Scale Challenge and FPN

Both the one-stage object detectors and the two-stage object detectors face the challenge of multi-scale detection. As mentioned in the introduction, tumors in different CT images and the focus area in different sections of the same tumor have differences in scale. The existing CNNs have limited ability to extract multi-scale features, because continuous pooling operations or convolution operations with a step size greater than 1 lead to the reduction in the resolution of the feature map, resulting in a conflict between semantic information and spatial information [38]. An approach commonly used to address the challenge of detecting objects at multiple scales is to create an FPN by combining features from different layers.
An FPN architecture that combines the deep feature map with the shallow feature map was proposed by Lin et al. in [39]. They believed that the network’s deep features contain strong semantic information, while the shallow features contain strong spatial information. The combination is achieved through multiple up-sampling layers. By utilizing the inherent feature layer of ConvNet, FPN constructs a feature pyramid structure that can greatly enhance the detection network’s ability to handle objects of various scales, with minimal additional cost. The use of this network structure has become prevalent for addressing multi-scale problems in the realm of object detection due to its efficacy and versatility.
By integrating a bottom-up pathway with FPN architecture, PANet [40] can effectively enhance the spatial information within the feature pyramid structure. NAS-FPN [22] uses the Natural Architecture Search (NAS) algorithm to find the optimal cross-scale connection architecture. It is believed that the artificially designed feature pyramid structure has limited representation ability. In addition, BiFPN [23] and Recursion-FPN [41] propose weighted feature fusion and detector backbone based on looking and thinking twice, respectively to obtain a strong feature representation. Generally speaking, these methods focus on introducing additional optimization modules to obtain better multi-scale representation. In the ELCT-YOLO model, proposed in this paper, we use a decoupling method to aggregate multi-scale features, which allows to detect lung tumors more accurately without increasing the complexity of the model.

2.3. Exploring Context Information by Using Enlarged Receptive Field

Rich context information is helpful for detecting objects with scale changes [42]. Many studies have explored context information using enlarged receptive field, which are realized mostly through pooling operations or atrous convolution.
PoolNet [43] proposes a global guidance module, which first uses adaptive average pooling to capture picture context information, and then fuses the information flow into the feature map of different scales to highlight objects in complex scenarios. ThunderNet [44] applies average pooling to obtain global contextual features from the highest level of the backbone network, which is then aggregated with features at other layers to increase the receptive field of the model. Generally speaking, in order to obtain abstract information, CNN needs to repeat pooling operations, which results in focusing only on the local region. The lack of position information is detrimental to (intensive) detection tasks. Atrous convolution is a popular solution to this problem.
ACFN [45] and Deeplab-v2 [38] use atrous convolutions with various dilation rates instead of the repeated pooling operation in CNN. This strategy can enlarge the receptive field while preserving complete positional information. Liu et al. [46] have built a multi-sensor feature extraction module, which aggregates multi-scale context information by using atrous convolution with a same-size convolution kernel but different dilation rates. However, while improving the receptive field of the network, atrous convolution also brings challenges because discrete sampling may lose some information and make the weight matrix discontinuous. Furthermore, the irregularly arranged atrous convolution with different dilation rates can aggravate this problem. This situation, called the gridding effect, is analyzed in [24]. Inspired by the above methods, we have designed two types of RFEMs—a SRFEM using a serial combination and a PRFEM using a parallel combination—to sense multi-scale context information, which apply an appropriate dilation rate combination and residual connection to reduce the gridding effect.

3. Proposed Model

3.1. Overview

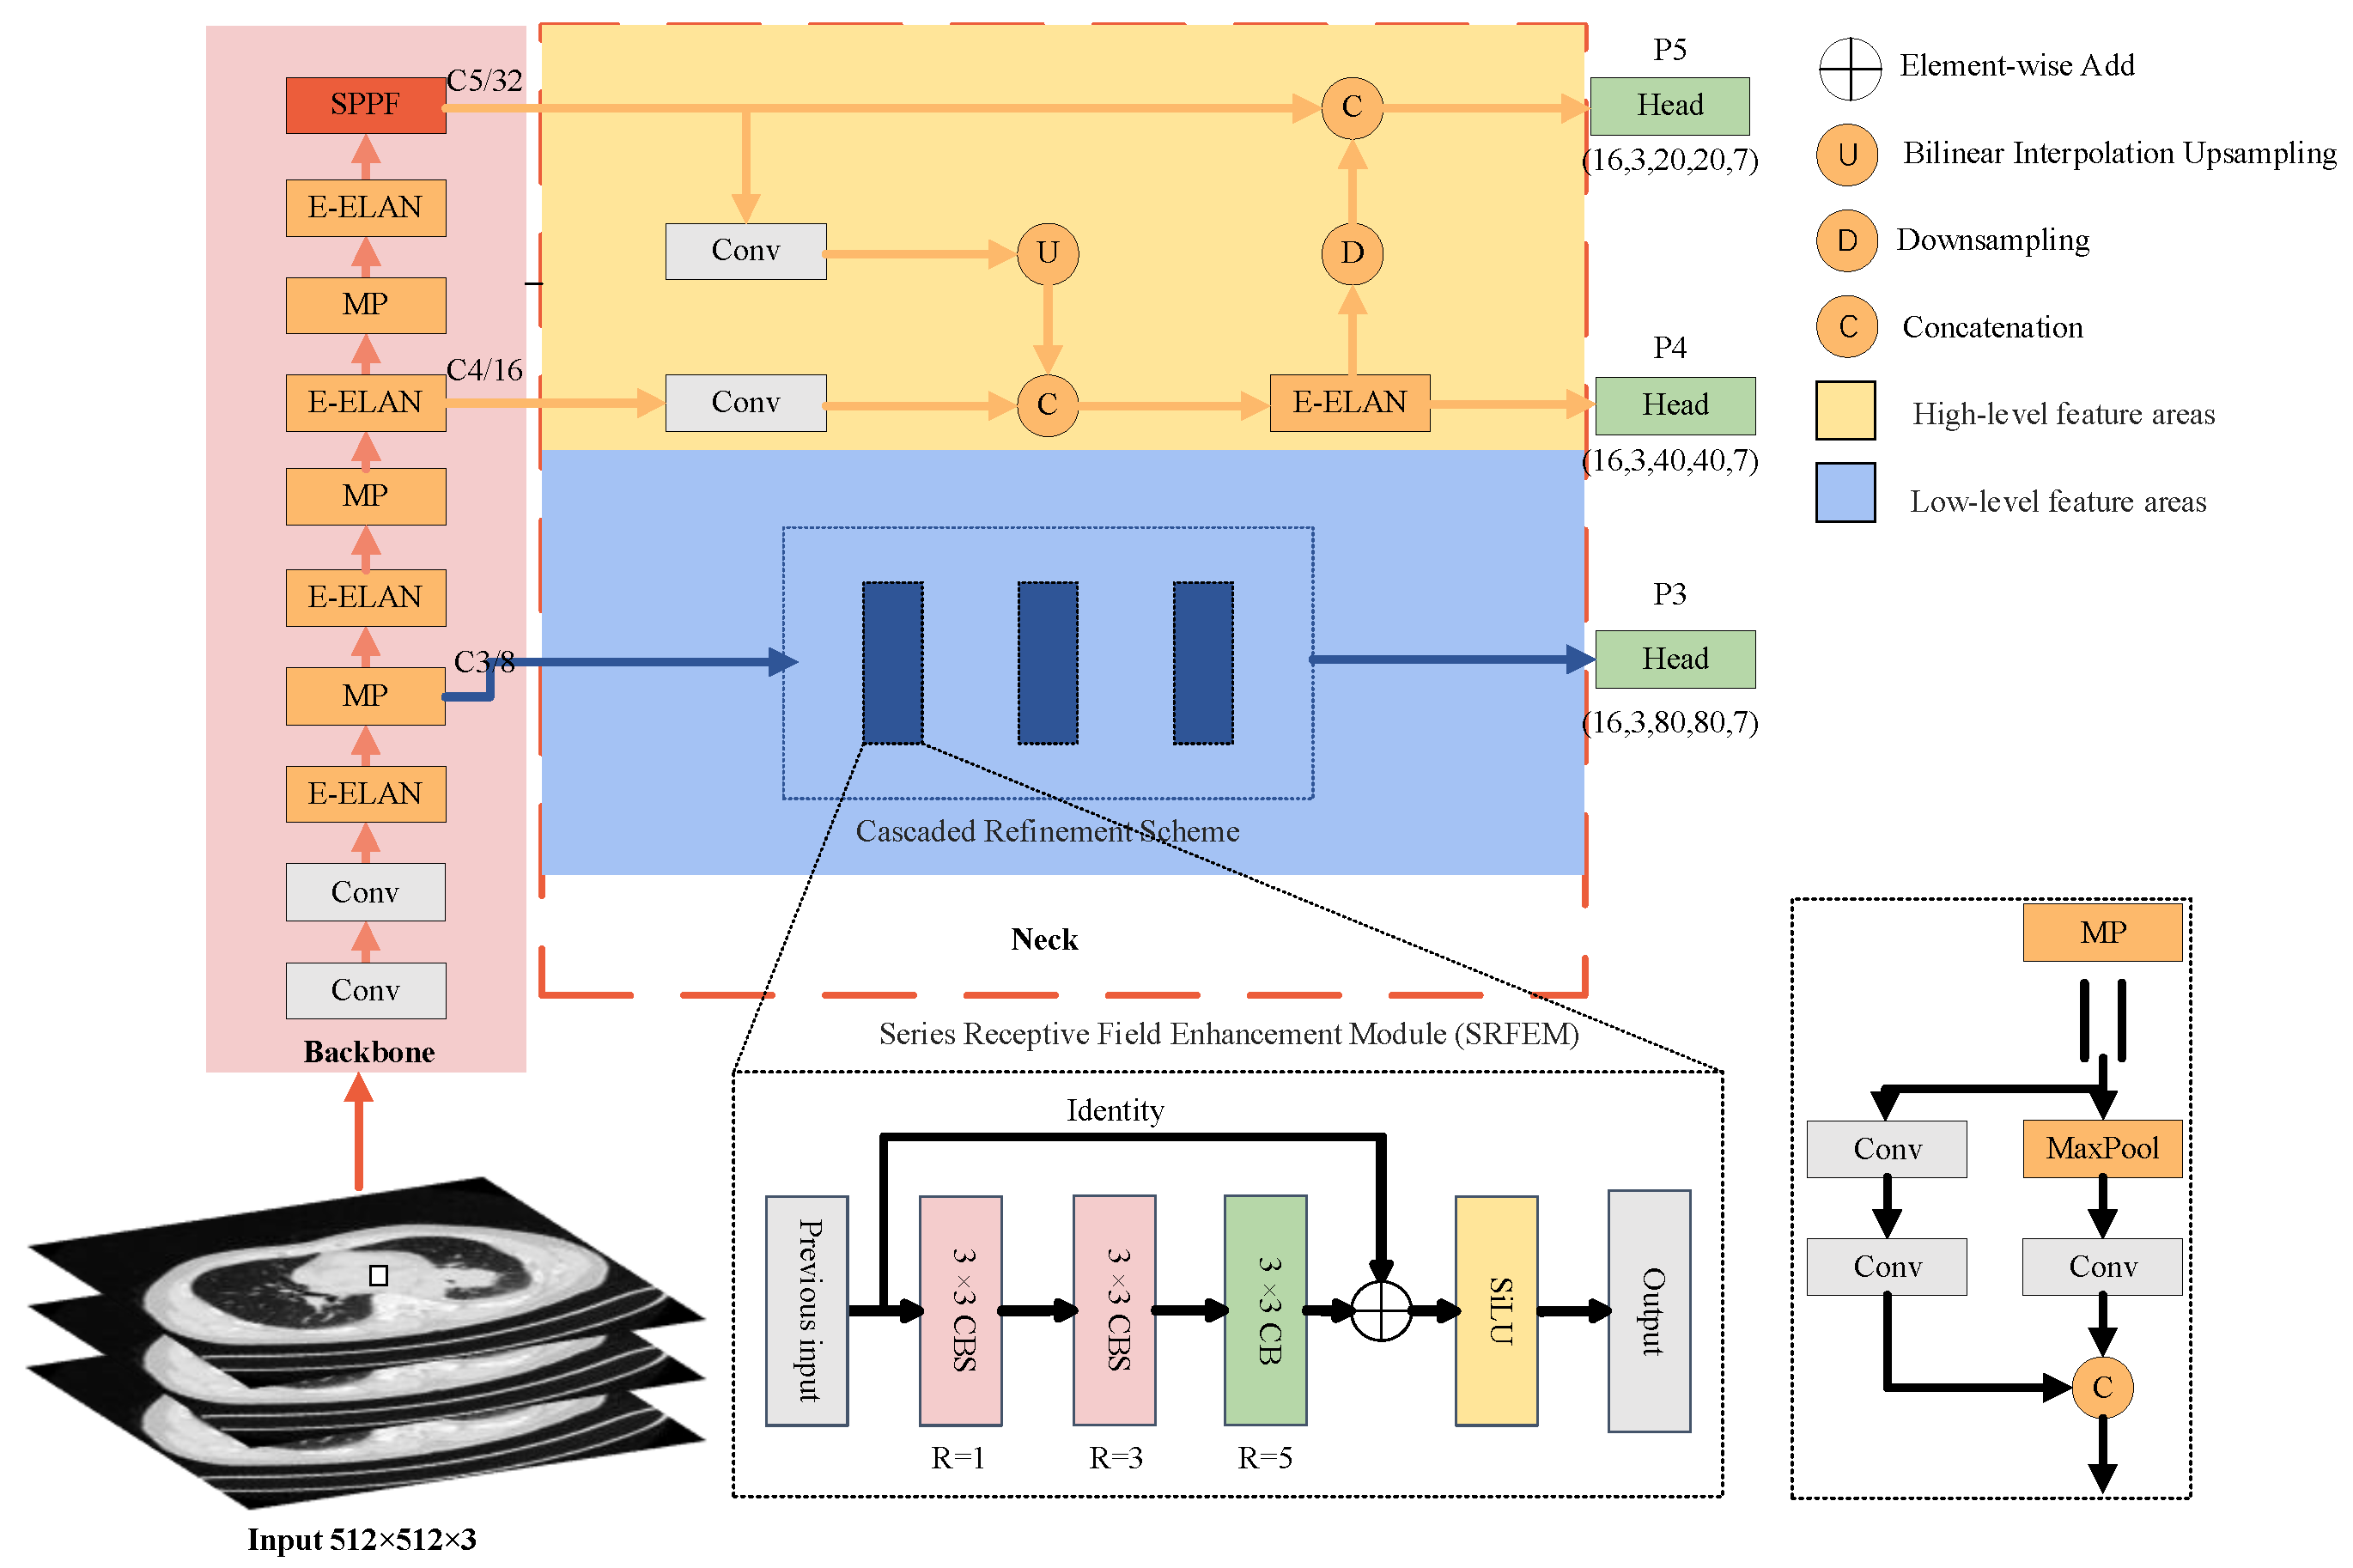
The proposed ELCT-YOLO model, shown in Figure 4, is based on YOLOv7-tiny, which is a popular and efficient object detector. With an input image size of 512 × 512 × 3 , where 512 represents the image’s width and height and 3 represents the number of channels, the features are efficiently extracted through a backbone network, which is mainly based on E-ELAN modules. A SPPF module is added at the top of the backbone network to extract important context features. By concatenating feature maps of various scales, the SPPF module enhances the network’s receptive field and boosts both the efficiency of detecting defects at multiple scales and the reasoning speed. The output feature maps of C 3 , C 4 , and C 5 , obtained in the backbone at three different scales corresponding, respectively, to 8, 16, and 32 times down-sampling, are inputted to the neck for feature aggregation. As described in Section 2, the neck structure has an important impact on the accurate detection of lung tumors with scale changes. Therefore, we redesigned the original neck structure of YOLOv7-tiny, and called it DENeck, by decoupling the feature pyramid into a high-semantic region and low-semantic region. Further, we propose a CRS structure to enhance the multi-scale feature representation capability by expanding the receptive field of the low-level semantic region. The three detection heads are used for anchor box classification and regression of large, medium, and small objects, respectively. The network performs detection on the feature maps output by the three detection heads P 3 , P 4 , and P 5 , whose corresponding scales are (16, 3, 80, 80, 7), (16, 3, 40, 40, 7), and (16, 3, 20, 20, 7), respectively. The first-dimension value (i.e., 16) in the output of the ELCT-YOLO detection head represents that the model processes 16 images at once. The second-dimension value (i.e., 3) represents the use of k-means clustering to obtain three prior boxes of different sizes. The values 80, 40, and 20 in the third and fourth dimensions represent the detection of images at different granularities, corresponding to receptive fields of 8 × 8 , 16 × 16 , and 32 × 32 , respectively. The fifth-dimension value represents the model’s prediction information, including the predicted box information, confidence in the presence of tumors, and classification information for adenocarcinoma and small cell carcinoma.

3.2. Decoupled Neck (DENeck)

3.2.1. Motivation

In YOLOv7-tiny, the neck structure adopts a structure similar to the PANet to cope with difficulty of performing multi-scale object detection. Its core idea is to use the multi-scale expression built in CNN, which is generated by repeated down-sampling or pooling operations. As described in Section 2, PANet first fuses feature information from top level to bottom level, and then constructs a bottom-up secondary fusion path to generate enhanced semantic and detail information. However, this design may not be suitable in each situation.
First of all, this fusion method ignores the semantic differences of features with different scales [47]. In a linear combination of feature layers, the adjacent feature layers are closer in semantic information, while the feature layers that are far away not only bring detailed information in semantics or space, but also introduce confusion information in the process of transmission. Further, we believe that this conflict is more obvious in the process of processing CT images. Unlike natural images, CT images are reconstructed by a specific algorithm based on the X-ray attenuation coefficient. The quality of CT images is limited by specific medical scenarios. Compared with the dataset commonly used in computer vision tasks, CT images have a single background and low contrast [48]. The characteristics of the CT images determine their low-level features, such as the tumor edge and shape, which need to be paid attention to in the process of tumor detection. The semantic confusion will destroy the details of the lesions. Based on this logic, our designed neck network reduces semantic conflicts by a decoupling method. This enhances the model’s ability to detect tumors at different scales and emphasizes the tumor region in the CT image.

3.2.2. Structure

We use the backbone of YOLOv7-tiny as a benchmark, where { C 3 , C 4 , C 5 } represent the corresponding feature layer generated by the backbone. The corresponding output feature map of the same space size is denoted by { P 3 o u t , P 4 o u t , P 5 o u t } , and the stride of the feature map relative to the input image is { 3 , 4 , 5 } pixels.
As shown in Figure 4, the P3 branch in the blue area corresponds to low-level semantic information, including details of tumor edge and shape. At the same time, it is noted that canceling the information from P 4 and P 5 will lead to insufficient receptive fields of low-level semantic branches, so we propose a CRS structure to increase the receptive fields of low-level semantic region and improve the multi-scale feature representation ability. The P 4 and P 5 branches in the yellow area in Figure 4 correspond to high-level semantic information, which is crucial to determine the tumor type. We maintain a cross-scale feature fusion between higher levels because there is less conflict between them.
The designed DENeck feature aggregation method is as follows:
P 3 out = R F E M ( C 3 )
P 4 o u t = E E L A N ( c o n c a t [ B 4 , r e s i z e ( C 5 ) ] ) + C 4
P 5 o u t = E E L A N ( c o n c a t [ B 5 , d o w n ( P 4 t d ) ] ) + C 5
where RFEM can be either a Series RFEM (SRFEM) or a Parallel RFEM (PRFEM), both of which were tried in different cascaded combinations for use in the proposed model (c.f., Section 4.5); ” + ” denotes element-wise addition; B 4 and B 5 correspond to C 4 and C 5 output by 1 × 1 convolution, respectively (we use independent 1 × 1 convolutional layers at different levels to reduce the differences in features between levels); P 4 t d denotes the feature obtained by fusing C 4 and C 5 after r e s i z e operation, which includes up-sampling in alignment with resolution and 1 × 1 convolution adjustment dimension; c o n c a t and d o w n denote the tensor splicing operation and down-sampling operation, respectively. E-ELAN is used after c o n c a t to reduce the aliasing caused by fusion. Batch normalization (BN) and Sigmoid Weighted Liner Unit (SiLU) activation functions are used behind all the convolutional layers in the DENeck structure.

3.3. Cascaded Refinement Scheme (CRS)

While the Decoupled Neck paradigm helps improve detection performance, it leads to loss of receptive fields. Low-level semantic features are short of receptive fields that are large enough to capture global contextual information, causing the detectors to confuse tumor regions with their surrounding normal tissues. In addition, tumors of different sizes in CT images should match receptive fields of different scales.
In response to this, we propose a CRS structure to further improve the effective receptive fields. CRS consists of two types of modules—a SRFEM, shown Figure 5, and a PRFEM, shown in Figure 6. They both use dilated convolutions with different dilation rates to adjust the receptive fields.
Different from the normal convolution, in dilated convolution, the convolution kernel values are separated by fixed intervals, which can increase the size of the perception area without changing the parameters [45]. If x ( m , n ) is the input of the dilated convolution, then its output y ( m , n ) is defined as follows:
y ( m , n ) = i = 1 M j = 1 N x ( m + r × i , n + r × j ) w ( i , j )
where M and N denote the size of the convolution kernel (the normal convolution kernel is of size M = 3 , N = 3 ), w ( i , j ) is a specific parameter of the convolution kernel, and r denotes the dilated convolution sampling rate (i.e., the number of zeros between non-zero values in the convolution kernel). Different values of r can be set to obtain corresponding receptive fields. When r = 1 , the receptive field is 3 × 3 , and when r = 2 and r = 3 , the receptive field is expanded to 5 × 5 and 7 × 7 , respectively. The amount of computation is always the same as the normal convolution of M = 3 , N = 3 . This operation is often used to expand the receptive fields of the network while preserving the spatial resolution of the feature map.
For the dilated convolution of k × k , the formulae for calculation of the equivalent receptive field ( R F ) and resolution ( H ) of the output feature map are the following:
R F = ( r 1 ) ( k 1 ) + k
H = h + 2 p R F s + 1
where p , h , and s represent the padding filling, input feature map resolution, and convolution stride size, respectively.

3.3.1. Series Receptive Field Enhancement Module (SRFEM)

In CT images, tumor detection is prone to the interference of surrounding normal tissues, especially for tumors with small differences in gray levels [49]. The objective of SRFEM is to enlarge the effective receptive field, which helps mitigate the influence of non-lesion regions and emphasize the tumor targets. We also took into account the issue of losing details due to sparsely sampled dilated convolutions, which is more prominent when multiple consecutive dilated convolutions are applied [24].
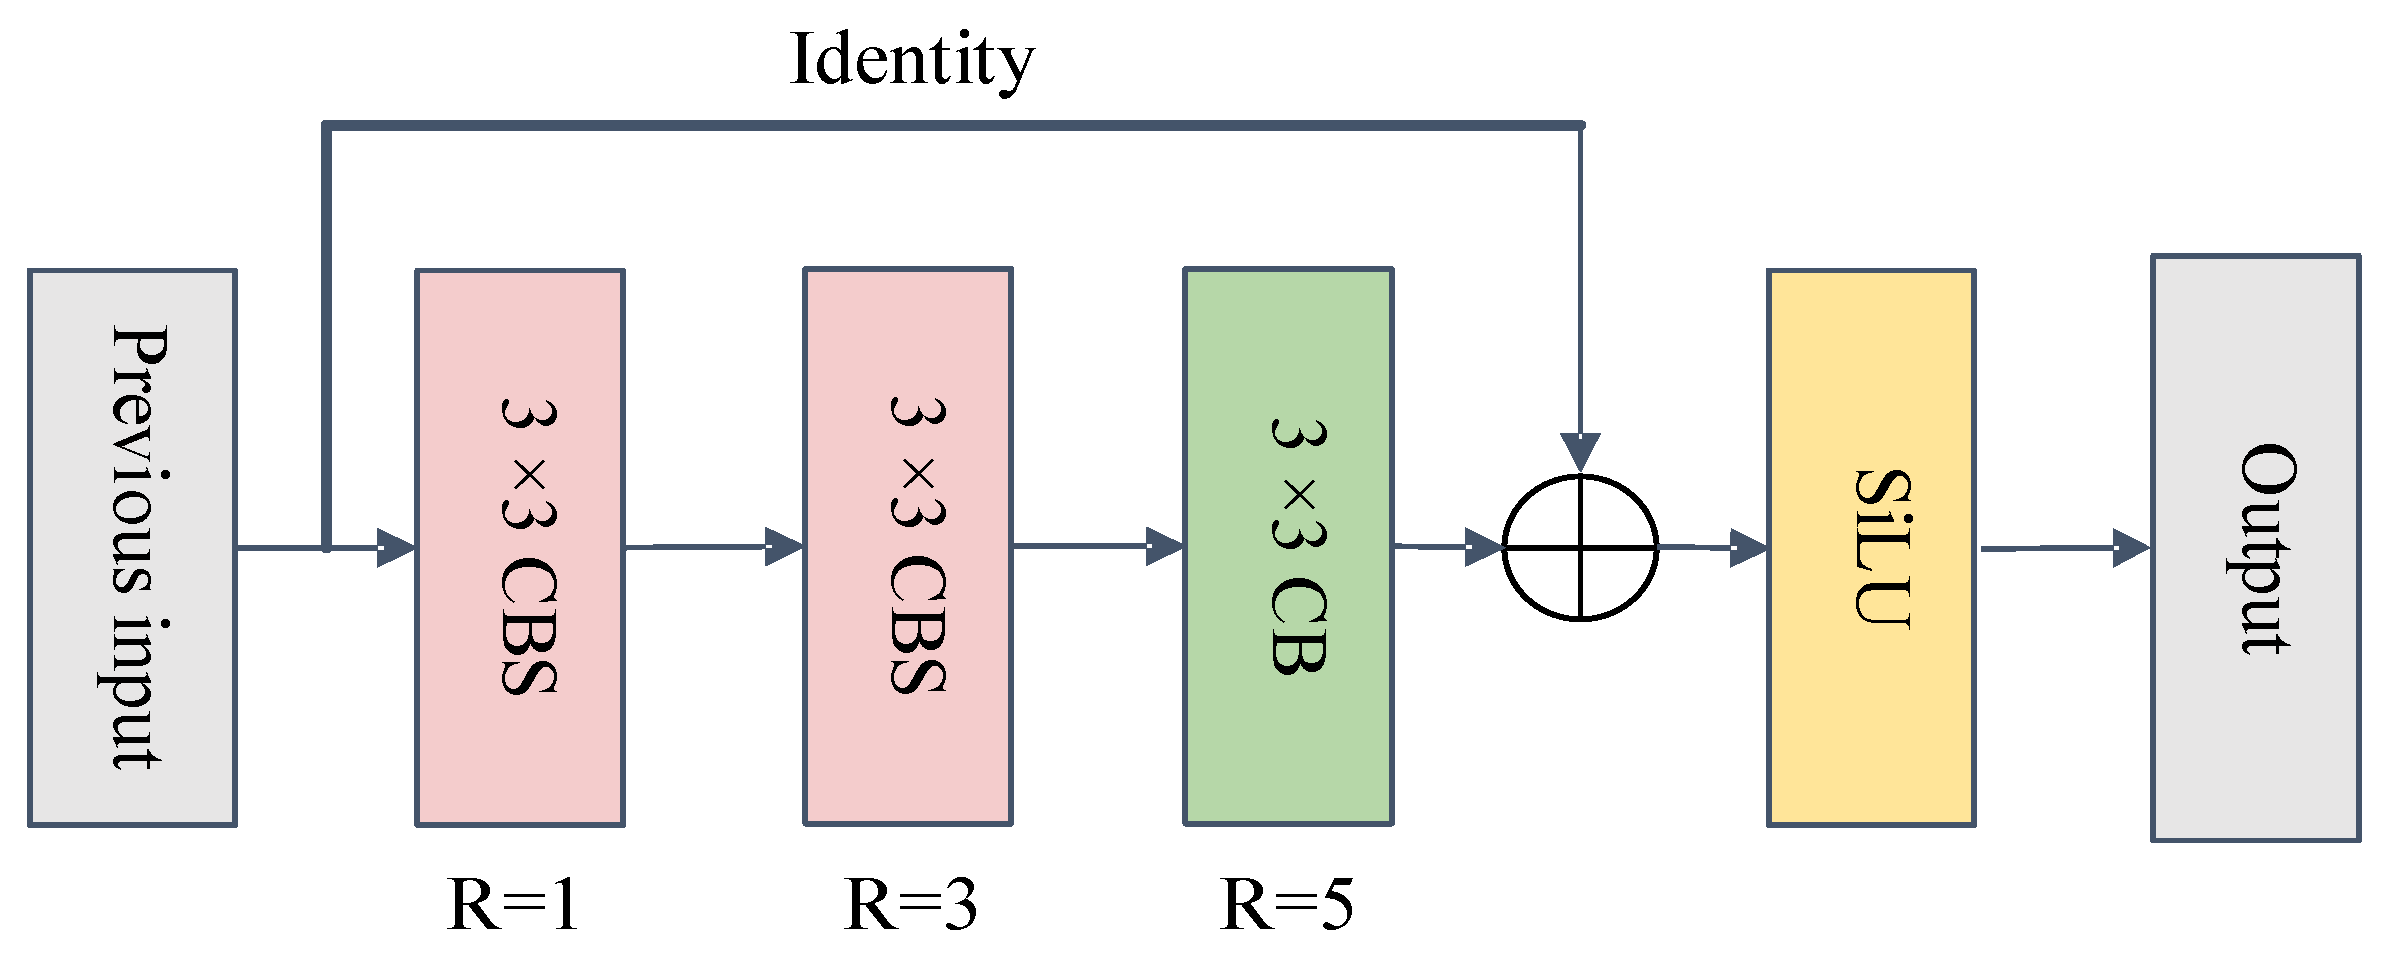
As shown in Figure 5, SRFEM uses three dilated convolutions with a 3 × 3 convolution kernel and a shortcut connection to form a residual structure, where the dilation rates of the dilated convolutions are 1, 3, and 5, respectively.
Let the given input feature be x . Then, the SRFEM output is expressed as follows:
y = S i L U ( i n p u t + C o n v 3 5 ( C o n v 3 3 ( C o n v 3 1 ( x ) ) ) )
where C o n v 3 1 , C o n v 3 3 , and C o n v 3 5 denote the dilation rates of 1, 3, and 5 corresponding to a 3 × 3 convolution, respectively. C o n v 3 5 applies BN, while both C o n v 3 1 and C o n v 3 3 apply BN and SiLU. C o n v 3 5 ( C o n v 3 3 ( C o n v 3 1 ( x ) ) ) aims to obtain a feature map with a sufficiently large receptive field, which is added to the shortcut connection to stack deeper networks. The fused features lead to y through a SiLU activation function. Compared to the input features, the number of channels of y remains unchanged.

3.3.2. Parallel Receptive Field Enhancement Module (PRFEM)

PRFEM aims to construct a multi-branch structure, that extracts corresponding spatial scale features with different receptive fields, and then stitches these features together to obtain a complete expression of the image. Chen et al. [38] first used dilated convolution to build a spatial pyramid module, called ASPP, in DeeplabV2. ASPP is a multi-branch structure consisting of four 3 × 3 convolution branches, whose corresponding dilation rates are 6, 12, 18, and 24, respectively. They can capture richer semantic information. However, when the dilation rate is too large, the acquisition of local semantic information is compromised [50].
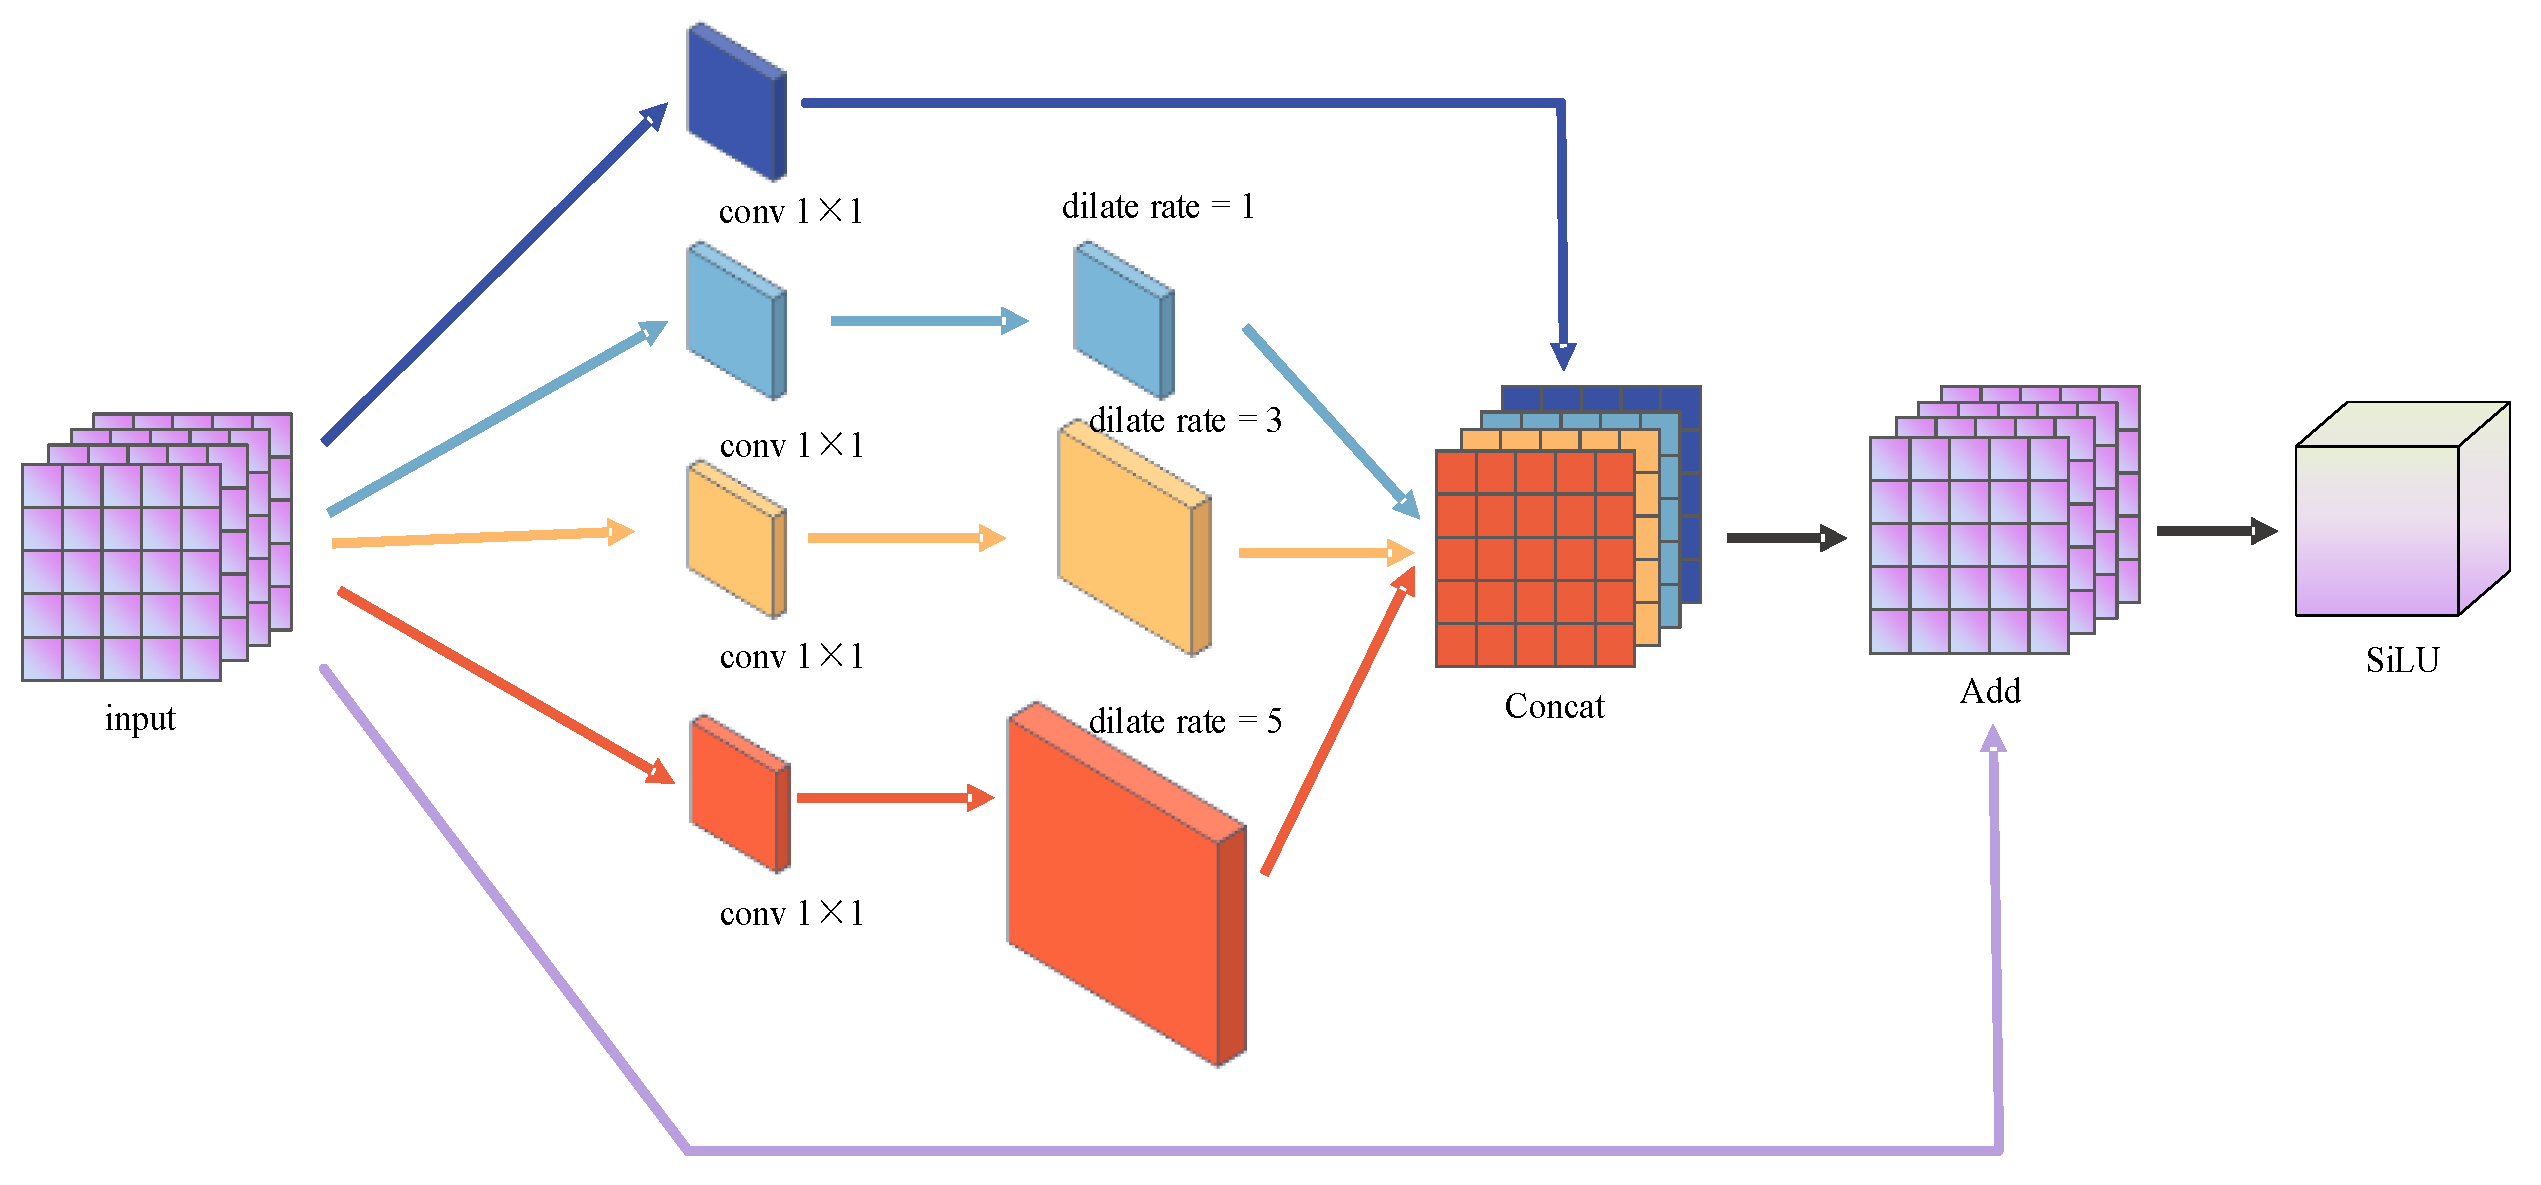
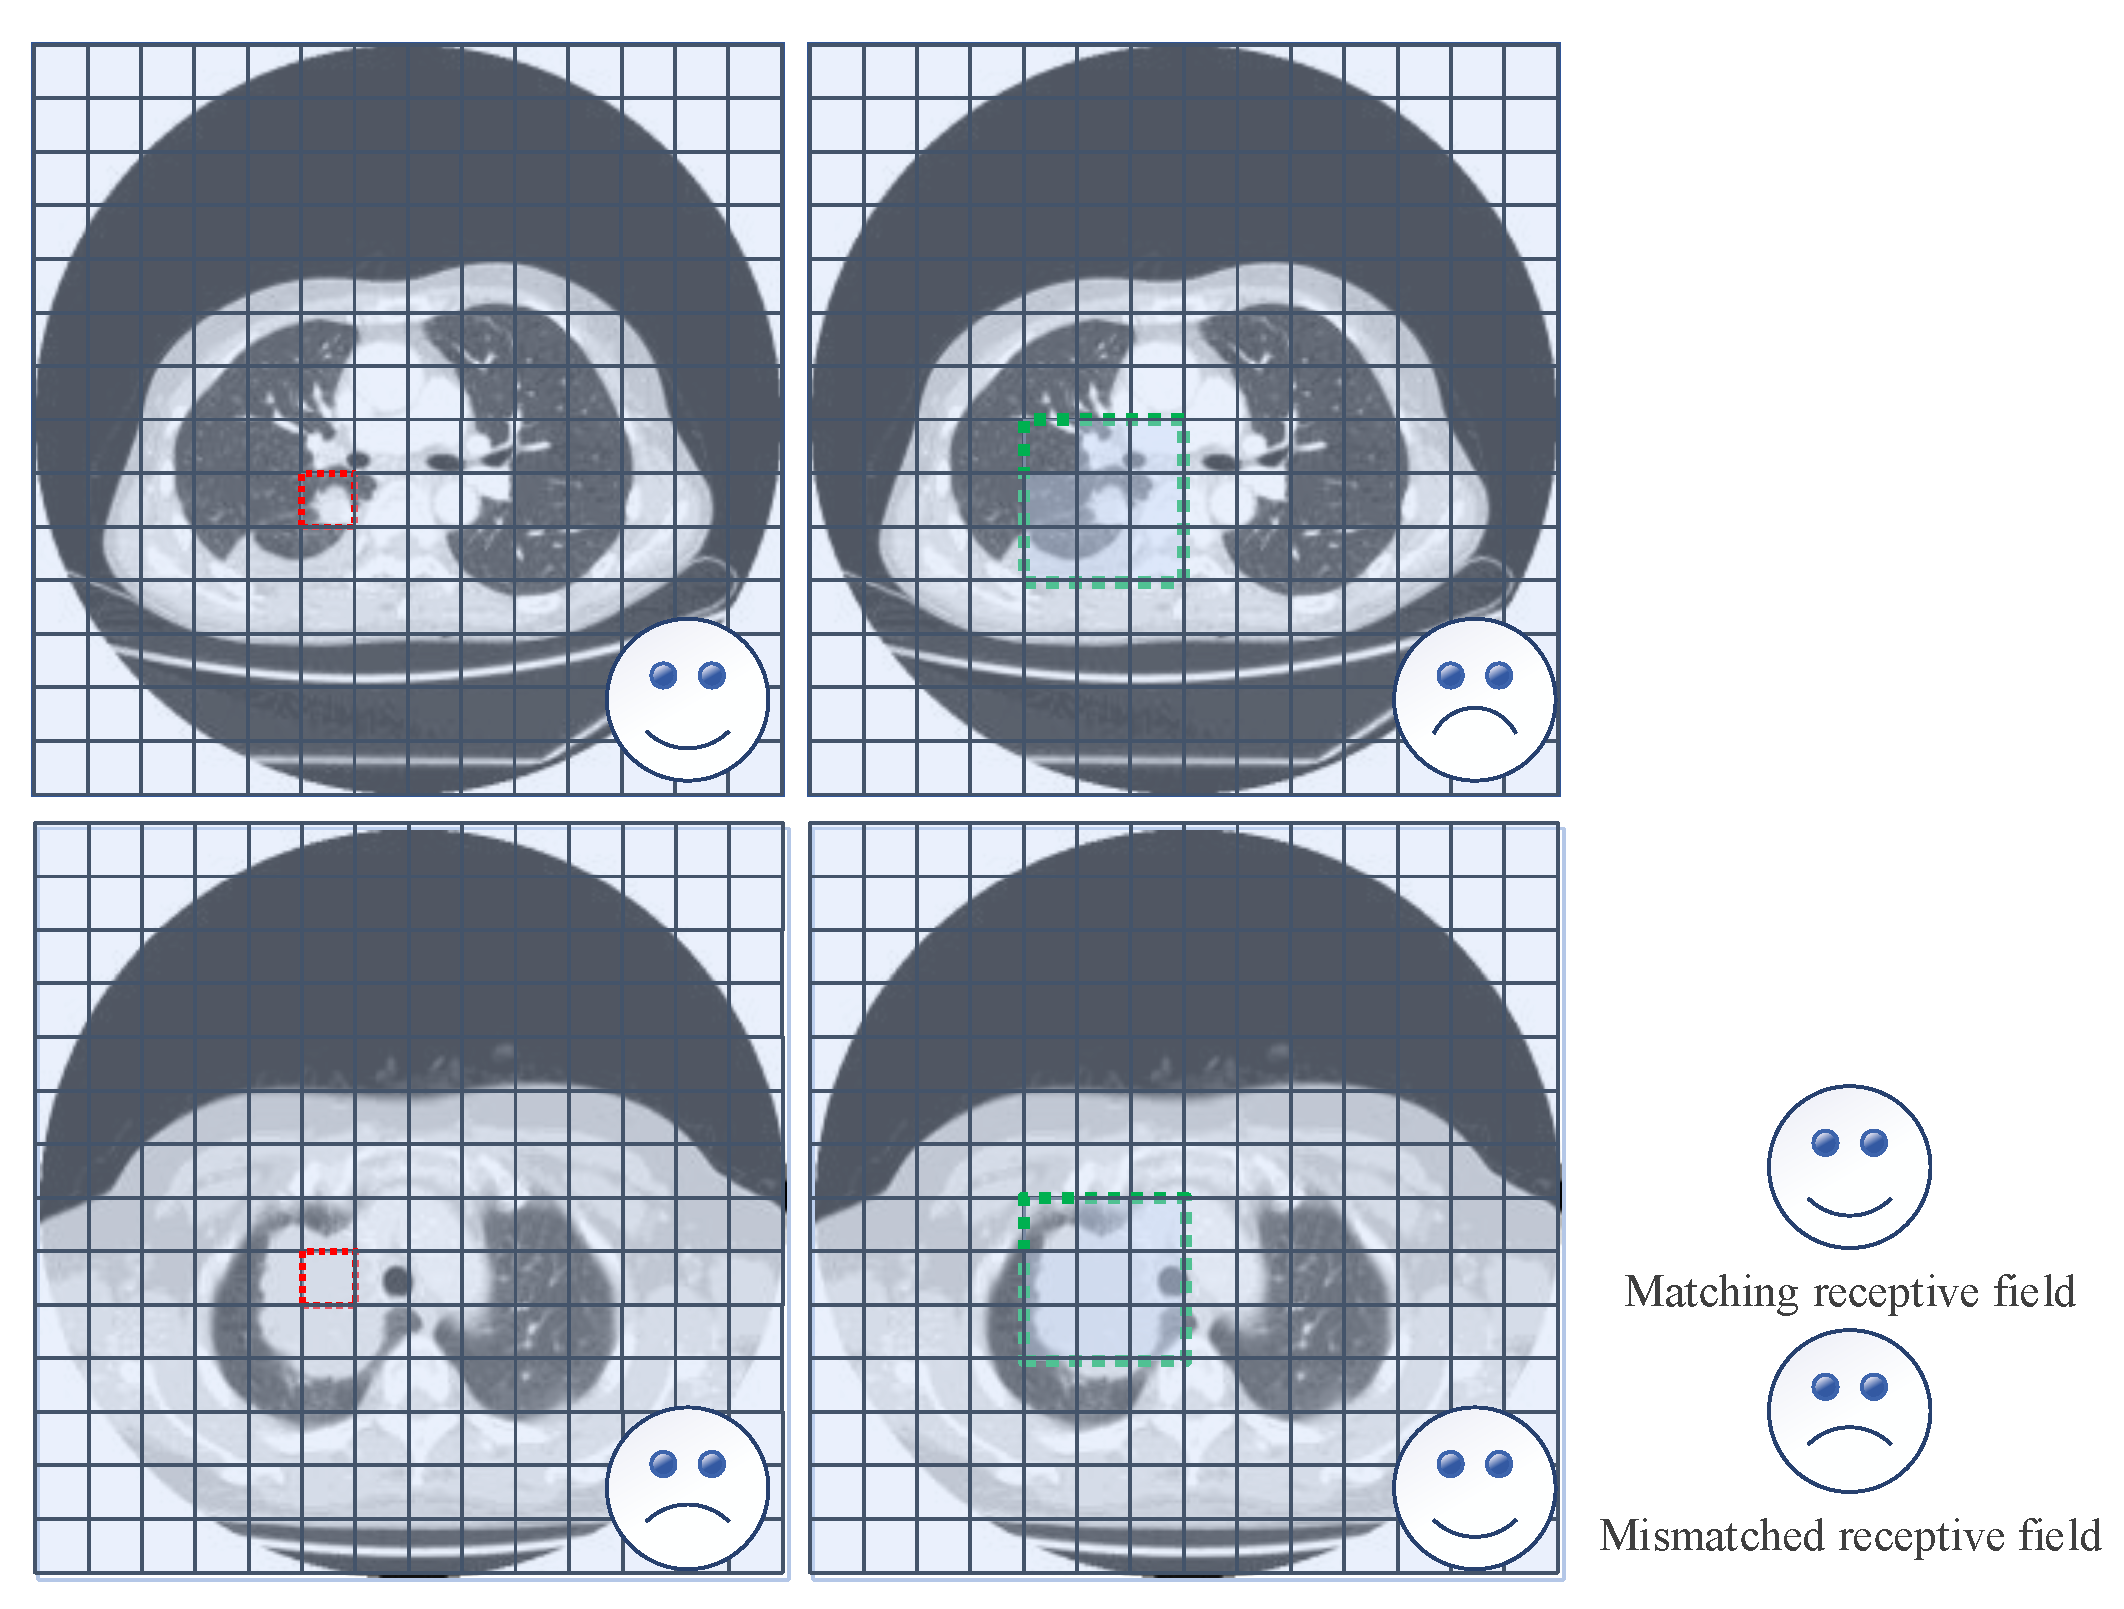
The inspiration of PRFEM comes from DeeplabV2. The difference lies in that PRFEM is used to generate uniform receptive fields which adapt to tumors of different sizes shown in Figure 7. More specifically, PRFEM consists of three parallel 3 × 3 convolution branches with different dilation ratios, one 1 × 1 convolution branch, and one identity branch. First, for each branch with dilated convolution, we use 1 × 1 convolution to reduce the channel number of dilated convolution to a quarter of the input feature map, ensuring an even distribution of information across different scales. Then, the 1 × 1 convolution branch obtains the association of image details and enhanced position information. As an example, for a dilated convolution with a dilation rate of R = ( 1,3 , 5 ) and a convolution kernel of 3 × 3 , the corresponding padding is set to P = ( 1,3 , 5 ) , so that the resolution of the feature map remains unchanged, as per formula (6). We stitched together the sampling results from different branches in terms of channel to obtain multi-scale information representation. Finally, the identity connection is used to optimize the gradient information propagation and lower the training difficulty. After each convolutional layer, BN and SiLU are performed.

4. Experiments and Results

4.1. Dataset and Evaluation Metrics

We randomly sampled 2324 CT images (1137 containing adenocarcinoma tumors and 1187 containing small cell carcinoma tumors) from the CT data provided by Lung-PET-CT-Dx [51] for the training, validation, and testing of the proposed model. These images were collected retrospectively from suspected lung cancer patients. Category information and location information for each tumor was annotated by five experienced radiologists using the LabelImg tool. The CT images provided in the dataset are in the Digital Imaging and Communications in Medicine (DICOM) format. We performed pre-processing on the DICOM format of the CT images to enable their use in the proposed ELCT-YOLO model. The image pre-processing operation flow is illustrated in Figure 8.
First, we read the DICOM files to obtain the image data. Next, we used a Reshape operation to adjust the coordinate order and generate a new matrix. Then, we normalized the pixel values by subtracting the low window level from the original pixel values and dividing by the window width to improve contrast and brightness. After that, we used pixel mapping to map the gray values to an unsigned integer pixel value between 0 and 255. Through these steps, we successfully adjusted the pixel values and generated the corresponding PNG images.
The 2324 CT images were split into training, validation, and test sets at a ratio of 6:2:2. The choice of this ratio is based on the size of the utilized dataset, taking into account the experience of previous researchers. Another common ratio is 8:1:1. However, using an 8:1:1 ratio in our case would result in an insufficient number of samples in the validation and testing sets, which may not fully reflect the model’s generalization ability on real-world data. Additionally, if the number of samples in the testing set is too small, the evaluation results of the model may be affected by randomness, leading to unstable evaluation results. Therefore, we chose the 6:2:2 ratio.
For performance evaluation of the models compared with respect to tumor detection, we used common evaluation metrics, such as mAP@0.5: the mean average precision (IoU = 0.5), precision (P), and recall (R), defined as follows:
P = T P T P + F P
R = T P T P + F N
A P = 0 1 P d R
m A P = i = 1 N A P i N
where T P , F P , and F N denote the number of correctly detected, incorrectly detected, and missed tumor cases presented in images, respectively. m A P is obtained by averaging the corresponding A P values for each category (in our case, N = 2 represents the two considered tumor categories of adenocarcinoma and small cell carcinoma).

4.2. Model Training

ELCT-YOLO is based on the implementation of open-source YOLOv7. Training of the model was conducted on a Linux system running Ubuntu 20.04.1, utilizing an RTX2080Ti GPU for accelerated computation. The model training utilized a batch size of 16, and an input image size of 512 × 512 pixels was specified. The stochastic gradient descent (SGD) optimizer was adopted in the model training, with the initial learning rate and momentum default value being 0.01 and 0.937, respectively. The following adjustment strategy was used for the learning rate of each training round:
l f = 1 1 2 ( 1 l r f ) × ( 1 cos i × π e p o c h )
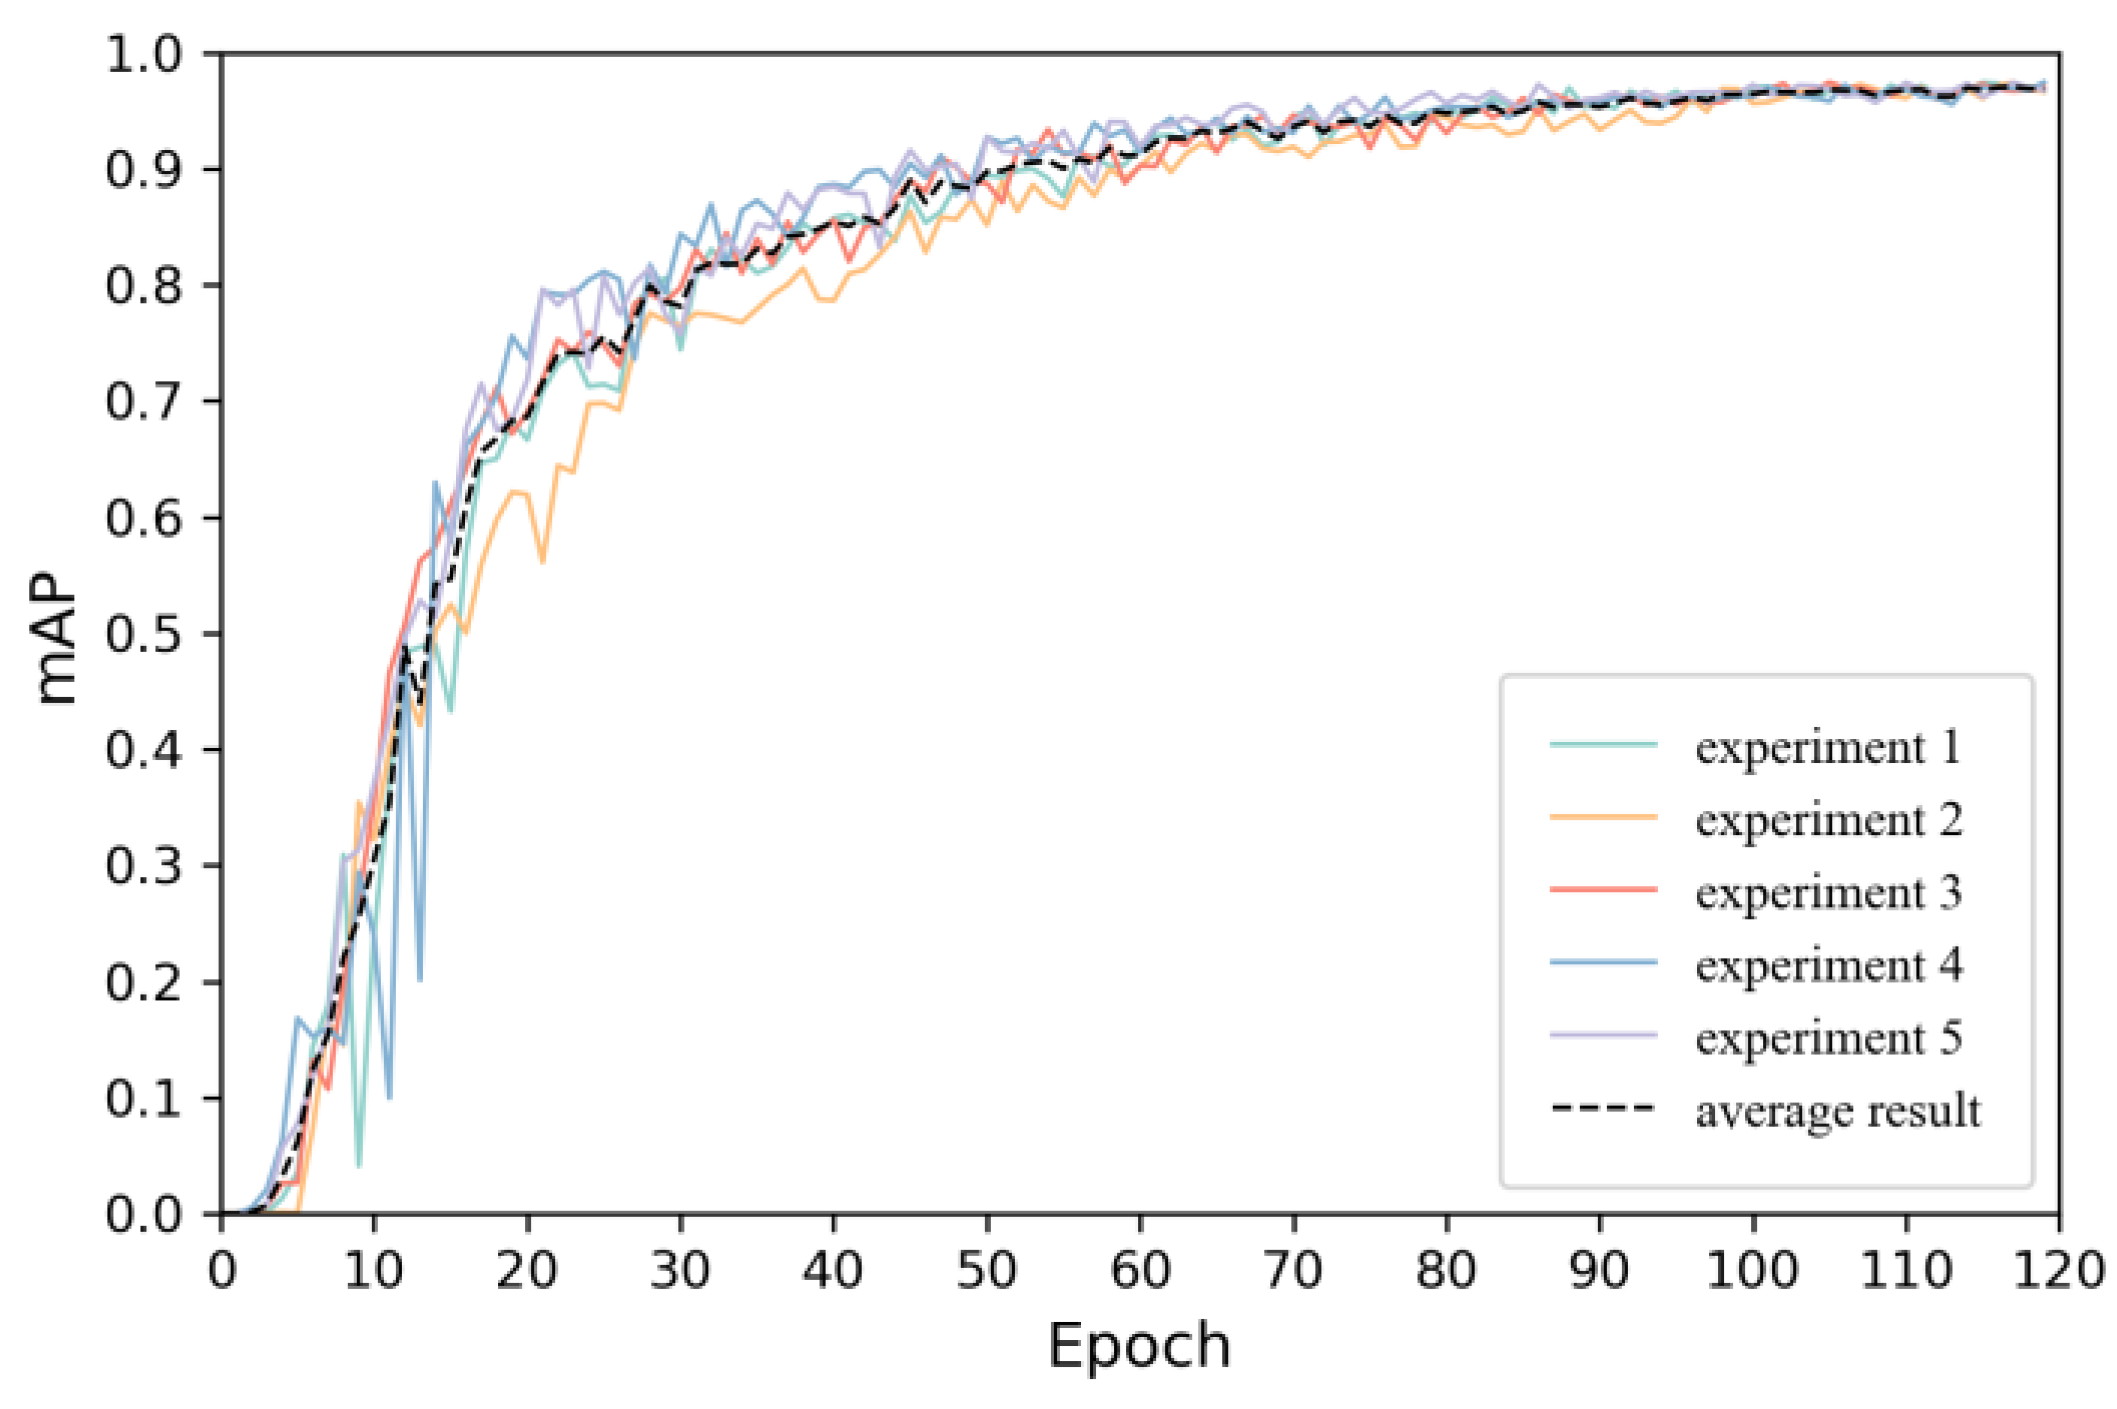
where i denotes the i -th round, l r f denotes the final OneCycleLR learning rate multiplication factor which is set to 0.1, l f denotes the multiplier factor for adjusting the learning rate, and e p o c h represents the current training round We used mosaic enhancements to load images and corresponding labels. In addition, we did not load the weight file trained by YOLOv7 on the MS COCO dataset during the training process. This is because there is a huge difference in the domain between ordinary natural images and medical images, and migration did not result in desired results [52]. To minimize the impact of randomness on the evaluation results, we divided the dataset into five equally sized and mutually exclusive parts. We repeated the experiments five times and selected the highest peak of the average value as the final result. As Figure 9 illustrates, the proposed ELCT-YOLO model achieved stable convergence after 120 rounds of training.
The loss function (L) of the ELCT-YOLO model, used to calculate the loss between the predicted boxes and the labels of the matched grids, was the following:
L = λ 1 × L o b j + λ 2 × L c l s + λ 3 × L b o x
where L o b j , L c l s , L b o x denote the coordinate loss, classification loss, and objectness loss, respectively. The values of λ 1 , λ 2 ,   a n d   λ 3 are equal to 0.7, 0.3, and 0.05, respectively. L o b j and L c l s use binary cross-entropy to calculate the objectness and classification probability losses, while L b o x uses the Complete Intersection over Union (CIoU) to calculate the regression loss of bounding boxes [53]. The CIoU loss function not only considers the aspect ratio, overlap area, and center distance but also includes a penalty term, and is expressed as follows:
L C I o U = 1 I o U + ρ 2 ( b , b g t ) c 2 + α ν
where IoU represents the intersection over union between the predicted box b and the ground truth box b g t , ρ 2 ( b , b g t ) represents the Euclidean distance between the center point of the predicted box and the center point of the ground truth box [54], and α ν is the penalty term that ensures that the width and height of the predicted box quickly approach those of the ground truth box. The values of α and ν are calculated as follows:
α = ν ( 1 I o U ) + ν
ν = 4 π 2 ( arctan w g t h g t arctan w h ) 2
where w and h denote the width and height of the predicted bounding box, respectively, while w g t and h g t denote the width and height of the ground truth bounding box, respectively.
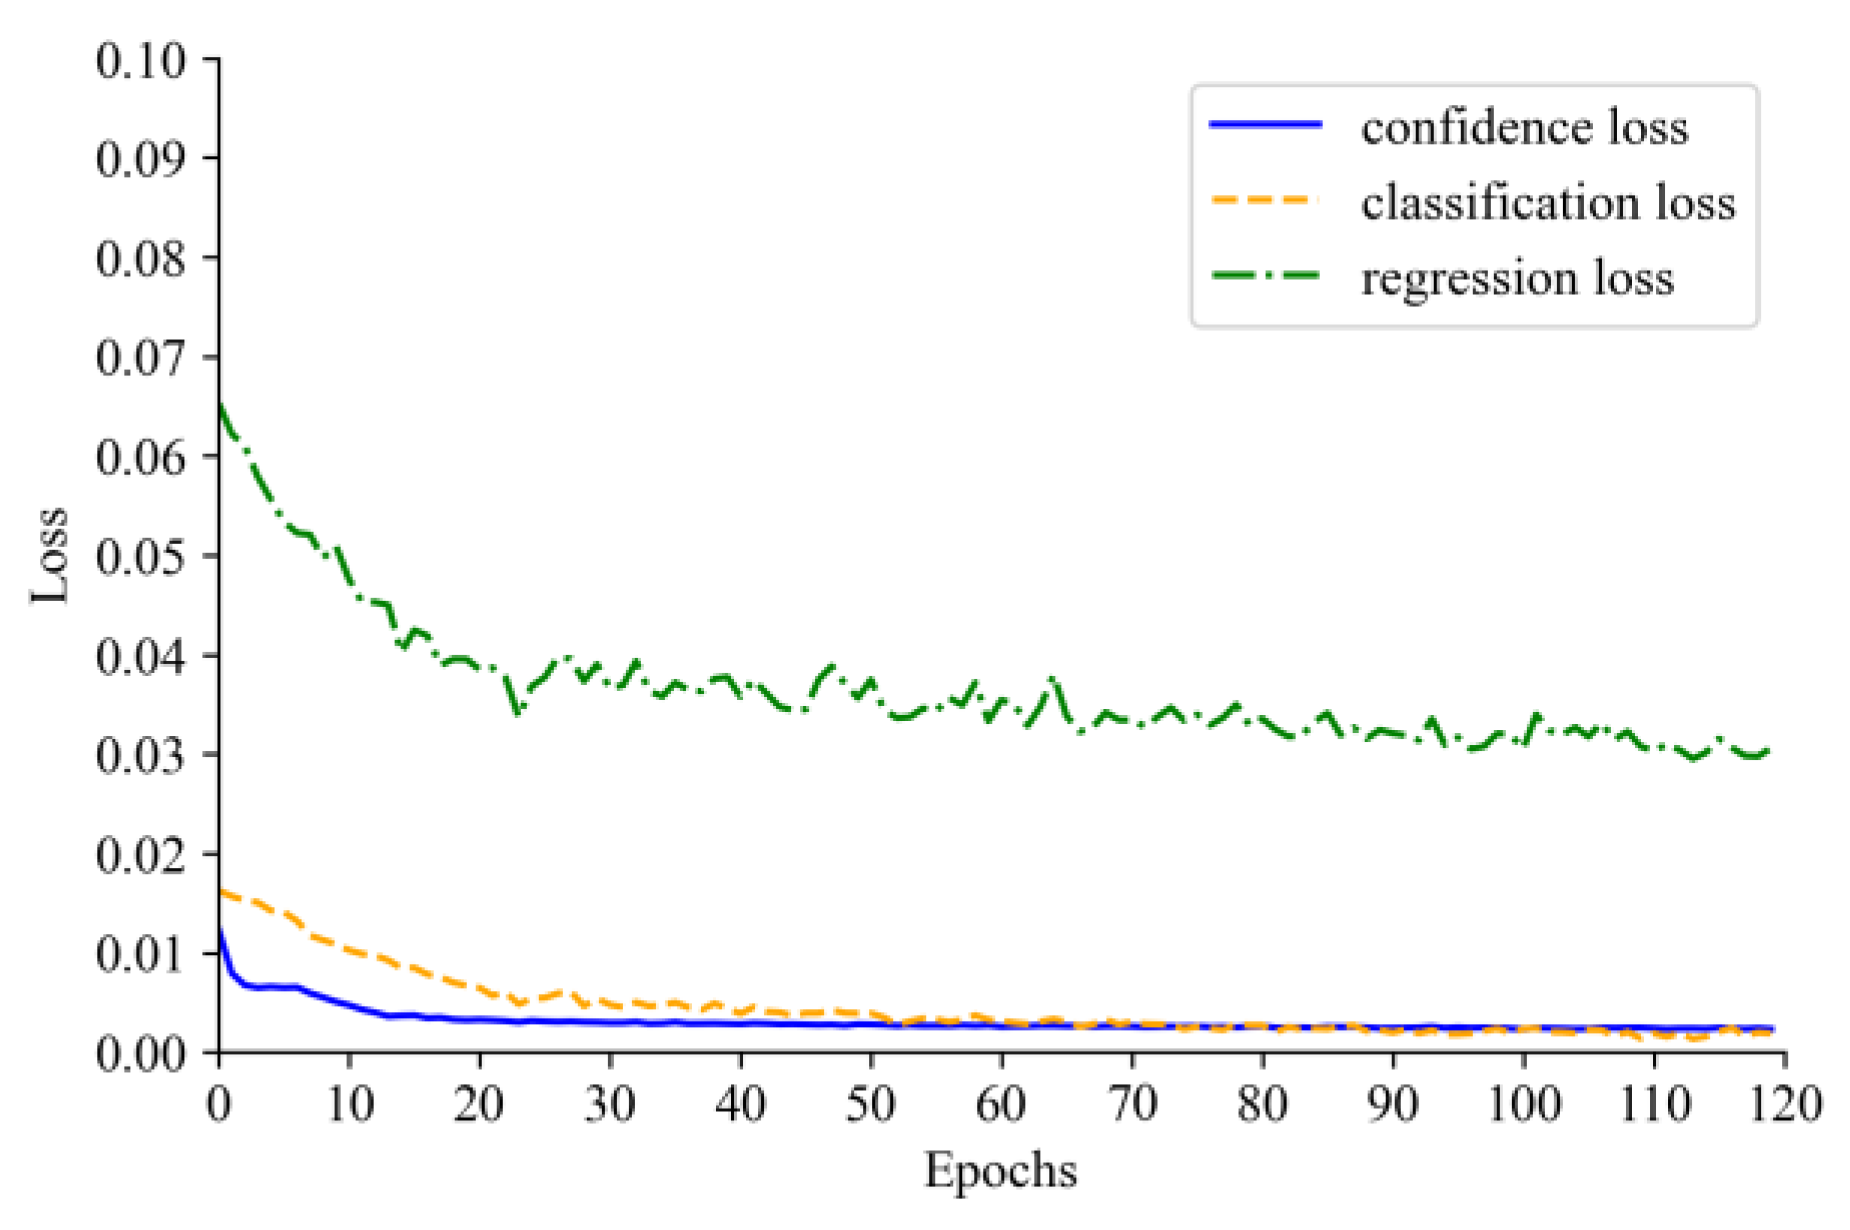
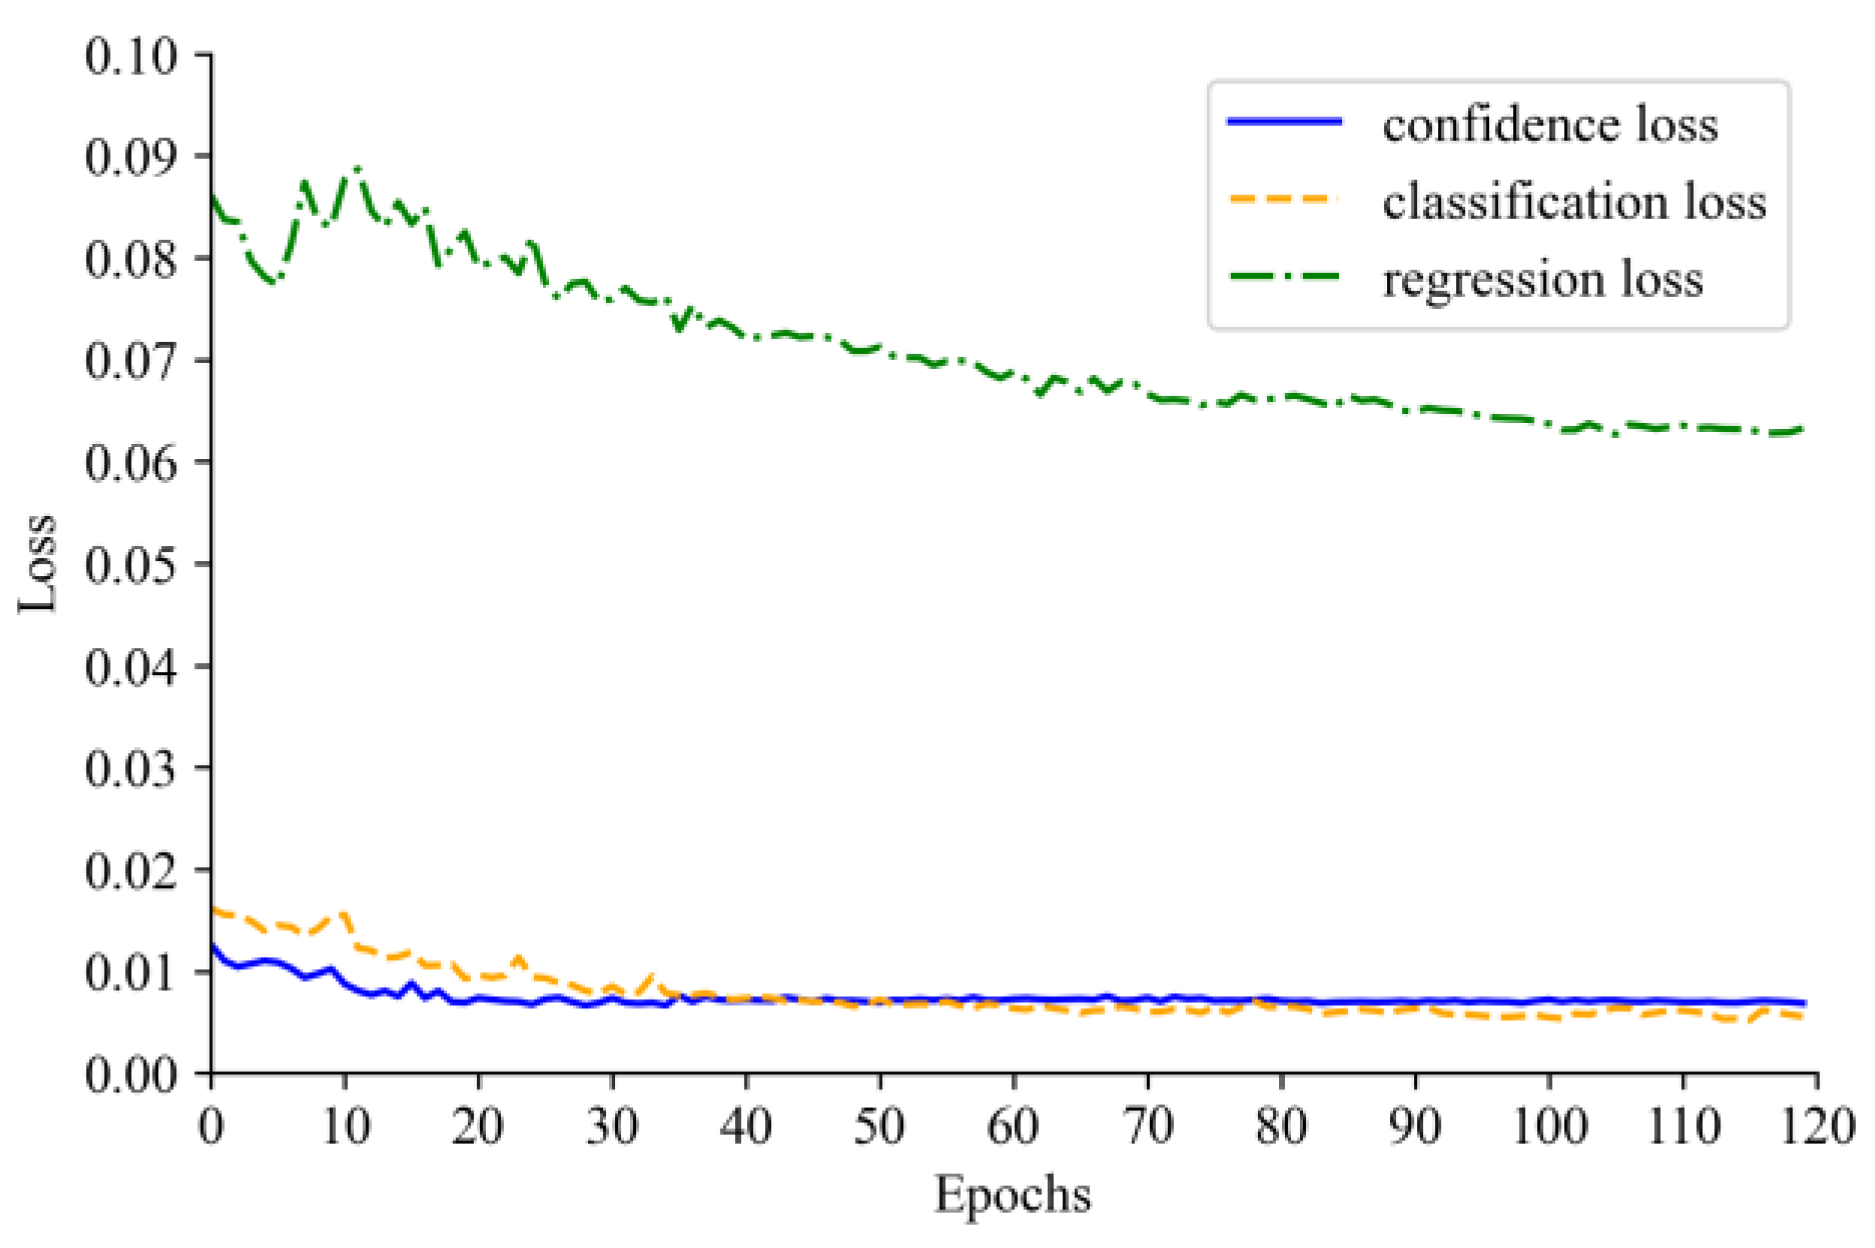
The convergence curves of the confidence loss, classification loss, and regression loss during the process of training and validation of the ELCT-YOLO model are presented in Figure 10 and Figure 11. It can be observed that with more training iterations, the losses of ELCT-YOLO on the training set continuously decrease, indicating the model’s ability to fit the distribution of the training data. On the other hand, the losses on the validation set reflect the detection model’s good generalization ability on unknown data.

4.3. Comparison of ELCT-YOLO with State-of-the-Art Models

We compared the proposed ELCT-YOLO model with six state-of-the-art models, namely YOLOv3, YOLOv5, YOLOv7-tiny, YOLOv8, SSD, and Faster R-CNN. The obtained results are shown in Table 1
As evident from Table 1, the proposed ELCT-YOLO model is the winner based on recall, while also having the smallest size among the models. According to m A P , it takes second place by closely following the winner (YOLOv8, which was also trained for 120 epochs with a batch size of 16) and scoring only 0.003 points less, but its size is almost half the YOLOv8 size. Regarding the achieved precision, ELCT-YOLO does not perform so well; it occupies fourth place by scoring 0.044 points less than the winner (YOLOv8). Regarding the FPS, the proposed ELCT-YOLO model takes second place, closely following the winner (YOLOv7-tiny) by processing only 2 frames less per second.
As mentioned in the Introduction, devices used in real medical scenarios are often resource-constrained, so smaller-size models are more appropriate for use. ELCT-YOLO achieves a good balance between accuracy and efficiency in tumor detection. In addition, in terms of recall, ELCT-YOLO achieved best results among the models compared, which is conducive to tumor screening, as the higher the recall value, the fewer tumors will be missed, and the detector will find every potential lesion location.
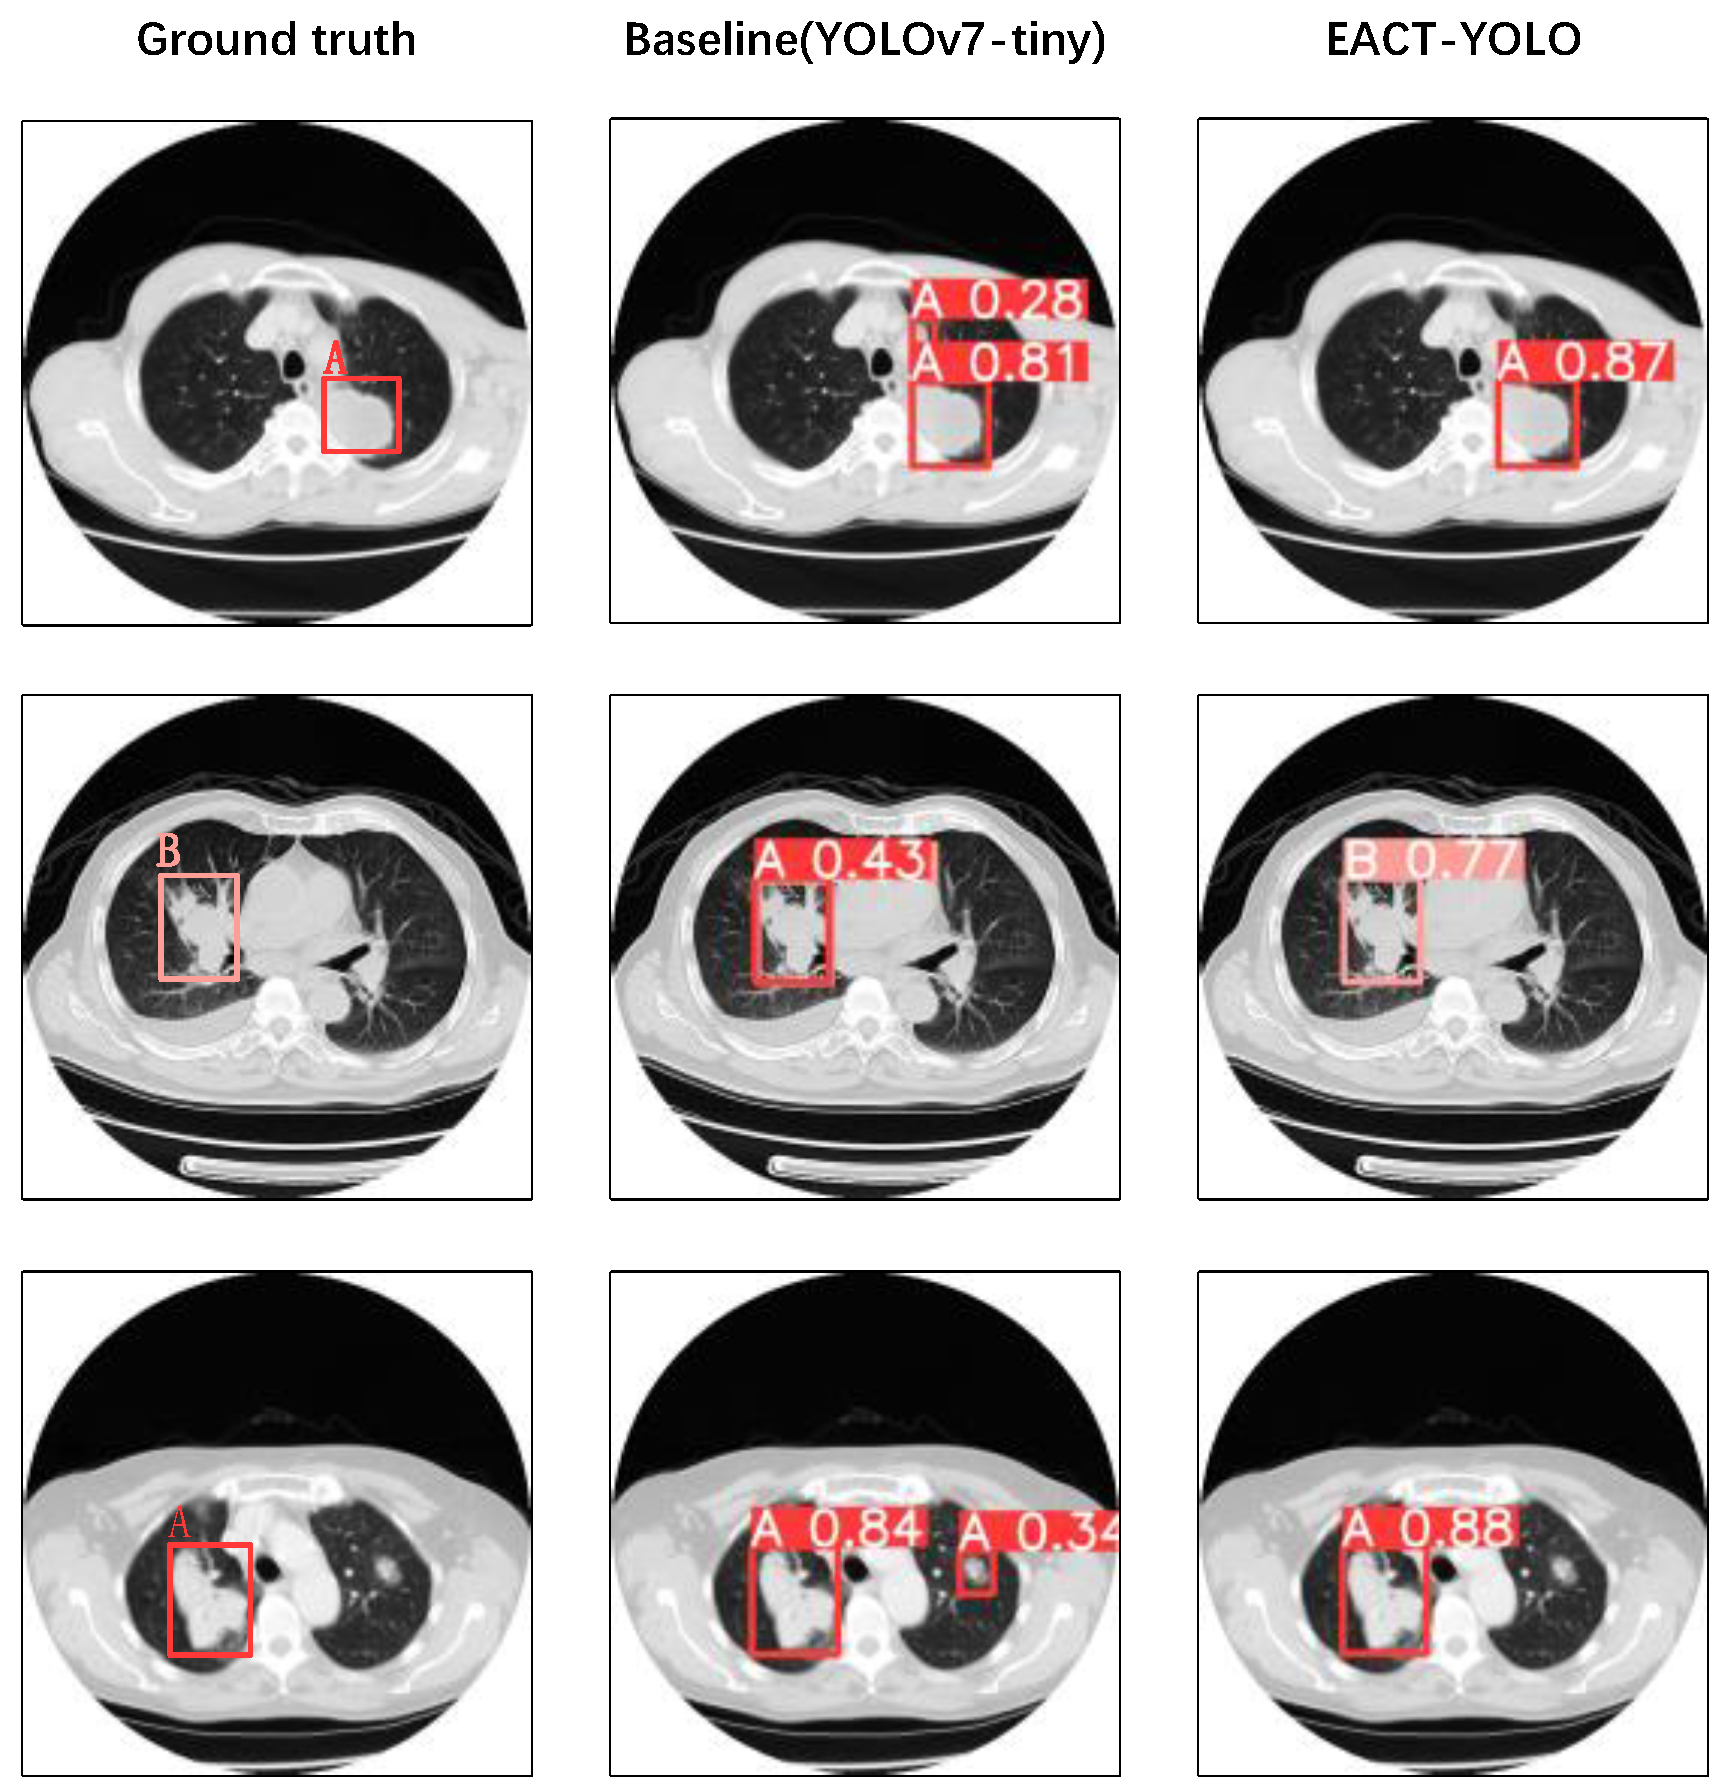
Figure 12 illustrates sample images from the test set along with their corresponding detection results. It is evident from the figure that ELCT-YOLO performs well in detecting tumors of varying scales in CT images.

4.4. Ablation Study of ELCT-YOLO

To further evaluate the impact of using the designed DENeck and CRS structures, and of integrating the SPPF module [25] into YOLOv7-tiny, we performed an ablation study on these performance improvement components, the results of which are shown in Table 2.
First of all, the SPPF module of YOLOv5 [25], which we introduced at the top of the original YOLOv7-tiny backbone network, did not lead to a significant improvement in the mean average precision (mAP), but the model size was reduced by 7%. Then, using the designed DENeck structure alone enabled improving the mAP from 0.955 to 0.968, while the model size equaled that when using the SPPF module alone. Our belief has been confirmed that in the case of medical images, particularly CT images, precision in lesion detection can be improved by reducing confusing details. Using the designed CRS structure alone did not provide better results than using DENeck alone but led to improving the mAP value from 0.955 to 0.966, compared to the original YOLOv7-tiny model, though increasing the model size. This is because the shallow prediction branch needs effective global information to distinguish tumor regions from the background. When we integrated all three components, the mAP value exceeded that of applying any one of these components alone, while also keeping the model size very close to the minimum reached when using only SPPF or DENeck, which proves the rationality of the design of the ELCT-YOLO model proposed.

4.5. CRS Study

The designed CRS structure, described in Section 3, consists of two modules—SRFEM and PRFEM. In order to achieve a more effective receptive field, we studied the use of different cascade schemes, the results of which are shown in Table 3, where SRFEM and PRFEM are denoted as P and S, respectively. The CRS study was based on precision, recall, and the mAP.
As can be seen from Table 3, using different cascade schemes (different P-S combinations) led to different values of the evaluation metrics used for the comparison. The PPP scheme performed worst according to all metrics. This may be due to the lack of receptive fields in low-contrast scenes, which is key to the improvement of detection performance, although PRFEM can capture multi-scale information from CT images to improve the ability to detect tumors. Overall, SSS is the best-performing scheme based on two of the evaluation metrics, i.e., recall and the mAP, reaching 0.957 and 0.974, respectively. The use of SSS can effectively enhance the receptive field of shallow branches, thereby improving the detection performance. Thus, this scheme was utilized by the proposed ELCT-YOLO model in the performance comparison with the state-of-the-art models (c.f., Table 1).
In addition, we verified the effect of using different dilation rates on the SSS cascaded scheme, in order to further improve the feature map quality. We considered three cascades of dilation rates: Natural numbered Series (NS), Odd numbered Series (OS), and Even numbered Series (ES). In Table 4, R N S = ( 1,2 , 3 ) , R O S = ( 1,3 , 5 ) , R E S = ( 2,4 , 6 ) represent the values of these three series, respectively. Section 2 mentioned that the sparse sampling of dilated convolutions can easily lead to the loss of details. Therefore, choosing an appropriate sampling rate is also a way to alleviate the gridding effects. The comparison results in Table 4 show that R O S = ( 1,3 , 5 ) outperforms the other two schemes, according to all three evaluation metrics.
The sampling positions of the three consecutive dilated convolutions are visualized in Figure 13. It can be seen intuitively that when the dilation rate is R N S = ( 1,2 , 3 ) the SSS module can only obtain less receptive fields and cannot capture global information; when the dilation rate is R E S = ( 2,4 , 6 ) , the receptive field increases, but the feature information is not continuous, which will lead to the loss of details. The combination of R O S = ( 1,3 , 5 ) covers a larger receptive field area without losing edge information. This is consistent with our experimental results.

4.6. DENeck Study

To verify the effectiveness of DENeck, we applied it on the YOLOv7-tiny model along with traditional feature fusion methods (each applied separately from the rest). The comparison results are shown in Table 5. The main focus of this experiment was to compare the impact of various feature fusion methods on the detection performance based on different topological structures. The proposed DENeck module achieved the best detection performance among the compared methods. Comparing FPN to PANet and BiFPN, we found that the latter two outperform FPN. This is because the feature fusion in FPN is insufficient, and it is difficult to extract precise localization information of tumors.
Furthermore, in order to demonstrate the generalization ability of the designed DENeck structure under different scale networks, we evaluated its performance for detecting tumors in models with different depths. The obtained comparison results are shown in Table 6. We used three basic networks of YOLOv7: YOLOv7-tiny, YOLOv7, and YOLOv7x. The depth of these networks is gradually deepened in the stated order.
Table 6 shows that increasing the model scale improves the mAP, but the improvement is not significant—only by 0.006 points. This shows that, while the DENeck structure can be utilized by deepened backbones, its usage is more effective on lightweight networks that enable reducing the model size.

5. Conclusions and Future Work

This paper has proposed an efficient one-stage ELCT-YOLO model based on improvements introduced into the YOLOv7-tiny model, for lung tumor detection in CT images. Unlike existing neck structures, the proposed model aims to obtain multi-scale tumor information from the images. Firstly, a novel Decoupled Neck (DENeck) structure has been described for use in ELCT-YOLO to reduce semantic conflicts. More specifically, the model’s neck was divided into high-semantic layers and low-semantic layers, in order to generate clearer feature representations by decoupling the fusion between these two semantic types. The conducted experiments proved that DENeck can be integrated well into backbone networks of different depths, while also showing outstanding robustness. Secondly, a novel Cascaded Refinement Scheme (CRS), configured at the lowest layer of the decoupling network, has been described for use in ELCT-YOLO in order to capture tumor features under different receptive fields. The optimal CRS structure was determined through another set of experiments. In addition, the problem of sparse sampling caused by dilated convolution has been considered and the effect of different receptive field combinations on the cascaded modules has been compared by means of experiments. Thirdly, it has been proposed to integrate the SPPF module of YOLOv5 at the top of the original YOLOv7-tiny backbone network in order to extract important context features, further improve the model’s operational speed, and enrich the representation ability of feature maps. Extensive experiments, conducted on CT data provided by Lung-PET-CT-Dx, demonstrated the effectiveness and robustness of the proposed ELCT-YOLO model for lung tumor detection.
The presented study has focused on addressing the multi-scale issue of tumor detection using a lightweight model. The model still needs further optimization in reducing both the number of parameters and computational complexity. As a next step of the future research, we will use network distillation techniques and existing lightweight convolutional modules to construct a simpler model, aimed at reducing the inference latency and parameters’ number. In addition, the study presented in this paper has only focused on tumor detection tasks based on CT images. In fact, some emerging technologies such as super-wideband microwave reflection measurement are more user friendly and cost effective than traditional detection techniques such as the CT-based ones [55]. In the future, we will also focus on studying emerging technologies for lung cancer detection more in depth.

Author Contributions

Conceptualization, J.Z. and Z.J.; methodology, X.Z. (Xueji Zhang); validation, I.G. and H.Z.; formal analysis, J.Z. and X.Z. (Xinyi Zeng); writing—original draft preparation, J.Z.; writing—review and editing, I.G.; supervision, J.L.; project administration, X.Z. (Xueji Zhang) and Z.J. All authors have read and agreed to the published version of the manuscript.

Funding

This publication has emanated from joint research conducted with the financial support of the S&T Major Project of the Science and Technology Ministry of China under the Grant No. 2017YFE0135700 and the Bulgarian National Science Fund (BNSF) under the Grant No. KП-06-ИП-KИTAЙ/1 (KP-06-IP-CHINA/1).

Data Availability Statement

Not applicable.

Conflicts of Interest

The authors declare no conflict of interest.

References

  1. Slatore, C.; Lareau, S.C.; Fahy, B. Staging of Lung Cancer. Am. J. Respir. Crit. Care Med. 2022, 205, P17–P19. [Google Scholar] [CrossRef] [PubMed]
  2. Nishino, M.; Schiebler, M.L. Advances in Thoracic Imaging: Key Developments in the Past Decade and Future Directions. Radiology 2023, 306, 222536. [Google Scholar] [CrossRef] [PubMed]
  3. Lee, J.H.; Lee, D.; Lu, M.T.; Raghu, V.K.; Park, C.M.; Goo, J.M.; Choi, S.H.; Kim, H. Deep learning to optimize candidate selection for lung cancer CT screening: Advancing the 2021 USPSTF recommendations. Radiology 2022, 305, 209–218. [Google Scholar] [CrossRef]
  4. Zhang, T.; Wang, K.; Cui, H.; Jin, Q.; Cheng, P.; Nakaguchi, T.; Li, C.; Ning, Z.; Wang, L.; Xuan, P. Topological structure and global features enhanced graph reasoning model for non-small cell lung cancer segmentation from CT. Phys. Med. Biol. 2023, 68, 025007. [Google Scholar] [CrossRef]
  5. Lin, J.; Yu, Y.; Zhang, X.; Wang, Z.; Li, S. Classification of Histological Types and Stages in Non-small Cell Lung Cancer Using Radiomic Features Based on CT Images. J. Digit. Imaging 2023, 1–9. [Google Scholar] [CrossRef] [PubMed]
  6. Sugawara, H.; Yatabe, Y.; Watanabe, H.; Akai, H.; Abe, O.; Watanabe, S.-I.; Kusumoto, M. Radiological precursor lesions of lung squamous cell carcinoma: Early progression patterns and divergent volume doubling time between hilar and peripheral zones. Lung Cancer 2023, 176, 31–37. [Google Scholar] [CrossRef]
  7. Halder, A.; Dey, D.; Sadhu, A.K. Lung nodule detection from feature engineering to deep learning in thoracic CT images: A comprehensive review. J. Digit. Imaging 2020, 33, 655–677. [Google Scholar] [CrossRef]
  8. Huang, S.; Yang, J.; Shen, N.; Xu, Q.; Zhao, Q. Artificial intelligence in lung cancer diagnosis and prognosis: Current application and future perspective. Semin. Cancer Biol. 2023, 89, 30–37. [Google Scholar] [CrossRef]
  9. Mousavi, Z.; Rezaii, T.Y.; Sheykhivand, S.; Farzamnia, A.; Razavi, S. Deep convolutional neural network for classification of sleep stages from single-channel EEG signals. J. Neurosci. Methods 2019, 324, 108312. [Google Scholar] [CrossRef]
  10. Gong, J.; Liu, J.; Hao, W.; Nie, S.; Zheng, B.; Wang, S.; Peng, W. A deep residual learning network for predicting lung adenocarcinoma manifesting as ground-glass nodule on CT images. Eur. Radiol. 2020, 30, 1847–1855. [Google Scholar] [CrossRef]
  11. Mei, J.; Cheng, M.M.; Xu, G.; Wan, L.R.; Zhang, H. SANet: A Slice-Aware Network for Pulmonary Nodule Detection. IEEE Trans. Pattern Anal. Mach. Intell. 2022, 44, 4374–4387. [Google Scholar] [CrossRef] [PubMed]
  12. Xu, R.; Liu, Z.; Luo, Y.; Hu, H.; Shen, L.; Du, B.; Kuang, K.; Yang, J. SGDA: Towards 3D Universal Pulmonary Nodule Detection via Slice Grouped Domain Attention. IEEE/ACM Trans. Comput. Biol. Bioinform. 2023, 1–13. [Google Scholar] [CrossRef]
  13. Su, A.; PP, F.R.; Abraham, A.; Stephen, D. Deep Learning-Based BoVW–CRNN Model for Lung Tumor Detection in Nano-Segmented CT Images. Electronics 2023, 12, 14. [Google Scholar] [CrossRef]
  14. Mousavi, Z.; Shahini, N.; Sheykhivand, S.; Mojtahedi, S.; Arshadi, A. COVID-19 detection using chest X-ray images based on a developed deep neural network. SLAS Technol. 2022, 27, 63–75. [Google Scholar] [CrossRef] [PubMed]
  15. Mei, S.; Jiang, H.; Ma, L. YOLO-lung: A Practical Detector Based on Imporved YOLOv4 for Pulmonary Nodule Detection. In Proceedings of the 2021 14th International Congress on Image and Signal Processing, BioMedical Engineering and Informatics (CISP-BMEI), Shanghai, China, 23–25 October 2021; pp. 1–6. [Google Scholar]
  16. Causey, J.; Li, K.; Chen, X.; Dong, W.; Huang, X. Spatial Pyramid Pooling with 3D Convolution Improves Lung Cancer Detection. IEEE/ACM Trans. Comput. Biol. Bioinform. 2020, 19, 1165–1172. [Google Scholar] [CrossRef] [PubMed]
  17. Guo, Z.; Zhao, L.; Yuan, J.; Yu, H. MSANet: Multiscale Aggregation Network Integrating Spatial and Channel Information for Lung Nodule Detection. IEEE J. Biomed. Health Inform. 2022, 26, 2547–2558. [Google Scholar] [CrossRef]
  18. Guo, N.; Bai, Z. Multi-scale Pulmonary Nodule Detection by Fusion of Cascade R-CNN and FPN. In Proceedings of the 2021 International Conference on Computer Communication and Artificial Intelligence (CCAI), Guangzhou, China, 7–9 May 2021; pp. 15–19. [Google Scholar]
  19. Yan, C.-M.; Wang, C. Automatic Detection and Localization of Pulmonary Nodules in CT Images Based on YOLOv5. J. Comput. 2022, 33, 113–123. [Google Scholar] [CrossRef]
  20. Zhong, G.; Ding, W.; Chen, L.; Wang, Y.; Yu, Y.F. Multi-Scale Attention Generative Adversarial Network for Medical Image Enhancement. IEEE Trans. Emerg. Top. Comput. Intell. 2023, 1–13. [Google Scholar] [CrossRef]
  21. Wang, C.-Y.; Bochkovskiy, A.; Liao, H.-Y.M. YOLOv7: Trainable bag-of-freebies sets new state-of-the-art for real-time object detectors. arXiv 2022, arXiv:2207.02696. [Google Scholar]
  22. Ghiasi, G.; Lin, T.-Y.; Le, Q.V. Nas-fpn: Learning scalable feature pyramid architecture for object detection. In Proceedings of the IEEE/CVF Conference on Computer Vision and Pattern Recognition, Long Beach, CA, USA, 16–20 June 2019; pp. 7036–7045. [Google Scholar]
  23. Tan, M.; Pang, R.; Le, Q.V. Efficientdet: Scalable and efficient object detection. In Proceedings of the IEEE/CVF Conference on Computer Vision and Pattern Recognition, Virtual, 14–19 June 2020; pp. 10781–10790. [Google Scholar]
  24. Wang, P.; Chen, P.; Yuan, Y.; Liu, D.; Huang, Z.; Hou, X.; Cottrell, G. Understanding convolution for semantic segmentation. In Proceedings of the 2018 IEEE Winter Conference on Applications of Computer Vision (WACV), Lake Tahoe, NV, USA, 12–15 March 2018; pp. 1451–1460. [Google Scholar]
  25. Jocher, G.; Chaurasia, A.; Stoken, A.; Borovec, J.; Kwon, Y.; Michael, K.; Fang, J.; Yifu, Z.; Wong, C.; Montes, D.; et al. ultralytics/yolov5: v7.0—YOLOv5 SOTA Realtime Instance Segmentation; Zenodo: Geneva, Switzerland, 2022. [Google Scholar]
  26. Alsaedi, D.; El Badawe, M.; Ramahi, O.M. A Breast Cancer Detection System Using Metasurfaces With a Convolution Neural Network: A Feasibility Study. IEEE Trans. Microw. Theory Tech. 2022, 70, 3566–3576. [Google Scholar] [CrossRef]
  27. Fang, H.; Li, F.; Fu, H.; Sun, X.; Cao, X.; Lin, F.; Son, J.; Kim, S.; Quellec, G.; Matta, S.; et al. ADAM Challenge: Detecting Age-Related Macular Degeneration From Fundus Images. IEEE Trans. Med. Imaging 2022, 41, 2828–2847. [Google Scholar] [CrossRef]
  28. Wang, D.; Wang, X.; Wang, S.; Yin, Y. Explainable Multitask Shapley Explanation Networks for Real-time Polyp Diagnosis in Videos. IEEE Trans. Ind. Inform. 2022, 1–10. [Google Scholar] [CrossRef]
  29. Ahmed, I.; Chehri, A.; Jeon, G.; Piccialli, F. Automated pulmonary nodule classification and detection using deep learning architectures. IEEE/ACM Trans. Comput. Biol. Bioinform. 2022, 1–12. [Google Scholar] [CrossRef] [PubMed]
  30. Wu, H.; Zhao, Z.; Zhong, J.; Wang, W.; Wen, Z.; Qin, J. Polypseg+: A lightweight context-aware network for real-time polyp segmentation. IEEE Trans. Cybern. 2022, 53, 2610–2621. [Google Scholar] [CrossRef] [PubMed]
  31. Wu, X.; Sahoo, D.; Hoi, S.C. Recent advances in deep learning for object detection. Neurocomputing 2020, 396, 39–64. [Google Scholar] [CrossRef]
  32. Redmon, J.; Divvala, S.; Girshick, R.; Farhadi, A. You only look once: Unified, real-time object detection. In Proceedings of the IEEE Conference on Computer Vision and pattern Recognition, Las Vegas, NV, USA, 26 June–1 July 2016; pp. 779–788. [Google Scholar]
  33. Redmon, J.; Farhadi, A. YOLO9000: Better, faster, stronger. In Proceedings of the IEEE Conference on Computer Vision and Pattern Recognition, Honolulu, HI, USA, 21–26 July 2016; pp. 7263–7271. [Google Scholar]
  34. Redmon, J.; Farhadi, A. Yolov3: An incremental improvement. arXiv 2018, arXiv:1804.02767. [Google Scholar]
  35. Bochkovskiy, A.; Wang, C.-Y.; Liao, H.-Y.M. Yolov4: Optimal speed and accuracy of object detection. arXiv 2020, arXiv:2004.10934. [Google Scholar]
  36. Li, C.; Li, L.; Jiang, H.; Weng, K.; Geng, Y.; Li, L.; Ke, Z.; Li, Q.; Cheng, M.; Nie, W. YOLOv6: A single-stage object detection framework for industrial applications. arXiv 2022, arXiv:2209.02976. [Google Scholar]
  37. Gevorgyan, Z. SIoU loss: More powerful learning for bounding box regression. arXiv 2022, arXiv:2205.12740. [Google Scholar]
  38. Chen, L.C.; Papandreou, G.; Kokkinos, I.; Murphy, K.; Yuille, A.L. DeepLab: Semantic Image Segmentation with Deep Convolutional Nets, Atrous Convolution, and Fully Connected CRFs. IEEE Trans. Pattern Anal. Mach. Intell. 2018, 40, 834–848. [Google Scholar] [CrossRef]
  39. Lin, T.-Y.; Dollár, P.; Girshick, R.; He, K.; Hariharan, B.; Belongie, S. Feature pyramid networks for object detection. In Proceedings of the IEEE Conference on Computer Vision and Pattern Recognition, Honolulu, HI, USA, 21–26 July 2017; pp. 2117–2125. [Google Scholar]
  40. Liu, S.; Qi, L.; Qin, H.; Shi, J.; Jia, J. Path aggregation network for instance segmentation. In Proceedings of the IEEE Conference on Computer Vision and Pattern Recognition, Salt Lake City, UT, USA, 18–23 June 2018; pp. 8759–8768. [Google Scholar] [CrossRef]
  41. Qiao, S.; Chen, L.-C.; Yuille, A. Detectors: Detecting objects with recursive feature pyramid and switchable atrous convolution. In Proceedings of the IEEE/CVF Conference on Computer Vision and Pattern Recognition, Virtual, 19–25 June 2021; pp. 10213–10224. [Google Scholar]
  42. Liu, Y.; Li, H.; Cheng, J.; Chen, X. MSCAF-Net: A General Framework for Camouflaged Object Detection via Learning Multi-Scale Context-Aware Features. IEEE Trans. Circuits Syst. Video Technol. 2023, 1. [Google Scholar] [CrossRef]
  43. Liu, J.-J.; Hou, Q.; Cheng, M.-M.; Feng, J.; Jiang, J. A simple pooling-based design for real-time salient object detection. In Proceedings of the IEEE/CVF Conference on Computer Vision and Pattern Recognition, Long Beach, CA, USA, 16–20 June 2019; pp. 3917–3926. [Google Scholar]
  44. Xiang, W.; Mao, H.; Athitsos, V. ThunderNet: A turbo unified network for real-time semantic segmentation. In Proceedings of the 2019 IEEE Winter Conference on Applications of Computer Vision (WACV), Waikoloa Village, HI, USA, 7–11 January 2019; pp. 1789–1796. [Google Scholar]
  45. Xu, L.; Xue, H.; Bennamoun, M.; Boussaid, F.; Sohel, F. Atrous convolutional feature network for weakly supervised semantic segmentation. Neurocomputing 2021, 421, 115–126. [Google Scholar] [CrossRef]
  46. Liu, J.; Yang, D.; Hu, F. Multiscale object detection in remote sensing images combined with multi-receptive-field features and relation-connected attention. Remote Sens. 2022, 14, 427. [Google Scholar] [CrossRef]
  47. Guo, C.; Fan, B.; Zhang, Q.; Xiang, S.; Pan, C. Augfpn: Improving multi-scale feature learning for object detection. In Proceedings of the IEEE/CVF Conference on Computer Vision and Pattern Recognition, Virtual, 14–19 June 2020; pp. 12595–12604. [Google Scholar]
  48. Bhattacharjee, A.; Murugan, R.; Goel, T.; Mirjalili, S. Pulmonary nodule segmentation framework based on fine-tuned and pre-trained deep neural network using CT images. IEEE Trans. Radiat. Plasma Med. Sci. 2023, 7, 394–409. [Google Scholar] [CrossRef]
  49. Ezhilraja, K.; Shanmugavadivu, P. Contrast Enhancement of Lung CT Scan Images using Multi-Level Modified Dualistic Sub-Image Histogram Equalization. In Proceedings of the 2022 International Conference on Automation, Computing and Renewable Systems (ICACRS), Pudukkottai, India, 13–15 December 2022; pp. 1009–1014. [Google Scholar]
  50. Chen, L.-C.; Papandreou, G.; Schroff, F.; Adam, H. Rethinking atrous convolution for semantic image segmentation. arXiv 2017, arXiv:1706.05587. [Google Scholar]
  51. Li, P.; Wang, S.; Li, T.; Lu, J.; HuangFu, Y.; Wang, D. A large-scale CT and PET/CT dataset for lung cancer diagnosis [dataset]. Cancer Imaging Arch. 2020. [Google Scholar] [CrossRef]
  52. Mustafa, B.; Loh, A.; Freyberg, J.; MacWilliams, P.; Wilson, M.; McKinney, S.M.; Sieniek, M.; Winkens, J.; Liu, Y.; Bui, P. Supervised transfer learning at scale for medical imaging. arXiv 2021, arXiv:2101.05913. [Google Scholar]
  53. Zheng, Z.; Wang, P.; Liu, W.; Li, J.; Ye, R.; Ren, D. Distance-IoU loss: Faster and better learning for bounding box regression. In Proceedings of the AAAI Conference on Artificial Intelligence, vol.34, New York, NY, USA, 7–12 February 2020; pp. 12993–13000. [Google Scholar] [CrossRef]
  54. Wang, C.; Sun, S.; Zhao, C.; Mao, Z.; Wu, H.; Teng, G. A Detection Model for Cucumber Root-Knot Nematodes Based on Modified YOLOv5-CMS. Agronomy 2022, 12, 2555. [Google Scholar] [CrossRef]
  55. Alamro, W.; Seet, B.-C.; Wang, L.; Parthiban, P. Early-Stage Lung Tumor Detection based on Super-Wideband Microwave Reflectometry. Electronics 2023, 12, 36. [Google Scholar] [CrossRef]
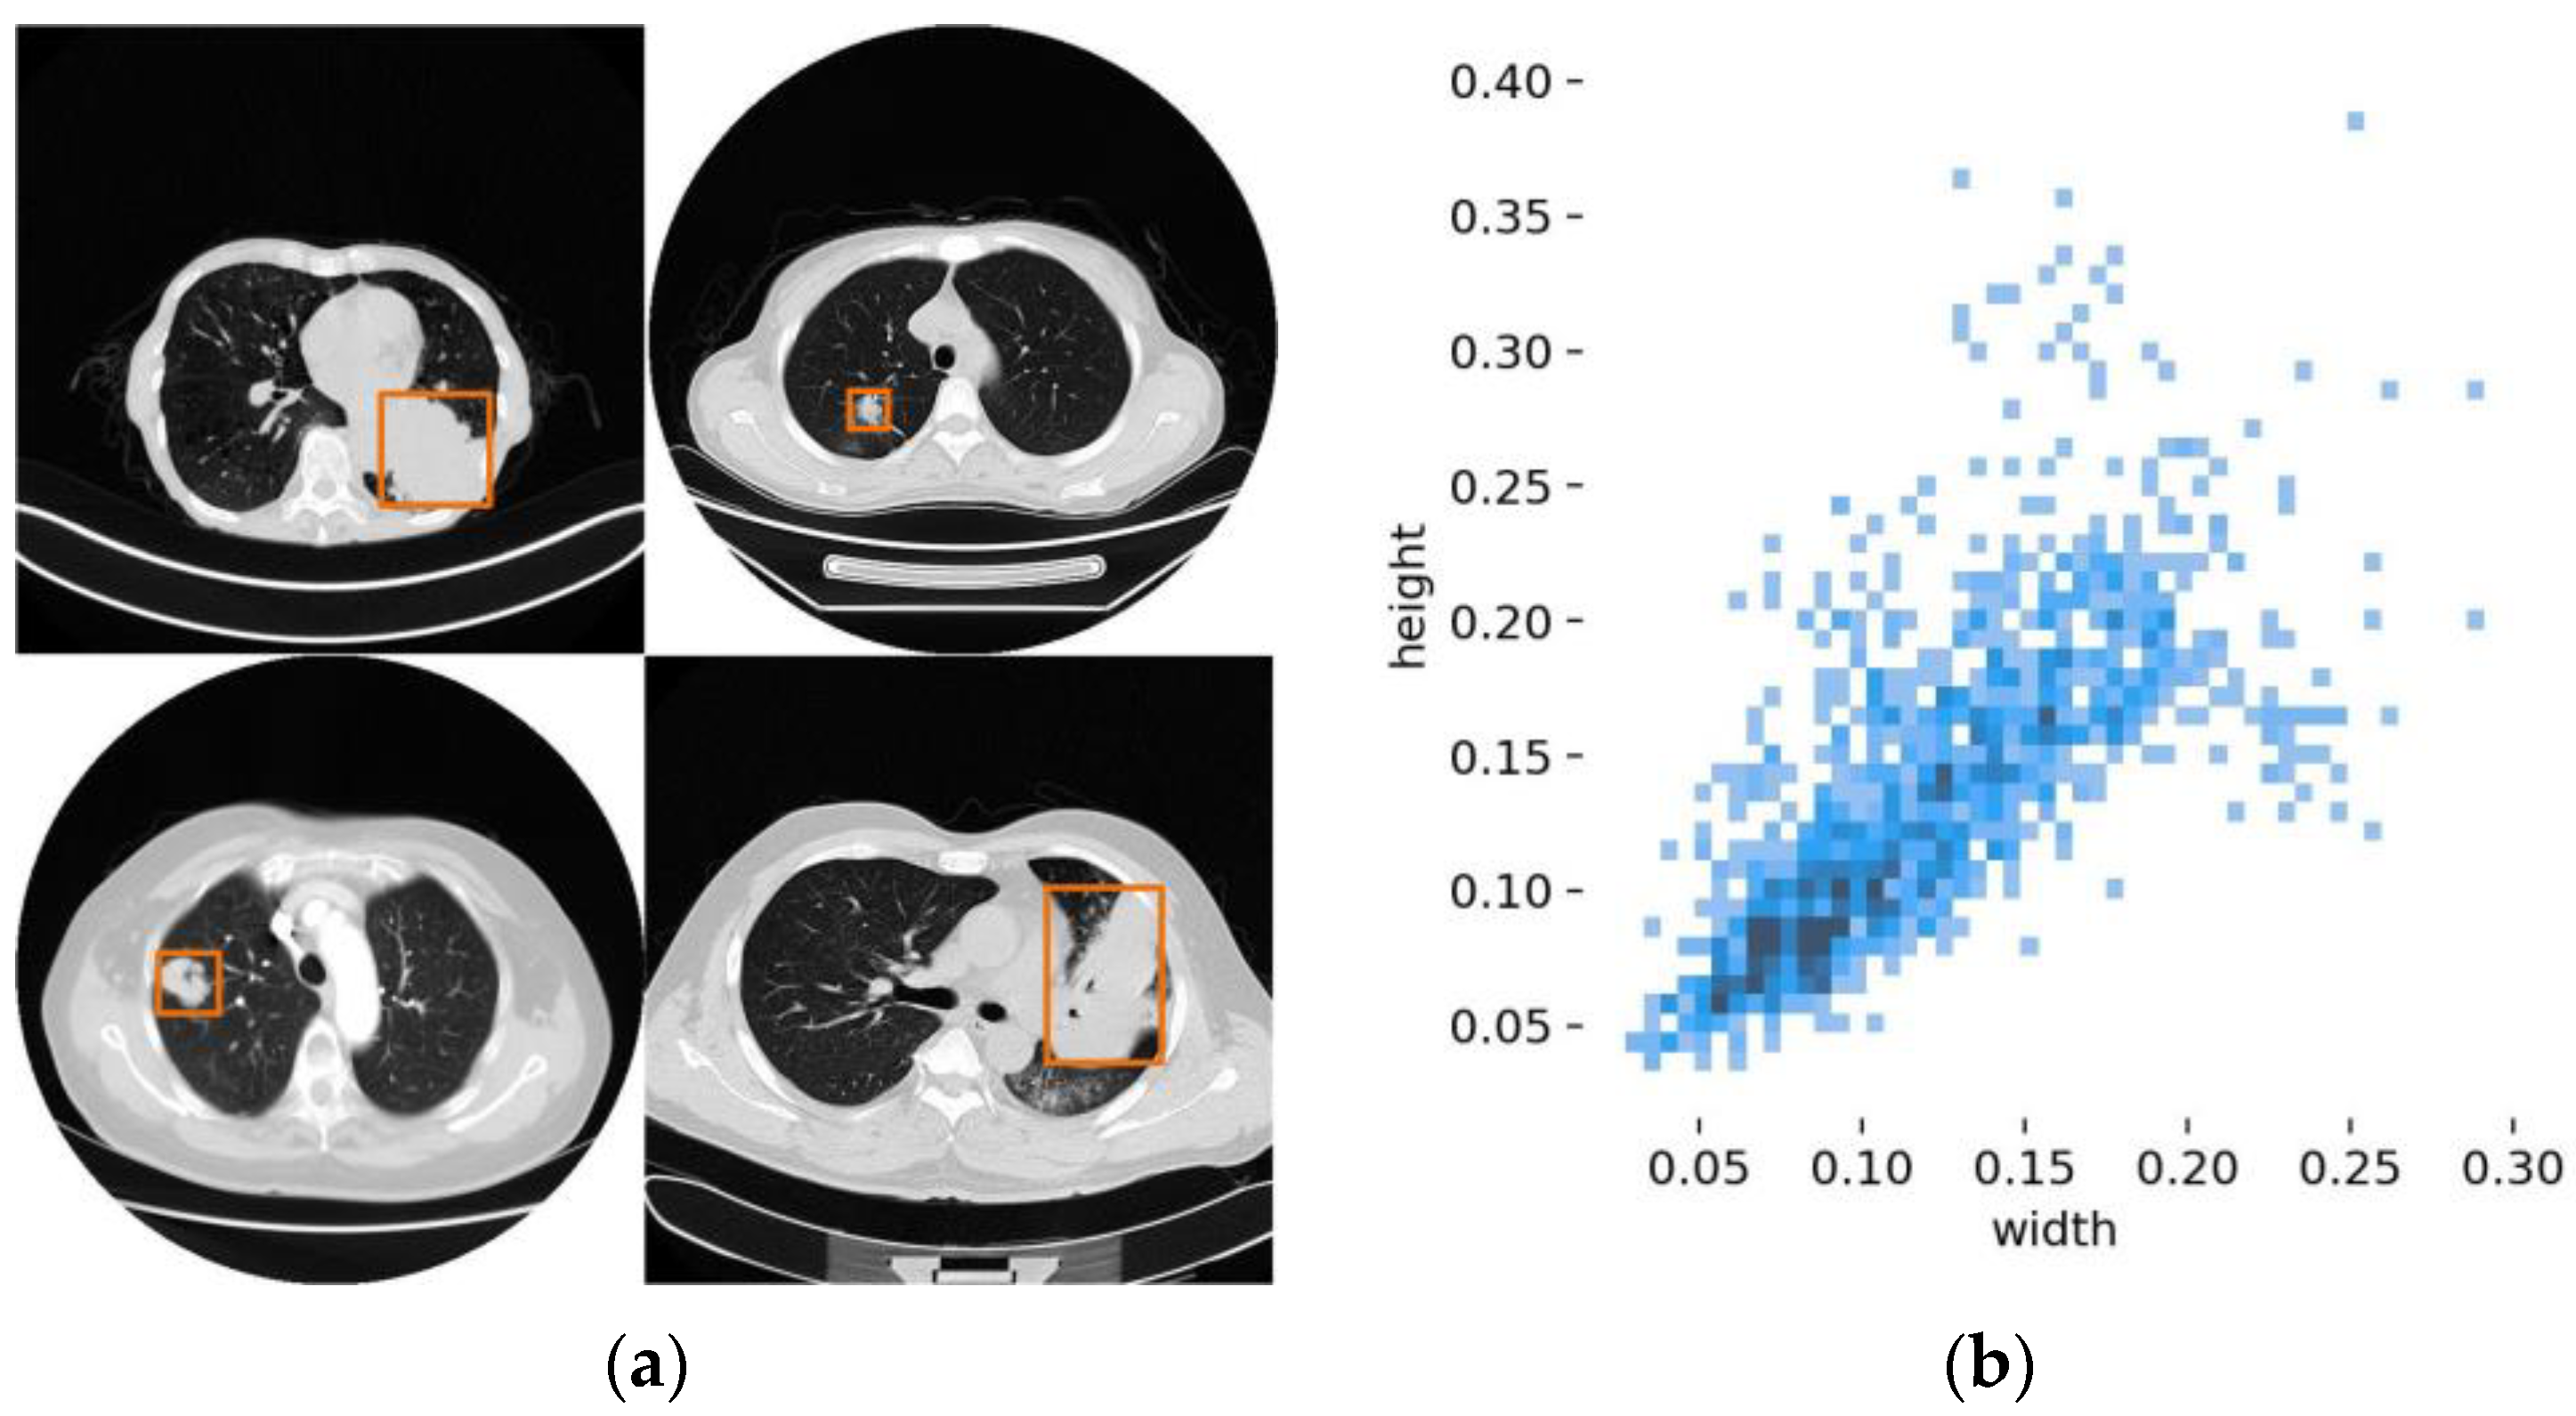
Figure 1. (a) Sample CT chest images of four patients with lung cancer showing round or irregular masses of different size with uniform or nonuniform density; (b) tumor size distribution in the dataset, used in the experiments presented further in this paper (the tumor sizes are highly variable, making it difficult to accurately locate and classify tumors).
Mathematics 11 02344 g001
Figure 2. The SPPF module structure.
Mathematics 11 02344 g002
Figure 3. The E-ELAN module structure.
Mathematics 11 02344 g003
Figure 4. A high-level structure of the proposed ELCT-YOLO model (SRFEM is used for all CRSs as it enables achieving the best results, c.f., Section 4.5).
Mathematics 11 02344 g004
Figure 5. The SRFEM structure.
Mathematics 11 02344 g005
Figure 6. The PRFEM structure.
Mathematics 11 02344 g006
Figure 7. Tumor targets under different receptive fields. Matching small receptive fields with large tumors may lead to inaccurate results for network classification (bottom-left image), and matching large receptive fields with small tumors may cause the network to focus more on background information and ignore small-sized tumors (top-right image).
Mathematics 11 02344 g007
Figure 8. The image pre-processing operation flow.
Mathematics 11 02344 g008
Figure 9. The mAP variation curves during the ELCT-YOLO training.
Mathematics 11 02344 g009
Figure 10. The loss curves during the ELCT-YOLO training.
Mathematics 11 02344 g010
Figure 11. The loss curves during the ELCT-YOLO validation.
Mathematics 11 02344 g011
Figure 12. Sample images, extracted from the test set, with lung tumors detection results (label A represents adenocarcinoma, whereas label B represents small cell carcinoma). For irregular tumors with patchy heightened shadows or tumors with obvious pleural traction, EACT-YOLO can effectively reduce the interference of background information and distinguish the tumor target from the background.
Mathematics 11 02344 g012
Figure 13. The effective receptive fields generated by different dilation rates in the SSS cascade scheme: (a) R N S = ( 1,2 , 3 ) ; (b) R E S = ( 2,4 , 6 ) ; (c) R O S = ( 1,3 , 5 ) . The colors depicted at distinct positions within the graphs indicate the frequency at which each location was utilized in computing the receptive field center.
Mathematics 11 02344 g013
Table 1. Performance comparison of models used for lung tumor detection in CT images (the best value achieved among the models for a particular metric is shown in bold).
ModelP R mAP FPSSize (MB)
YOLOv30.9300.9250.95263117.0
YOLOv50.9490.9230.96112517.6
YOLOv7-tiny0.9010.9340.95116111.8
YOLOv80.9670.9390.97711521.4
SSD0.8780.8330.90695182.0
Faster R-CNN0.9030.8910.92528315.0
ELCT-YOLO0.9230.9510.97415911.4
Table 2. Results of the ablation study performed on YOLOv7-tiny performance improvement components, used by ELCT-YOLO (the best mAP and size values achieved are shown in bold).
No.SPPFDENeckCRSmAP Size (MB)
1 0.95512.0
2 0.95811.2
3 0.96811.2
4 0.96612.6
50.97411.4
Table 3. Performance comparison of different cascade schemes (the best value achieved among the schemes for a particular metric is shown in bold).
SchemeP R mAP
PPP0.9610.9290.965
SPP0.9770.8930.969
SSP0.9580.9240.969
SSS0.9210.9570.974
Table 4. Performance comparison of using different dilation rates in the SSS cascade scheme (the best value achieved among the dilation rates for a particular metric is shown in bold).
Dilation RateP R mAP
R N S = (1,2,3)0.9380.9230.958
R O S = (1,3,5)0.9690.9330.967
R E S = (2,4,6)0.9540.9210.961
Table 5. Comparisons between DENeck and traditional feature fusion methods (the best value achieved among the methods for a particular metric is shown in bold).
MethodmAP Size (MB)
FPN0.95714.6
PANet0.96311.7
BiFPN0.96711.2
DENeck0.97111.3
Table 6. Performance comparison of combining different scale networks with the designed DENeck structure (the best value achieved among the networks for a particular metric is shown in bold).
NetworkmAP Size (MB)
YOLOv7-tiny’s0.96511.4
YOLOv7’s0.96770.4
YOLOv7x’s0.971128.6
Disclaimer/Publisher’s Note: The statements, opinions and data contained in all publications are solely those of the individual author(s) and contributor(s) and not of MDPI and/or the editor(s). MDPI and/or the editor(s) disclaim responsibility for any injury to people or property resulting from any ideas, methods, instructions or products referred to in the content.