1. Introduction
The IoV, is an open, convergent network system that encourages collaboration between people, vehicles, and the environment [
1,
2]. With the help of vehicular ad hoc networks (VANET), cloud computing, and multi-agent systems (MAS), this hybrid paradigm plays a crucial role in developing an intelligent transportation system that is both cooperative and effective [
3]. The presence of an anomaly detection system in the IoV is essential in today’s uncertain world for the sake of data validity and safety. When it comes to critical safety data analysis, the cost of real-time anomaly detection of all data in a data package must be considered [
4].
IoV consists of three layers:
- 1.
Experimental and control layers.
- 2.
Computing layers.
- 3.
Application layers.
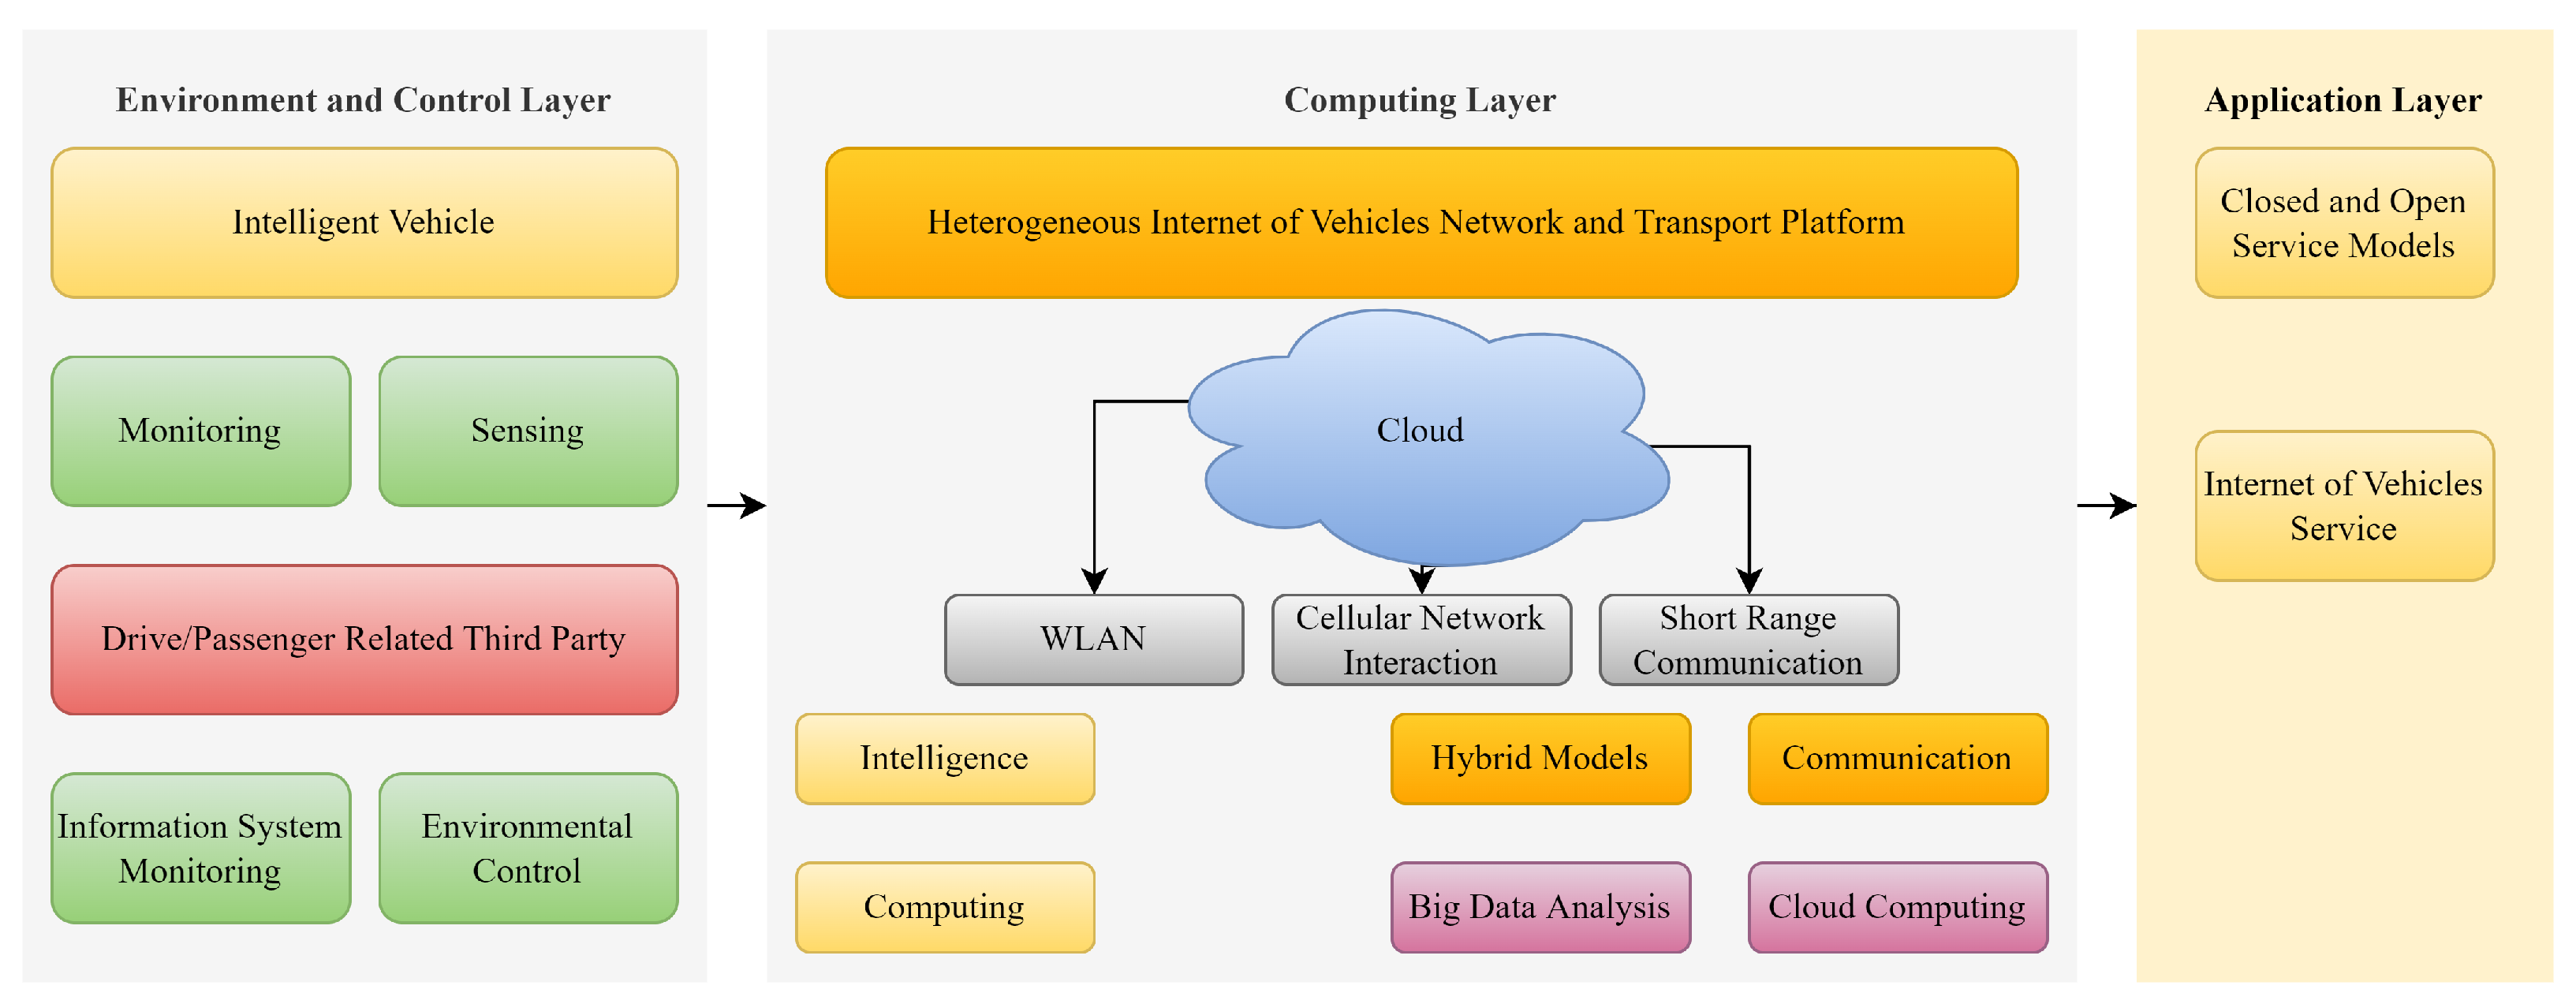
In the experimental and control layers, the vehicle is controlled and monitored according to sensed data and information from its environment. In the computing layer, vehicles communicate with the help of WLAN, cellular (4G/5G), and short-range wireless networks [
5]. In the application layer, closed and open service models, or IoVs, are present. Key components of an IoV system are shown in
Figure 1.
Unlike the internet’s specific data security preventive techniques, the IoV data security issues start from internal and external factors [
6,
7]. The lack of a reliable data verification mechanism in automobiles, such as the Controller Area Network (CAN) protocol, is one way that vehicles’ internal safety problems are reflected in existing internet communication protocols. The open architecture of IoV and widespread use make data breaches more difficult to defend against cyber-attacks [
8]. An autonomous vehicle anomaly detection system is the subject of this paper. IoVs are unprecedented and vulnerable when backed by a dynamic and uncertain network [
9].
Human safety and property can be jeopardized by malicious assaults and data tampering as well as system breakdowns [
10].
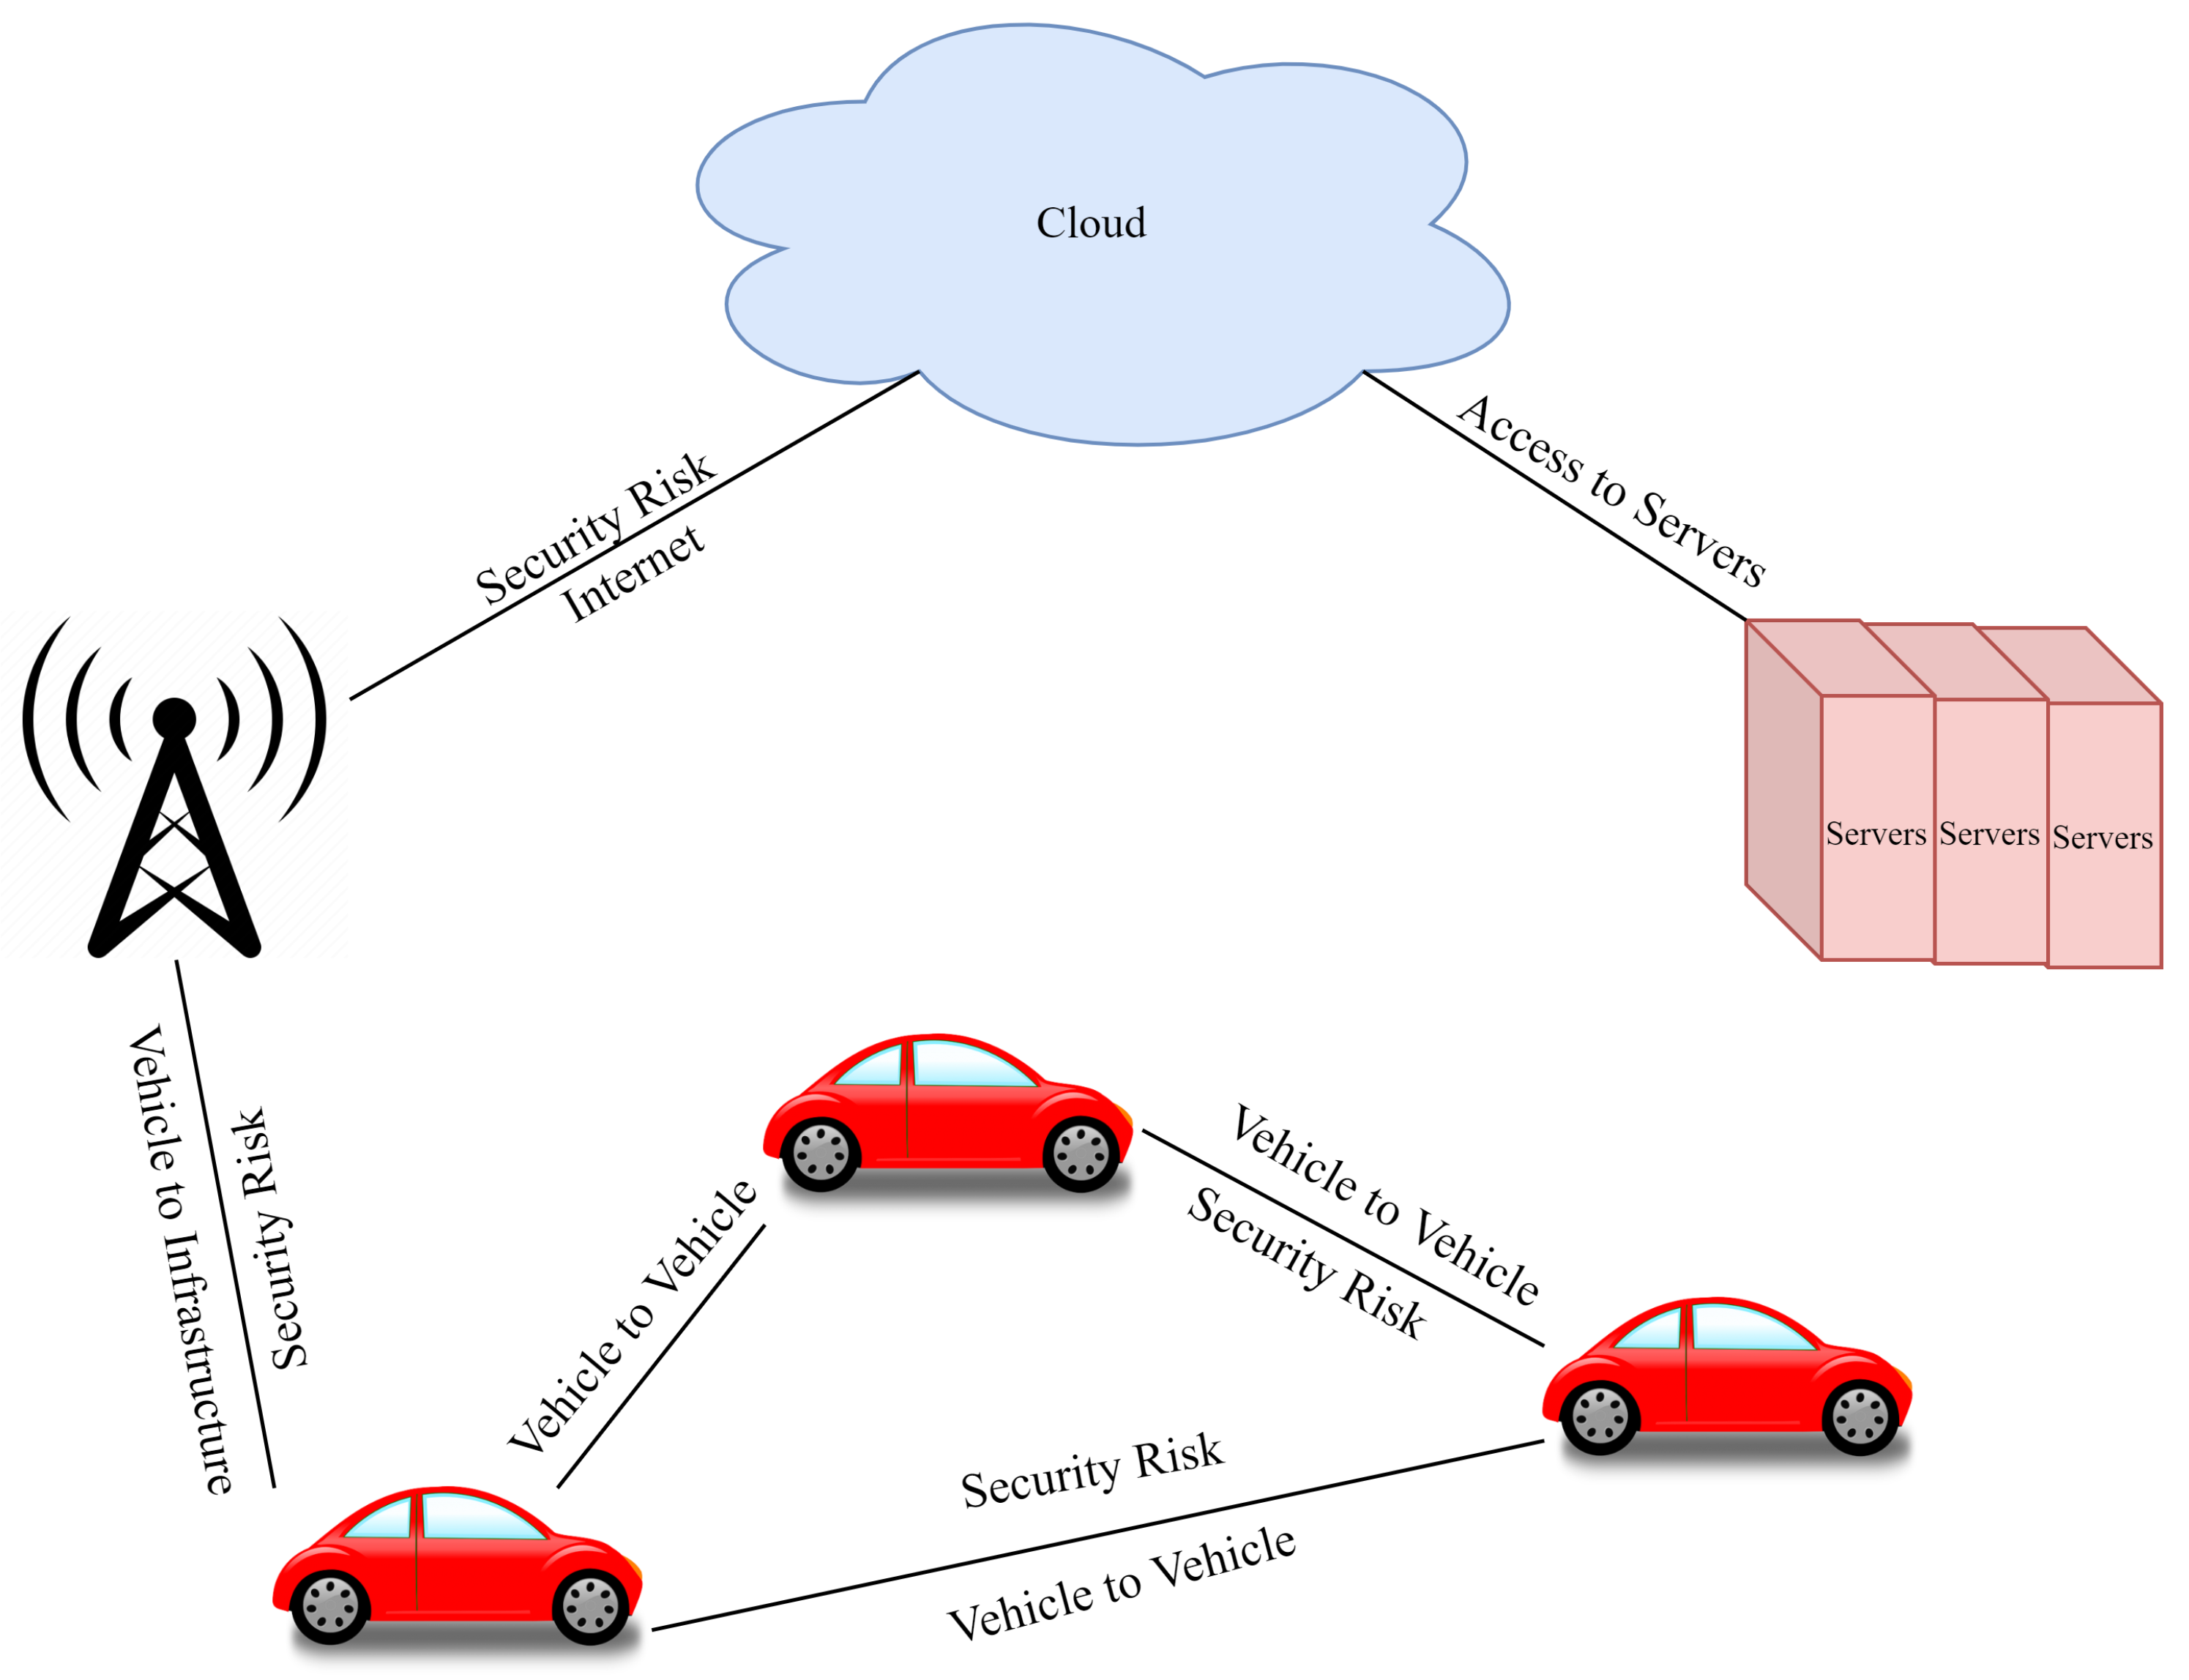
Figure 2 shows the possible security risks in an IoV system. Vehicle-to-vehicle (V2V) communication is the first risk, where data can be attacked with an attacker and can cause harm to drivers. At the same time, a second security risk can be generated in the vehicle-to-infrastructure (V2I) communication scenario.
Numerous concerns have been raised about the privacy and security of intelligent vehicles and intelligent transportation networks due to multiple attack models for intelligent vehicles [
10]. Cyber attackers might jam and spoof the signal of the VANET communication network, which raises serious security problems [
11]. This could cause the entire V2X system to be impacted by misleading signaling and signal delays to ensure that the message conveyed is corrupted and does not fulfill its intended aims [
12].
The internet or physical access to a linked vehicle’s intelligence system is another security danger that intelligent automobiles encounter. In 2016, security professionals Charlie Miller and Chris Valasek, for example, wirelessly hacked the Jeep Cherokee’s intelligence system [
13], while the Jeep Cherokee’s driver was still behind the wheel, researchers Miller and Valasek compromised the entertainment system, steering and brakes, and air conditioning system to show that the Jeep’s intelligence system had security vulnerabilities. The Nissan Leaf’s companion app was abused by cybercriminals utilizing the vehicle’s unique identification number, which is generally displayed on the windows. Hackers were able to gain control of the HVAC system thanks to this flaw [
14].
IoV’s growth has been bolstered by embedded systems, hardware and software enhancements, and networking devices. However, there are still several dangers in the IoV, including security, accuracy, performance, networks, and privacy. Many security and privacy concerns have arisen due to the rising usage of intelligent services, remote access, and frequent network modifications. As a result, security vulnerabilities in IoV data transfer are a significant concern. Therefore, clustering [
15,
16] and deep-learning algorithms and approaches [
17,
18,
19] can be used to handle network and security issues relating to the IoV. As part of this study, the security standards for IoV applications are outlined to improve network and user services efficiency. Denial of Service (DoS) assaults are detected using a novel model, xNN. The motivations of this study are:
To propose a deep-learning model for detecting an anomaly in a vehicular network.
To present a comprehensive framework to prepare network traffic data for IDS development.
To propose an averaging feature selection method using K-Means clustering to improve the efficiency of the proposed IDS and to perform an analysis of network attributes and attacks for network monitoring uses.
2. Related Work
2.1. Anomaly Detection Systems
The safety of IoV’s users is a significant concern. In the event of an infiltration attack on IoV system, hackers could gain direct control of vehicles, resulting in traffic accidents. Previously, many studies have been conducted on improving security for vehicular networks. To detect both known and unknown assaults on automotive networks, a multi-tiered hybrid IDS that integrates IDS with a signature and IDS with an anomaly was presented by Yang et al. [
1]. The suggested system can detect several known assaults with 99.99% accuracy and 99.88% accuracy on the CICIDS2017 dataset, representing the CAN-intrusion-dataset’s external vehicular network data.
The suggested system has strong F1 scores of 0.963 and 0.800 on both datasets above when it comes to zero-day attack detection. Intrusion detection networks, IDS design, and the limitations and characteristics of an IOV network were explored by Wu et al. [
3]. The IDS designs for IOV networks were discussed in detail, and a wide range of optimization targets were investigated and thoroughly analyzed in that study. Vehicular ad hoc networks (VANETs) provide wireless communication between cars and infrastructures. Connected vehicles may help intelligent cities and Intelligent Transportation Systems (ITS). VANET’s primary goals are to reduce travel time and improve driver safety, comfort, and productivity. VANET is distinct from other ad hoc networks due to its extreme mobility. However, the lack of centralized infrastructure exposes it to several security flaws.
This poses a serious threat to road traffic safety. CAN is a protocol for reliable and efficient communication between in-vehicle parts. The CAN bus does not contain source or destination information; therefore, messages cannot be verified as they transit between nodes. An attacker can easily insert any message and cause system issues. Alshammari et al. [
4] presented KNN and SVM techniques for grouping and categorizing VANET intrusions. The offset ratio and time gap between the CAN message request and answer were examined to detect intrusions.
2.2. Machine-Learning-Based Models
A data-driven IDS was designed by evaluating the link load behavior of the Roadside Unit (RSU) in the Internet of Things (IoT) against various assaults that cause traffic flow irregularities. An intrusion targeting RSUs can be detected using a deep-learning architecture based on a Convolutional Neural Network (CNN). The proposed architecture [
5] uses a standard CNN and a basic error term based on the backpropagation algorithm’s convergence. In the meantime, the suggested CNN-based deep architecture’s probabilistic representation provides a theoretical analysis of convergence.
An IoV system must efficiently manage traffic, re-configure, and secure streaming data. Software-defined networks (SDN) provide network flexibility and control. However, these can attract hostile agents. The author’s technique uses probabilistic data structures to detect aberrant IoV behaviour. Count-Min-Sketch is used to find suggestive nodes. Phase II uses Bloom filter-based control to check questionable nodes’ signatures. Phase 3 uses a Quotient filter to store risky nodes quickly. To detect super points (malicious hosts connecting to several destinations), author counted the flows across each switch in phase 4. This was tested using a computer simulation. The proposed method of Garg et al. [
7] outperformed the current standard in terms of detection ratios and false-positive rates.
In a generic threat model, an attacker can access the CAN bus utilising common access points. Xiao et al. [
8] presented an in-vehicle network anomaly detection framework based on SIMATT and SECCU symmetry. To obtain state-of-the-art anomaly detection performance, SECCU and SIMATT are integrated. The authors want to reduce the computing overhead in training and detection stages. The SECCU and SIMATT models now have only one layer of 500 cells each, thus, reducing computing expenses. Numerous SIMATT-SECCU architectures evaluations have shown near-optimal accuracy and recall rates (with other traditional algorithms, such as LSTM, GRU, GIDS, RNN, or their derivatives) [
20,
21].
2.3. Anomaly Detection Based Driving Patterns
The Anomaly Detection Based on the Driver’s Emotional State (EAD) algorithm was proposed by Ding et al. [
9] to achieve the real-time detection of data related to safe driving in a cooperative vehicular network. A driver’s emotional quantification model was defined in this research, which was used to characterize the driver’s driving style in the first place. Second, the data anomaly detection technique was built using the Gaussian Mixed Model (GMM) based on the emotion quantization model and vehicle driving status information. Finally, the authors performed extensive experiments on a real data set (NGSIM) to demonstrate the EAD algorithm’s high performance in combination with the application scenarios of cooperative vehicular networks.
With the IoV cloud providing a tiny amount of labelled data for a novel assault, Li et al. [
10] suggested two model updating approaches. Cloud-assisted updates from the IoV can give a tiny quantity of data. Using the local update technique prevents the IoV cloud from sending labelled data promptly. This research shows that pre-labelled data can be leveraged to derive the pseudo label of unlabelled data in new assaults. A vehicle can update without obtaining labelled data from the IoV cloud. Schemes proposed by Li et al. improved the detection accuracy by 23% over conventional methods.
Connected vehicle cybersecurity and safety have been addressed using anomaly detection techniques. Prior research in this field is categorised according to Rajbahadur et al.’s [
11] proposed taxonomy. There are nine main categories and 38 subcategories in the author’s proposed taxonomy. Researchers found that real-world data is rarely used, and rather most results are derived from simulations; V2I and in-vehicle communication are not considered together; proposed techniques seldom compare to a baseline; and the safety of the vehicles is not given as much attention as cybersecurity.
Maintaining a safe and intelligent transportation system necessitates avoiding routes that are prone to accidents. With the help of crowd sourcing and historical accident data, intelligent navigation systems can help drivers avoid dangerous driving conditions (such as snowy roads and rain-slicked road areas). Using crowd-sourced data, such as images, sensor readings, and so on, a vehicle cloud can compute such safe routes and react faster than a centralised service. The security and privacy for each data owner must be ensured in the intelligent routing. Additionally, crowd sourced data needs to be verified in the vehicle cloud before being used. Joy et al. [
12] investigated ways to ensure that vehicular clouds are secure, private, and protected against intrusion.
Over the past few years, the complexity and connectivity of today’s automobiles has steadily increased. There has been a massive increase in the security risks for in-vehicle networks and the components in the context of this development. In addition to putting the driver and other road users at risk, these attacks can compromise the vehicle’s critical safety systems. The detection of anomalies in automobile in-vehicle networks is discussed by Müter et al. [
13]. A set of anomaly detection sensors was introduced based on the characteristics of typical vehicular networks, such as the CAN. These sensors allow the detection of attacks during vehicle operation without causing false positives. A vehicle attack detection system is also described and discussed in terms of its design and application criteria.
2.4. Distributed Anomaly Detection System
Negi et al. [
14] proposed a framework for a distributed anomaly detection system that incorporates an online new data selection algorithm that directs retraining and modifies the model parameters as needed for self-driving and connected cars. Offline training of the LSTM model over many machines in a distributed manner using all available data is part of the framework’s implementation. Anomaly detection occurs at the vehicle level using the trained parameters and is then sent to the individual vehicles. A more complex LSTM anomaly detection model is used, and the proposed distributed framework’s accuracy in detecting anomalies is improved using the MXnet framework, which is used to test the framework’s performance.
Sakiyama et al. [
22] offered filter banks defined by a sum of sinusoidal waves in the graph spectral domain. These filter banks have low approximation errors even when using a lower-order shifted Chebyshev polynomial approximation. Their parameters can be efficiently obtained from any real-valued linear phase finite impulse response filter banks regularly. The author’s proposed frequency-domain filter bank design has the same characteristics as a classical filter bank. The approximation precision determines the approximation orders. Many spectral graph wavelets and filter banks exist to test the author’s techniques.
For autonomous and connected automobiles, securing vehicles is a top priority in light of the Jeep Cherokee incident of 2015, in which the vehicle was illegally controlled remotely by spoofing messages that were placed on the public mobile network. Security solutions for each unknown cyberattack involve the timely identification of attacks that occur throughout time in the vehicles’ lifespan. Sporking communications at the central gateway can be detected using IDS as described by Hamada et al. [
23]. Using communications from a real-world in-vehicle network, the author also reported on the system’s detection performance.
2.5. Ad Hoc Vehicle Network Intrusion Detection System
Ad hoc vehicle networks are evolving into the Internet of Automobiles as the Internet of Things (IoT) takes hold of the IoV. The IoV can attract a large number of businesses and researchers due to the rapid advancement of computing and communication technologies. Using an abstract model of the IoTs, Yang et al. [
24] provided an overview of the technologies needed to build the IoV, examined many IoV-related applications, and provided some open research challenges and descriptions of necessary future research in the IoV field.
Future Automated and Connected Vehicles (CAVs), or ITS, will form a highly interconnected network. City traffic flows can only be coordinated if vehicles are connected via the Internet of Vehicles (herein the Internet of CAVs). It will be possible to monitor and regulate CAVs using anonymized CAV mobility data. To ensure safe and secure operations, the early detection of anomalies is crucial. Wang et al. [
25] proposed an unsupervised learning technique based on a deep autoencoder to detect CAV self-reported location abnormalities. Quantitative investigations on simulated datasets show that the proposed approach worked well in detecting self-reported location anomalies.
As real-time anomaly detection on complete data packages is expensive, Ding et al. [
26] concentrated on crucial safety data analysis. The traffic cellular automata model was used for preprocessing to obtain optimal anomaly detection with minimal computer resources. An algorithm can discover irregularities in data related to safe driving in real time and online by modelling the driver’s driving style. Starting with a driving style quantization model that describes a driver’s driving style as a driving coefficient, then a Gaussian mixture model is used to detect data anomalies based on the driving style quantization and vehicle driving state (GMM). Finally, this study evaluated the suggested ADD algorithm’s performance in IoV applications using real and simulated data.
In our study, authors summarized the research on anomaly detection. Authors categorised existing techniques into groups based on their core approach. Chandola et al. [
27] created key assumptions for each category to distinguish normal from deviant behaviour. A few assumptions can be used to recommend testing a technique’s efficacy in a specific domain. Using a basic anomaly detection technique, the authors showed how the existing techniques are all variations of the same technique. This template makes categorising and remembering techniques in each area easier. Each technique’s pros and cons are listed separately. The authors also looked at the strategies’ computing complexity, which is important in real-world applications. This study aims to better understand how strategies developed for one field can be applied to other fields. Authors hope the survey’s results are useful.
The In-Vehicle Anomaly Detection Engine is a machine-learning-based intrusion detection technology developed by Araujo et al. [
28]. The system monitors vehicle mobility data using Cooperative Awareness Messages (CAMs), which are delivered between cars and infrastructure via V2V and V2I networks (such as position, speed, and direction). The IVADE Lane Keeping Assistance system uses an ECU for signal measurement and control computations on a CAN bus (LKAS). To implement machine learning in IVADE, you need CAN message fields, automotive domain-specific knowledge about dynamic system behaviour, and decision trees. The simulation results suggest that IVADE may detect irregularities in in-vehicle applications, therefore, aiding safety functions.
2.6. In-Vehicle Network Intrusion Detection
A remote wireless attack on an in-vehicle network is possible with 5G and the Internet of Vehicles. Anomaly detection systems can be effective as a first line of defence against security threats. Wang et al. [
29] proposed an anomaly detection system that leverages hierarchical temporal memory (HTM) to secure a vehicle controller area network bus. The HTM model may predict real-time flow data based on prior learning. The forecast evaluator’s anomalous scoring algorithm was improved with manually created field modification and replay attacks. The results revealed that the distributed HTM anomaly detection system outperformed recurrent neural networks and hidden Markov model detection systems regarding the RCC score, precision, and recall.
Khalastchi et al. [
30] described an online anomaly detection approach for robots that was light-weight and capable of considering a large number of sensors and internal measures with high precision. By selecting online correlated data, the authors presented a robot-specific version of the well-known Mahalanobis distance. The authors also illustrated how it may be applied to large dimensions. The authors tested these contributions using commercial Unmanned Aerial Vehicles (UAVs), a vacuum-cleaning robot, and a high-fidelity flight simulator. According to their findings, the Online Mahalanobis distance was superior to previous methods.
For example, autos are CPSs due to their unique sensors, ECUs, and actuators. External connectivity increases the attack surface, affecting those inside vehicles and those nearby. The attack surface has grown due to complex systems built on top of older, less secure common bus frameworks that lack basic authentication methods. In order to make such systems safer, authors treat this as a data analytic challenge. Narayanan et al. [
31] employed a Hidden Markov Model to detect dangerous behaviour and send alerts when a vehicle is in motion. To demonstrate the techniques’ ability to detect anomalies in vehicles, the authors tested them with single and dual parameters. Moreover, this technique worked on both new and old cars.
2.7. Feature Based Intrusion Detection System
Garg et al. [
32] proposed an anomaly detection system with three stages: (a) feature selection, (b) SVM parameter optimization, and (c) traffic classification. The first two stages are expressed using the multi-objective optimization problem. The “C-ABC” coupling increases the optimizer’s local search capabilities and speed. The final stage of data classification uses SVM with updated parameters. OMNET++ and SUMO were used to evaluate the proposed model extensively. The detection rate, accuracy, and false positive rate show the effectiveness.
Marchetti et al. [
33] examined information-theoretic anomaly detection methods for current automotive networks. This study focused on entropy-based anomaly detectors. The authors simulated in-car network assaults by inserting bogus CAN messages into real data from a modern licenced vehicle. An experiment found that entropy anomaly detection applied to all CAN messages could detect a large number of false CAN signals. Forging CAN signals was only detectable via entropy-based anomaly detection, which requires many different anomaly detectors for each class of CAN message.
In order to accurately estimate a vehicle’s location and speed, the AEKF must additionally take into account the situation of the traffic surrounding the vehicle. The car-following model takes into account a communication time delay factor to improve its suitability for real-world applications. Anomaly detection in [
34] suggested that this method is superior to that of the AEKF with the typical 2-detector. Increasing the time delay had a negative effect on the overall detection performance.
2.8. Connected and Autonomous Vehicles
Connected and autonomous vehicles (CAV) are expected to revolutionise the automobile industry. Autonomous decision-making systems process data from external and on-board sensors. Signal sabotage, hardware degradation, software errors, power instability, and cyberattacks are all possible with CAV. Preventing these potentially fatal anomalies requires real-time detection [
35] and identification. Oucheikh et al. [
36] proposed a hierarchical model to reliably categorise each signal sequence in real-time using an LSTM auto-encoder.
The effect of model parameter modification on anomaly detection and the channel boosting benefits were examined in three cases. The model was 95.5% precise. The below
Table 1 shows the comparative analysis of previous studies conducted to detect anomalies in the IoV. In the table below, it can be seen that multiple techniques have been used previously, i.e., Hybrid Models, Random Forests, Gaussian Mixture Models, MXNet, HTM Models, Support Vector Machines and various other machine and deep-learning models.
2.9. Research Gap
The capacity of anomaly detection systems to detect unexpected assaults has garnered a great deal of interest, and this has led to its widespread use in fields, including artificial detection, pattern recognition, and machine learning. Traditional machine-learning techniques commonly employed in IDS rely on time-consuming feature extraction and feature selection processes. Additionally, the classification algorithm currently in use uses shallow machine learning. In a real-world network application, shallow machine-learning techniques can analyse high-dimensional inputs, resulting in a lower detection rate.
Last but not least, the data that IDS systems must deal with mostly consist of network traffic or host call sequences, and there are significant distinctions between the two. Host call sequences are more like a sequence problem than network traffic data. Although earlier methods are generally geared toward a specific case, the detection algorithms are not adaptive, especially to hybrid data source detection systems or advanced detection systems. Consequently, the previous detection algorithms are ineffective. For the purpose of feature selection, we used K-MEANS clustering to extract and select the best features. For classification of attack, we used an Explainable Neural Network (xNN).
The main research gaps are:
For multi-class classification problems, to accurately identify or detect all the classes of data, classes may be imbalanced, and we tackle this problem.
Sometimes, we deal with high dimensional data and features are sparse, and thus efficient feature selection is the point of concern.
Detection and prediction are efficient in deep learning than traditional machine-learning techniques.
2.10. Contributions
In this article, a xNN model for anomaly detection in the IoV is proposed for the classification of attacks in two different data sets separately. Comparing with existing comparative literature, the commitments of this paper are bi-fold.
The contributions of this study are summarized as:
- 1.
To the best of our knowledge, xNN has never been implemented in an IDS specially in the IoV.
- 2.
K-Means-based feature scoring and ranking also contributed in this study to the best feature selection and ranking techniques based on weights.
The remainder of this paper is arranged as follows:
Section 3 depicts the proposed xNN for anomaly detection in the IoV, in
Section 4, the training method of xNN for IoV, and
Section 5 and
Section 6 present our results and conclusions, respectively.
3. Proposed xNN for Anomaly Detection in the IoV
Data with sequential features is difficult for standard neural networks to deal with. The system call order is followed by host calls in the UNSWNB and CICIDS data [
37,
38]. An unusual behaviour may contain call sequence and sub sequences that are normal. As of this, the sequential properties of the system call must be taken into account while doing intrusion detection in the IoV. This means that the input data classification must take into account the current data as well as prior data and its shifted and scaled attributes. Thus, for the detection of intrusion designed to take the input instances with normal and abnormal sequences, we shift and scale the
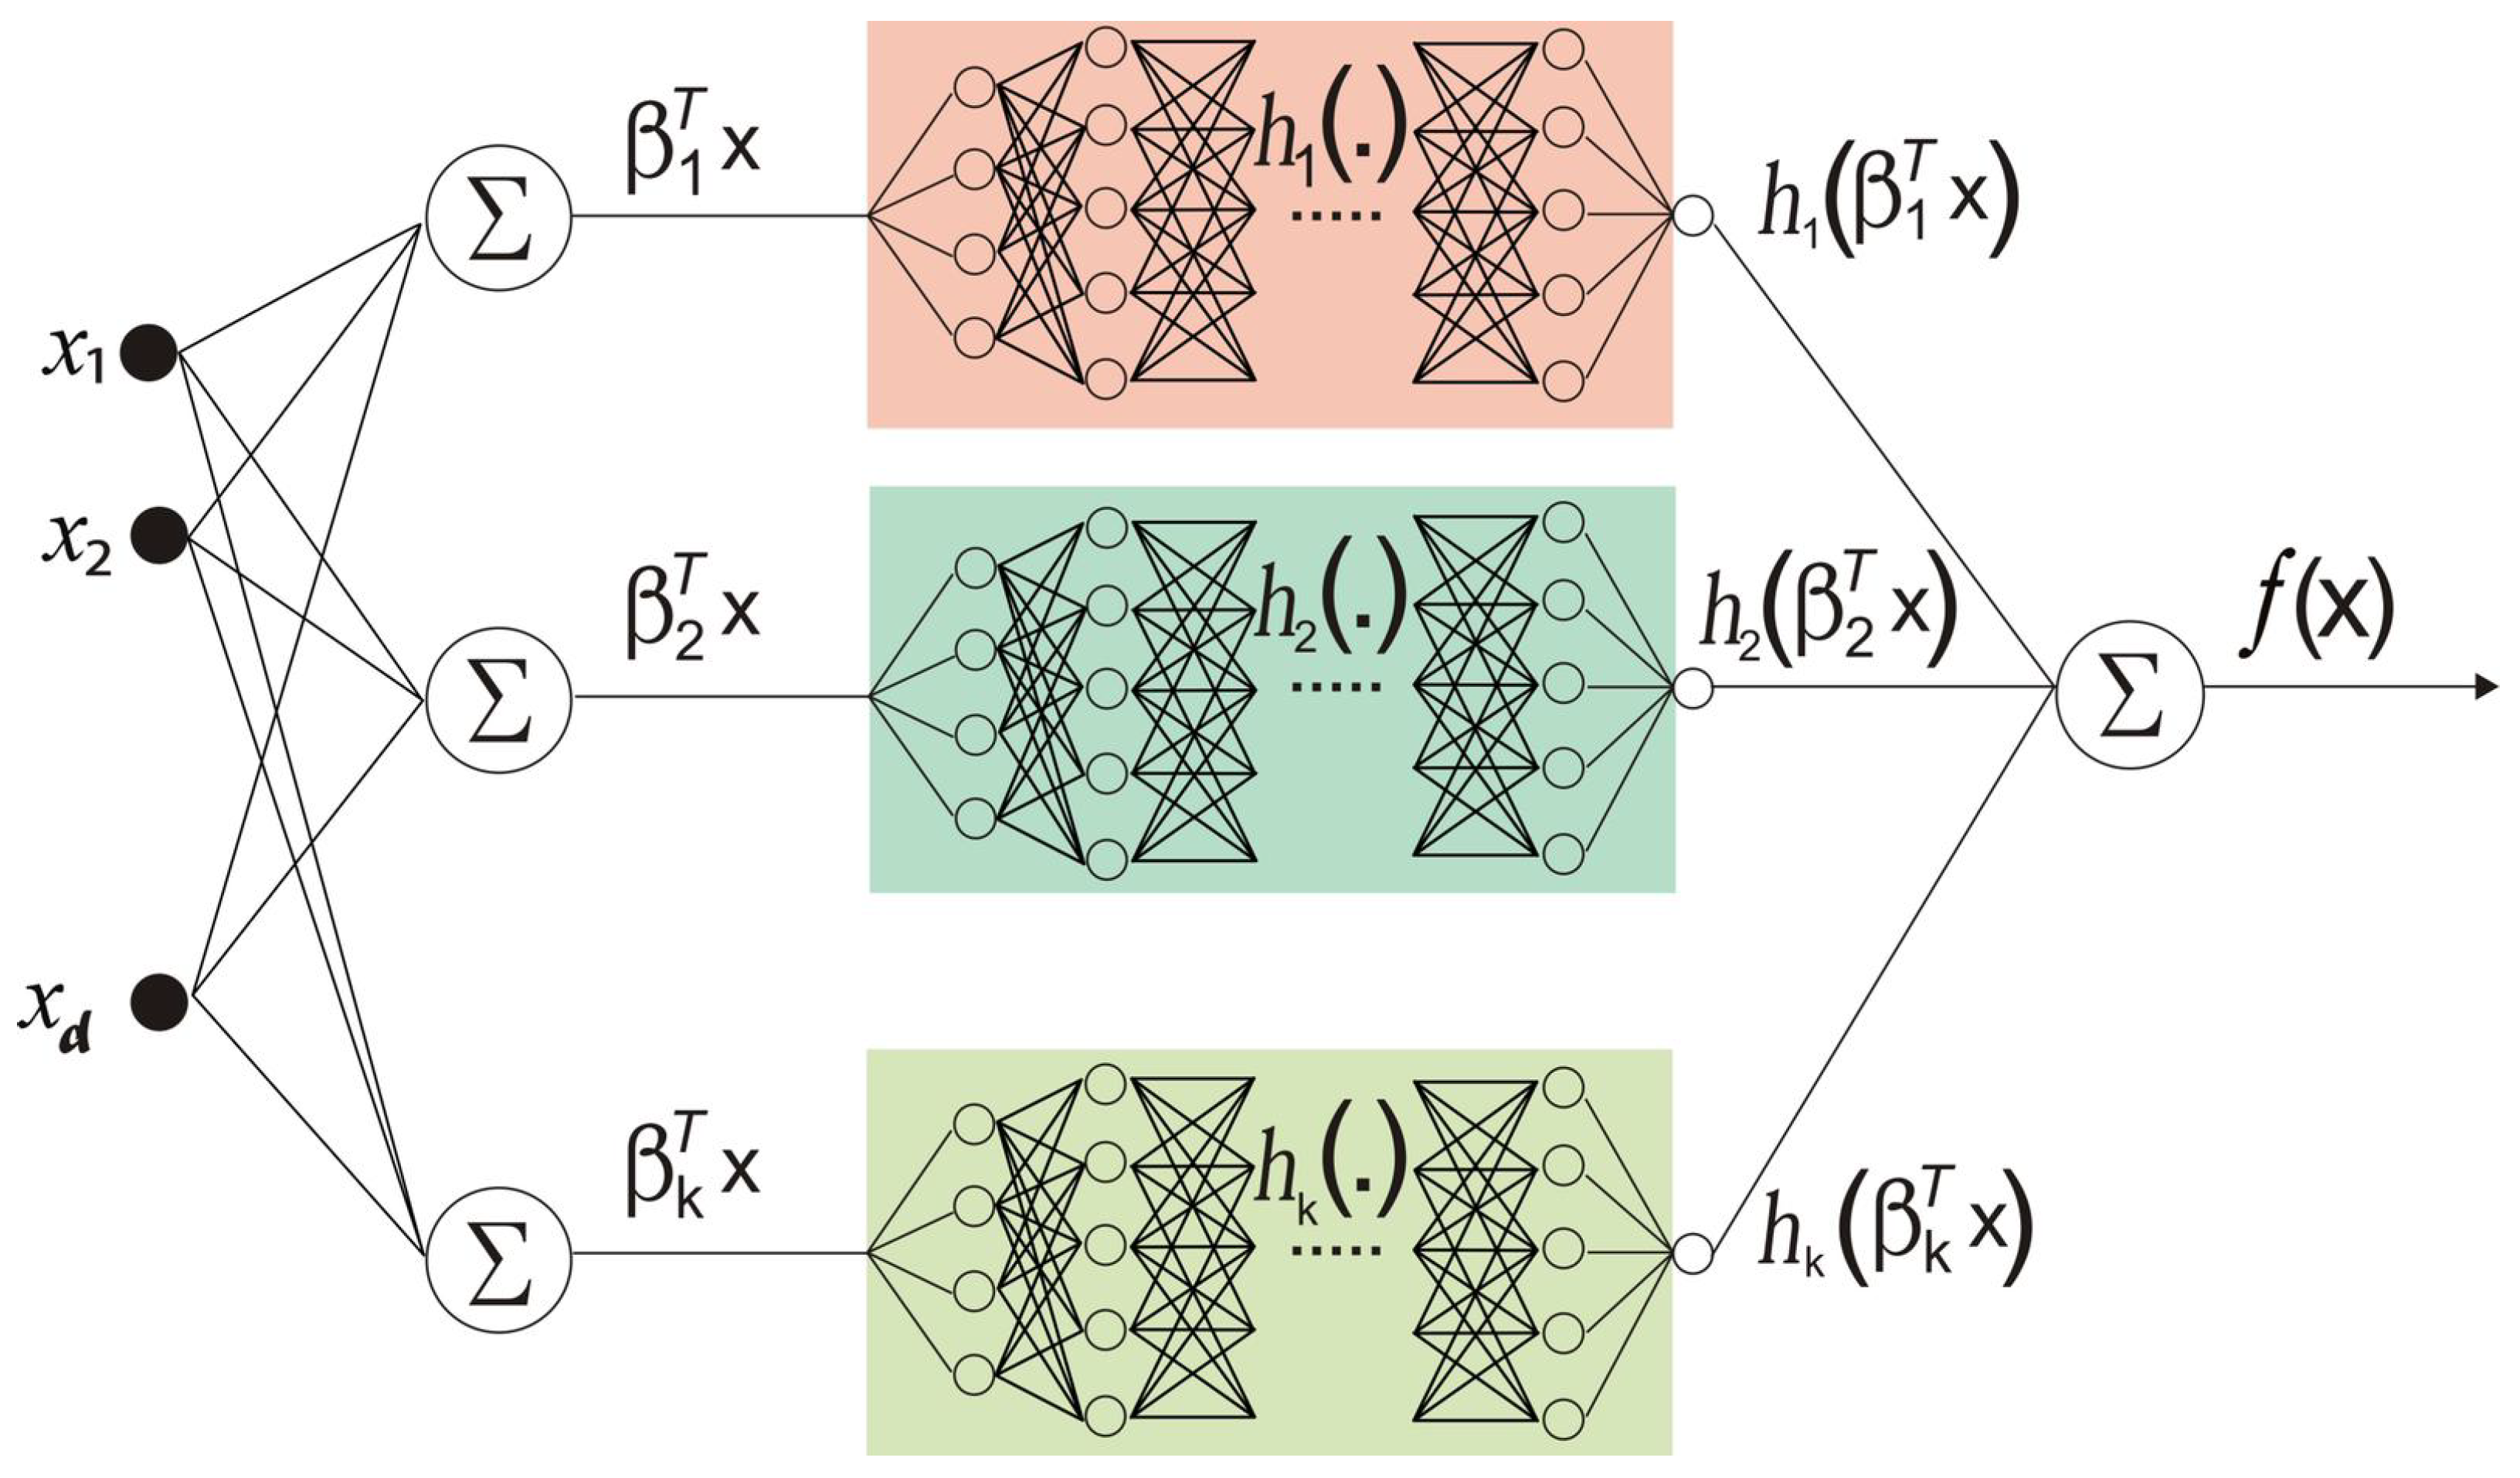
K-Means-clustered data features in order to meet the above requirements for the xNN. xNN works on the Additive Index Model as:
is the function for classification of output variable, i.e., attacks.
is the input feature. All of the features are arranged according to the
K-based value from
K-Means clustering, while
is the value of each instance from the feature.
T is the scaling coefficient, which is directly related to
. From Equation (
1), we added scaling parameters in the neural network, while in Equation (
2), we added a shifting parameter of gamma with the coefficient of shifting, i.e.,
, and h is the hyper-parameter transfer function for over and under-fitting of the model. The alternative formulation for xNN is:
When data is fed into the network, it is multiplied by the weights assigned to each number before being sent to the second layer of neurons as shown in
Figure 3. The sigmoid activation function is constructed by summing the weighted sums of the activation functions of each of the neurons. Now, the weights of the connections between layers two and three are divided by these values. The process is then repeated until the final layer.
The architectural diagram of xNN can be seen below:
Figure 3.
The proposed architecture of xNN.
Figure 3.
The proposed architecture of xNN.
If we let
denote the activation of the jth neuron in layer l;
denote the value of the weight connecting the jth neuron in layer l and the kth neuron in layer ;
denote the bias of the jth neuron in layer l; and
denote the number of neurons in layer l,
then, we can define a universal equation to find the activation of any neuron in an Explainable Neural Network (xNN)
A weighted directed graph can be used to conceptualise xNN, in which neurons are nodes and directed edges with weights connect the nodes. Information from the outside world is encoded as vectors and received by the neural network model. For d inputs, the notation is used to designate these inputs.
The weights of each input are multiplied. The neural network relies on weights to help it solve a problem. Weight is typically used to represent the strength of the connections between neurons in a neural network.
The computing unit sums together all of the inputs that have been weighted (artificial neuron). In the event that the weighted total is zero, a bias is added to make the result non-zero or to increase the system’s responsiveness. Weight and input are both equal to “1” in bias.
Any number from 0 to infinity can be added to the sum. The threshold value is used to limit the response to the desired value. An activation function f(x) is used to move the sum ahead.
To obtain the desired result, the activation function is set to the transfer function. The activation function might be linear or nonlinear.
4. Training Method of xNN for IoV
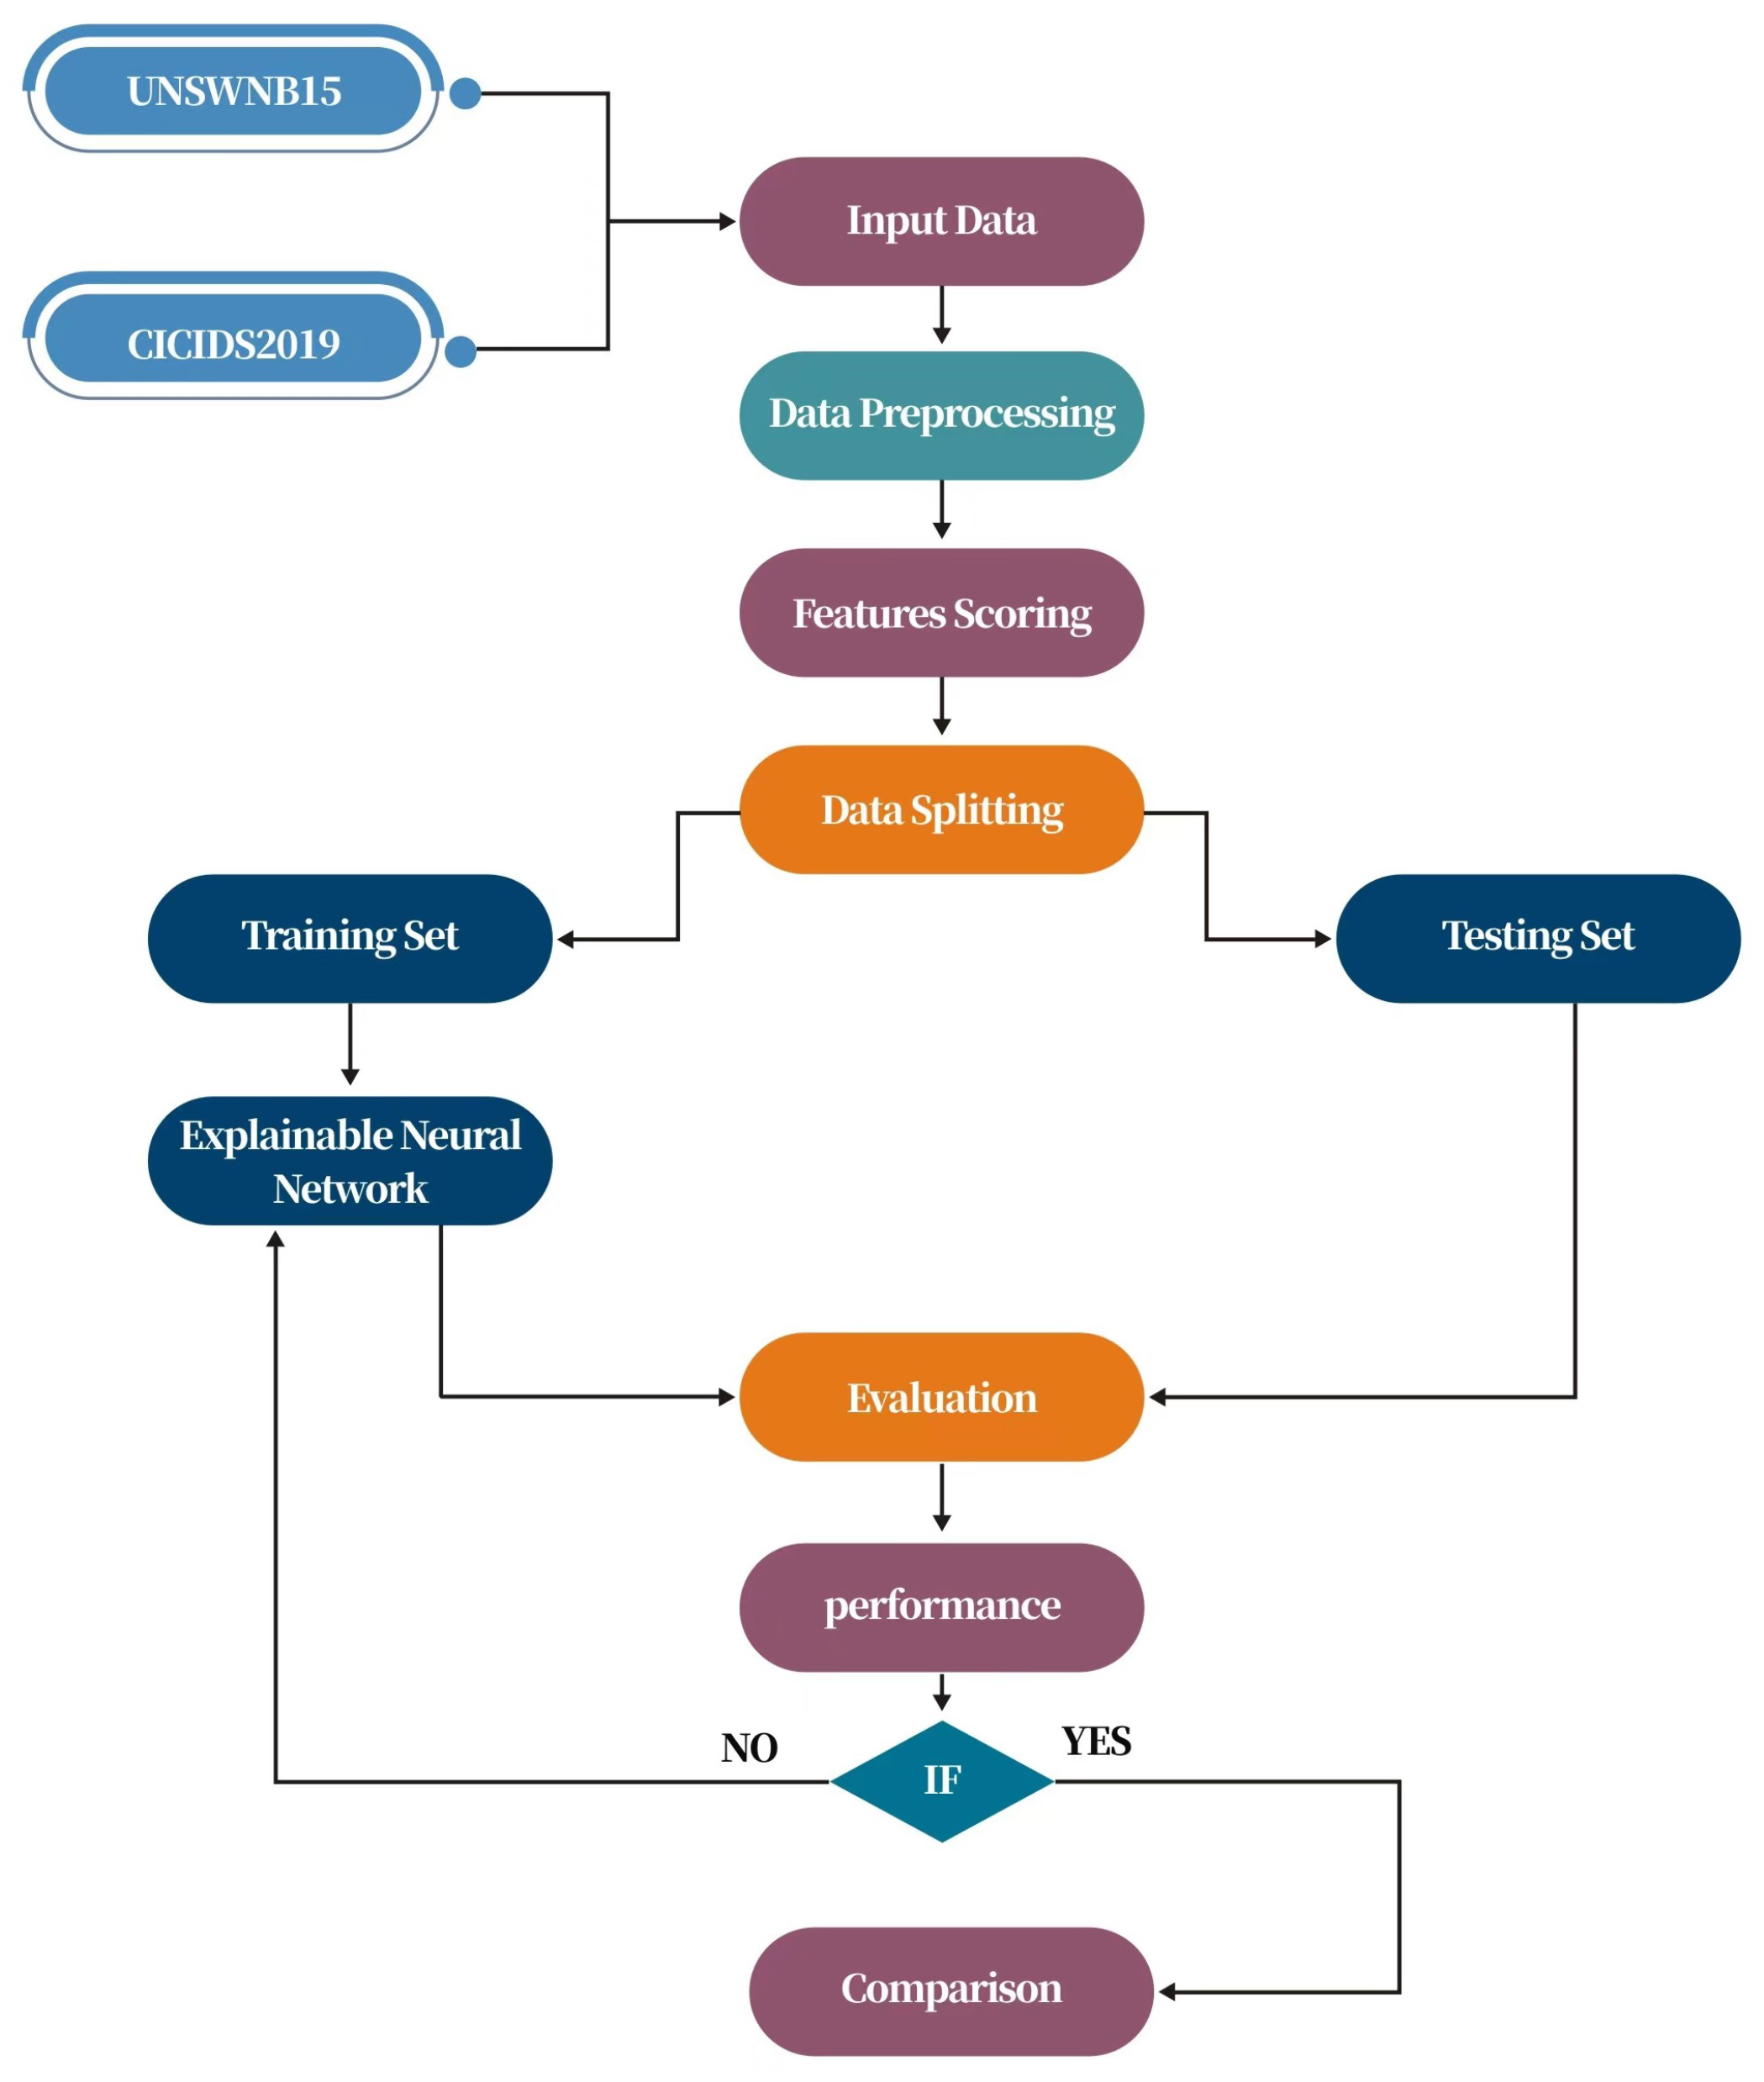
This section explains a detailed description of the dataset, methodology, and performance metrics. We used two recent datasets of autonomous vehicular networks, i.e., UNSW-NB15 and CICIDS2017, which contain a mix of common and modern attacks. The complete flow of the current methodology is shown in
Figure 4 below.
4.1. Dataset Description
4.1.1. UNSW-NB15
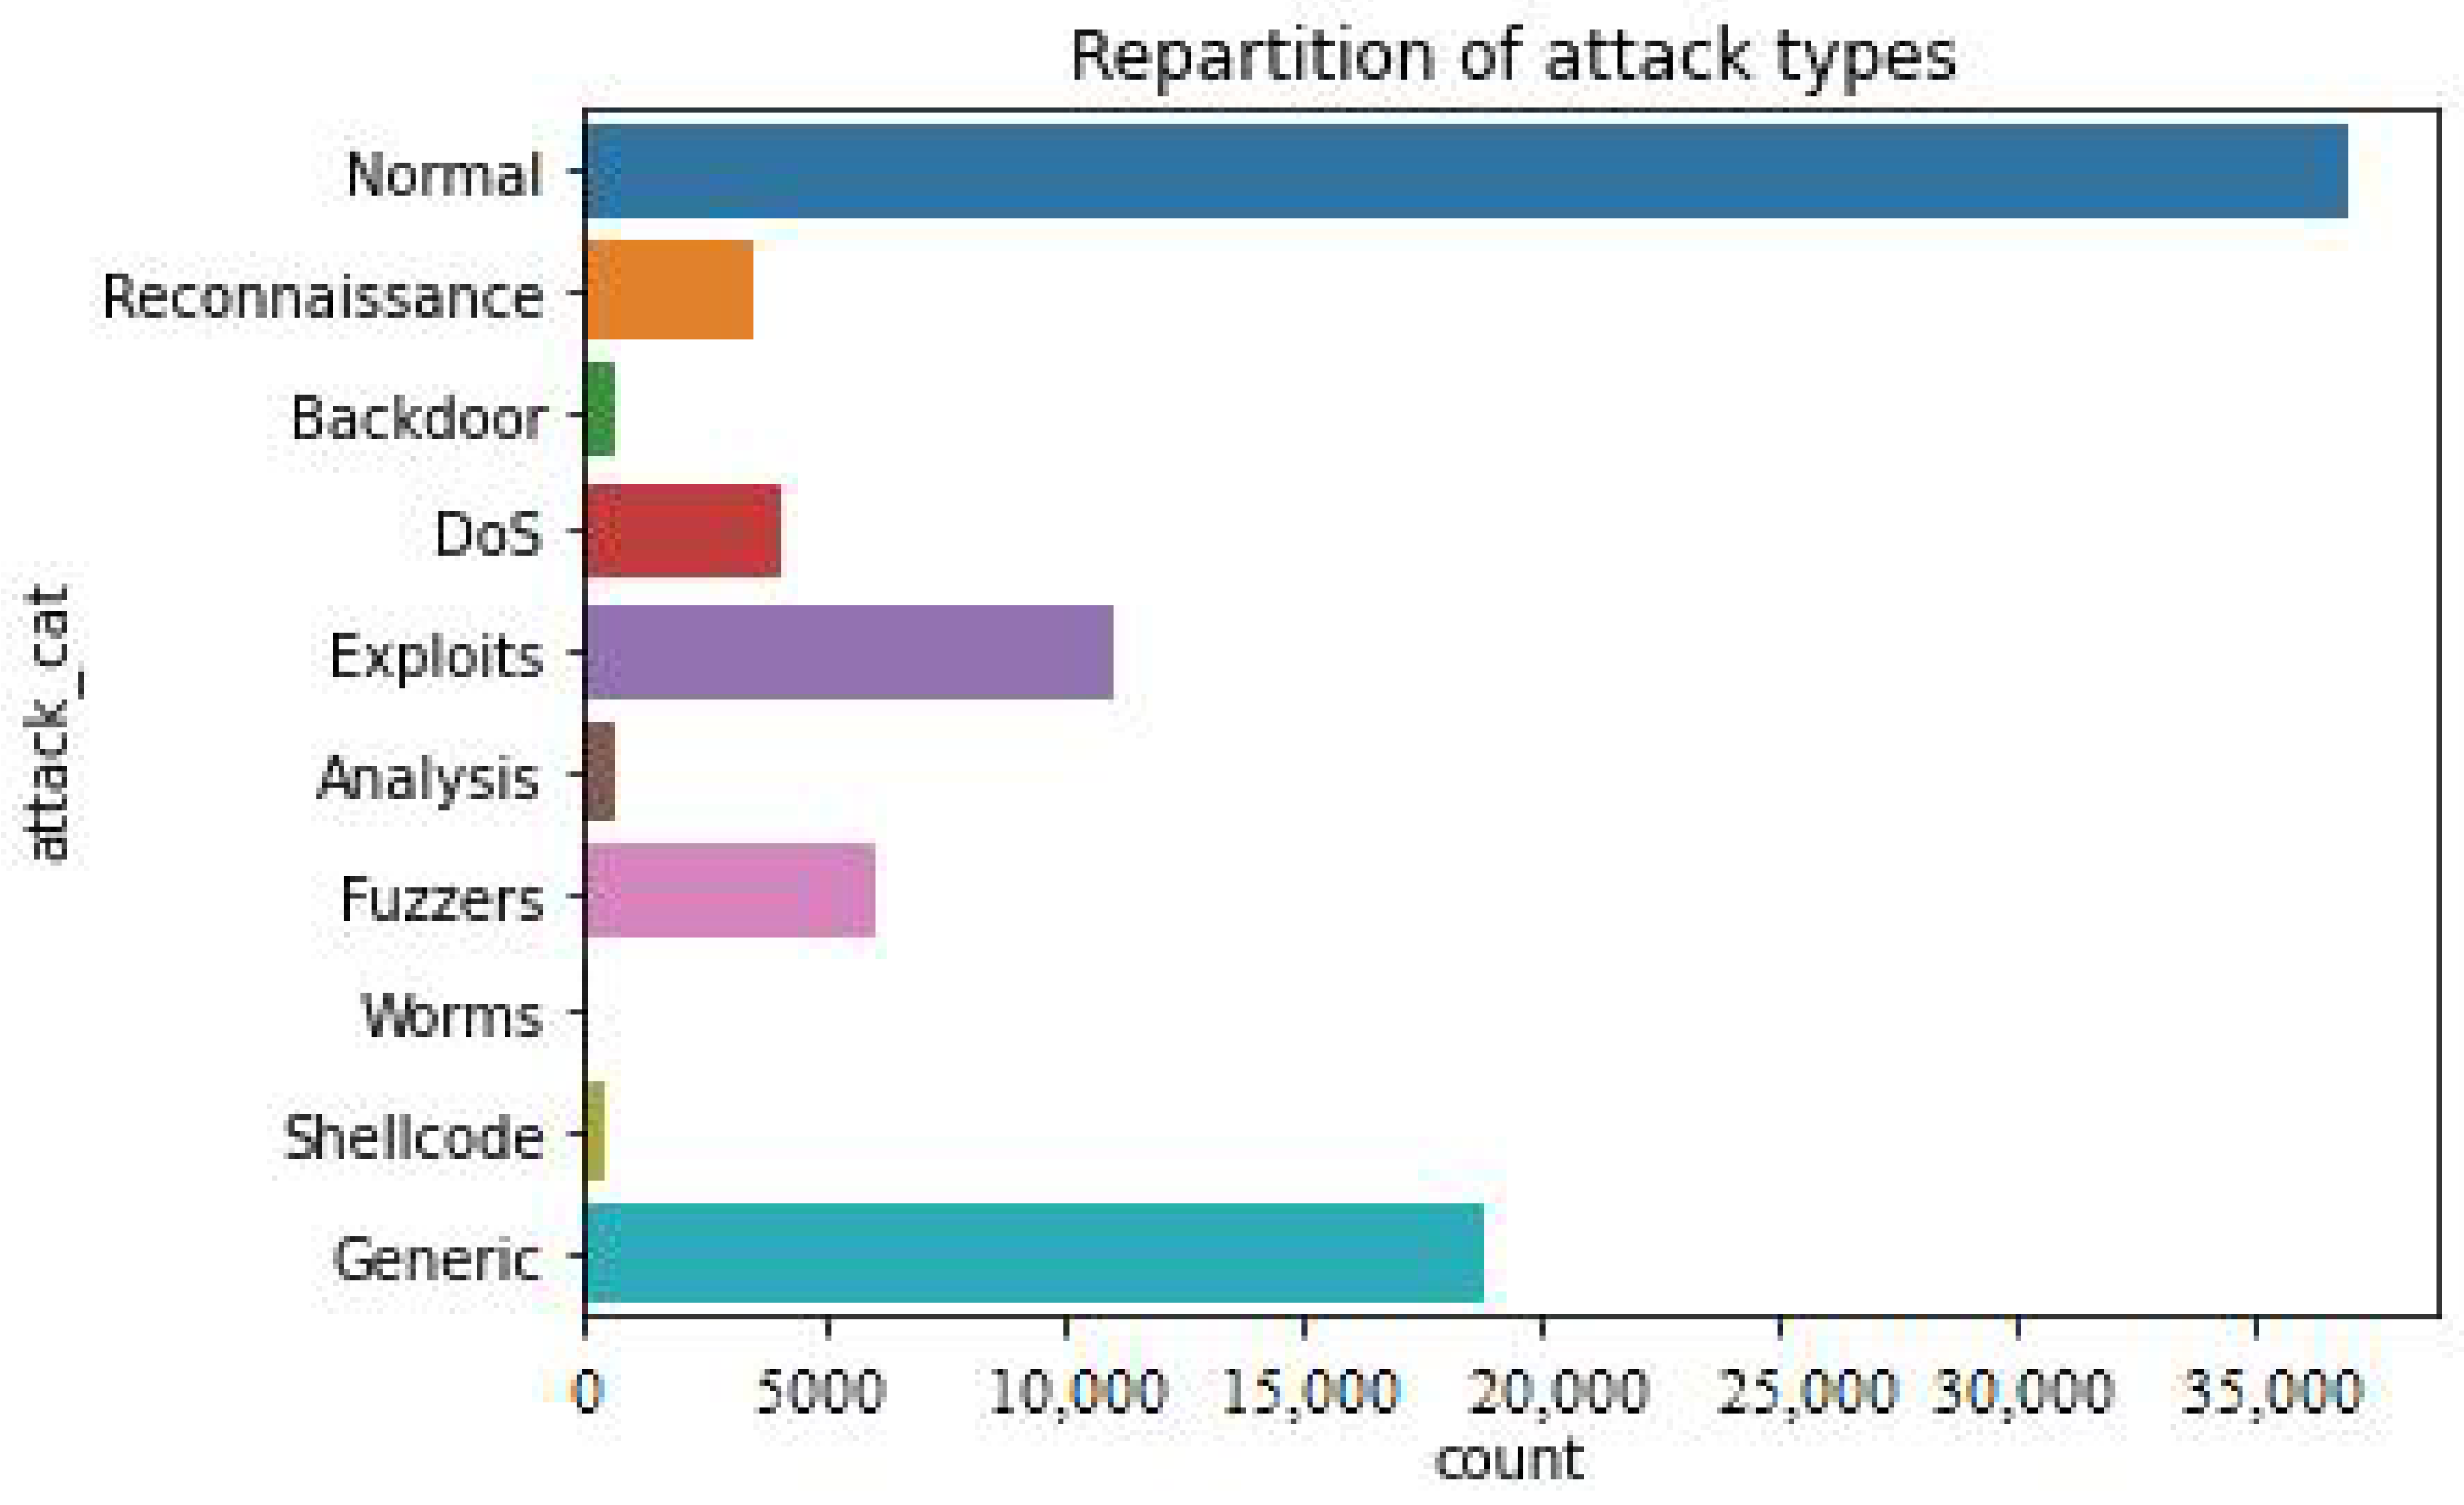
Network intrusions are tracked in the UNSW-NB15 dataset. DoS, worms, Backdoors, and Fuzzers are only some of the nine various types of assaults included in this malicious software. Packets from the network are included in the dataset. There are 175,341 records in the training set and 82,332 records in the testing set of attack and normal records. The following table shows the dataset attributes, i.e., the ID, duration, protocols, state, flags, source and destination bytes, and packets. Attack is the output variable with multiple classes, i.e., DDoS, Backdoor attacks, Worms, and others. The description of UNSW-NB15 dataset is given below in
Table 2:
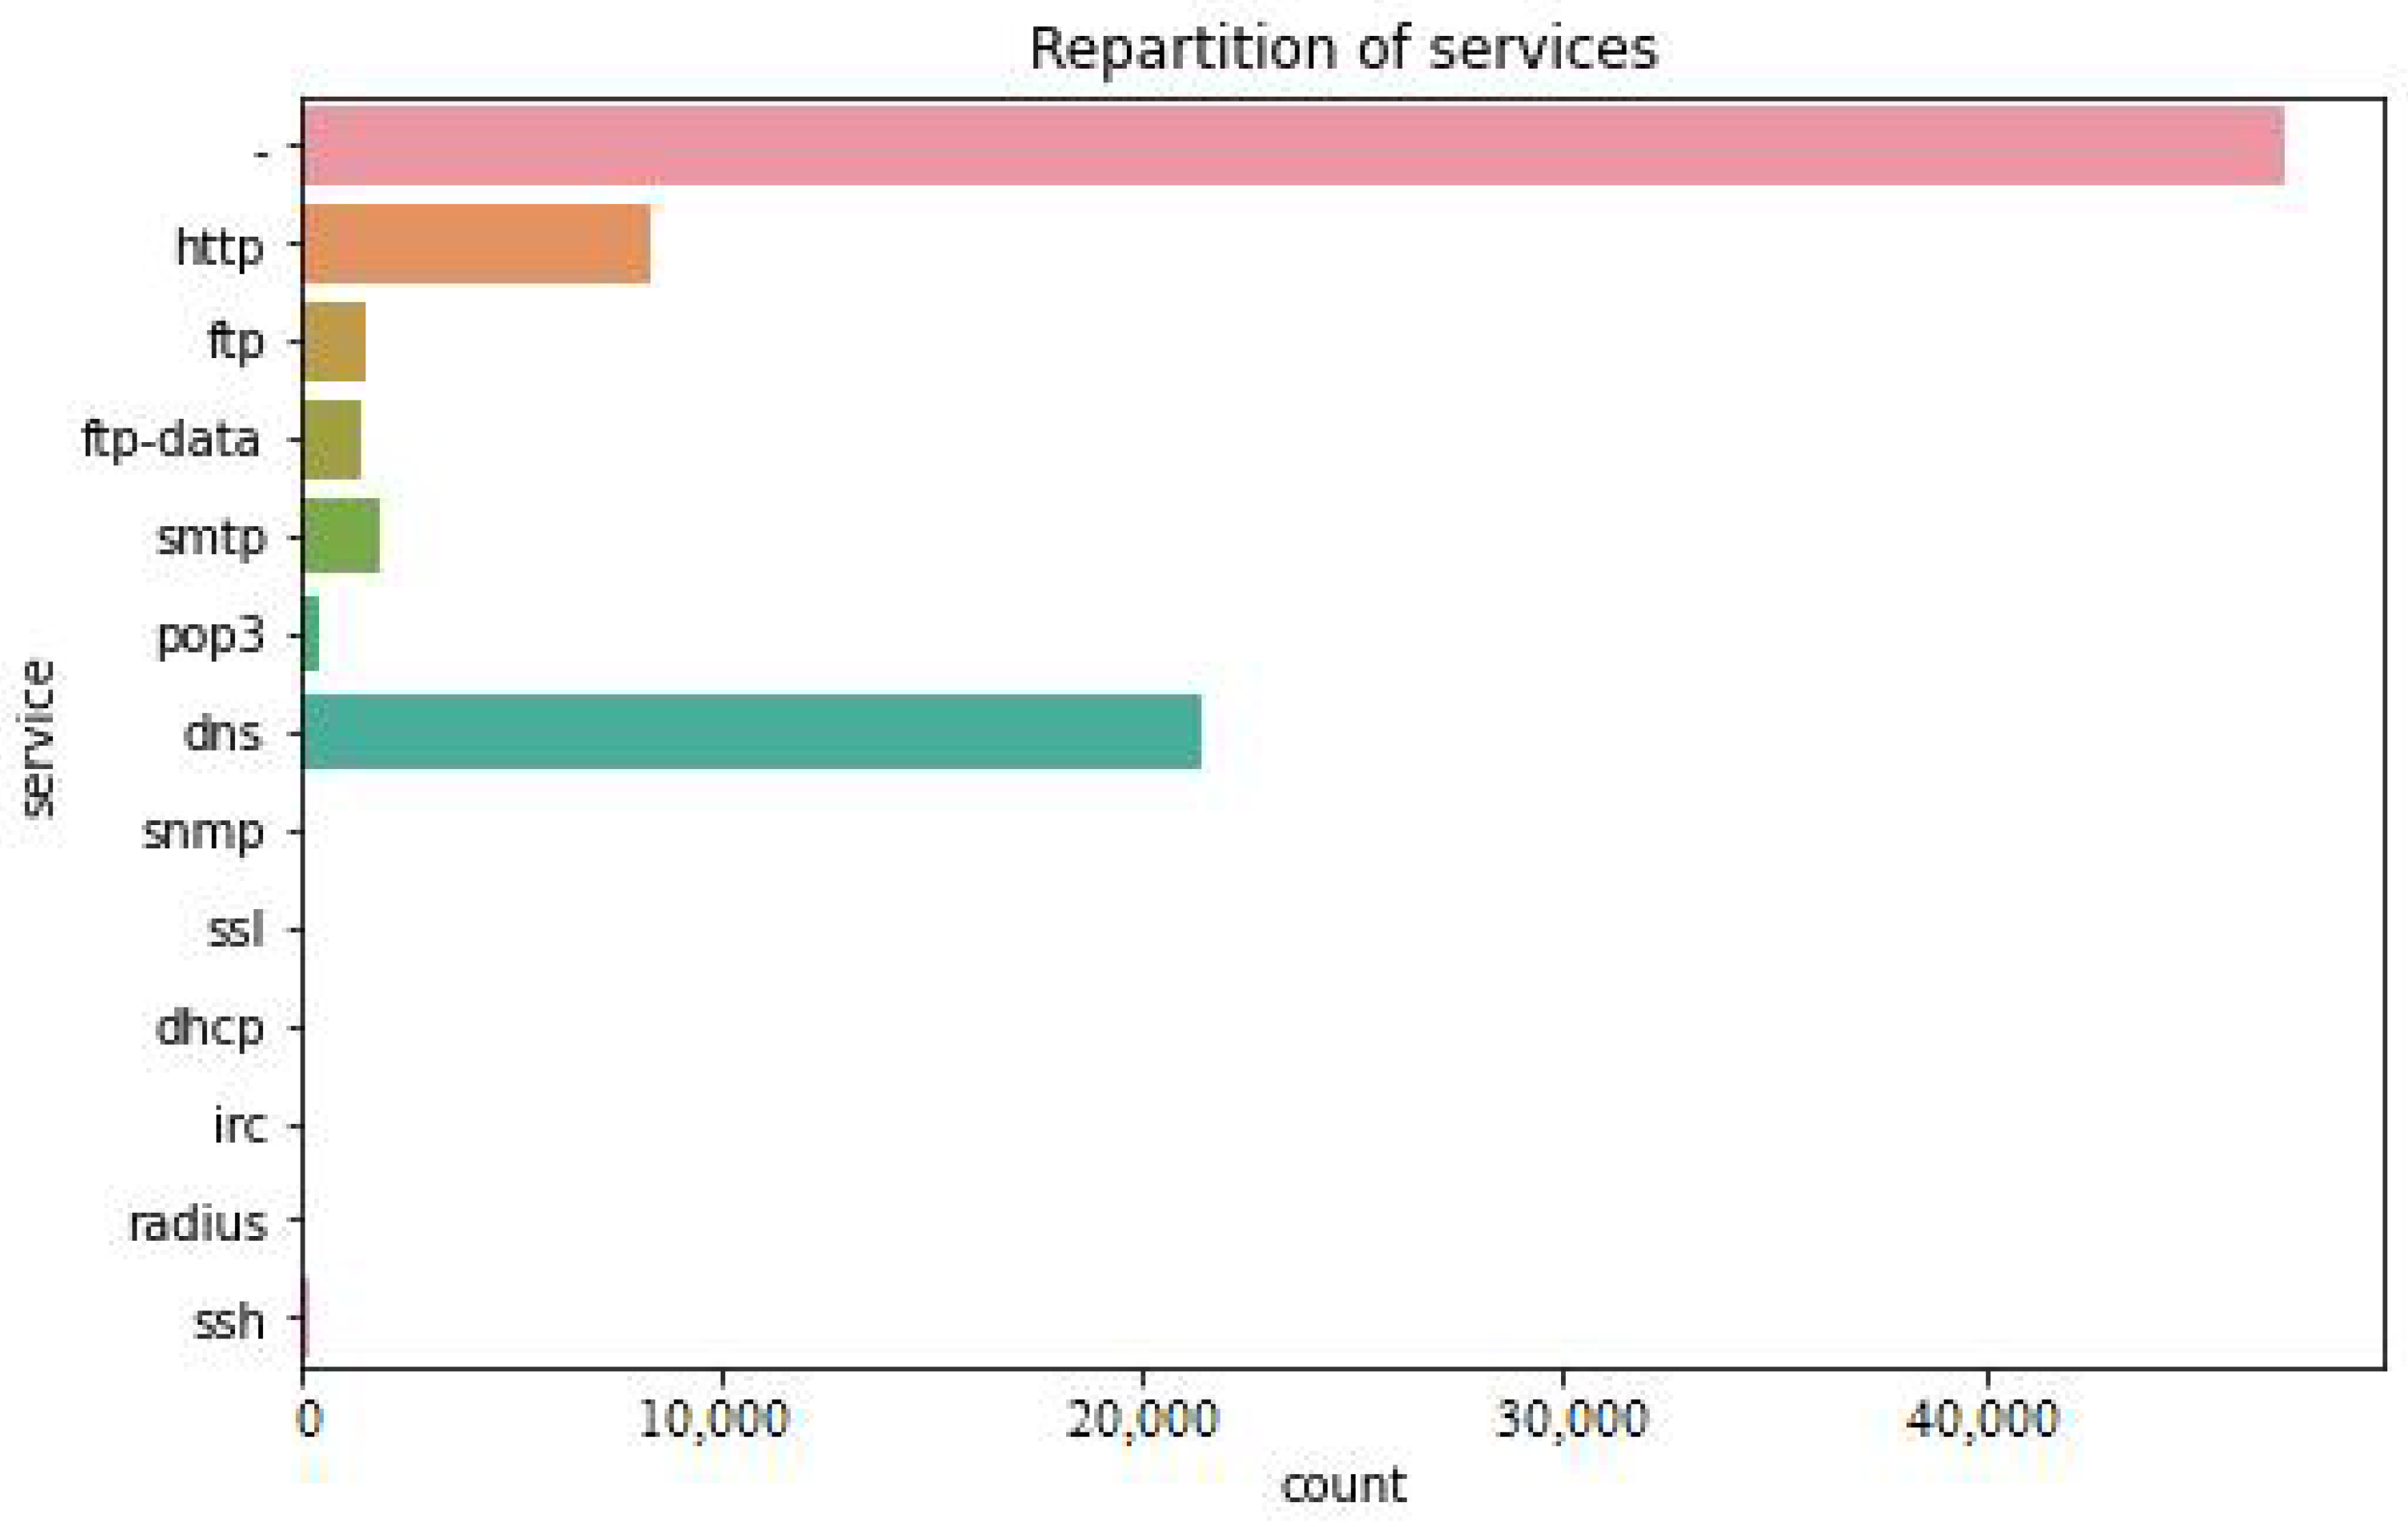
The figure below shows the repartition and total counts of protocols, i.e., HTTP, FTP, FTP Data, SMTP, Pop3, DNS, SNMP, SSL, DHCP, IRC, Radius, and SSH.
Figure 5 shows the number of total categories of attacks present in the UNSW-NB15 dataset, i.e., Generic, Shell Code, DOS, Reconnaissance, Backdoor, Exploits, Analysis, Fuzzers, and Worms, while total 3500 instances were considered as Normal.
4.1.2. CICIDS2019
The
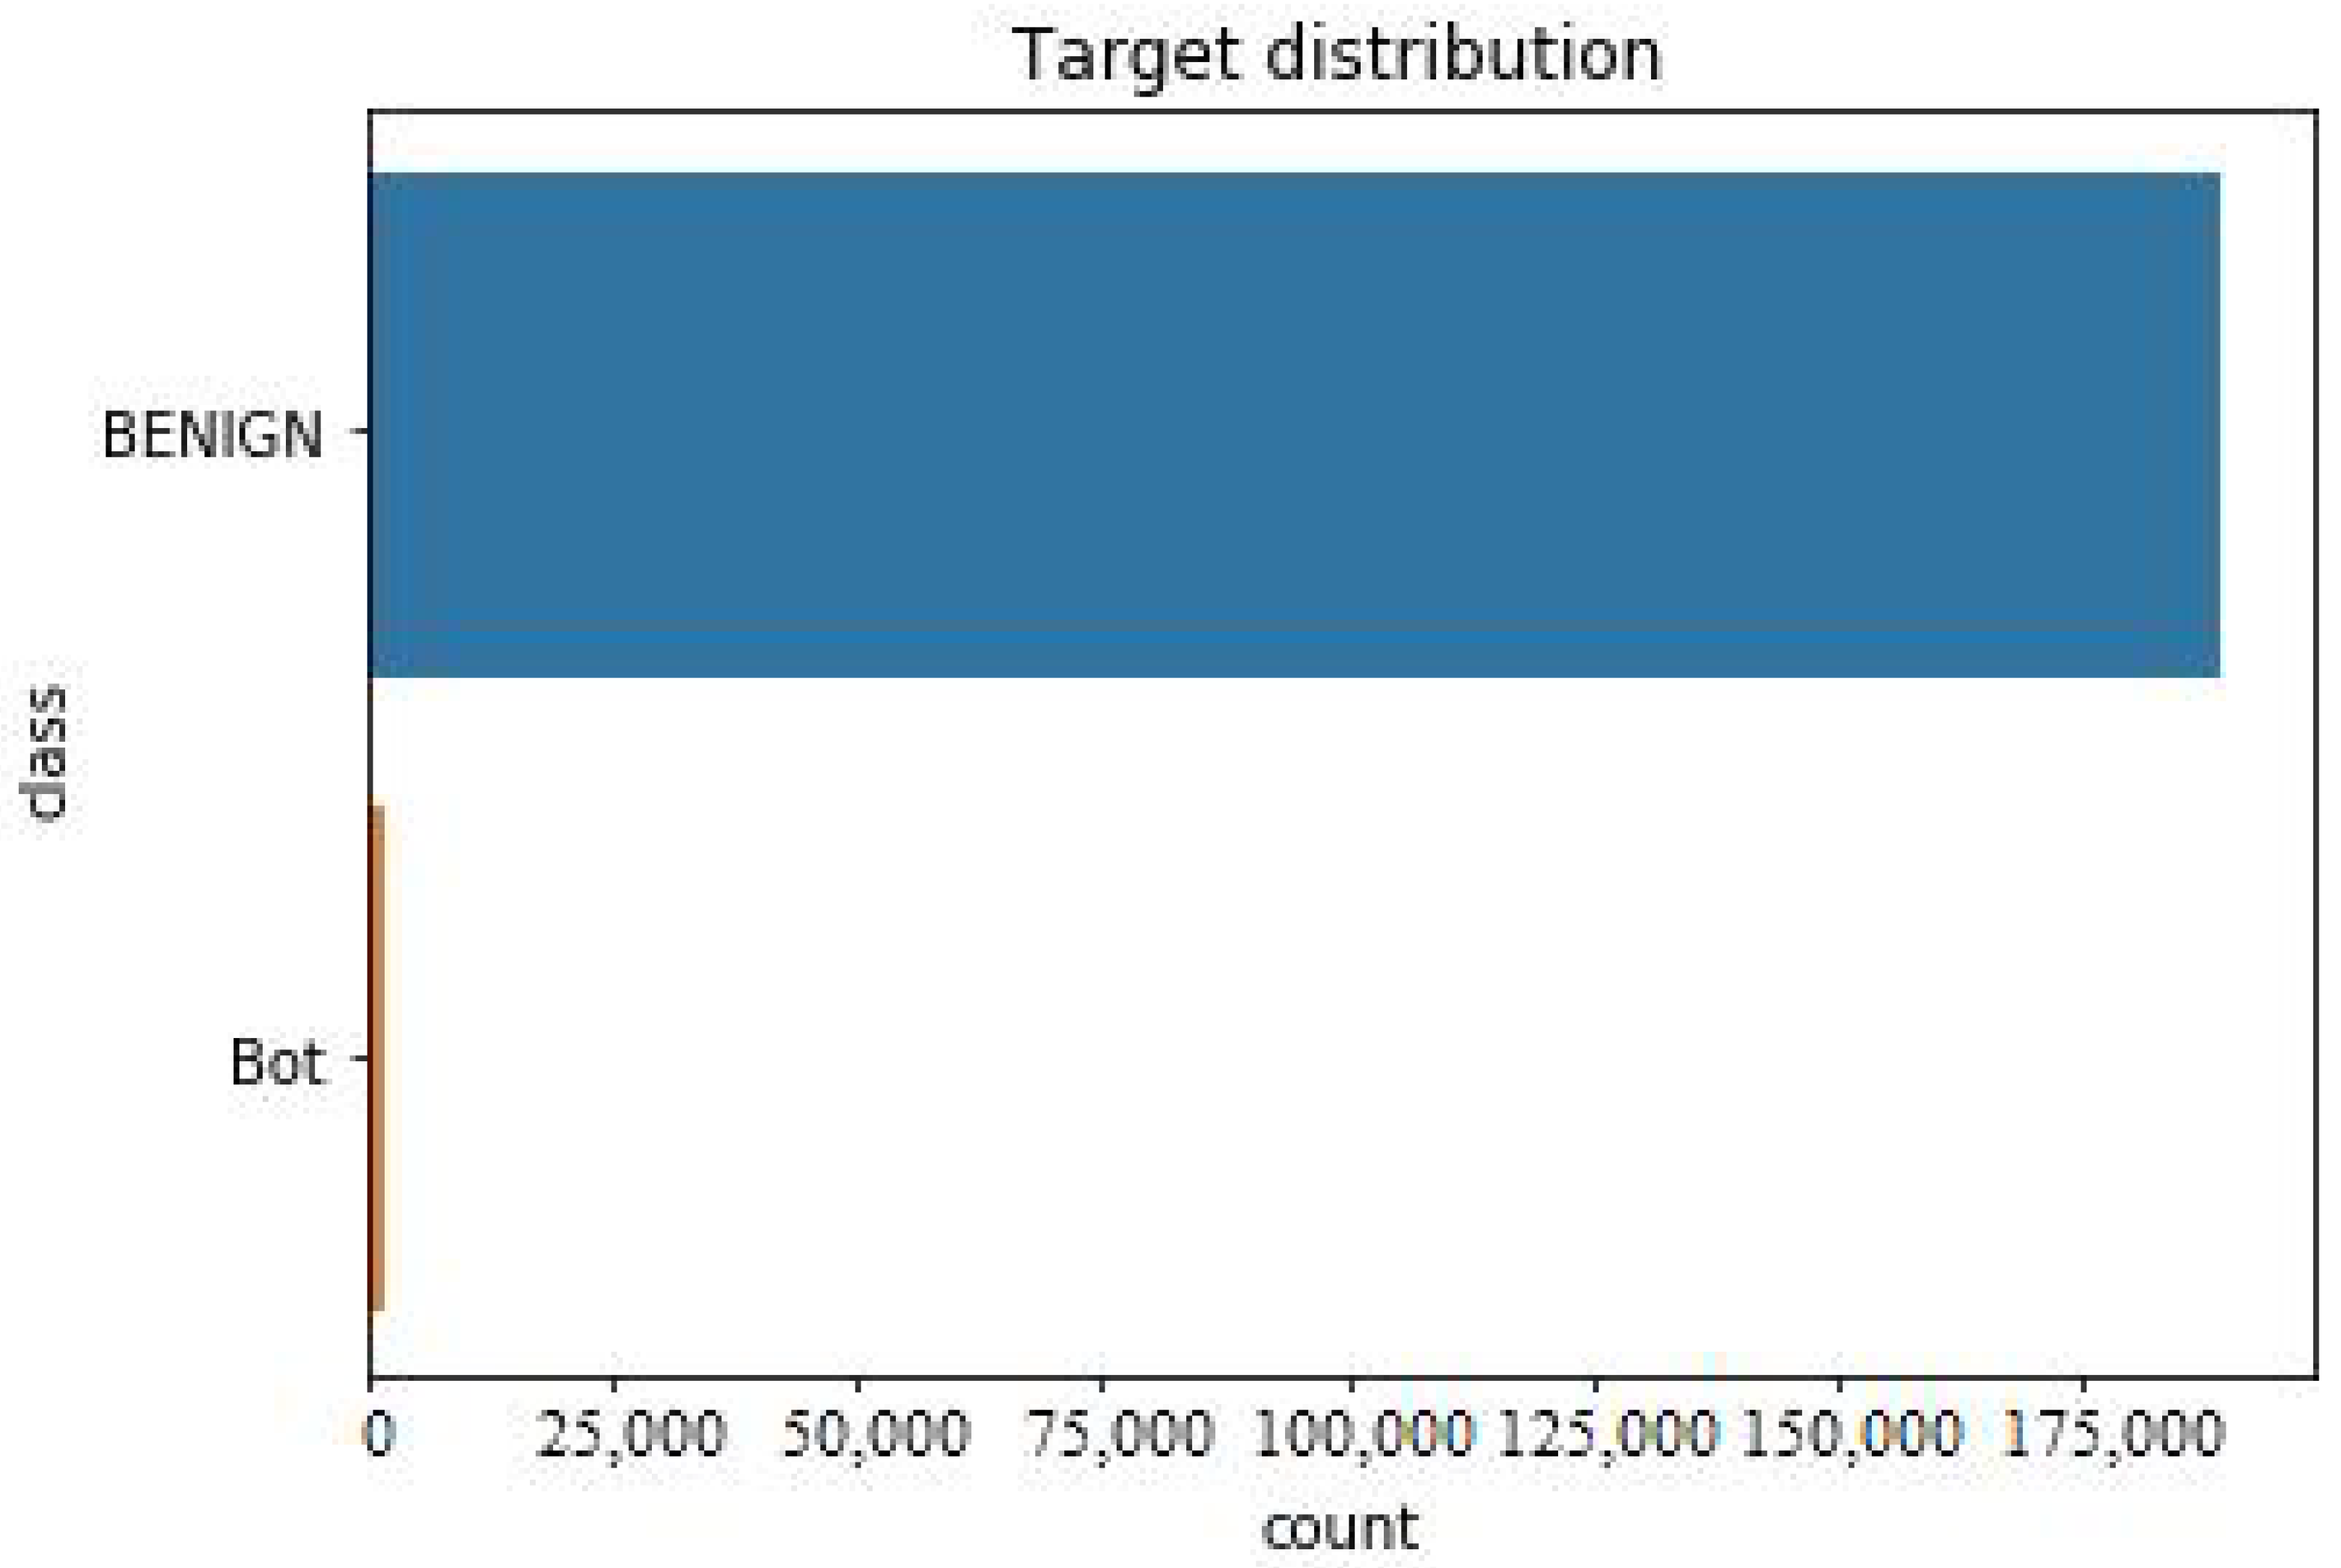
Table 3 shows the second dataset attributes used in this study from CICIDS2019. There are numbers of malicious attacks that can be found in vehicular networks in this dataset, which are related to real-world anomalies. A time stamp, source and destination IPs, source and destination ports, protocols, and attacks are included in the results of the network traffic analysis using Cyclometers. The extracted feature definition is also accessible. The data collection period lasted 5 days, from 9 a.m. on Monday, 3 July 2019, to 5 p.m. on Friday, 7 July 2019. Monday was a regular day with light traffic. Infiltration, Botnet and DDoS assaults were implemented Tuesday, Wednesday, Thursday, and Friday mornings and afternoons.
Figure 5 is showing repartition of services in UNSW-NB15 and
Figure 6 is exhibting repartition of attack types.
Figure 7 below shows the distribution of target variable, i.e., Attacks.
There has been a long-term interest in anomaly detection in several research communities. In some cases, advanced approaches are still needed to deal with complicated problems and obstacles. An important new path in anomaly detection has developed in recent years: deep-learning-enabled anomaly detection (sometimes known as “deep anomaly detection”). Using these two recent datasets, the suggested method is tested. The data sets are preprocessed so that deep-learning techniques may be applied to them. The homogeneity measure (k-means clustering) is a strategy for selecting relevant features from both sets of data in an unsupervised manner to improve the performance of classifiers. The performance of deep-learning models can be estimated and improved via five-fold cross validation. We used Explainable Neural Network (xNN) to classify attacks.
4.2. Data Preprocessing
The dataset is preprocessed to make it more appropriate for a neural network classifier.
4.2.1. Removal of Socket Information
For impartial identification, it is necessary to delete the IP address of the source and destination hosts in the network from the original dataset, since this information may result in overfitting training toward this socket information. Rather than relying on the socket information, the classifier should be taught by the packet’s characteristics, so that any host with similar packet information will be excluded.
4.2.2. Remove White Spaces
When creating multi-class labels, white spaces may be included. As the actual value differs from the labels of other tuples in the same class, these white spaces result in separate classes.
4.2.3. Label Encoding
A string value is used to label the multi-class labels in the dataset, which include the names of attacks. In order to teach the classifier whose class each tuple belongs to, it is necessary to encode these values numerically. The multi-class labels are used for this operation, as the binary labels are already in the zero-one formation for this operation.
4.2.4. Data Normalization
The dataset contains a wide variety of numerical values, which presents a challenge to the classifier during training. This means that the minimum and maximum values for each characteristic should be set to zero and one, respectively. This gives the classifier more uniform values while still maintaining the relevancy of each attribute’s values.
4.2.5. Removal of Null and Missing Values
The CICIDS2017 dataset contains 2867 tuples as missing and infinity values. This has been addressed in two ways, resulting in two datasets. In the second dataset, infinite values are replaced by maximum values, and missing values are replaced by averages. The proposed method was tested on both datasets. Only the attack information packets were used to evaluate the proposed approach with the data packets representing normal network traffic from both sets being ignored.
4.2.6. Feature Ranking
Preprocessed datasets are fed into the
K-Means-clustering algorithm, which uses each attribute individually to rank them in terms of importance before applying it to cluster the entire dataset. For multi-class classification,
k = the number of attacks in datasets, which means that the data point of feature is clustered into two groups: normal and anomalous. To rank the attributes, the clusters’ homogeneity score is computed, with higher homogeneity denoting higher class similarity across the objects inside each cluster. Having a high score indicates that this attribute is important in the classification, while a low score indicates that this attribute is not important. For calculating the highest score similarity between the features, we first calculated the distance and then created an objective function:
From Equation (
4), we computed the distance of the jth cluster from
c centroid to check the
jth feature’s similarity at instance
i with the data point
p at instance
i. After this, we created an objective function to minimize the distance between the cluster centroid and to check the homogeneity between selected features.
For feature ranking, we derived the objective function for the
jth features in Equation (
5). This will calculate the minimal distance of Center
C from
p taking m as the starting point to rank the best features.
5. Results
This section shows the implementation and results of the xNN model on the selected datasets. We applied the xNN model on both datasets separately. Both datasets are publicly available on [
37,
38]. In experimental setup, we used python as a language source and a GPU-based system consisting of Jupyter as a compiler with more than 3.2 GHz processor, which is the minimal simulation requirement for the experimental setup. In the first phase, we evaluated our model based on the accuracy, precision, recall, and F1 score for the classification of nine attacks in UNSW-NB15 dataset. Furthermore, in the second phase, the model was evaluated on the CICIDS2019 dataset.
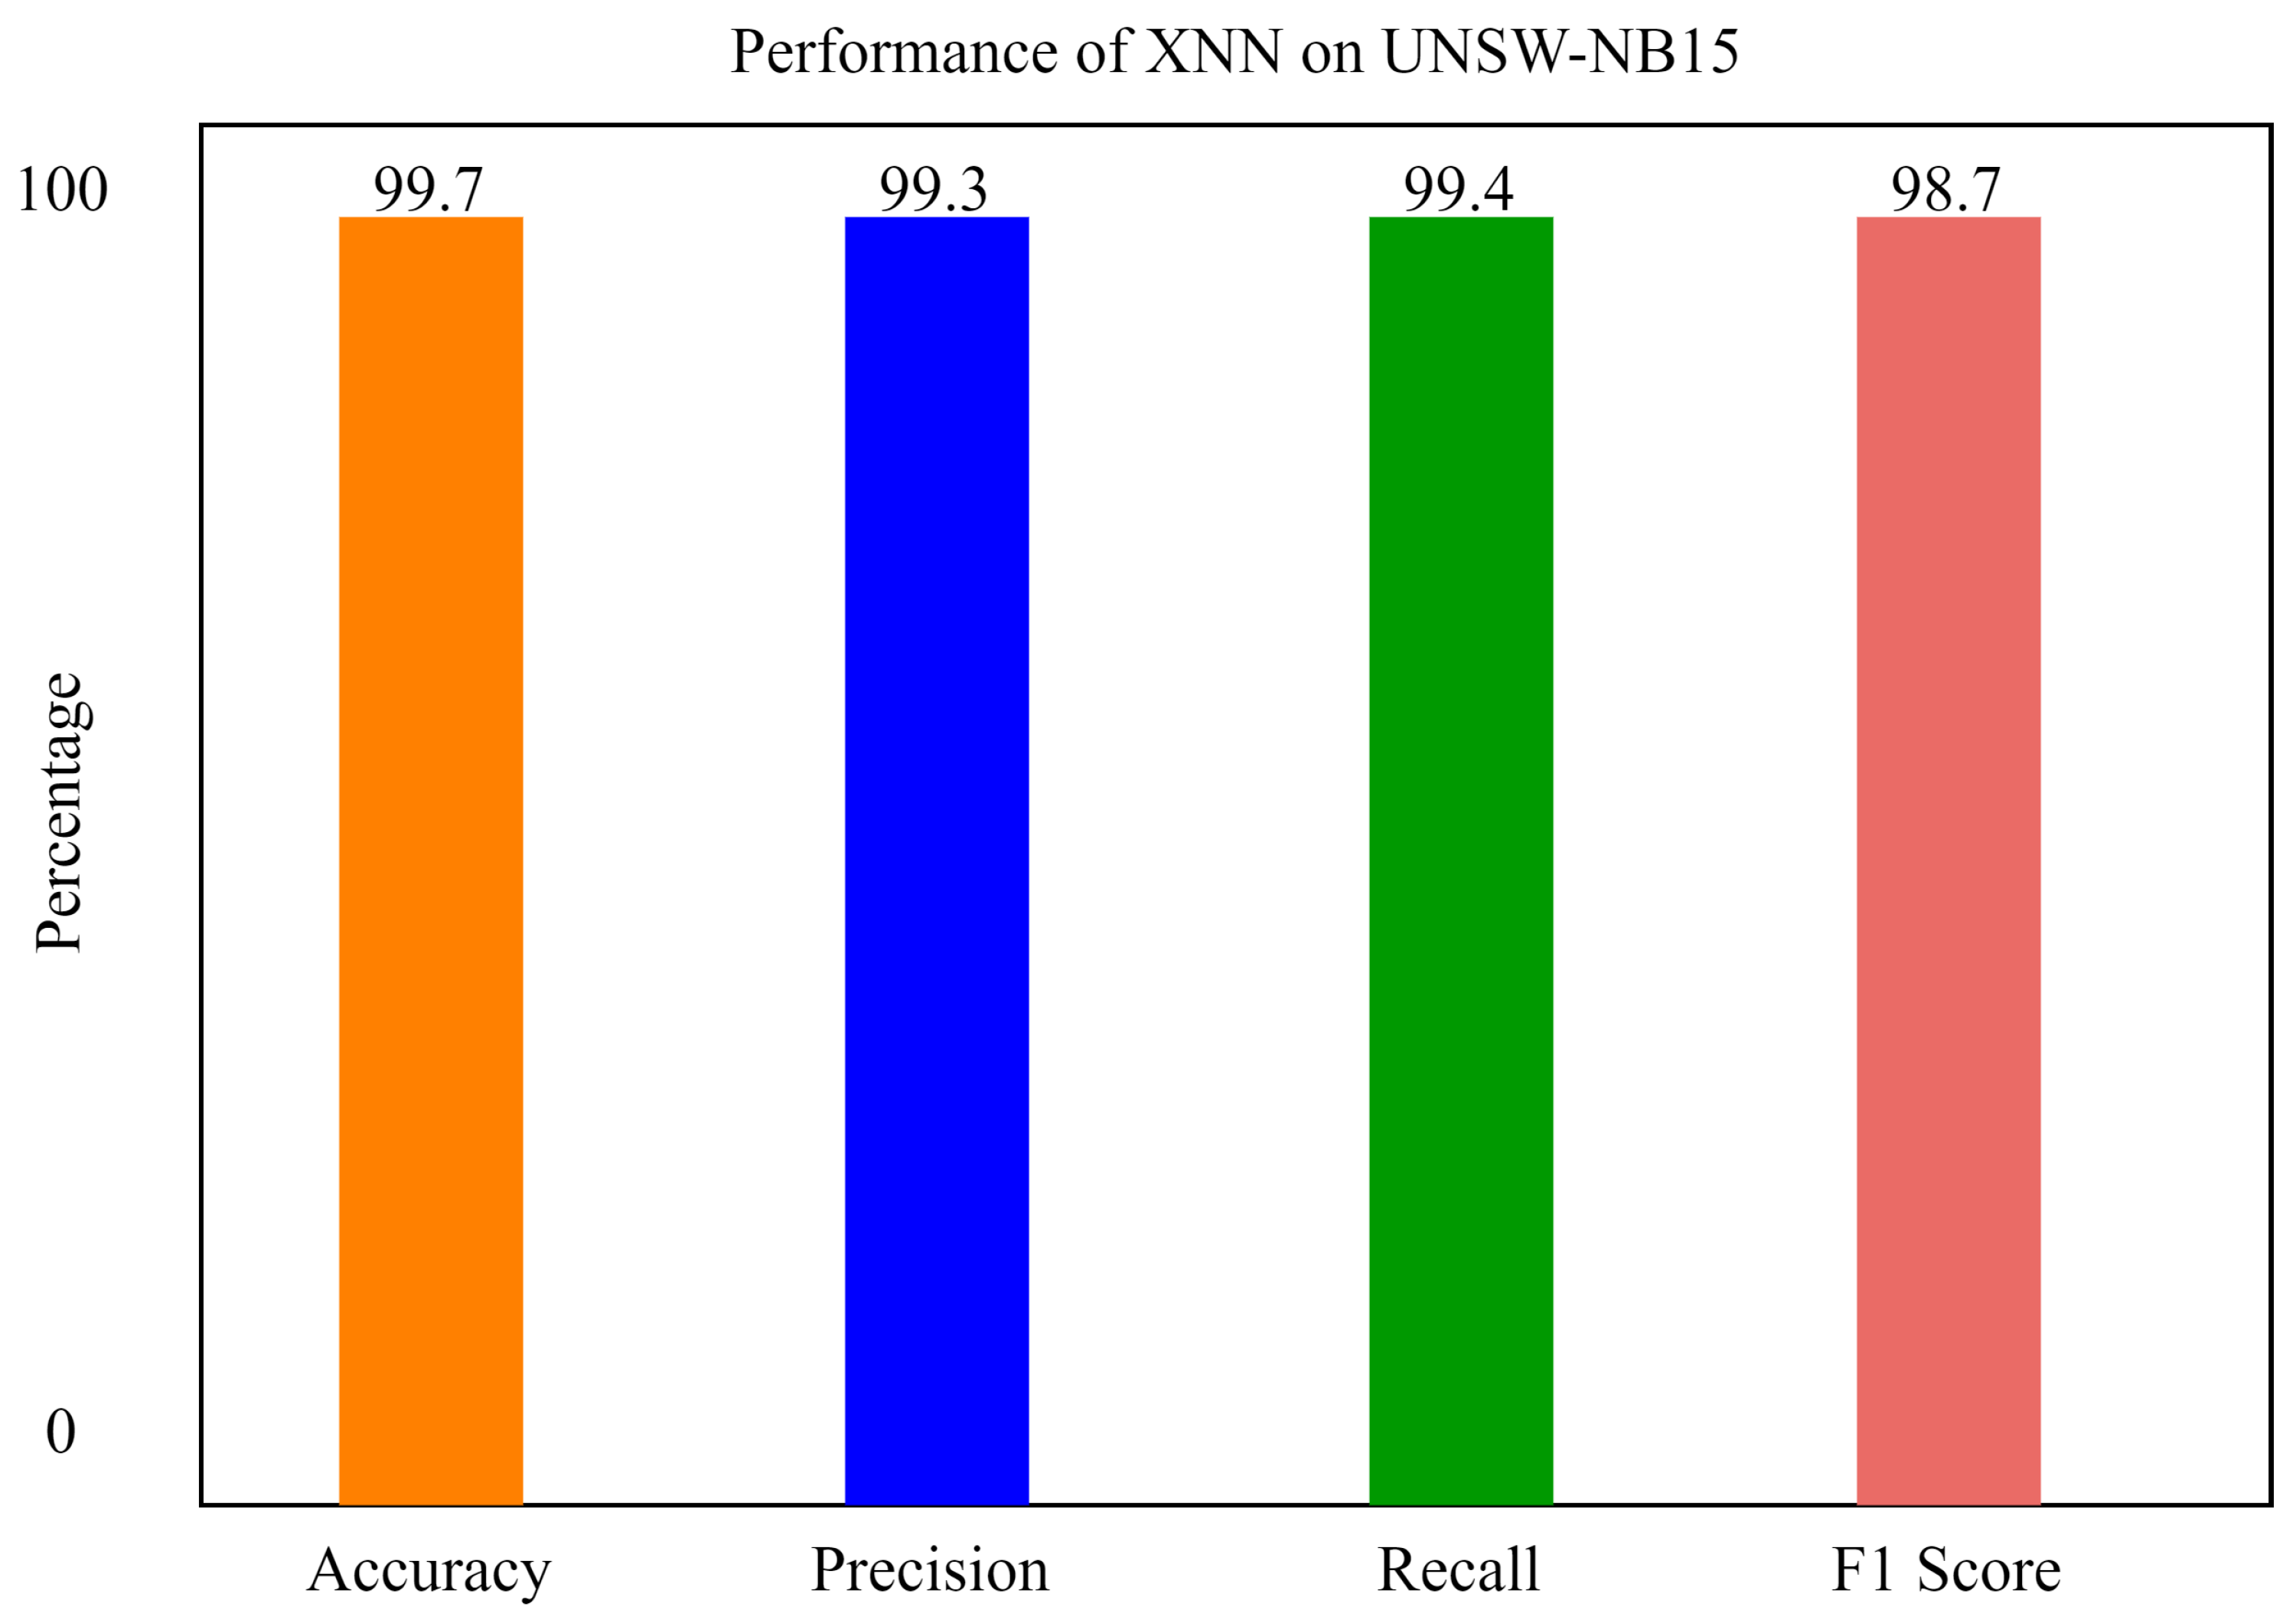
5.1. Performance of xNN on UNSW-NB15
Figure 8 shows the performance of the xNN model on UNSW-NB15 after applying the K-Means-clustering-based feature scoring method. In the figure, the
y axis shows the percentage of accuracy, and the
x axis shows the accuracy, precision, recall, and F1 score of xNN. It shows that the model is 99.7% accurate in classifying the attacks in the IoV-based dataset.
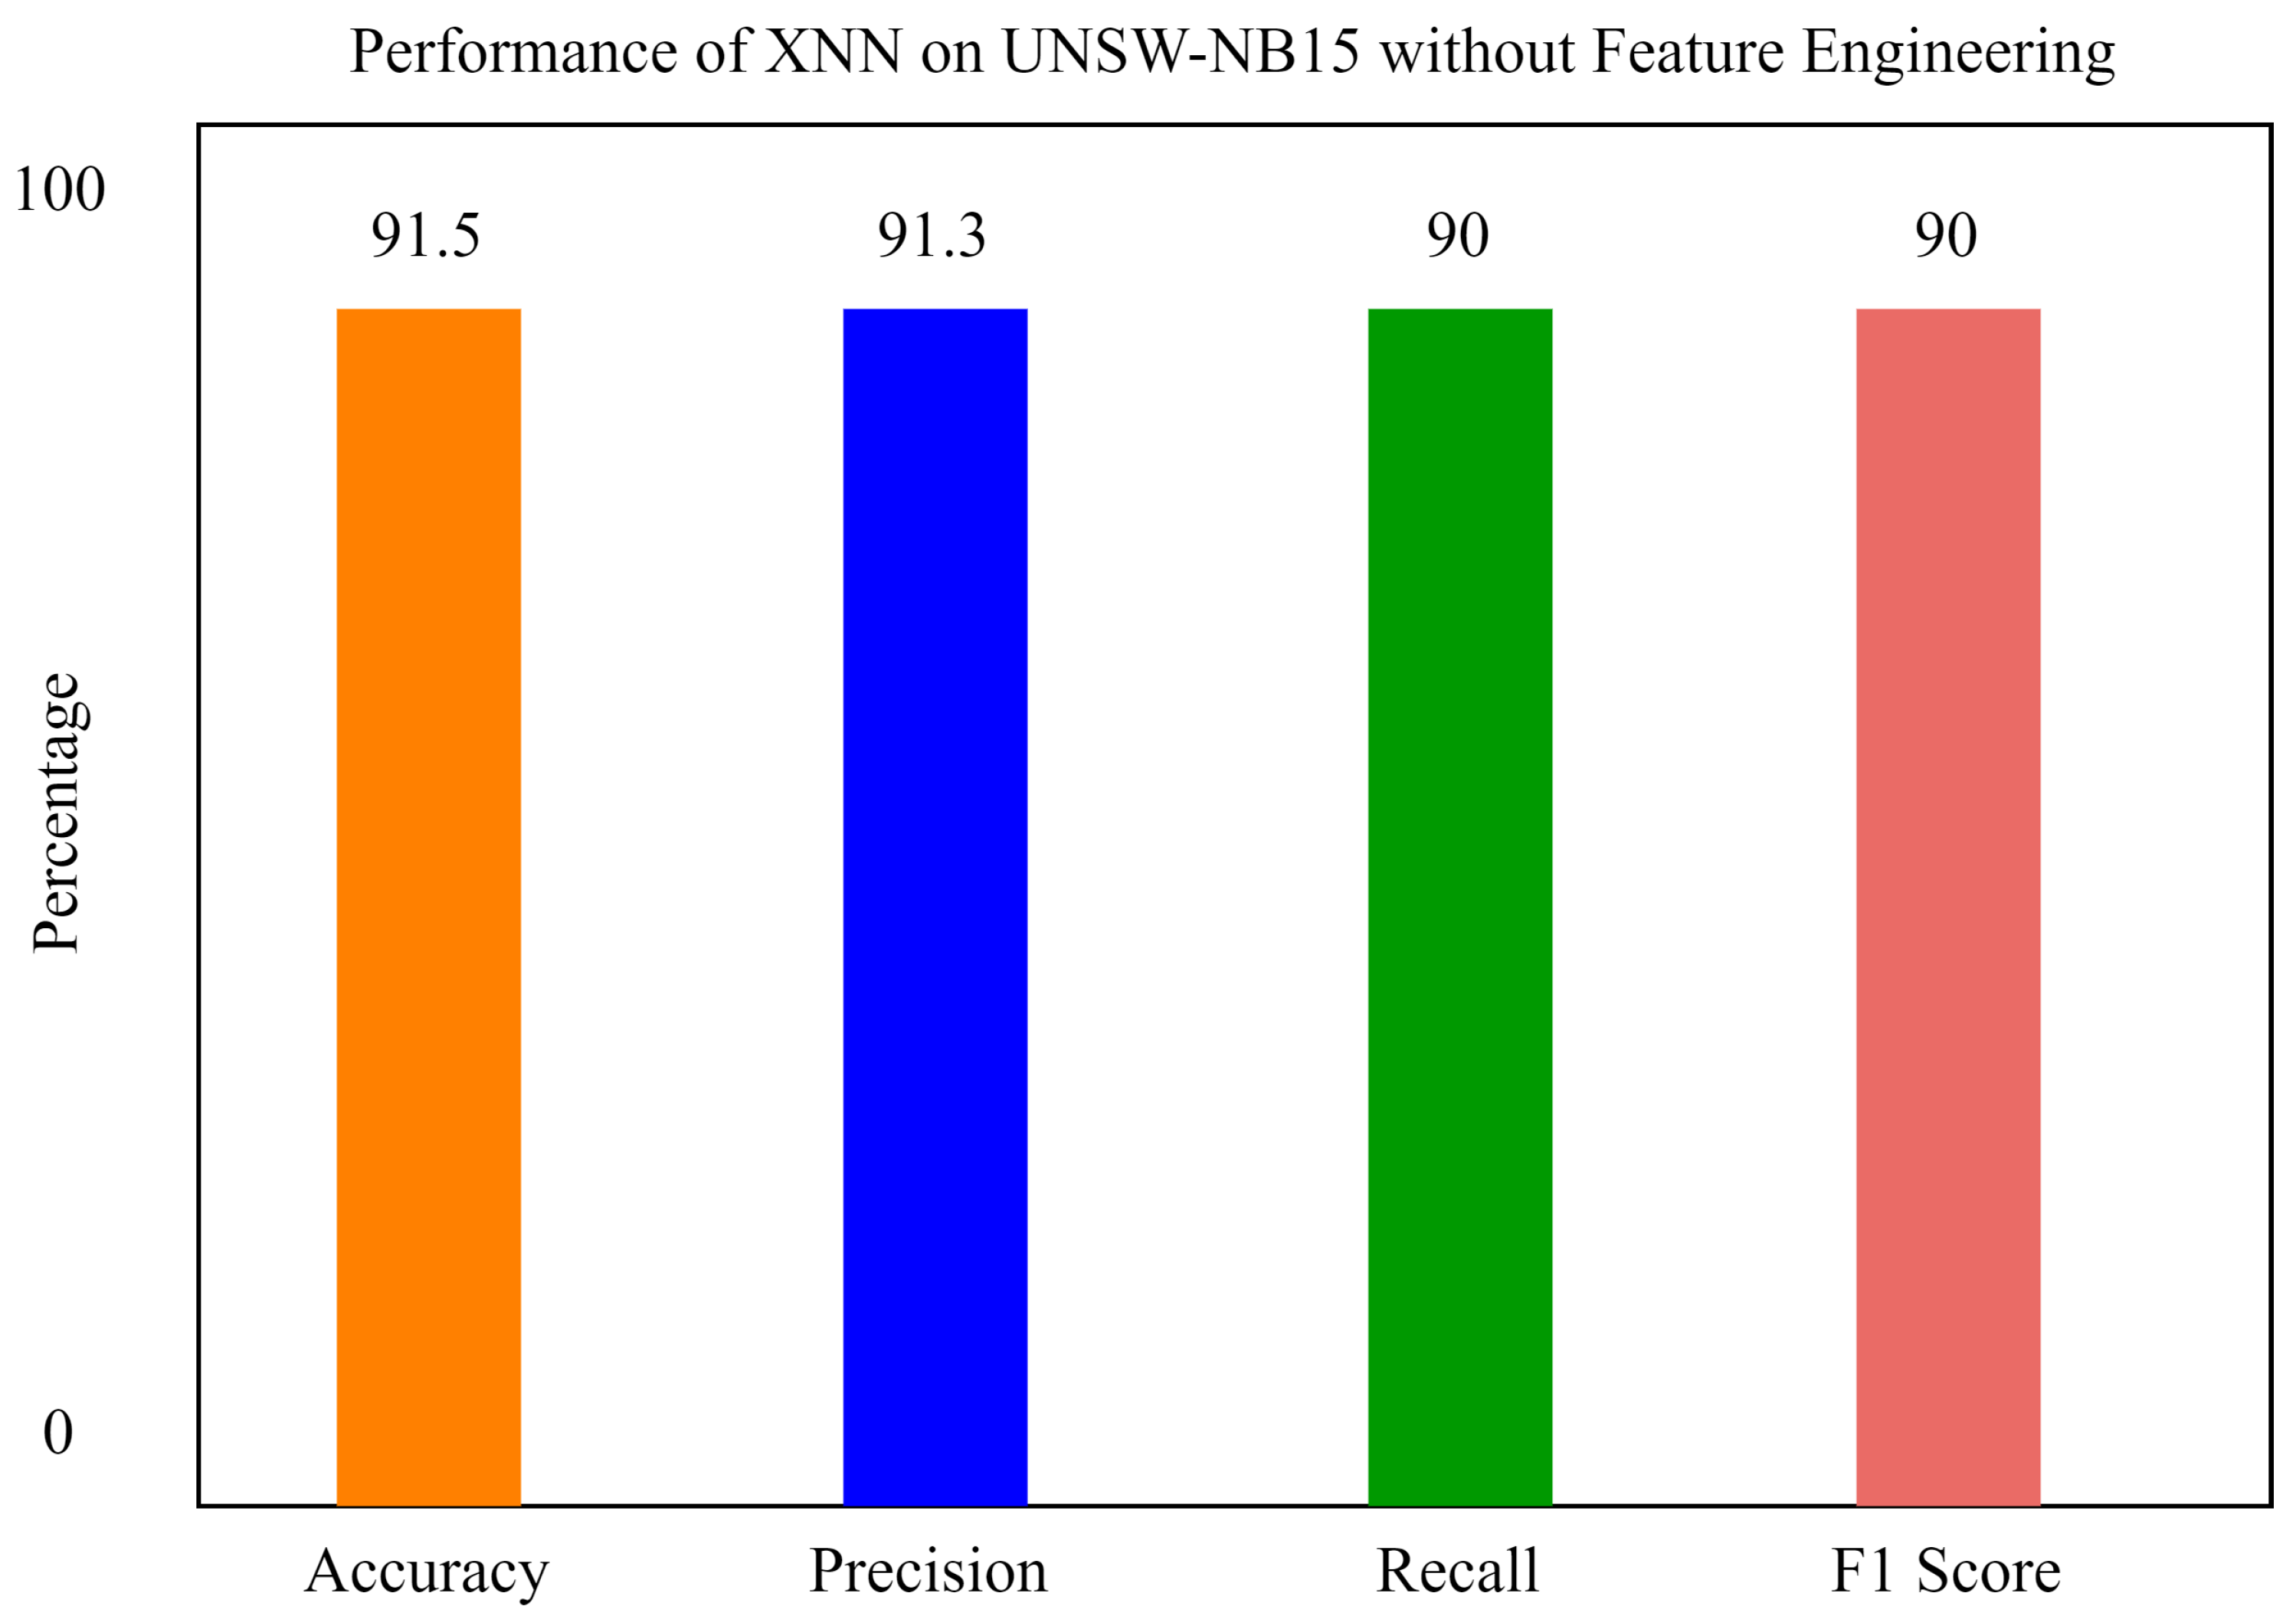
It can be seen from
Figure 9 that, without feature scoring, the accuracy of xNN is 91.5%, which is less than the accuracy with feature scoring. In the figure, the
y axis shows the percentage of accuracy, and the
x axis shows the accuracy, precision, recall, and F1 score of xNN.
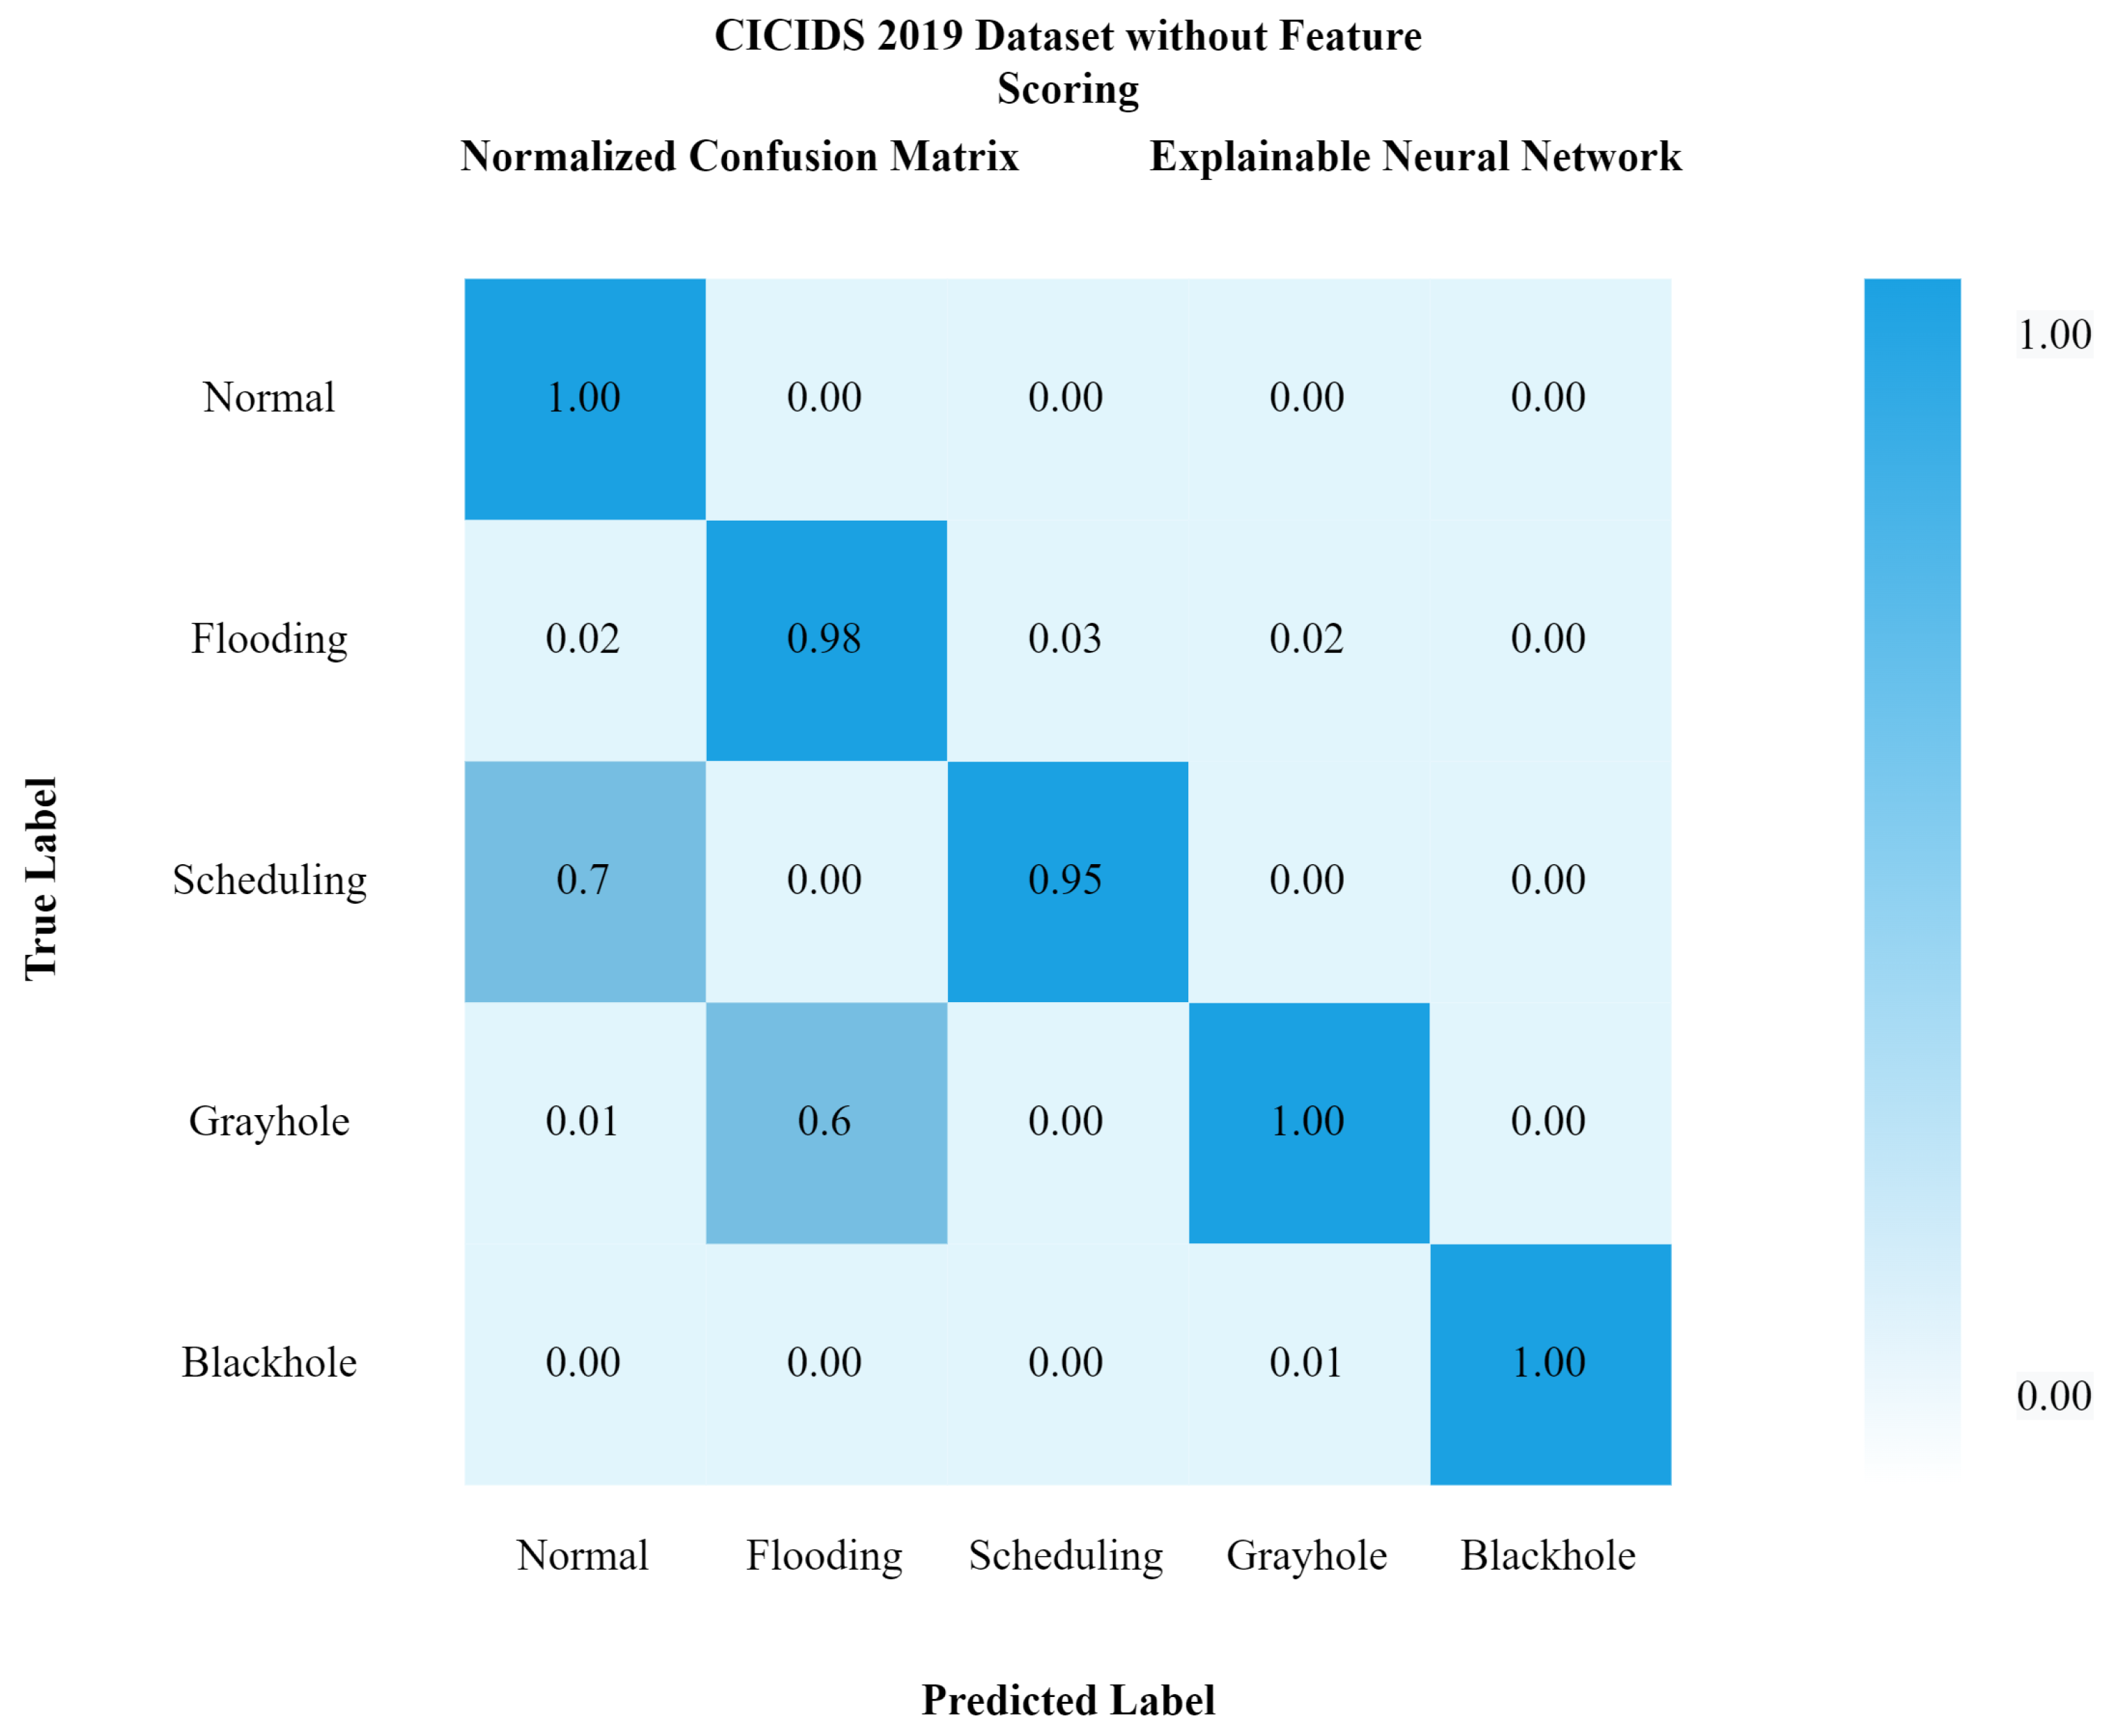
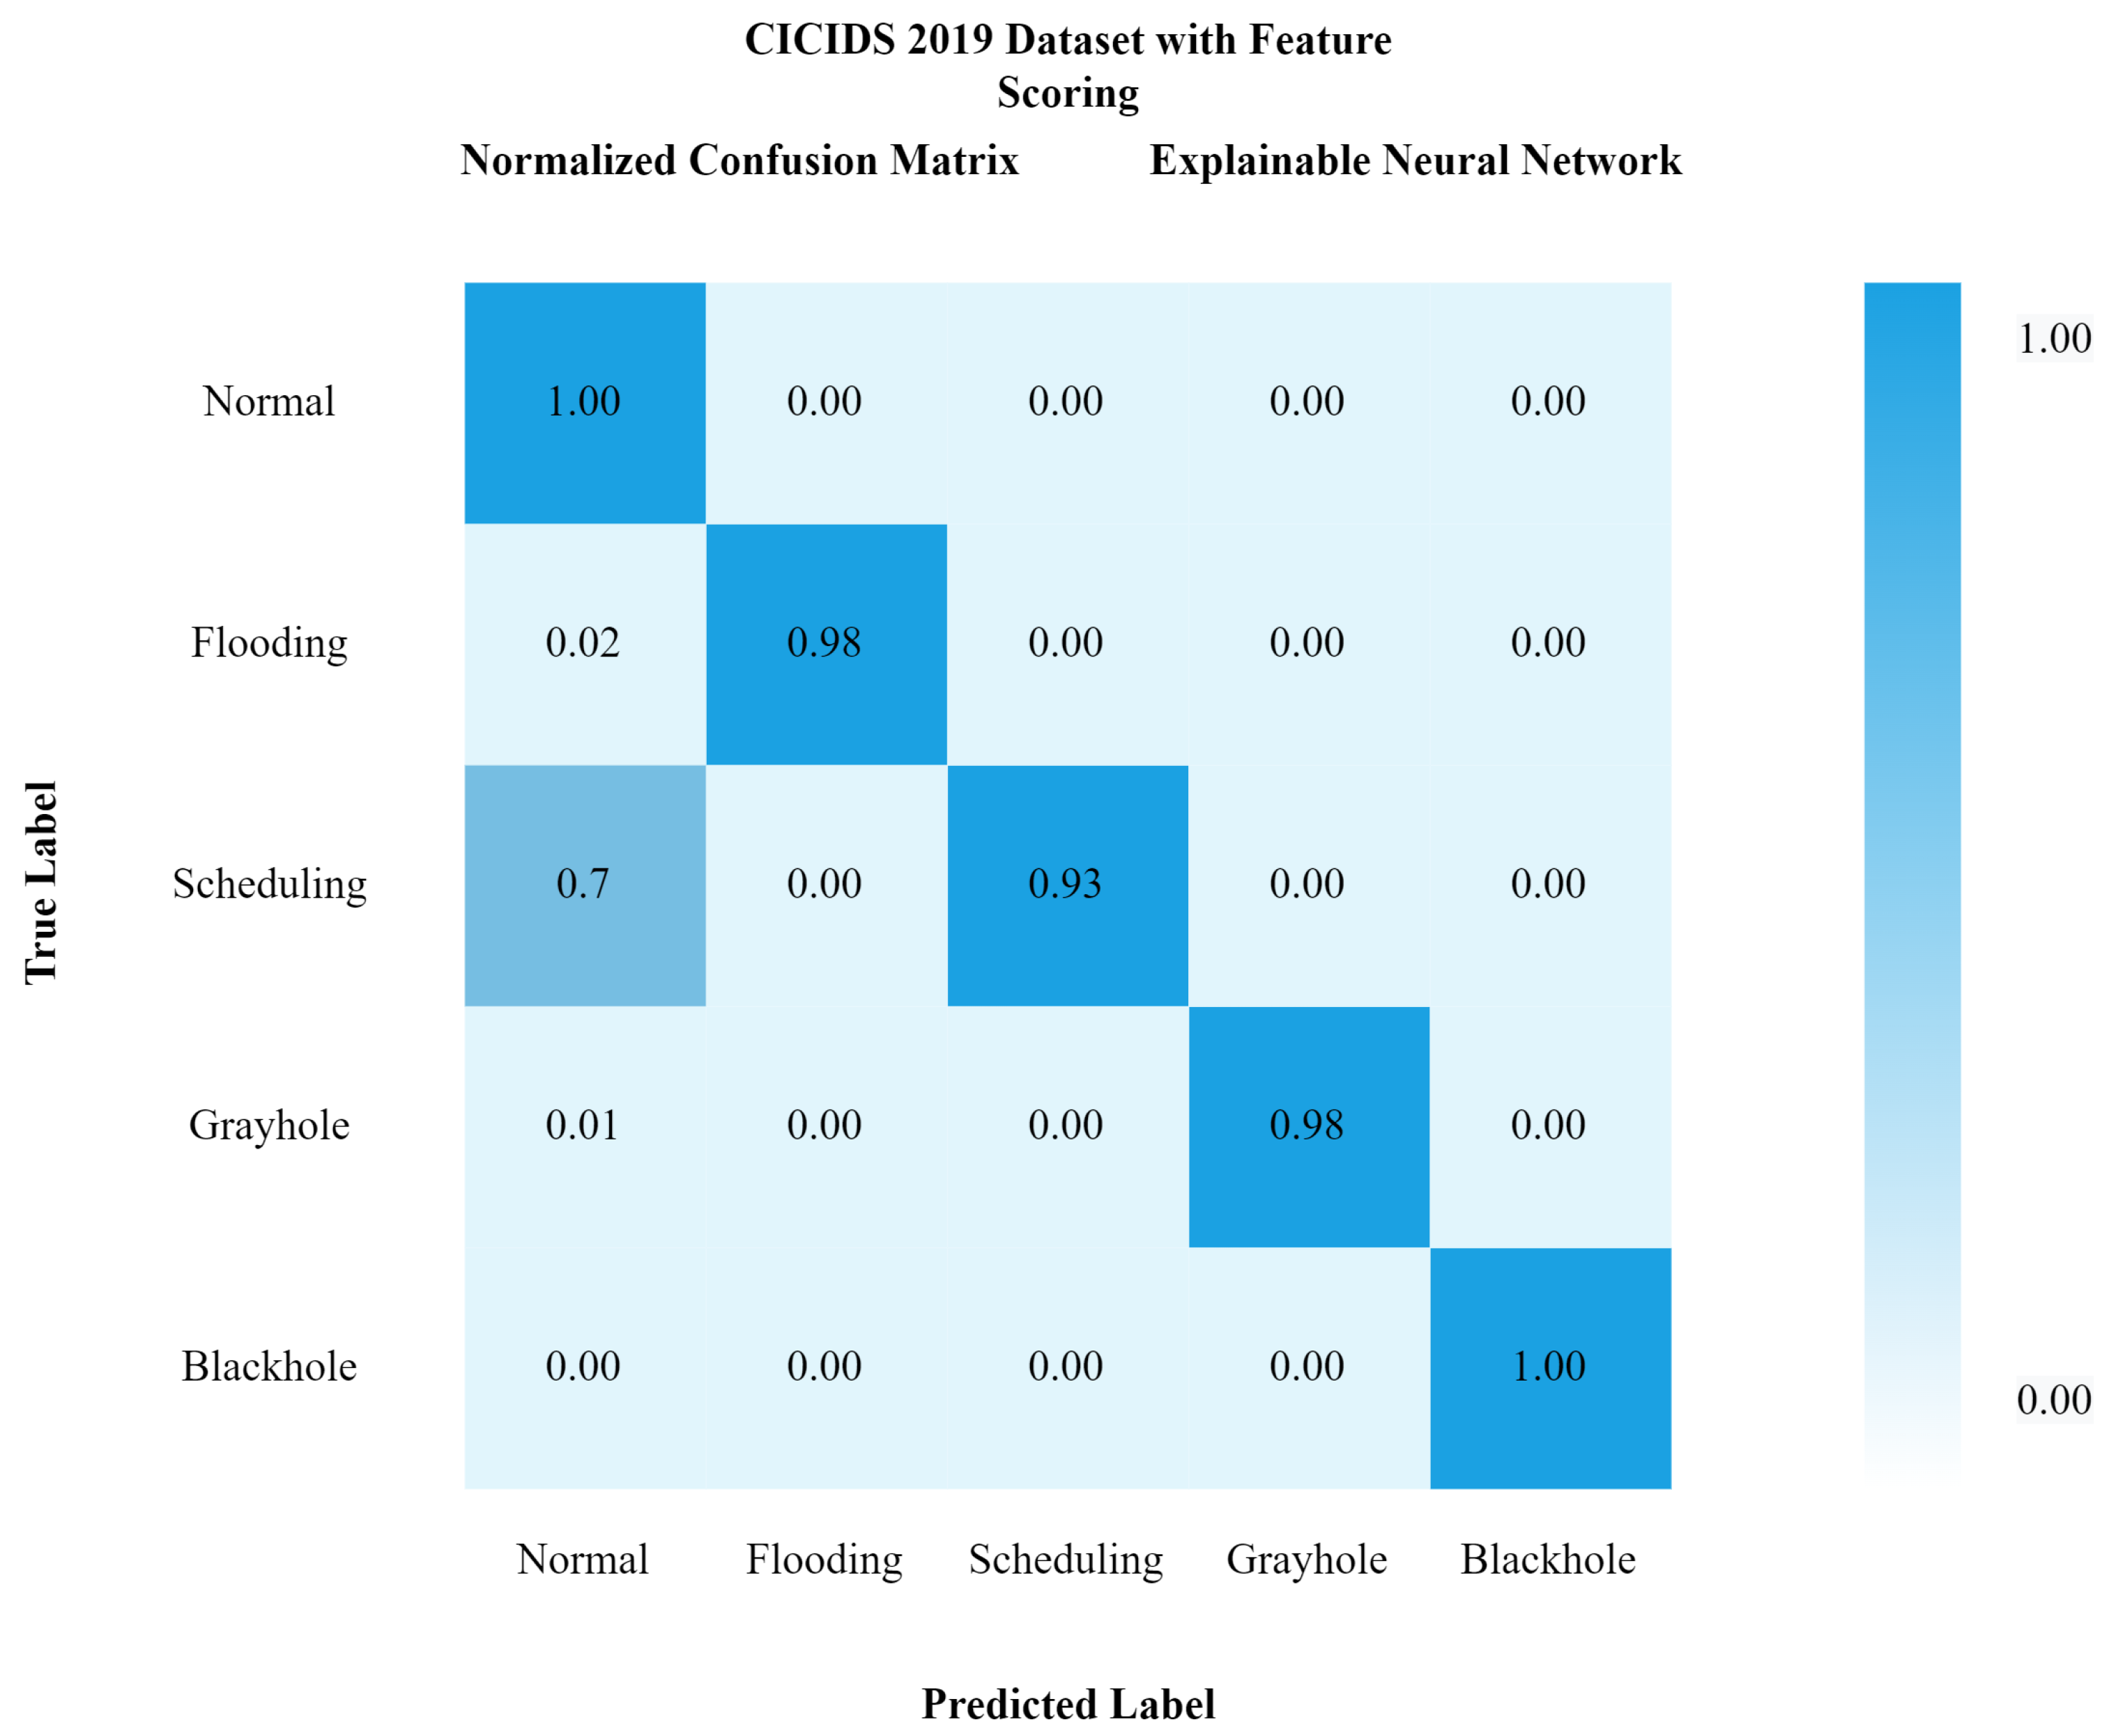
Figure 10 shows the confusion matrix with feature scoring, while
Figure 11 shows the confusion matrix without feature scoring. It can be seen from
Figure 10 that the true positive rate with feature scoring is much higher than without the feature scoring confusion matrix.
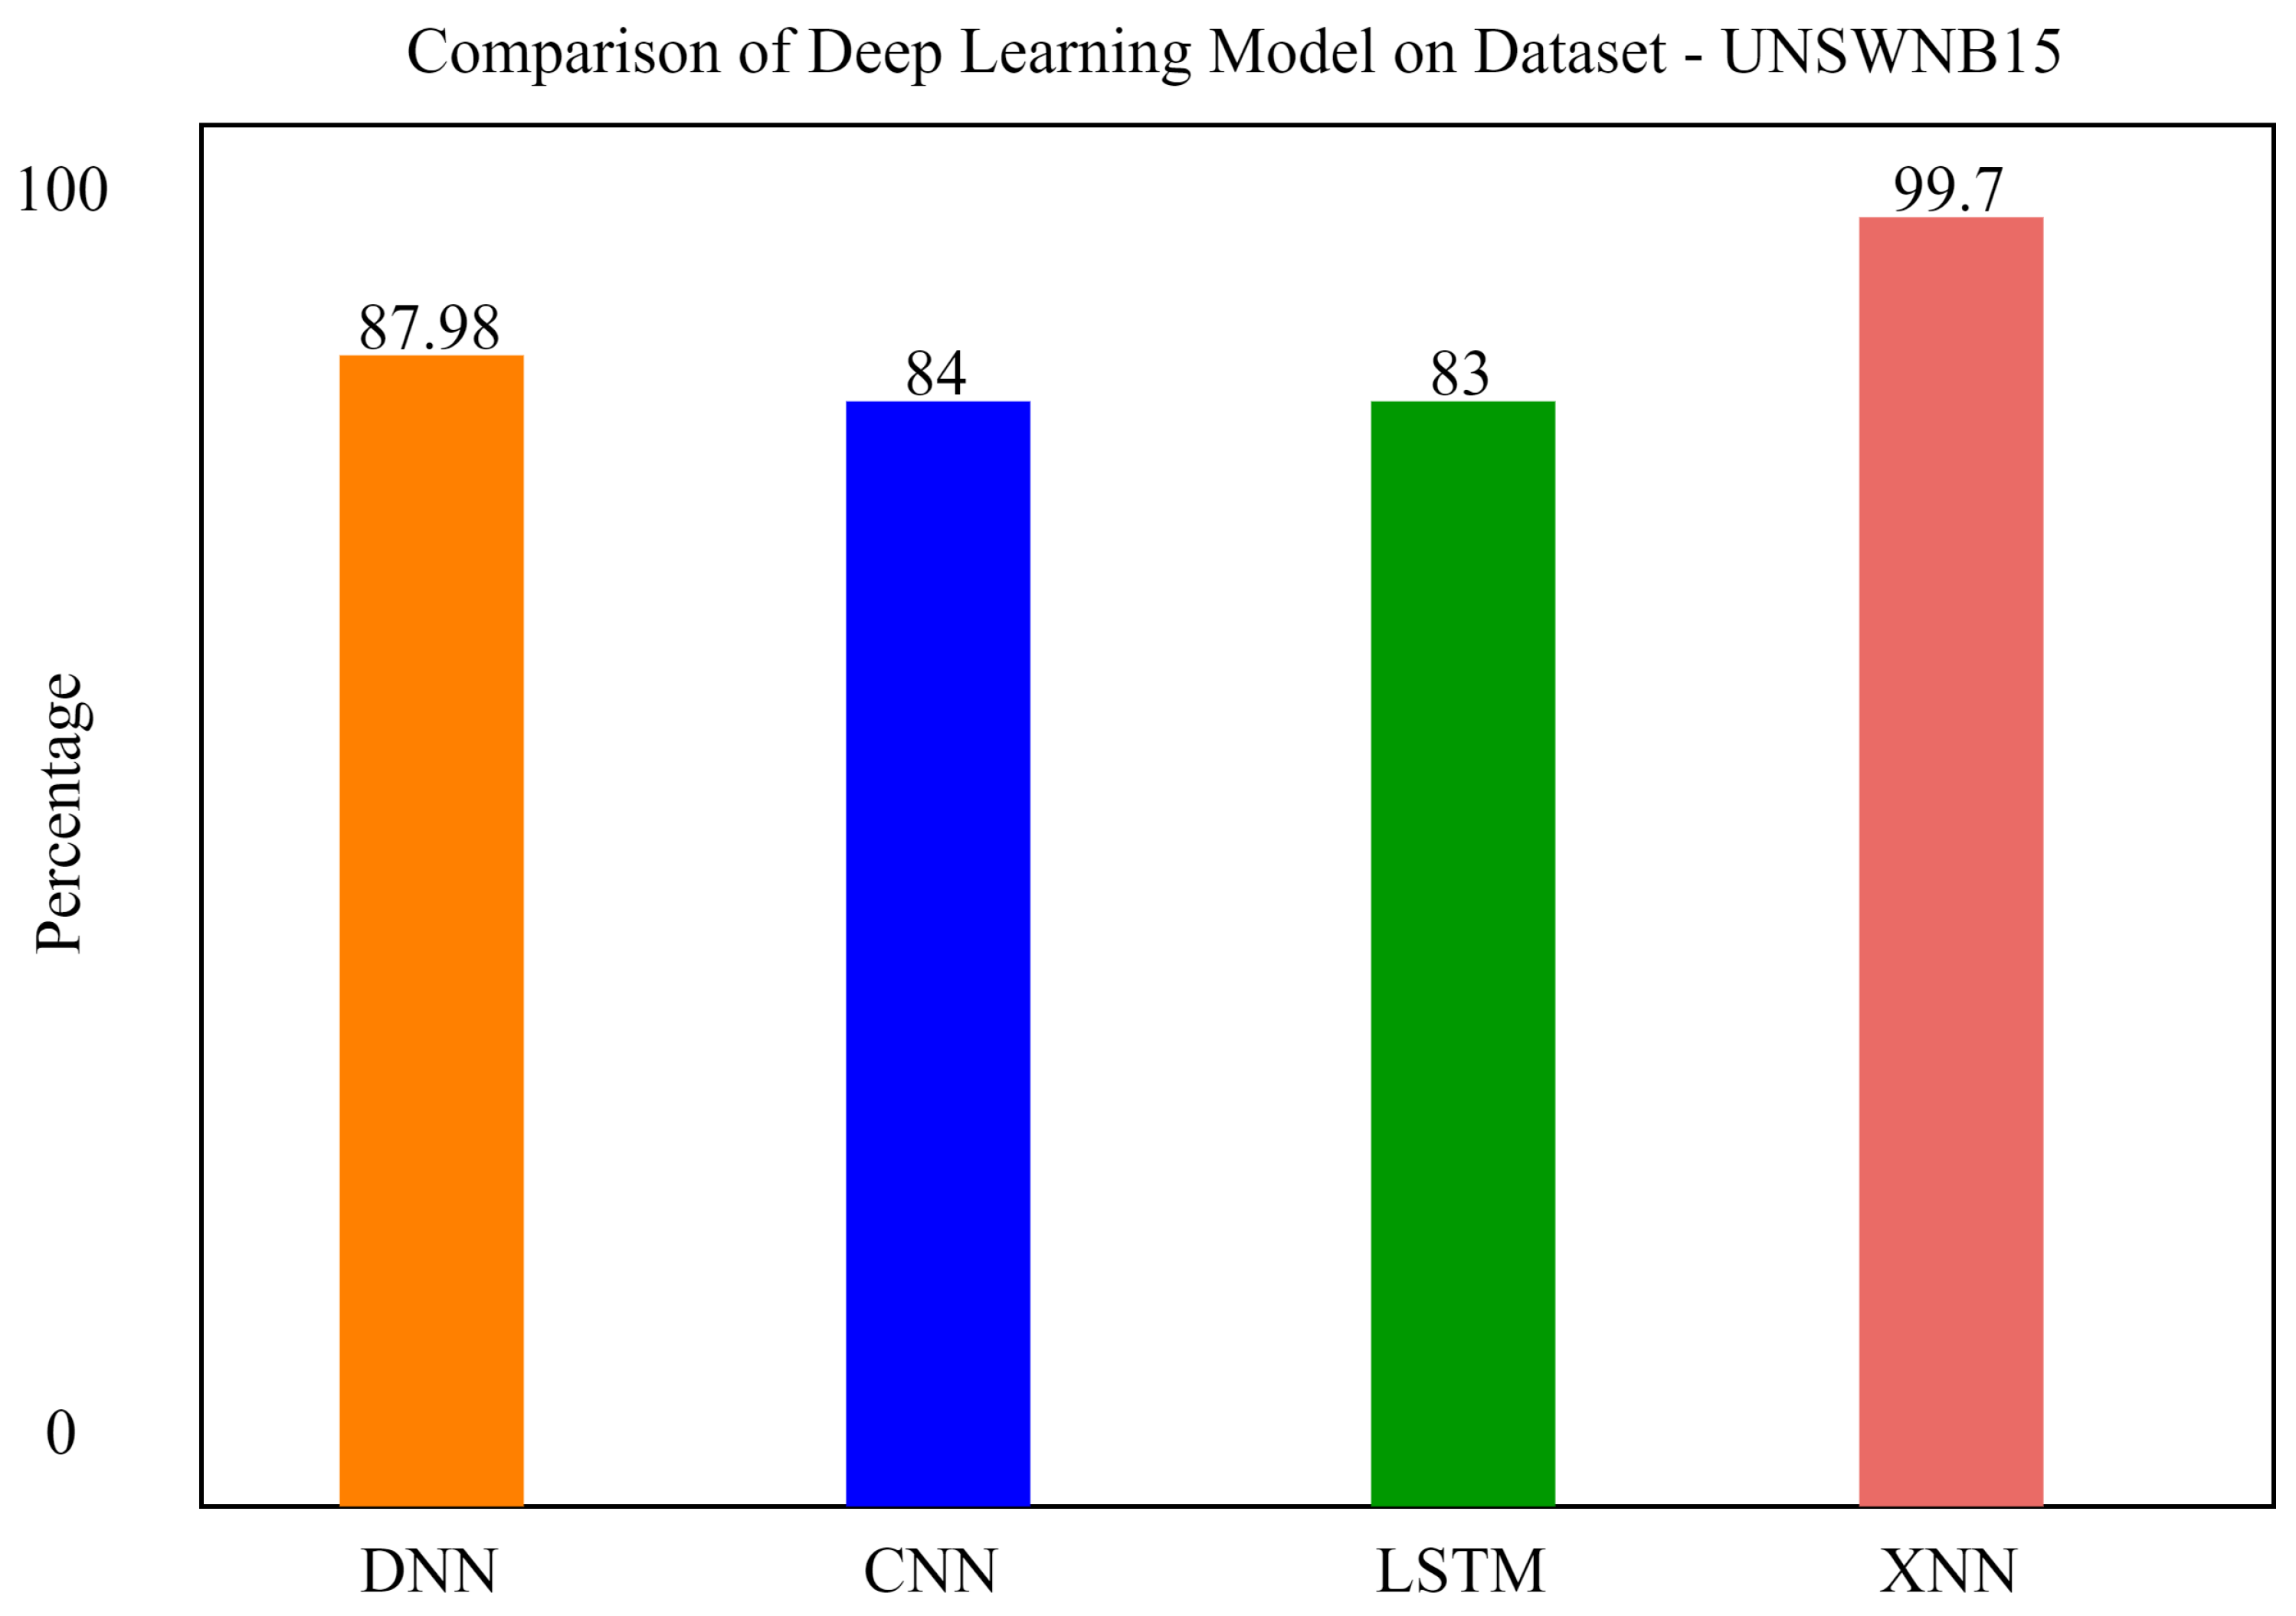
We also applied a Convolutional Neural Network and Long Short-Term Memory for the classification of attacks in order to compare our model with previous state-of-the-art models. xNN demonstrated promising accuracy and was the highest among the other deep-learning models. The comparison of deep-learning models for the classification of attacks in UNSW-NB15 is shown in
Figure 12. In the figure, the
y axis shows the percentage of accuracy, and the
x axis shows the model’s accuracy histogram.
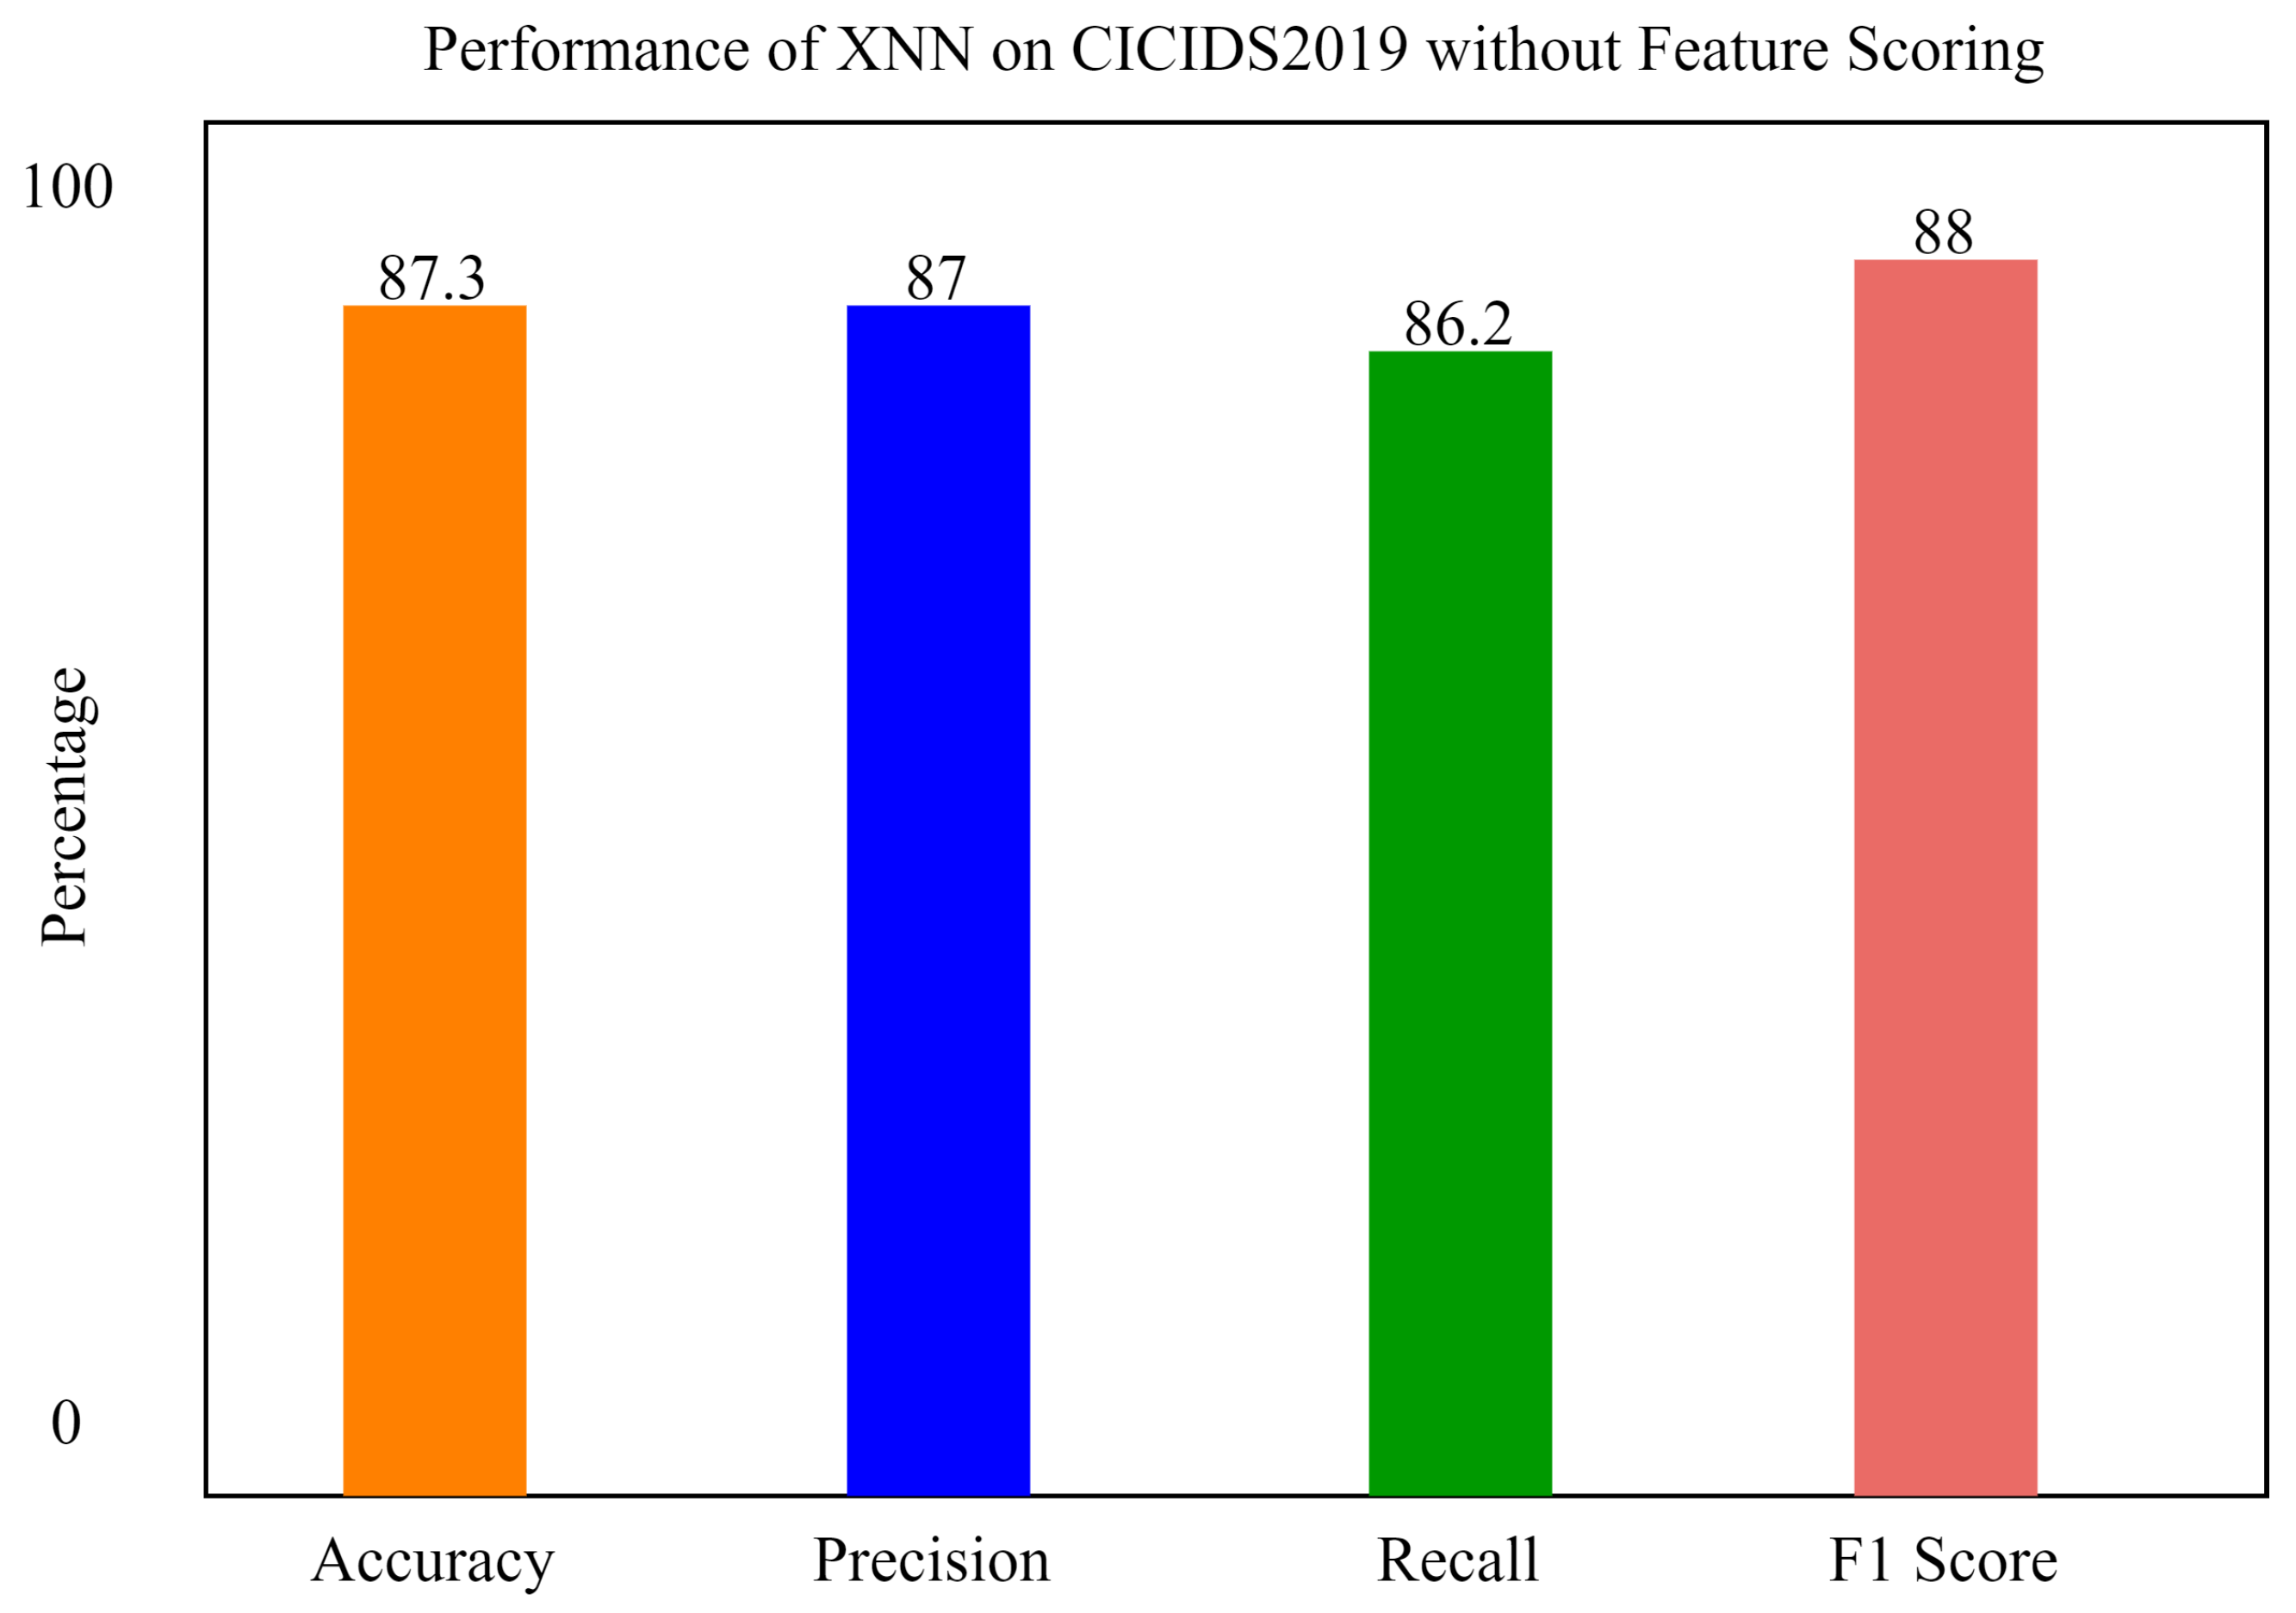
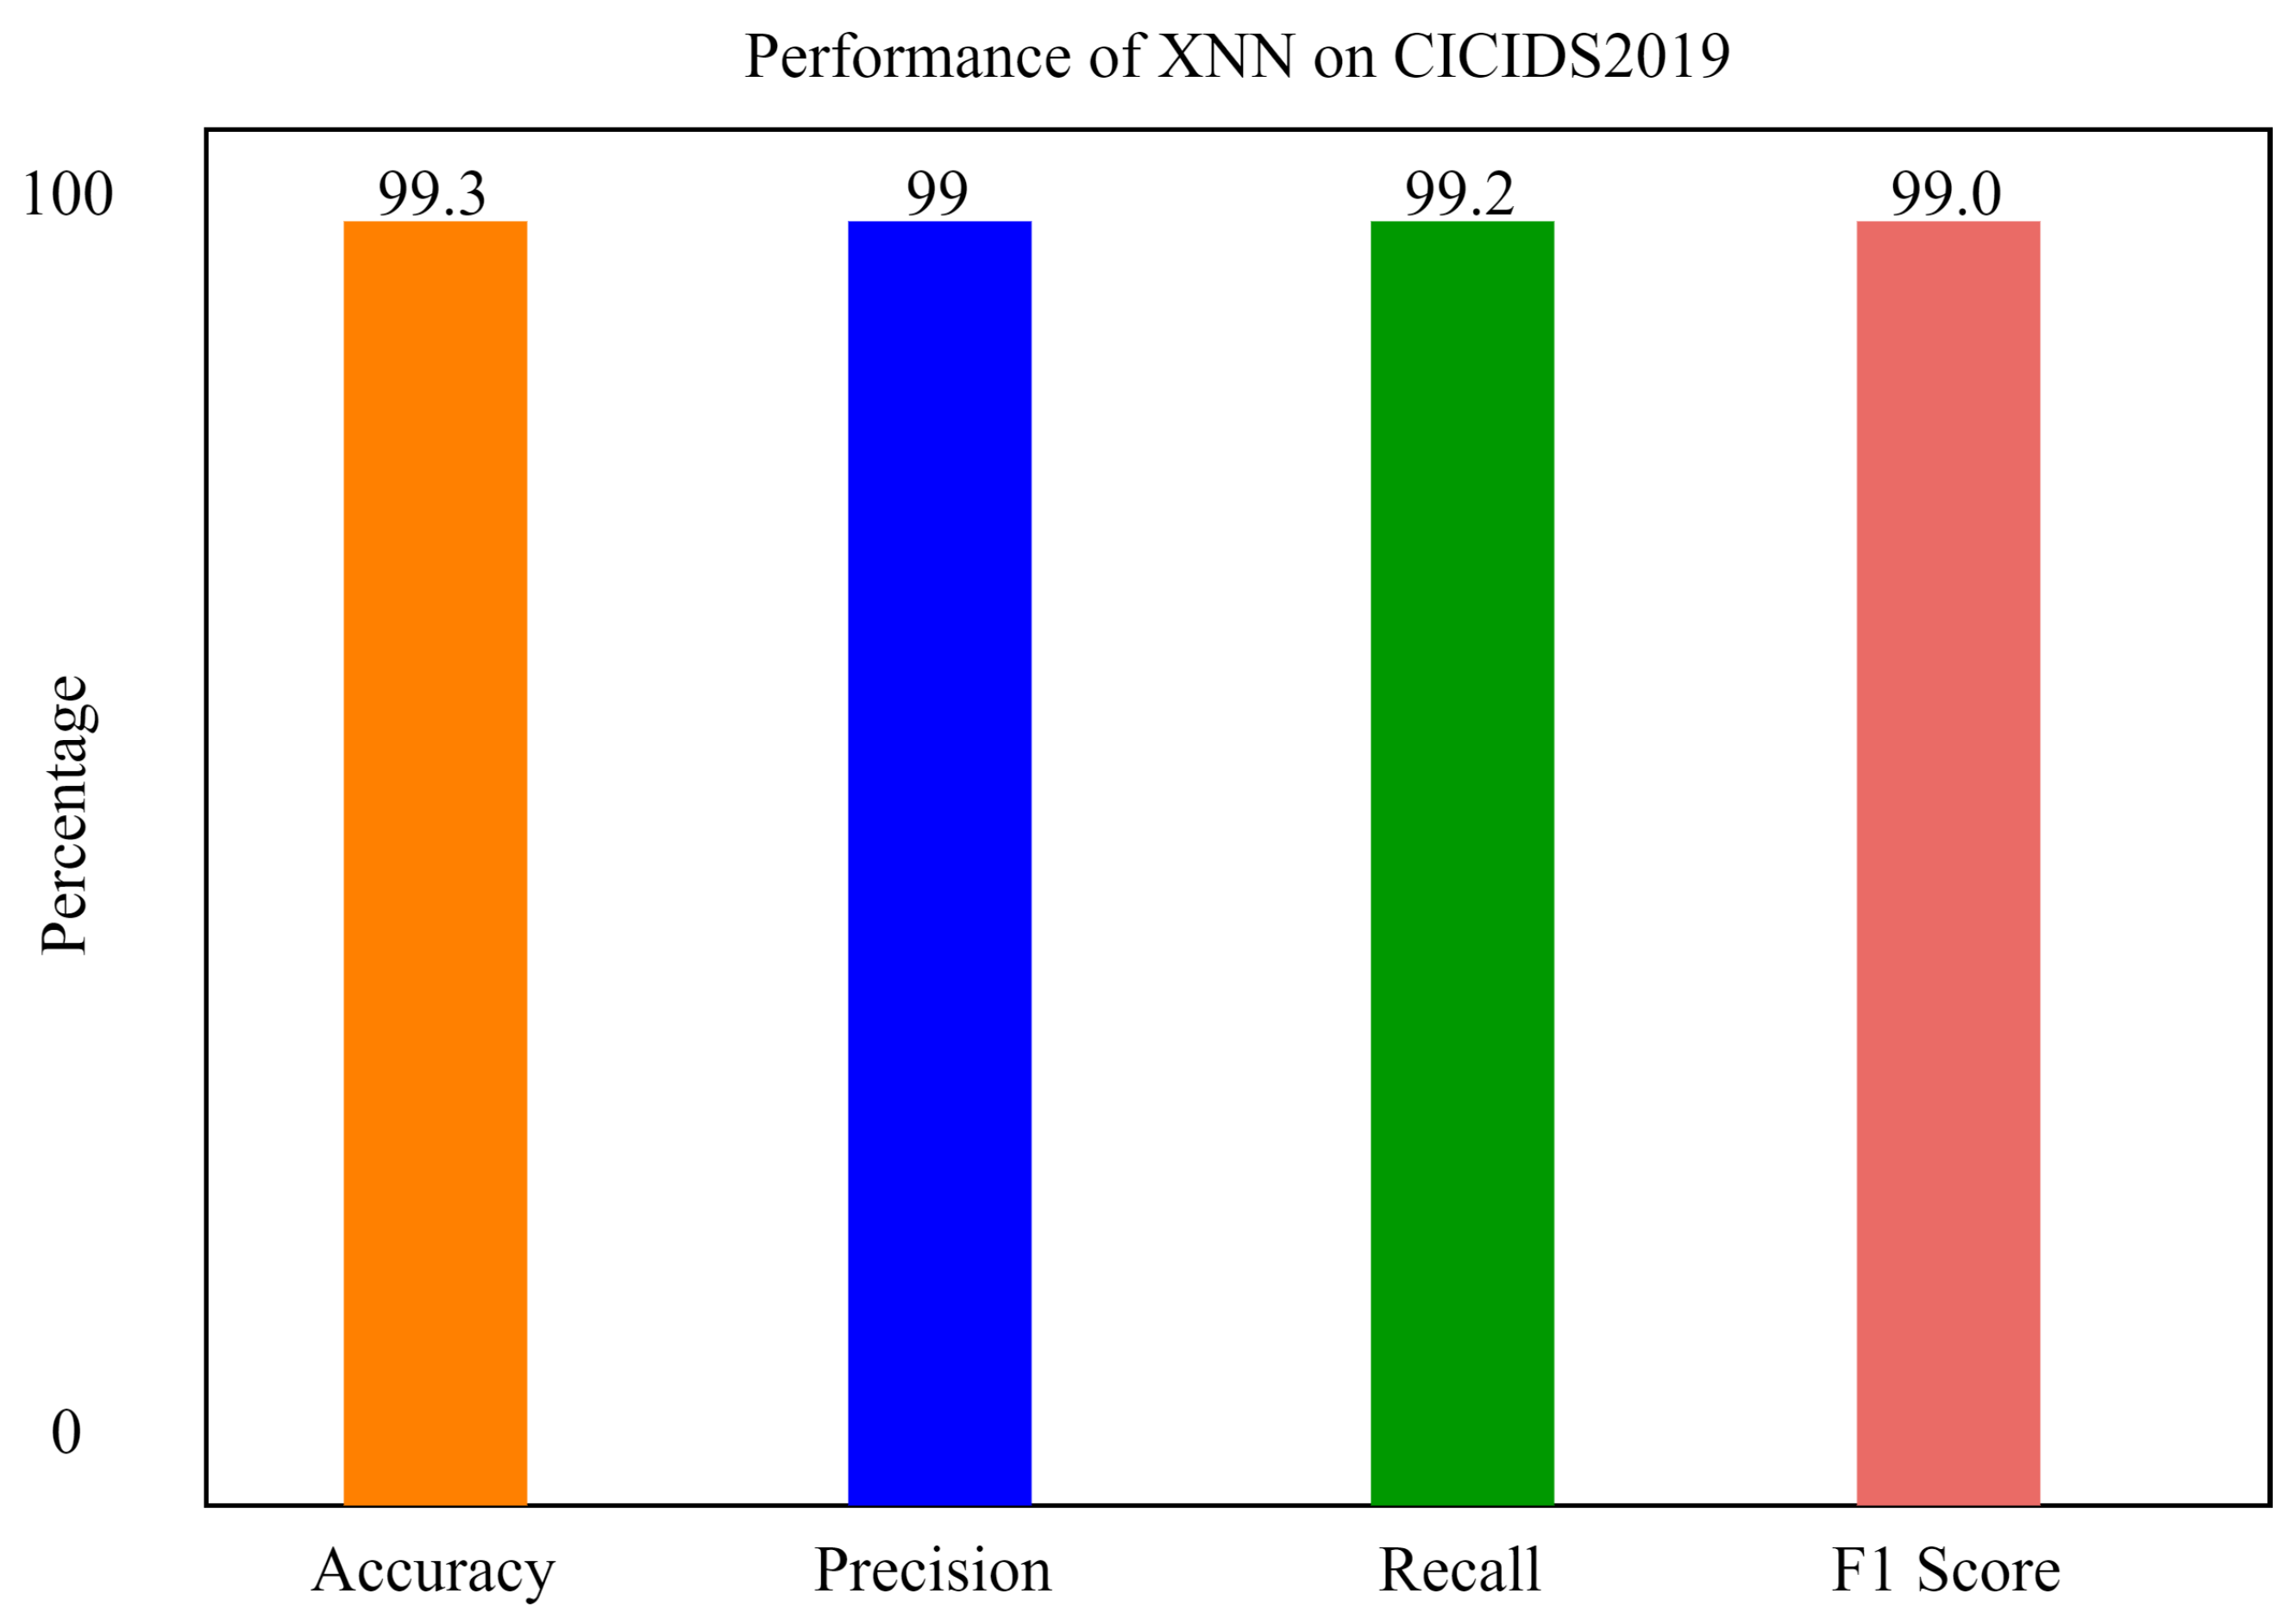
5.2. Performance of xNN on CICIDS2019
Figure 13 shows the performance of the xNN model on CICIDS2019 after applying the K-Means-clustering-based feature scoring method. This shows that the model was 99.3% accurate in classifying the attacks in the IoV-based dataset. In the
Figure 13 and
Figure 14, the
y axis shows the percentage of accuracy, and
x axis shows the model’s accuracy histogram.
It can be seen from
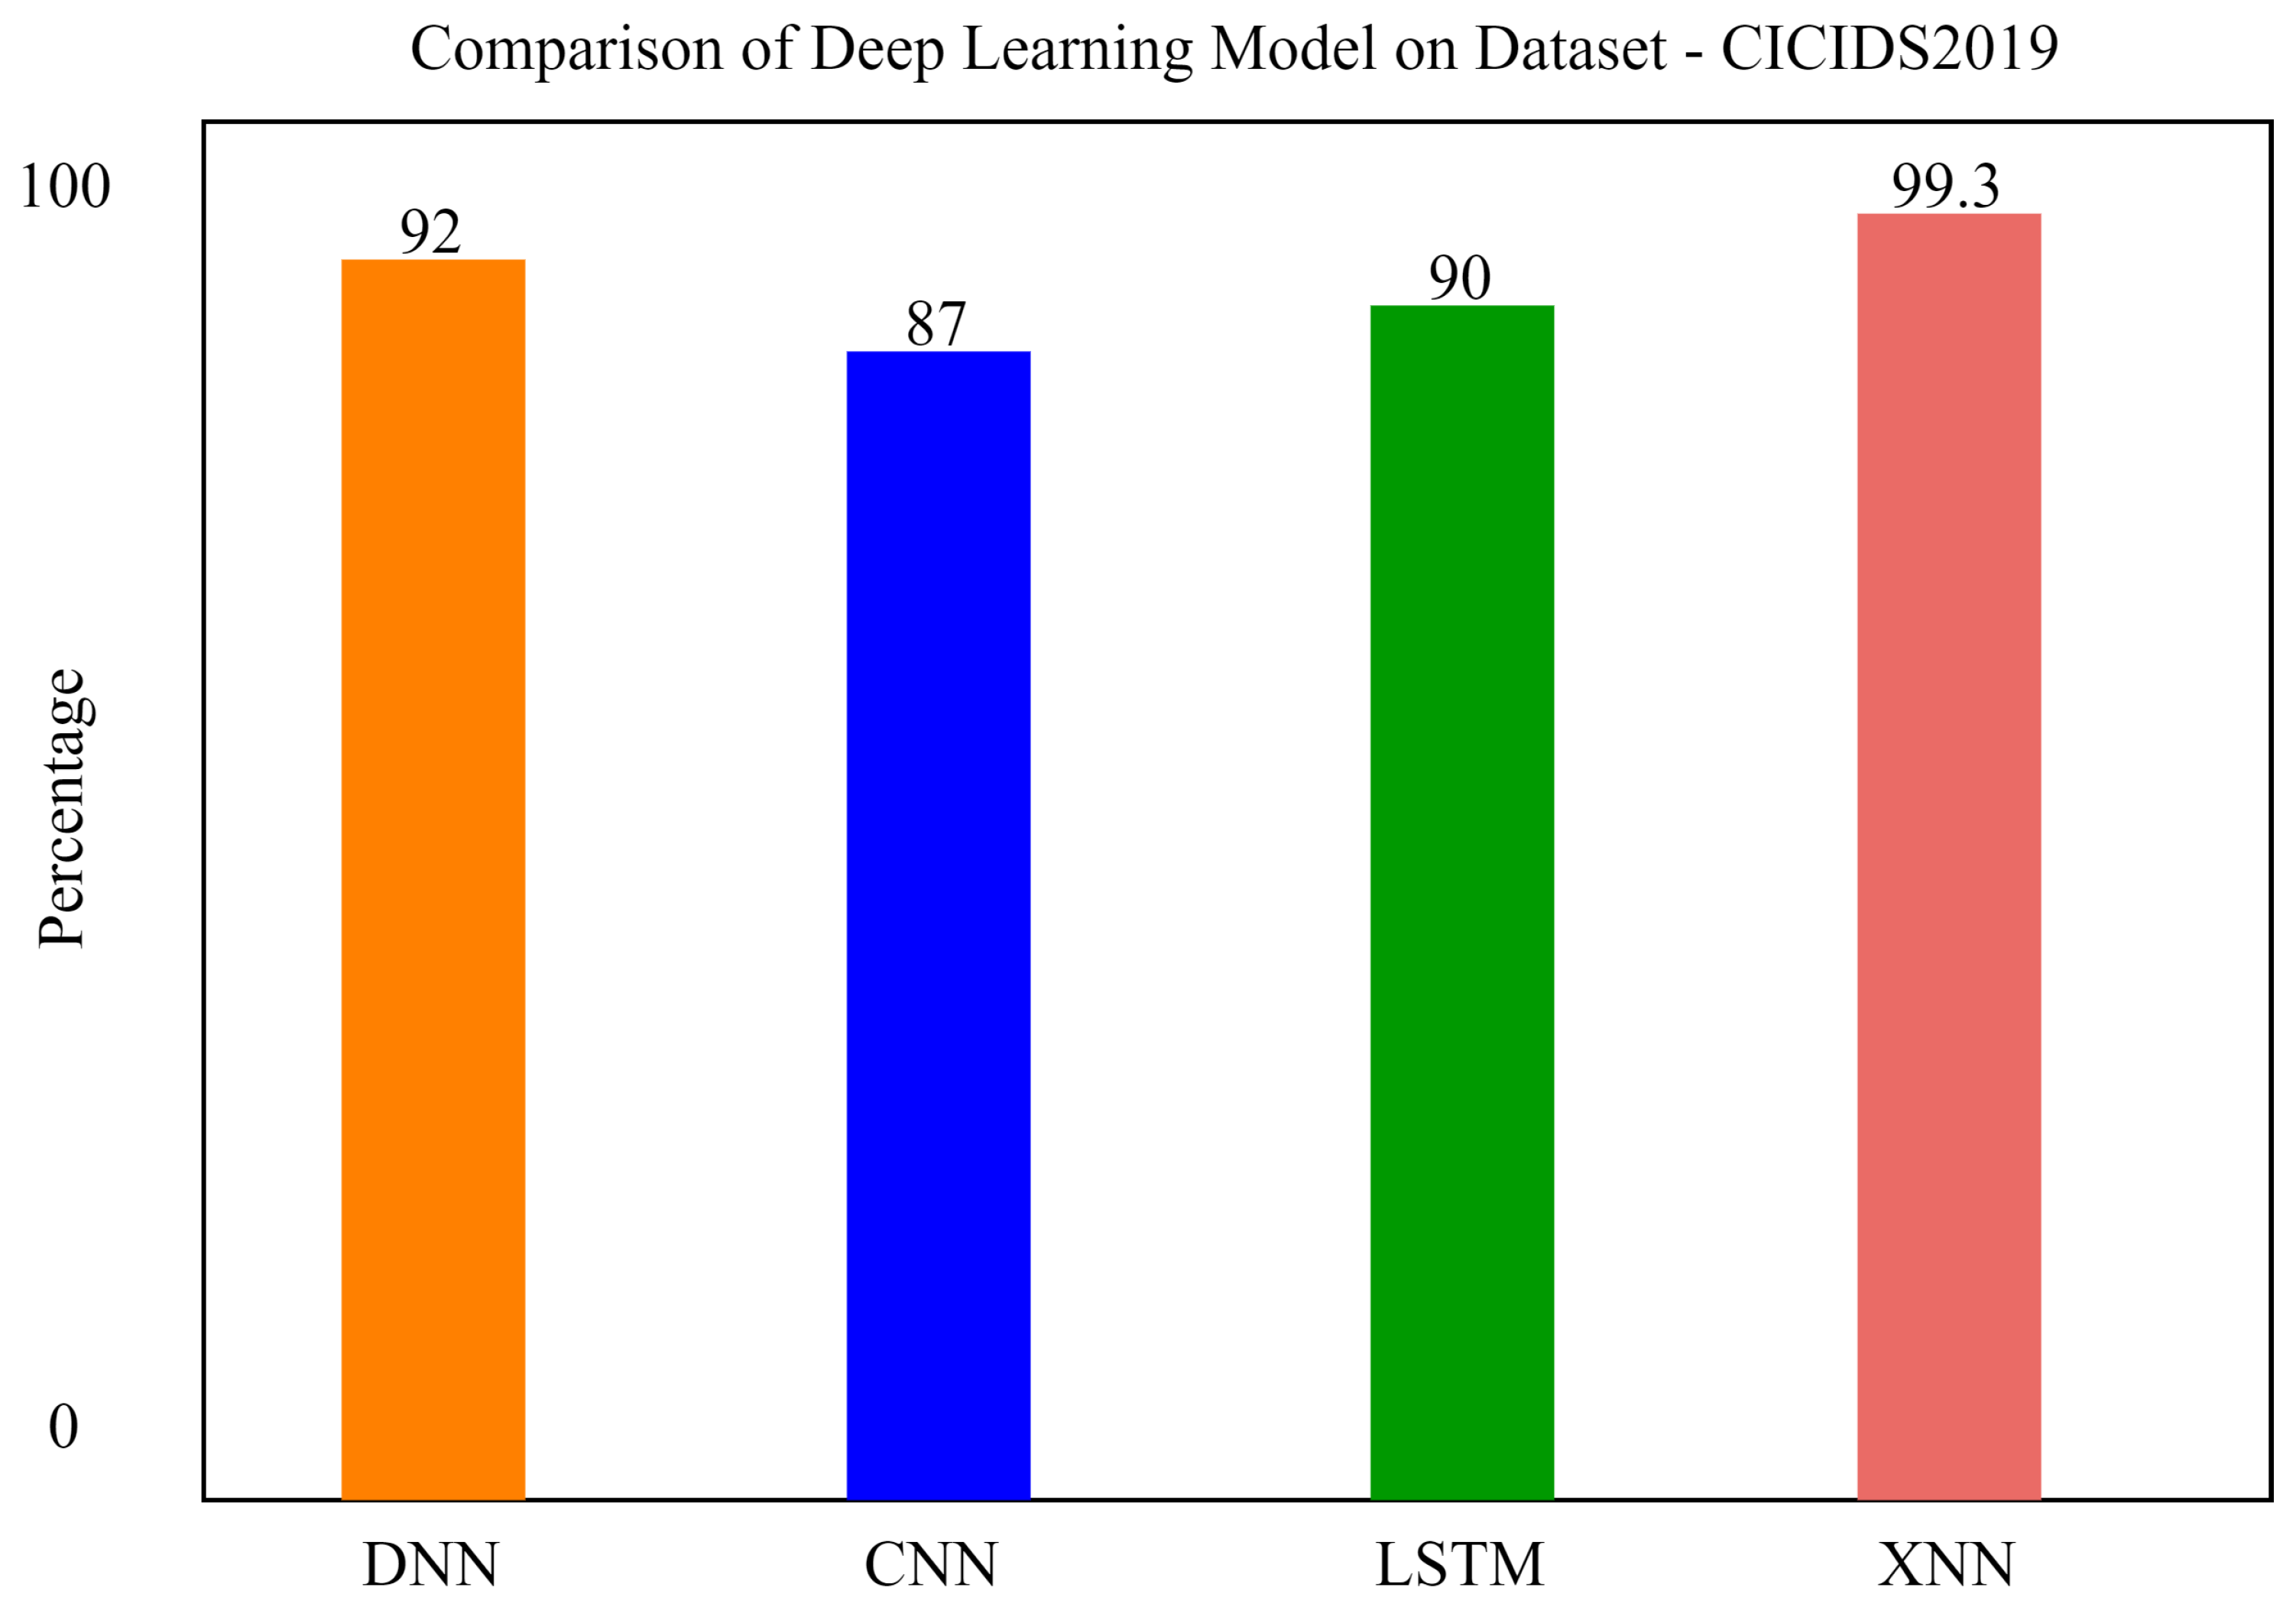
Figure 13 that, without feature scoring, the accuracy of xNN is 87.3%, which is less than the accuracy with feature scoring. We also applied a Convolutional Neural Network and Long Short-Term Memory for the classification of attacks in order to compare our model with previous state-of-the-art models. xNN demonstrated promising accuracy and was the highest among the other deep-learning models. The comparison of deep-learning models for the classification of attacks in CICIDS2019 is shown in the figure below. In the figure, the
y axis shows the percentage of accuracy, and the
x axis shows the model’s accuracy histogram.
Comparatively, it can be seen that our proposed model xNN performed well after the feature-scoring technique. In Dataset 1 (UNSW-NB15), xNN performed well with the highest accuracy of 99.7%, while CNN scored 87%, LSTM scored 90%, and DNN scored 92%, while in the classification of attacks in the second dataset (CICIDS2019) xNN scored the highest accuracy of 99.3%, CNN scored 87%, LSTM scored 89%, and DNN scored 82%.
Table 4 and
Table 5 shows the comparative analysis of deep-learning models proposed in this study to justify that xNN scored the highest accuracy and was a persistent model for the detection of intrusions on both datasets.
Figure 15,
Figure 16 and
Figure 17 show confusion matrix of xNN for CICIDS2019 with feature scoring, Confusion matrix of xNN for CICIDS2019 without feature scoring and comparison of the deep-learning model on the CICIDS2019 dataset, respectively.
We compared our model with previous research. In a comparative analysis, we found that our proposed model scored the highest accuracy with respect to some of the recent previous research techniques.
6. Conclusions
One of the most difficult challenges is in developing systems that can detect CAN message attacks as early as possible. Vehicle networks can be protected from cyber threats through the use of artificial-intelligence-based technology. When an intruder attempts to enter the autonomous vehicle, deep learning safeguards it. The CICIDS2019 and UNSW-NB15 security systems were utilized to evaluate our proposed security system. Preprocessing is the process of converting category data into numerical data. K-Means clustering was used to determine which features were the most important.
Detecting attack types in this dataset was accomplished through the use of an Explainable Neural Network (xNN). The precision, recall, F1 score, and accuracy were all high for the model, which were encouraging results. Following the application of the feature-scoring technique, it can be seen that our suggested model xNN outperformed the competition. In Dataset 1 (UNSW-NB15), xNN outperformed the competition, scoring 99.7% accuracy, while CNN scored 87% accuracy, LSTM scored 90% accuracy, and DNN scored 92% accuracy. In the classification of attacks in the second dataset (CICIDS2019), xNN achieved the highest accuracy of 99.3%, followed by CNN with 87% accuracy, LSTM with 89% accuracy, and DNN with 82% accuracy.
With regard to accuracy in detection and classification, as well as real-time CAN bus security, the proposed approach outperformed the existing solutions in the study. Furthermore, this work can be extended to real-world scenarios and real-time controlled vehicles as well as on autonomous systems to protect against malicious attacks. The data package in the protocol analysed with the maximum values by applying the high-performance xNN model would be preferable for use in the future to reduce and eliminate security attacks, such as for the IoV.
Author Contributions
Data curation, S.A.; Funding acquisition, K.-H.L.; Investigation, S.A. and M.T.F.; Methodology, S.A.; Project administration, K.-H.L.; Resources, K.-H.L.; Software, A.M.A. and M.I.; Validation, K.N.H. and M.I.; Writing—original draft, S.A.; Writing—review & editing, A.M.A., K.-H.L., K.N.H. and L.X. All authors have read and agreed to the published version of the manuscript.
Funding
This research received no external funding.
Institutional Review Board Statement
Not applicable.
Informed Consent Statement
Not applicable.
Acknowledgments
The work presented in this article is supported by Centre for Advances in Reliability and Safety (CAiRS) admitted under AIR@InnoHK Research Cluster.
Conflicts of Interest
The authors declare no conflict of interest.
Abbreviations
The following abbreviations are used in this manuscript:
| ANN | Artificial Neural Network |
| CICIDS | Canadian Institute for Obscurity Intrusion Detection System |
| CNN | Convolutional Neural Network |
| DT | Decision Trees |
| DFEL | Deep Feature Embedding Learning |
| DL | Deep Learning |
| DeeRaI | Deep Radial Intelligence |
| DoS | Denial of Service |
| DNS | Domain Name System |
| FTP | File Transfer Protocol |
| GNB | Gaussian Naive Bayes |
| GBT | Gradient Boosting Tree |
| HTTP | Hyper Text Transfer Protocol |
| IoT | Internet of Things |
| IP | Internet Protocol |
| IG | Information Gain |
| ID | Intrusion Detection |
| IDS | Intrusion Detection System |
| KNN | K-Nearest Neighbors |
| LR | Logistic Regression |
| LSTM | Long Short-Term Memory |
| ML | Machine Learning |
| MQTT | Message Queuing Telemetry Transport |
| MADAMID | Mining Audit Data for ID Automated Models |
| MLP | Multi-Layer Perceptron |
| NB | Naive Bayes |
| NIDS | Network Intrusion Detection System |
| NIMS | Network Information Management and Security Group |
| PCA | Principle Component Analysis |
| RBF | Radial Basis Function |
| RF | Random Forest |
| R2L | Remote to Local |
| RBM | Restricted Boltzmann Machine |
| RNN | Recurrent Neural Network |
| SOM | Self-Organizing Maps |
| SNN | Shared Nearest Neighbor |
| SVM | Support Vector Machine |
| TCP | Transmission Control Protocol |
| U2R | User to Root |
| UNSW | University of New South Wales |
| VANETS | Vehicular Ad hoc Networks |
| xNN | Explainable Neural Network |
References
- Yang, L.; Moubayed, A.; Shami, A. MTH-IDS: A Multitiered Hybrid Intrusion Detection System for Internet of Vehicles. IEEE Internet Things J. 2021, 9, 616–632. [Google Scholar] [CrossRef]
- Irshad, M.; Liu, W.; Wang, L.; Khalil, M.U.R. Cogent Machine Learning Algorithm for Indoor and Underwater Localization Using Visible Light Spectrum. Wirel. Pers. Commun. 2021, 116, 993–1008. [Google Scholar] [CrossRef]
- Wu, W.; Li, R.; Xie, G.; An, J.; Bai, Y.; Zhou, J.; Li, K. A Survey of Intrusion Detection for In-Vehicle Networks. IEEE Trans. Intell. Transp. Syst. 2020, 21, 919–933. [Google Scholar] [CrossRef]
- Alshammari, A.; Zohdy, M.A.; Debnath, D.; Corser, G. Classification Approach for Intrusion Detection in Vehicle Systems. Wirel. Eng. Technol. 2018, 9, 79–94. [Google Scholar] [CrossRef] [Green Version]
- Raziq, Y.; Sadiq, A.; Ali, H.; Asar, A.A. AI and Blockchain Integrated Billing Architecture for Charging the Roaming Electric Vehicles. IoT 2020, 7, 382–397. [Google Scholar] [CrossRef]
- Li, Y.; Xue, W.; Wu, T.; Wang, H.; Zhou, B.; Aziz, S.; He, Y. Intrusion detection of cyber physical energy system based on multivariate ensemble classification. Energy 2021, 218, 119505. [Google Scholar] [CrossRef]
- Garg, S.; Singh, A.; Aujla, G.S.; Kaur, S.; Batra, S.; Kumar, N. A Probabilistic Data Structures-Based Anomaly Detection Scheme for Software-Defined Internet of Vehicles. IEEE Trans. Intell. Transp. Syst. 2021, 22, 3557–3566. [Google Scholar] [CrossRef]
- Xiao, J.; Wu, H.; Li, X. Internet of Things Meets Vehicles: Sheltering In-Vehicle Network through Lightweight Machine Learning. Symmetry 2019, 11, 1388. [Google Scholar] [CrossRef] [Green Version]
- Ding, N.; Ma, H.; Zhao, C.; Ma, Y.; Ge, H. Driver’s Emotional State-Based Data Anomaly Detection for Vehicular Ad Hoc Networks. In Proceedings of the 2019 IEEE International Conference on Smart Internet of Things (SmartIoT), Tianjin, China, 9–11 August 2019; pp. 121–126. [Google Scholar]
- Li, X.; Hu, Z.; Xu, M.; Wang, Y.; Ma, J. Transfer learning based intrusion detection scheme for Internet of vehicles. Inf. Sci. 2021, 547, 119–135. [Google Scholar] [CrossRef]
- Rajbahadur, G.K.; Malton, A.J.; Walenstein, A.; Hassan, A.E. A Survey of Anomaly Detection for Connected Vehicle Cybersecurity and Safety. In Proceedings of the 2018 IEEE Intelligent Vehicles Symposium (IV), Suzhou, China, 26–30 June 2018; pp. 421–426. [Google Scholar] [CrossRef]
- Joy, J.; Rabsatt, V.; Gerla, M. Internet of Vehicles: Enabling safe, secure, and private vehicular crowdsourcing. Internet Technol. Lett. 2018, 1, e16. [Google Scholar] [CrossRef] [Green Version]
- Muter, M.; Groll, A.; Freiling, F.C. A structured approach to anomaly detection for in-vehicle networks. In Proceedings of the 2010 Sixth International Conference on Information Assurance and Security, Atlanta, GA, USA, 23–25 August 2010; pp. 92–98. [Google Scholar] [CrossRef]
- Negi, N.; Jelassi, O.; Chaouchi, H.; Clemencon, S. Distributed online Data Anomaly Detection for connected vehicles. In Proceedings of the 2020 International Conference on Artificial Intelligence in Information and Communication (ICAIIC), Fukuoka, Japan, 19–21 February 2020; pp. 494–500. [Google Scholar] [CrossRef]
- Wang, W.; Xia, F.; Nie, H.; Chen, Z.; Gong, Z.; Kong, X.; Wei, W. Vehicle Trajectory Clustering Based on Dynamic Representation Learning of Internet of Vehicles. IEEE Trans. Intell. Transp. Syst. 2021, 22, 3567–3576. [Google Scholar] [CrossRef]
- Jiang, Y.; Zhang, J. Interaction between company Manager’s and Driver’s decisions on expressway routes for truck transport. Transp. Policy 2019, 76, 1–12. [Google Scholar] [CrossRef]
- Zhang, R.; Aziz, S.; Farooq, M.; Hasan, K.; Mohammed, N.; Ahmad, S.; Ibadah, N. A Wind Energy Supplier Bidding Strategy Using Combined EGA-Inspired HPSOIFA Optimizer and Deep Learning Predictor. Energies 2021, 14, 3059. [Google Scholar] [CrossRef]
- Lydia, E.; Jovith, A.; Devaraj, A.; Seo, C.; Joshi, G. Green Energy Efficient Routing with Deep Learning Based Anomaly Detection for Internet of Things (IoT) Communications. Mathematics 2021, 9, 500. [Google Scholar] [CrossRef]
- Nie, X.; Min, C.; Pan, Y.; Li, K.; Li, Z. Deep-Neural-Network-Based Modelling of Longitudinal-Lateral Dynamics to Predict the Vehicle States for Autonomous Driving. Sensors 2022, 22, 2013. [Google Scholar] [CrossRef]
- Ma, Z.; Guo, S.; Xu, G.; Aziz, S. Meta Learning-Based Hybrid Ensemble Approach for Short-Term Wind Speed Forecasting. IEEE Access 2020, 8, 172859–172868. [Google Scholar] [CrossRef]
- Irshad, M.; Liu, W.; Arshad, J.; Sohail, M.N.; Murthy, A.; Khokhar, M.; Uba, M.M. A Novel Localization Technique Using Luminous Flux. Appl. Sci. 2019, 9, 5027. [Google Scholar] [CrossRef] [Green Version]
- Sakiyama, A.; Watanabe, K.; Tanaka, Y. Spectral Graph Wavelets and Filter Banks With Low Approximation Error. IEEE Trans. Signal Inf. Process. Netw. 2016, 2, 230–245. [Google Scholar] [CrossRef]
- Hamada, Y.; Inoue, M.; Adachi, N.; Ueda, H.; Miyashita, Y.; Hata, Y. Intrusion detection system for in-vehicle networks. SEI Tech. Rev. 2019, 88, 76–81. [Google Scholar]
- Yang, F.; Wang, S.; Li, J.; Liu, Z.; Sun, Q. An overview of Internet of Vehicles. China Commun. 2014, 11, 1–15. [Google Scholar] [CrossRef]
- Wang, X.; Mavromatis, I.; Tassi, A.; Santos-Rodriguez, R.; Piechocki, R.J. Location Anomalies Detection for Connected and Autonomous Vehicles. In Proceedings of the 2019 IEEE 2nd Connected and Automated Vehicles Symposium (CAVS), Honolulu, HI, USA, 22–23 September 2019; pp. 1–5. [Google Scholar] [CrossRef] [Green Version]
- Ding, N.; Ma, H.; Zhao, C.; Ma, Y.; Ge, H. Data Anomaly Detection for Internet of Vehicles Based on Traffic Cellular Automata and Driving Style. Sensors 2019, 19, 4926. [Google Scholar] [CrossRef] [PubMed] [Green Version]
- Chandola, V.; Banerjee, A.; Kumar, V. Survey of Anomaly Detection. ACM Comput. Surv. 2009, 41, 1–72. [Google Scholar] [CrossRef]
- Araujo. Innovative Approaches to Quality Assurance in Healthcare. Bull. Roszdravnadzor 2017, 6, 5–9. [Google Scholar]
- Wang, C.; Zhao, Z.; Gong, L.; Zhu, L.; Liu, Z.; Cheng, X. A Distributed Anomaly Detection System for In-Vehicle Network Using HTM. IEEE Access 2018, 6, 9091–9098. [Google Scholar] [CrossRef]
- Khalastchi, E.; Kaminka, G.A.; Kalech, M.; Lin, R. Online anomaly detection in unmanned vehicles. In Proceedings of the 10th International Conference on Advanced Agent Technology, Taipei, Taiwan, 2–6 May 2011; Volume 1, pp. 105–112. [Google Scholar]
- Narayanan, S.N.; Mittal, S.; Joshi, A. OBD SecureAlert: An Anomaly Detection System for Vehicles. IEEE Workshop Smart Serv. Syst. 1993. Available online: https://ebiquity.umbc.edu/_file_directory_/papers/792.pdf (accessed on 20 January 2022).
- Garg, S.; Kaur, K.; Kaddoum, G.; Gagnon, F.; Kumar, N.; Han, Z. Sec-IoV. In Proceedings of the ACM MobiHoc Workshop on Pervasive Systems in the IoT Era-PERSIST-IoT ’19, Catania, Italy, 2 July 2019; pp. 37–42. [Google Scholar] [CrossRef]
- Aziz, H.S.; Wang, Y.; Liu, J.P.; Fu, X. An Approach to Kinetic Energy Recovery System for Electric Vehicle Considering SC and Bi-directional Converters. In Proceedings of the IEEE Innovative Smart Grid Technologies-Asia (ISGT Asia), Singapore, 22–25 May 2018; pp. 1273–1277. [Google Scholar] [CrossRef]
- Yang, S.; Liu, Z.; Li, J.; Wang, S.; Yang, F. Anomaly Detection for Internet of Vehicles: A Trust Management Scheme with Affinity Propagation. Mob. Inf. Syst. 2016, 2016, 5254141. [Google Scholar] [CrossRef] [Green Version]
- Oucheikh, R.; Fri, M.; Fedouaki, F.; Hain, M. Deep Real-Time Anomaly Detection for Connected Autonomous Vehicles. Procedia Comput. Sci. 2020, 177, 456–461. [Google Scholar] [CrossRef]
- Wang, Y.; Masoud, N.; Khojandi, A. Real-Time Sensor Anomaly Detection and Recovery in Connected Automated Vehicle Sensors. IEEE Trans. Intell. Transp. Syst. 2021, 22, 1411–1421. [Google Scholar] [CrossRef] [Green Version]
- IDS 2017 | Datasets | Research | Canadian Institute for Cybersecurity | UNB. Available online: https://www.unb.ca/cic/datasets/ids-2017.html (accessed on 29 January 2022).
- Moustafa, N.; Slay, J. The evaluation of Network Anomaly Detection Systems: Statistical analysis of the UNSW-NB15 data set and the comparison with the KDD99 data set. Inf. Secur. J. A Glob. Perspect. 2016, 25, 18–31. [Google Scholar] [CrossRef]
Figure 1.
Key components and layers of an IoV system.
Figure 1.
Key components and layers of an IoV system.
Figure 2.
Key components and layers of an IoV system.
Figure 2.
Key components and layers of an IoV system.
Figure 4.
The proposed workflow.
Figure 4.
The proposed workflow.
Figure 5.
Repartition of services in UNSW-NB15.
Figure 5.
Repartition of services in UNSW-NB15.
Figure 6.
Repartition of attack types.
Figure 6.
Repartition of attack types.
Figure 7.
Target variable distribution in CICIDS2019.
Figure 7.
Target variable distribution in CICIDS2019.
Figure 8.
The performance of xNN on UNSW-NB15.
Figure 8.
The performance of xNN on UNSW-NB15.
Figure 9.
The performance of xNN on UNSW-NB15 without feature scoring.
Figure 9.
The performance of xNN on UNSW-NB15 without feature scoring.
Figure 10.
Confusion matrix of xNN for UNSW-NB15 with feature scoring.
Figure 10.
Confusion matrix of xNN for UNSW-NB15 with feature scoring.
Figure 11.
Confusion matrix of xNN for UNSW-NB15 without feature scoring.
Figure 11.
Confusion matrix of xNN for UNSW-NB15 without feature scoring.
Figure 12.
Comparison of deep-learning models for the classification of attacks in UNSW-NB15.
Figure 12.
Comparison of deep-learning models for the classification of attacks in UNSW-NB15.
Figure 13.
The performance of xNN on CICIDS2019.
Figure 13.
The performance of xNN on CICIDS2019.
Figure 14.
The performance of xNN on CICIDS2019 without feature scoring.
Figure 14.
The performance of xNN on CICIDS2019 without feature scoring.
Figure 15.
Confusion matrix of xNN for CICIDS2019 with feature scoring.
Figure 15.
Confusion matrix of xNN for CICIDS2019 with feature scoring.
Figure 16.
Confusion matrix of xNN for CICIDS2019 without feature scoring.
Figure 16.
Confusion matrix of xNN for CICIDS2019 without feature scoring.
Figure 17.
Comparison of the deep-learning model on the CICIDS2019 dataset.
Figure 17.
Comparison of the deep-learning model on the CICIDS2019 dataset.
Table 1.
Comparative analysis of previous studies.
Table 1.
Comparative analysis of previous studies.
| Reference | Technique | Dataset | Accuracy |
|---|
| Yang et al. [1] | Hybrid Models | CICIDS2017 | 96.3% |
| Wu et al. [3] | Random Forests | CICIDS2017 | 95% |
| Ding et al. [9] | Gaussian Mixture Model | CICIDS2017 | 97% |
| Negi et al. [14] | MXNet | Offline Dataset | 98.5% |
| Wang et al. [29] | HTM Model | UNSW-NB15 | 97.45% |
| Garg et al. [32] | Support Vector Machine | CICIDS2019 | 91% |
Table 2.
UNSW-NB15 dataset description.
Table 2.
UNSW-NB15 dataset description.
| Feature/Attribute | Description | Value | Variable Type |
|---|
| ID | Vehicle ID | Any positive integer | Input Variable |
| Duration | Total time at which the vehicle is connected to network | Hours/minutes/seconds | Input Variable |
| Proto | Basic data-transmission mechanisms are included in communication protocols. | TCP/IP, HTTP | Input Variable |
| State | State of Vehicle (Connectivity) | 0 (disconnected) or 1 (connected) | Input Variable |
| Spkts | Source Packets (Sent to destination) | Any positive integer | Input Variable |
| Dpkts | Destination Packets (Received at destination) | Any positive integer | Input Variable |
| Sbytes | Source Bytes (Sent from Source) | Any positive integer | Input Variable |
| Dbytes | Destination Bytes (Received from Source) | Any positive integer | Input Variable |
| Category of an Attack | There are a total of nine attacks in UNSW-NB15, i.e., DDoS, Backdoors, Worms, and others. | Output/Target Variable with Nine Classes |
Table 3.
CICIDS2019 dataset description.
Table 3.
CICIDS2019 dataset description.
| Feature/Attribute | Description | Value | Variable Type |
|---|
| ID | Vehicle ID | Any positive integer | Input Variable |
| Flow Duration | Total time at which the vehicle is connected to network | Hours/ minutes/ seconds | Input Variable |
| Destination Ports | Counts of data-transmission ports | 2.0, 3.0 | Input Variable |
| Total Forwarded Packets | Source Packets (Sent to destination) | 0 (disconnected) or 1 (connected) | Input Variable |
| Total Backward Packets | Destination Packets (Received at destination) | Any positive integer | Input Variable |
| Length of Packets | Length of Forwarded and Backward Packets | Any positive integer | Input Variable |
| Sbytes | Source Bytes (Sent from Source) | Any positive integer | Input Variable |
| Dbytes | Destination Bytes (Received from Source) | Any positive integer | Input Variable |
| Attacks | Category of an Attack | There are two total anomalies, i.e., Benign and Botnet in the CICIDS2019 dataset | Output/Target Variable with 2 Classes |
Table 4.
Comparative analysis of the deep-learning models.
Table 4.
Comparative analysis of the deep-learning models.
| Model | Feature Scoring | Accuracy | Dataset |
|---|
| xNN | Default | 87.3 % | CICIDS 2019 |
| xNN | K-MEANS | 99.3% | CICIDS 2019 |
| xNN | Default | 91.5% | UNSW-NB15 |
| xNN | K-MEANS | 99.7% | UNSW-NB15 |
| LSTM | Default | 89.7% | CICIDS 2019 |
| LSTM | K-MEANS | 90% | CICIDS 2019 |
| LSTM | Default | 78.65% | UNSW-NB15 |
| LSTM | K-MEANS | 83% | UNSW-NB15 |
| CNN | Default | 85.4% | CICIDS 2019 |
| CNN | K-MEANS | 87% | CICIDS 2019 |
| CNN | Default | 79.67% | UNSW-NB15 |
| CNN | K-MEANS | 84% | UNSW-NB15 |
| DNN | Default | 83.2% | CICIDS 2019 |
| DNN | K-MEANS | 92% | CICIDS 2019 |
| DNN | Default | 85% | UNSW-NB15 |
| DNN | K-MEANS | 87.89% | UNSW-NB15 |
Table 5.
Comparative analysis of previous studies.
Table 5.
Comparative analysis of previous studies.
| Reference | Technique | Dataset | Accuracy |
|---|
| Yang et al. [1] | Hybrid Models | CICIDS2017 | 96.3% |
| Wu et al. [3] | Random Forests | CICIDS2017 | 95% |
| Ding et al. [9] | Gaussian Mixture Model | CICIDS2017 | 97% |
| Negi et al. [14] | MXNet | Offline Dataset | 98.5% |
| Wang et al. [29] | HTM Model | UNSW-NB15 | 97.45% |
| Garg et al. [32] | Support Vector Machine | CICIDS2019 | 91% |
| Our proposed | Explainable Neural Network (xNN) | CICIDS2019 UNSWNB15 | 99.3% and 99.7%, respectively |
| Publisher’s Note: MDPI stays neutral with regard to jurisdictional claims in published maps and institutional affiliations. |
© 2022 by the authors. Licensee MDPI, Basel, Switzerland. This article is an open access article distributed under the terms and conditions of the Creative Commons Attribution (CC BY) license (https://creativecommons.org/licenses/by/4.0/).


 ,
, 


