Abstract
Recently Brusov et al. have developed innovative investment models that are very close to investment practice. Investment models with frequent payments of tax on profit and of interest on debt at the ends of periods have been considered. However, in practice, payments of tax on profit as well as of interest on debt could be made in advance. In the current paper, we developed, for the first time, innovative investment models with frequent advance payments of tax on profit and of interest on debt and studied the impact of these types of payments on investment project effectiveness. Numerical calculations carried out for four innovative investment models (without split flows) showed that, in the case of advance frequent payments of income tax and interest on debt, all the results related to the effect of the number of payments of income tax and interest on debt on the investment projects’ effectiveness were opposite to the results in the case of payments at the end of the periods obtained by Brusov et al. in the previous article. Thus, this means that the method of payments of tax on profit and of interest on debt (in advance or at the ends of periods) changes drastically the effect of the number of payments of income tax and interest on debt on the investment effectiveness. The verification developed by us for the new models with frequent advance payments of tax on income helps create a comprehensive system of correct valuation of the investments’ effectiveness for two schemes for payments of income tax (in advance or at the ends of periods). The obtained results help the tax regulator (Finance Ministry) understand the influence of the frequency of payments of tax on income and the credit regulator (Central Bank) understand the influence of the frequency of payments of interest on debt on the investment projects’ effectiveness. This allows them to modify and improve tax legislation and credit policy, respectively.
Keywords:
modern investment models; the Brusov–Filatova–Orekhova theory; the investment project effectiveness; the Modigliani–Miller theory; frequent advance tax on profit payments; frequent advance interest on debt payments MSC:
91B24
1. Introduction
Investment is quite important in the economy and finance of any country. Now, the role of investments as well as the role of correct valuation of the investment projects’ effectiveness are increasing, which allows, under conditions of a shortage and limited investment resources, realizing the most effective projects. Recently [1], we developed innovative investment models that are very close to investment practice. Investment models with frequent payments of tax on profit and of interest on debt at the ends of periods have been considered.
However, in practice, payments of tax on profit and of interest on debt could be made in advance. In the current paper, we developed innovative investment models with frequent advance payments of tax on profit and of interest on debt and studied the impact of these types of payments on investment project effectiveness.
With regard to frequent income tax payments, this is a common practice: The state is interested in regular tax receipts to ensure its expenses. Therefore, in accordance with tax legislation, payments are made depending upon the amount of profit, either monthly or quarterly. This takes place in most countries (for example, in Russia, with a company’s profit above RUB 15 million (USD 200,000), they are carried out monthly, below RUB 15 million (USD 200,000), quarterly).
With regard to advance payments, a company can pay tax payments in advance with subsequent adjustment if it receives a stable and predictable income. In addition, the development of a methodology for advance payments allows the regulator to expand this practice, which ensures an increase in the stability of revenues to the budget. In the case under consideration (investments), this will lead to the creation of a favorable investment climate in the country.
Regarding the payment of interest on a loan agreement, if the loan agreement is interest bearing, the borrower is obliged to pay interest on the loan amount in the manner prescribed by the agreement. The agreement also stipulates the frequency of payment of interest on the loan and the method of payment (at the end of periods or in advance). In credit relations, in practice, two schemes for simultaneous payments of interest and principal are often used: annuity and differentiated. Any of them can be provided for in the loan agreement. Annuity payments, equal throughout the entire maturity of the debt, are calculated once and include the amount of accrued interest and the amount of the principal debt.
A comprehensive literature review of investment models was conducted in [1]. Below, we add a review of a few recent papers devoted to frequent payments of income tax as well as advance payments of income tax [2,3]. As well we summarize some references from [1] (where an analysis of papers [4,5,6,7,8,9,10,11,12] was performed).
1.1. The Literature Review
Most investment projects use debt and, thus, the influence of debt financing on the investments’ efficiency as well as on the companies’ investment strategy for decades has been one of the main problems of investments [4,5,6,7,8,9,10,11,12,13,14,15,16,17,18].
The coupling between an investment decision and the leverage value was investigated in [4].
The influence of debt financing on the investment decisions of companies at pharmaceutical firms in India was studied in [5]. The behavioral aspects of investors were studied in [6]. In [7], the authors developed a strategy, within which the Cumulative Prospect Theory turned out to be optimal. In [8], holdings-based statistics were developed to estimate the volatility of characteristics of the investment style of funds with time. In [9], by using the CSRHub data set, it was shown that ESG ratings regress strongly toward the mean. The performance of the Fama–French factors in global markets was reconsidered in [10]. Some portfolio investment models were developed, among them the well-known Black–Litterman model, which was created in 1992 [11]. In [12], the authors used the so-called “Tobin’s q ratio”, which equals the market company capitalization divided by its assets’ replacement cost, considering investment problems of companies with low as well as high values of Tobin’s q ratios.
In the main theories of capital structures, the Brusov–Filatova–Orekhova theory, and in its perpetuity limit, the Modigliani–Miller theory, all payments, including tax on profit payments and interests on debt, are made at the end of periods. In practice, however, these payments are often made in advance. In [2], the authors generalized the Modigliani–Miller theory for the case of advance tax on income and interest on debt payments. They showed that this modification leads to very important consequences, in particular, all theorems by Modigliani and Miller change seriously (Brusov et al., 2020): The company weighted average cost of capital (WACC) depends on the debt cost, kd. However, in the classical Modigliani–Miller theory it does not depend on debt cost, kd, and the WACC value under accounting for the advance tax on profit and interests on debt payments is lower and company capitalization is higher than in case of the classical Modigliani–Miller theory. The dependence of equity cost on leverage level, L, was studied and it was shown that, while this dependence remains linear, the tilt angle, α, with respect to the L–axis turns out to be smaller than in the classical Modigliani–Miller theory . Here, k0 is the cost of equity at zero leverage level L, kd is the debt cost, and t is the tax on income rate. The companies should account these effects, in particular, in developing the dividend policy of the company because the economically justified value of dividends is equal to the equity cost. A study of a method of tax on profit payments (in advance or at the end of periods) showed that the Modigliani–Miller theory shortcomings are much deeper: The underestimation of the WACC is bigger, as well as the overestimation of the company value. Thus, systematic risks arising from the use of a more correct version of the Modigliani–Miller theory in practice is higher than from the use of the “classical” version of the Modigliani–Miller theory (MM theory).
In [3], the authors applied the MM theory, which has been modified for the payments of tax on income and interests on debt in advance (MMM theory) for use in rating methodology. This did require a significant modification of the MMM theory. The rating parameters, the so-called the financial “ratios”, were incorporated into the MMM theory. The authors discussed the need for the proper use of discounted cash flows in rating methodologies. The change of the WACC, which is the discount rate, with the leverage and coverage ratios was analyzed.
The authors noted that change of the WACC with the debt coverage ratios i1 demonstrated that the WACC increases with the debt coverage ratio within the “classical” MM theory and in the MMM theory. WACC is growing very fast when i1 changes from i1 = 0 to i1 = 1, and then very quickly reaches saturation value of WACC = k0 (at i1 bigger than 3, the WACC practically does not change). Thus, for large values of ij, k0 is a good approximation for the weighted average cost of capital of the company (WACC). This increases the role of the parameter k0. The method for valuation the parameter k0 was developed by Anastasia Brusova [13]. Therefore, the parameter k0 is the discount rate for high i1 values. Other authors [3] noted that results of dependence of the WACC on coverage ratios of debt for both versions of the Modigliani–Miller theory are closed: the curve of the “classical” MM theory lies slightly above the WACC dependence on the coverage ratio of debt in the MMM theory. The WACC values are practically independent of kd. In the case of leverage ratios, the situation is quite different: the impact of the debt cost, kd, on the dependence of the WACC on leverage ratios is significant. The obtained results demonstrated that the WACC decreases with leverage ratios for the “classical” MM theory and for the MMM theory. The curve of change of the WACC with leverage ratios of debt in the former theory lies above the change of the WACC with leverage ratios of debt in the latter one. Additionally, the WACC values in the MMM theory decrease with an increase of kd. Therefore, in the MMM theory the observation that kd impacts the WACC dependencies on leverage ratios takes place. There is no such effect in the “classical” MM theory. This means that within the modified Modigliani–Miller theory the valuation of WACC, which is the discount rate upon discounting of financial flows in rating methodologies, is much more correct. This modification of the theory could improve the existing rating methodologies used to assess the creditworthiness of non-financial issues.
The generalization and further development of MM theory for the case of frequent payments of tax on profit and interest on debt were the main goals of the paper [14]. The authors studied the influence of the frequency of payments of income tax and interest on debt on key financial indicators of a company, such as equity cost, ke, WACC, company capitalization, V, etc., and showed that all of them depend on the frequency of tax on profit and interest on debt payments as well as depending on debt cost, kd. Accounting for this frequency changes all Modigliani–Miller theorems, all statements, and all Modigliani–Miller formulas.
Using the results of [14], a company could choose the quantity of payments of tax on profit and interest on debt per year. As we showed [14], an increase in the quantity of income tax payments is beneficial for the company as well as for the tax regulator.
In [19], an attempt was made to critically analyze the derivation of the BFO formula. The authors made the assumption that the amount of debt decreases with time and disappears at time, n, and on this basis they questioned the validity of the BFO formula. Immediately after the discovery of this work, it was answered in the same journal [20]. Let us cite a part of the reply, which demonstrated that the assumptions of [19] were not relevant to the BFO theory and the criticism was erroneous.
The first quantitative theory in the field of capital structure theory was the theory of Nobel laureates Modigliani and Miller. One of the most serious limitations of the Modigliani–Miller (MM) theory was the assumption of perpetuity (infinite lifetime) of companies. In the case of MM, an infinite lifetime company and infinite-age companies meant the same situation. When we consider the finite period of time, these two concepts, the age of the company and the lifetime of the company, must be distinguished. The Brusov–Filatova–Orekhova theory (BFO theory), which generalized the theory of Modigliani–Miller for the case of an arbitrary (finite) period of time, n, did not expect the company to leave the market at the time, n: It generalizes the Modigliani–Miller theory for companies of any age, n, remaining on the market. Note that this situation is of the greatest interest, including practical, because it allows analyzing the financial position of companies operating on the market. This has been repeatedly emphasized in articles across the BFO.
Thus, the conclusions of paper [19] are wrong because they refer to another situation when the company ceases to exist at time n.
The Brusov–Filatova–Orekhova theory also allows us to study the financial condition of companies that have ceased to exist, i.e., those for which n means not age but lifetime, i.e., the time of existence. There can be many schemes for terminating a company’s activities: bankruptcy, merger, acquisition, etc. In [21], one such scheme was considered, when the amount of borrowed capital D becomes zero at the time of termination of company n. In this case, the BFO theory required minimal modifications, which were made. We called this modified theory BFO-2, and main formula of this theory is as follows.
This formula determines the WACC for companies with an arbitrary lifetime, n, assuming that the company goes out of business at time n.
Here, the WACC is the weighted average cost of capital, k0 is the cost of equity at zero leverage level L, kd is the cost of debt, t is the tax on the profit rate, and wd is the debt capital share.
Note that BFO theory results are well reflected in Western literature (see, for example, [22,23,24,25,26,27], which refer to one of the papers describing BFO theory) and some of them (see, for example, [28]) use the BFO theory in practice.
In [22], a study was performed of the influence of the quality of corporate governance on European soccer clubs’ capital structure and specifically on their debt level. It was found that efficient corporate governance mechanisms such as the existence of more dispersed ownership, independence, and an increased board size lead to reduction in the leverage level and in debt, thus reducing the financial instability risk.
In [23], the techniques used for analysis of variance (ANOVA) and discriminant analysis were studied. It was shown that, among the indicators used, only growth opportunities, general liquidity, degree of immobilization, or Tobin’s Q were significant at 1%. The results obtained show that the capital structure is not related to the performance of the firms listed on the Brazilian BM&FBOVESPA. The results [23] demonstrated the consolidation of the financial theories exposed by Modigliani and Miller [15,16] in opposition to the traditional approach.
In [24], the authors valuated the benefits from debt financing using the value of tax shields. It is well known that a tax shield increases a company’s capitalization; the correct valuation of this extra-value is contradictory. They derived a general formula for the tax shields within a risk-neutral approach. The summation of the discounted future tax savings gives the value of tax shields. Some well-known formulas were obtained after it was specified as a leverage policy and a dynamics of cash flow.
Another paper [25] studied the relationship between fluctuations of company value related to changes of WACC and cash flows on samples of some companies from the oil and gas sector. It was shown that changes of WACC did not impact intermediate-term changes in the enterprise value.
Other authors [26] studied the capital costs of energy sector companies by including an investor and market-risk approach. The companies’ WACC intra-industry analysis related to sector characteristics, such as revenues, total assets, age of the companies, and market capitalization, were used in this study. The paper [26] contributed to the theory of information asymmetry related to the cost of capital assumptions.
Some authors [27] explained the short- and long-term return if the variations are known and they segregated many investment options by publicly traded companies located in Latin America. The results indicated that the consolidated variances, which reproduced aspects of profitability, capital structure, and operational performance of the companies, were not statistically capable of explaining, suggesting that the accounting did not reflect all the market analyses/expectations.
1.2. Brusov–Filatova–Orekhova (BFO) Theory versus Modigliani–Miller (MM) Theory
When evaluating the effectiveness of investment projects, an important role is played by the discount rate, which is the main parameter. For long-term (perpetuity) projects, the WACC and ke (playing the role of the discount rates) are calculated according to the MM theory [15,16,17], and for projects of arbitrary duration, they are calculated according to the BFO theory [18]. The MM theory has existed since 1958 [15] and is quite widely known. The BFO theory appeared in 2008 (a half century later); so, here, we will give a short review of this theory and of some of its results.
The most serious Modigliani–Miller theory limitation is the suggestion about perpetuity of the companies. In 2008, Brusov–Filatova–Orekhova [18] lifted up this limitation and created the modern theory of capital cost and capital structure, the BFO theory, which describes the companies of arbitrary age (and arbitrary lifetime). The generalization of the MM theory for the companies of arbitrary age (and arbitrary lifetime) required the modification not only of the valuation of the tax shield, TS, but a change of the valuation of the company values: financially independent, V0, as well as a leveraged one, V.
Below, we compare the expressions for the tax shield, TS, company value, V, and for WACC in the Modigliani–Miller theory and the Brusov–Filatova–Orekhova one.
Tax shield, TS:
MM (Modigliani–Miller theory): TS = DT;
BFO (Brusov–Filatova–Orekhova theory):
Company value, V (financially independent company, V0; leveraged company, V:
Weighted average cost of capital, WACC:
Here, S is the value of equity capital of the company, is the share of debt capital, is the cost and the share of the equity capital of the company, is the financial leverage, and is the value of debt capital.
At n = 1, from the BFO formula for WACC, we get Myers’ [29] formula for a 1-year company
and at we get the Modigliani–Miller formula for WACC [16]:
Note that before the BFO discovery in 2008 there were two results only: Modigliani–Miller for perpetuity companies [15,16,17] and the Myers one for 1-year companies [29].
The accounting for a company’s finite age, as was shown by the BFO authors, leads to significant changes of all Modigliani–Miller results [15,16,17]: Capitalization of the company is changed, as well as the equity cost, ke, and the weighted average cost of capital, WACC, in the presence of corporative taxes. Additionally, a number of qualitatively new effects in corporate finance obtained in the Brusov–Filatova–Orekhova theory [18] are absent in the Modigliani–Miller theory [15,16,17].
Only in the absence of corporate taxes, BFO authors have given a rigorous proof of the Brusov–Filatova–Orekhova theorem that equity cost, ke, as well as its weighted average cost, WACC, do not depend on the company age. Therefore, the Modigliani–Miller theory could be applied for arbitrary-age companies (only in the absence of corporate taxes).
Modern BFO theory results are quite different from the ones of the Modigliani–Miller theory. Via its perpetuity, the Modigliani–Miller theory underestimates the assessment of the equity cost of the company, ke, and the weighted average cost of capital, WACC, and substantially overestimates the assessment of the company value (see Figure 1).
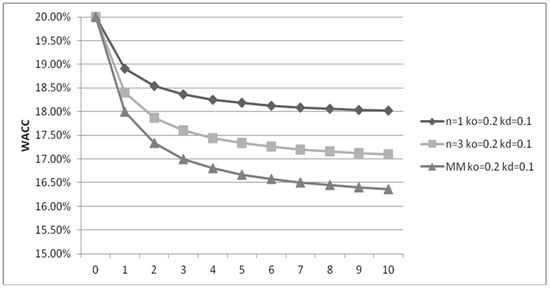
Figure 1.
Dependence of WACC on leverage level, L, for different ages of the company: n = 1, n = 3, and .
One of the implicit reasons for the global financial crisis of 2008 was an incorrect assessment of the key performance indicators of financial activities of companies by use of the Modigliani–Miller theory, within which involved risks were underestimated and it was impossible to make adequate managerial decisions.
A lot of qualitatively new results were obtained within the modern theory of capital cost and capital structure (BFO theory), among them:
- –
- Bankruptcy of the world famous trade-off theory was proven. Some of the main existing principles of financial management were destroyed by the BFO theory, including the world-known trade-off theory. For many decades it was considered as the keystone of the capital structure theories and it described the formation of the optimal capital structure of a company. The reasons for such insolvency were investigated and found [18].
- –
- The mechanism of formation of a company’s optimal capital structure, which does not relate to a mechanism suggested by the trade-off theory, was suggested [18] by the BFO authors. This showed that the optimal capital structure of the company could exist in principle.
- –
- The BFO authors discovered the abnormal dependence of equity cost on leverage: Above some value of tax on income (which meets in a real economy), equity cost (ke) decreases with the leverage level (L) [18]. This qualitatively new effect in corporate finance could lead to reconsideration of the principles of dividend policy of the company.
- –
- The effects of “golden and silver ages” of companies was discovered. It was shown that value of WACC in the Modigliani–Miller theory, in contradiction to the opinions of all financiers, is not minimal and the company value is not maximal.
At some age of the company its value of WACC is lower than in the Modigliani–Miller theory and the company value, V, at some company age is greater than the company capitalization, V, in the Modigliani–Miller theory.
Note that all qualitatively new results discovered within the BFO theory do not exist in the Modigliani–Miller theory.
The discovered effects can be applied in a real economic practice for optimizing the management of a company’s finance.
The created BFO theory allows for a reliable assessment of the main parameters of the financial activities of companies, such as the weighted average cost of capital and the cost of equity of the company, its value. This allows the company’s management to make adequate decisions, which increases the efficiency of company management. The incorporation of a new system for assessing the parameters of the financial performance of companies in financial reporting systems (IFRS, GAAP, etc.) will reduce the risk of a global financial crisis.
1.3. Calculations of the Discount Rates
The discount rate, WACC, in the long-term (perpetuity) investment models without the splitting of operating and financial flows should be calculated using the Modigliani–Miller formula modified for advance payments [15,16,17]
For investment models of arbitrary duration, the Brusov−Filatova−Orekhova formula for WACC modified for advance payments [18,19,20,21] takes the following form
The equity cost, ke, is used as the discount rate in investment models with the separation of operating and financial flows for discounting the operating flows. For perpetuity or long-term models, it could be found using the perpetuity expression from [15,16,17]
In investment models of arbitrary duration, ke could be found by using the following expression
where WACC should be calculated by using the Brusov−Filatova−Orekhova expression [18,19].
The formulas for the discount rates (WACC, equity cost ke) were generalized in [14] for an arbitrary number of payments of tax on income and interest on debt, for the advance payments of interest on debt and tax on profit, etc., in other words, for the conditions of the real investment projects.
In current paper, we developed innovative investment models with frequent advance payments of interest on debt and of tax on profit and studied the impact of these types of payments on investment project effectiveness.
The verification developed by us eight new models with frequent advance payments of tax on income helps create a comprehensive system of correct valuation of the investments’ effectiveness.
2. The Investment Project Efficiency for the Equity Owners
The investment project effectiveness was studied from two points of view: from the equity owners’ as well as from the point of view of owners of equity and debt. Net present value, NPV, could be calculated with the splitting of finance and operating flows (using two different discount rates) and without splitting these flows (WACC serves as discount rate).
Below, we use the following designations: the weighted average cost of capital, WACC; the equity value, S; D is the value of debt; the tax on profit, t; the investment value, I; the level of leverage, L; the net operating income, NOI; the project duration, n; the profitability of investments, β; the cost of equity, ke; the cost of equity at zero leverage level, k0; the cost of debt, kd; and the quantity of interest on loan payments, p1, and of tax on profit, p2, per period.
In the case of consideration from the equity owners, the cash flow, CF, per year is:
and the initial investments into the project are equal to −S.
It includes an interest on a debt, (negative value), the tax shields, kdDt (positive value), and operating income after tax deduction, NOI(1 − t).
The interests on the debt during all periods are paid in equal shares, kdD, while, at the end of the project, principal repayment is done.
In the case of consideration from the equity and debt owners, the cash flow, CF, per year is:
and the initial investments into the project are equal to −I = −S − D.
2.1. Calculations of the NPV (Net Present Value) with Split Flows
One has for one-period NPV
In (7), the first term corresponds to the after-tax deduction amount of operating income from the investment project for one period, the second one corresponds to the tax shield amount for one period, and the third one is the amount of one period of interest on debt.
When calculating NPV, it is necessary to use, for summing the discounted values of financial flows, the following auxiliary formulas (7).
In the case of tax on profit and of interest on debt payments in advance once per year, one has:
In the case of tax on profit and of interest on debt payments in advance more frequently than once per year (monthly, quarterly, semiannually), one has:
For the equity cost, ke, and WACC, which serve as the discount rates, it is easy to get similar formulas.
For project of n years’ duration in the case of split flows, one gets for NPV after summing up of (7):
The first term above is the equity value. The second term is the discounted amount of operating investment income. The third term is the discounted tax shield amount. The fourth term is the discounted amount of interest, paid annually in the beginning of the year. The fifth term describes the discounted debt value. Note that the debt, D, is paid at the end of the duration.
One gets after summing up:
If the advance interest on debt and tax on profit payments are made more frequently than once per year (say, p times) (p2 and p1, consequently), one gets:
One gets after summing up:
Expression for perpetuity (long-term) investment projects
In this case, we need to calculate the limit of expression (13) at
2.2. Calculations of the NPV (Net Present Value) without Split Flows
Without split flows, financial and operating flows should be discounted by a uniform discount rate, which is equal to WACC. Note that debt value, D, reimbursable at the end of the project duration, is discounted at the same rate as WACC.
One gets from (3) for NPV the following expression:
For net present value, NPV, after summing up (15), we have:
If the advance interest on debt and tax on profit payments are made more frequently than once per year (say, p times) (p2 and p1, consequently), one gets:
For net present value, NPV, after summing up (17), we have:
Expression for perpetuity (long-term) investment projects
In this case, we need to calculate the limit of expression (18) at
3. The Investment Project Efficiency for the Equity and Debt Owners
3.1. Calculations of the NPV (Net Present Value) with Split Flows
An after-tax deduction of one-period capital flow has the following form (6):
We get the following expression for net present value, NPV, summing over n years:
If the advance payments of taxes on profit are made more frequently than once per year (say, p times), one gets:
We get the modified expression for net present value, NPV, summing over n years:
Expression for perpetuity (long-term) investment projects
In this case we need to calculate the limit of expression (23) at
3.2. Calculations of the NPV (Net Present Value) without Split Flows
Without the splitting of financial and the operating flows, WACC is the discount rate for both kinds of flows and should be discounted. We get the modified expression for net present value, NPV, summing Formula (6) over n years:
If the advance payments of taxes on profit are made more frequently than once per year (say, p times), one gets:
We get the modified expression for net present value, NPV, summing (27) over n years:
Formula for perpetuity (long-term) projects
In this case, we need to calculate the limit of expression (28) at
4. Calculations of the Discount Rates without Split of Flows
Without the splitting of financial and the operating flows, WACC is the general discount rate for both kinds of flows which should be discounted. WACC could be obtained by using the following formulas.
For WACC in the case of a project of arbitrary duration, one gets [14]:
For WACC in the case of perpetuity or long-term projects, one gets [14]:
Considering the case of the splitting of the financial and the operating flows (one should use as discount rates during payments discounting the debt cost, kd, and the equity cost, ke), one could calculate the equity cost, ke, using the following expression
For an arbitrary-duration project, WACC is taken from Formula (30), and for a perpetuity or long-term project, WACC is taken from Formula (31).
Expressions (30) and (31) are modifications of the initial Brusov–Filatova–Orekhova [18,19] expressions and the Modigliani–Miller [15,16,17] ones, in which tax on profit and interest on debt are paid one time per period at the end of the periods. They are turned into advance versions of them (not original ones, which suppose the payments at the end of periods) if we put p = 1:
5. Results and Discussions
Below, the four models created above are investigated numerically using Microsoft Excel. We studied the effectiveness of the perpetuity or long-term projects as well as the effectiveness of the arbitrary-duration projects. Consideration was made for the equity and debt owners as well as for the equity owners only. The case without flow splitting was studied. This means that, without such a splitting of the financial and the operating flows, both kinds of flows are discounted, using as the discount rate the weighted average cost of capital, WACC. First of all, the dependence of the weighted average cost of capital, WACC, which serves as discount rates on level of leverage, L, for different numbers of tax on profit payments per period, was studied. Numerical calculations were made for the typical values of parameters kd and k0 for companies; moreover, they were especially the same as in ref. [1] in order to allow us to compare current results with the ones of ref. [1]. Conclusions made on numerical calculations were general. The impact of equity cost, k0, and debt cost, kd, on WACC and NPV for different types of payments of tax on profit (at the ends of periods and in advance) for equity owners and for equity and duty owners are shown below (in Section 6).
5.1. The Discount Rates’ Numerical Calculation
5.1.1. The Case of the Perpetuity Projects
For perpetuity projects, the weighted average cost of capital, WACC, which is the discount rate, for any quantity of advance payment of tax on income, p, is described by the following expression (31) [14]:
We calculate below the weighted average cost of capital, WACC, for the parameters kd = 0.14 and k0 = 0.22 at L = 0, 1, 2, …, 10 (at t = 0.2).
A change of the weighted average cost of capital, WACC, with leverage, L, for kd = 0.14, k0 = 0.22, and p = 1, 4, and 12 is shown in Table 1 and Figure 2 and Figure 3.

Table 1.
Change of weighted average cost of capital, WACC, with leverage, L, for kd = 0.14, k0 = 0.22, and p = 1, 4, and 12.
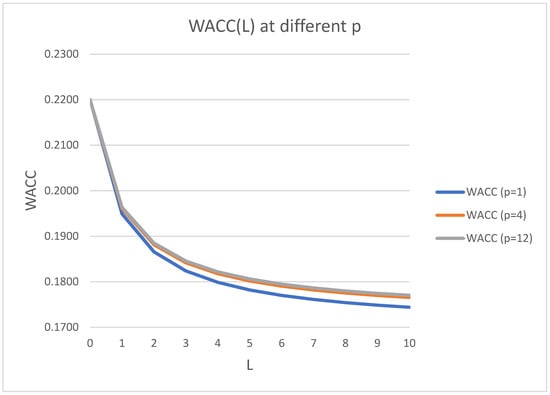
Figure 2.
Change of weighted average cost of capital, WACC, with leverage, L, for kd = 0.14, k0 = 0.22, and p = 1, 4, and 12.
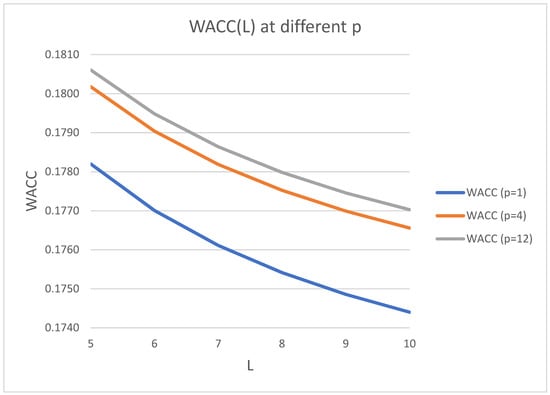
Figure 3.
Change of weighted average cost of capital, WACC, with leverage, L, for kd = 0.14, k0 = 0.22, and p = 1, 4, and 12 (larger scale).
5.1.2. Projects with Arbitrary Duration
For projects with arbitrary duration, the weighted average cost of capital, WACC, which is the discount rate, for any quantity of advance payment of tax on income, p, is described by the following expression [14]).
Below, we make calculations for kd = 0.14; k0 = 0.22; p = 1, 4, and 12; and n = 3.
In Table 2 and Figure 4 and Figure 5, the change of the weighted average cost of capital, WACC, with leverage, L, for kd = 0.14, k0 = 0.22, and p = 1, 4, and 12, for a 3-year project (n = 3) is shown.

Table 2.
Change of the weighted average cost of capital, WACC, with leverage, L, for kd = 0.14, k0 = 0.22, p = 1, 4, and 12, and n = 3.
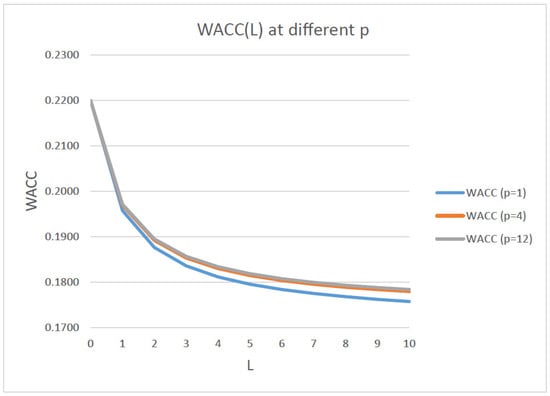
Figure 4.
Change of the weighted average cost of capital, WACC, with leverage, L, for kd = 0.14, k0 = 0.22, and p = 1, 4, and 12, for a 3-year project (n = 3).
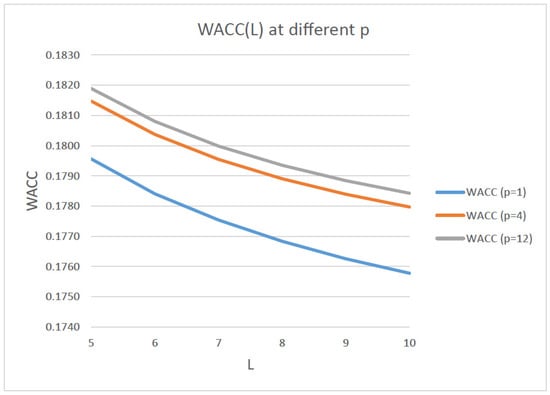
Figure 5.
Change of the weighted average cost of capital, WACC, with leverage, L, for kd = 0.14, k0 = 0.22, p = 1, 4, and 12, and n = 3 (larger scale).
The obtained results on WACC(L) we will use below for investigation of the effectiveness of investment projects for the owners of equity as well as for the owners of equity and debt.
5.2. The Perpetuity Project Effectiveness for the Equity Owners
For NPV of perpetuity projects (for any number of advance payments of tax on income, p), we have the following expression:
Below, we use kd = 0.14; k0 = 0.22; p1 = p2 = p = 1, 4, and 12; S = 1000; and NOI = 800.
From Table 3 and Figure 6 and Figure 7 it is seen that, for equity capital owners, NPV varies with the change of p but not too much. It cannot be seen from Figure 7.

Table 3.
Change of net present value, NPV, with leverage, L, for kd = 0.14, k0 = 0.22, and p = 1, 4, and 12.
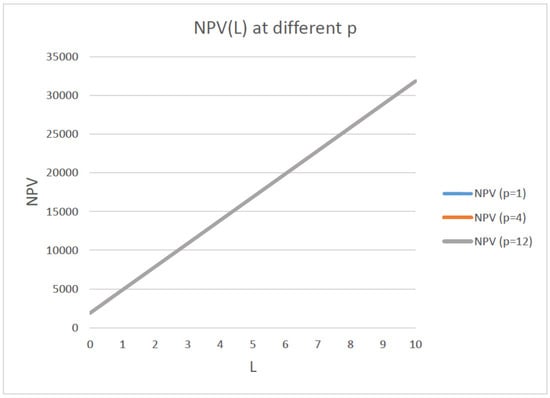
Figure 6.
Change of net present value, NPV, with leverage, L, for kd = 0.14, k0 = 0.22, and p = 1, 4, and 12, for a perpetuity project.
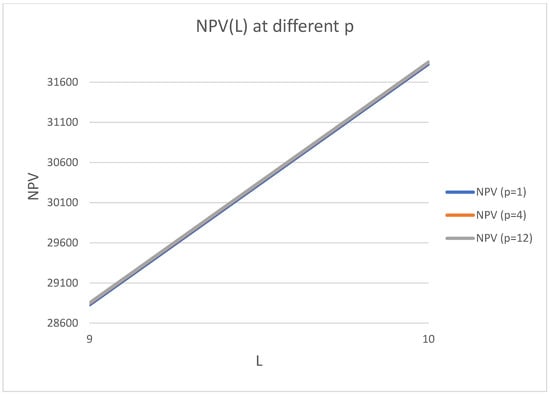
Figure 7.
Change of net present value, NPV, with leverage, L, for kd = 0.14, k0 = 0.22, and p = 1, 4, and 12, for a perpetuity project (larger scale).
5.3. The Perpetuity Project Effectiveness for the Equity and Debt Owners
NPV for an arbitrary number of advance tax on income payments, p, takes the following form (29):
Below, kd = 0.14; k0 = 0.22; p1 = p2 = p = 1, 4, and 12; NOI = 800; and S = 1000.
Change of net present value, NPV, with leverage, L, for kd = 0.14, k0 = 0.22, and p = 1, 4, and 12, for a perpetuity project is shown in Table 4 and Figure 8 and Figure 9.

Table 4.
Change of net present value, NPV, with leverage, L, for kd = 0.14, k0 = 0.22, and p = 1, 4, and 12, for a perpetuity project.
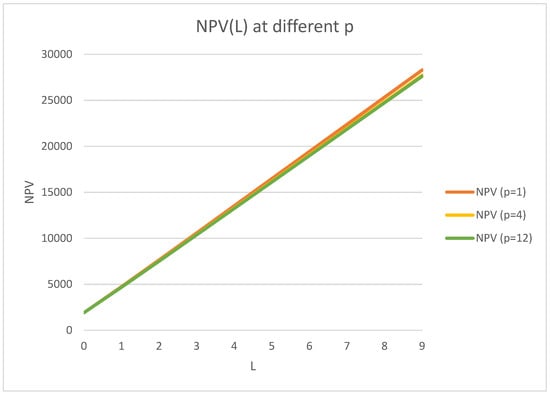
Figure 8.
Change of net present value, NPV, with leverage, L, for kd = 0.14, k0 = 0.22, and p = 1, 4, and 12, for a perpetuity project.
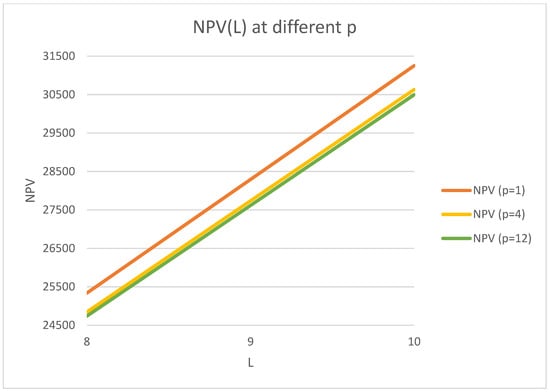
Figure 9.
Change of net present value, NPV, with leverage, L, for kd = 0.14, k0 = 0.22, and p = 1, 4, and 12, for a perpetuity project (larger scale).
5.4. The Arbitrary Duration Project Effectiveness for the Equity Owners
NPV for an arbitrary number of advance tax on income payments, p, takes the following form (18):
Below, we use kd = 0.14; k0 = 0.22; p1 = p2 = p = 1, 6, and 12; NOI = 800; n = 3; and S = 1000.
In Table 5 and Figure 10 and Figure 11, the change of net present value, NPV, with leverage, L, for kd = 0.14; k0 = 0.22; p = 1, 4, and 12; and n = 3 is shown.

Table 5.
Change of net present value, NPV, with leverage, L, for kd = 0.14; k0 = 0.22; p = 1, 4, and 12; and n = 3.
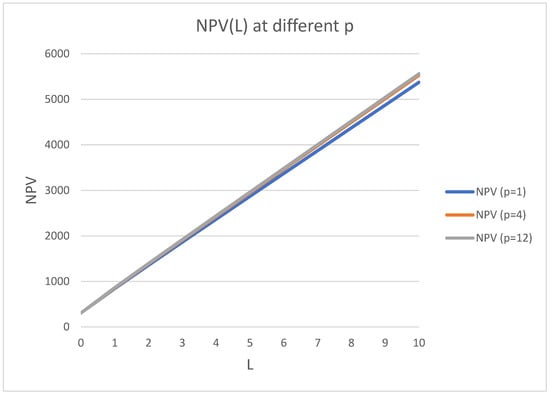
Figure 10.
Change of net present value, NPV, with leverage, L, for kd = 0.14; k0 = 0.22; p = 1, 4, and 12; and n = 3.
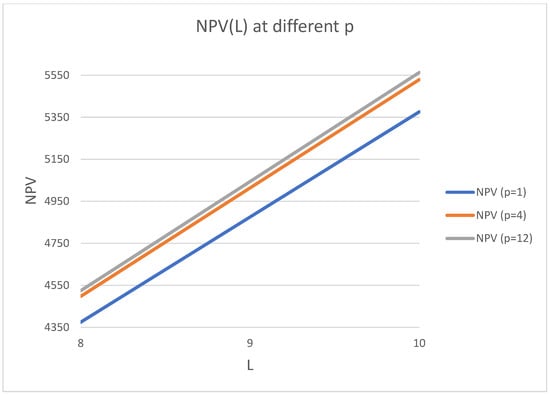
Figure 11.
Change of net present value, NPV, with leverage, L, for kd = 0.14; k0 = 0.22; p = 1, 4, and 12; and n = 3 (larger scale).
5.5. The Arbitrary Duration Project Effectiveness for the Equity and Debt Owners
NPV for an arbitrary number of advance tax on income payments, p, takes the following form (28):
Below, we use kd = 0.14; k0 = 0.22; p1 = p2 = p = 1, 6, and 12; NOI = 800; n = 3; and S = 1000.
In Table 6 and Figure 12 and Figure 13, the change of net present value, NPV, with leverage, L, for kd = 0.14; k0 = 0.22; p = 1, 4, and 12; and n = 3 is shown.

Table 6.
Change of net present value, NPV, with leverage, L, for kd = 0.14; k0 = 0.22; p = 1, 4, and 12; and n = 3.
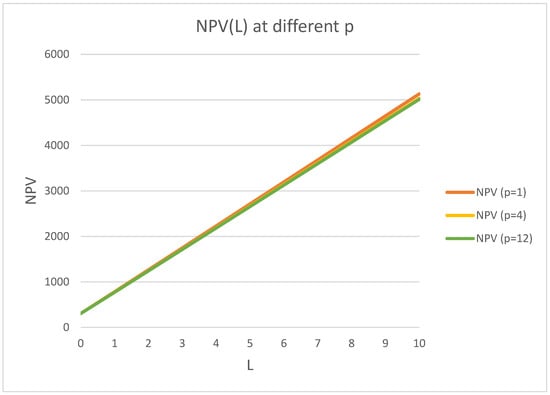
Figure 12.
Change of net present value, NPV, with leverage, L, for kd = 0.14, k0 = 0.22, p = 1, 4, and 12, for a 3-year project (n = 3).
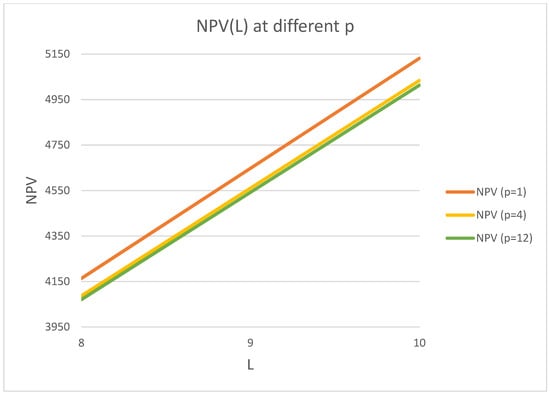
Figure 13.
Change of net present value, NPV, with leverage, L, for kd = 0.14, k0 = 0.22, and p = 1, 4, and 12, for a 3-year project (n = 3) (larger scale).
5.6. Discussions
Let us discuss the obtained results.
One can come to the following conclusions from the data of the above Figure 1, Figure 2, Figure 3, Figure 4, Figure 5, Figure 6, Figure 7, Figure 8, Figure 9, Figure 10, Figure 11 and Figure 12 and Table 1, Table 2, Table 3, Table 4, Table 5 and Table 6.
At any number of payments of tax on income, p, WACC decreases with leverage, L (Figure 2, Figure 3, Figure 4 and Figure 5 and Table 1 and Table 2).
- (1)
- The weighted average cost of capital, WACC, increases with p. With larger p, the correspond curves’ WACC(L) line is higher.
- (2)
- The distance between two curves, WACC(L), corresponding to p = 1 and 4, is much larger than the splitting of the curves WACC(L) for p = 4 and 12. Therefore, the distance between the curves’ WACC(L) decreases with p.
- (3)
- Net present value, NPV, linearly grows with leverage at any number of interest on debt payments as well as of payments of tax on income, p.
- (4)
- For perpetuity or long-term projects for equity capital owners, the change of NPV with p (p1 = p2) is a small value (this could be seen in the tables).
- (5)
- For perpetuity or long-term projects for equity and debt capital owners, the change of NPV with p is a bigger value (seen in the tables and in the figures).
- (6)
- This change of NPV with p for projects of arbitrary duration is much bigger and must be taken into account at the investment project effectiveness valuation.
- (7)
- For equity capital owners, NPV increases with p; thus, the investment project effectiveness increases with p.
- (8)
- The situation is inversed for owners of equity and debt capital. NPV decreases with p. In other words, the effectiveness of the project decreases with p.
- (9)
- Thus, companies should pay in the latter case interest on debt and tax on income once per period. However, in the former case, more frequent payments by the companies are profitable for the investment project effectiveness.
- (10)
- Note that size of effect of p for long-term projects is not too significant, but for the arbitrary duration projects the account of the number of payments could be very important and could impact the effectiveness of the project significantly, decreasing it or increasing it. The effect value depends on the project parameters kd, k0, n, t, S, etc.
6. Conclusions
We practically do not have the investment models that can numerically assess the investment projects’ effectiveness. Among a few of them, which allow this, there are, developed by the authors of this article, investment models. In addition, there are practically no investment models that take into account the conditions of the real functioning of investment projects. Currently, this article and article [1] bridge this gap in the literature as well as in the science of investment and develop new investment models that are much closer to real practice.
Eight investment models (of perpetuity and of arbitrary duration), which take into account the real conditions of investments (advance frequent payments of interest on debt and of tax on profit), were developed here for the first time.
Their use opens the possibility to study the influence of any of the main parameters of projects (equity cost, k0; equity value, S; profitability of investments, β; investment value, I; leverage level, L; net operating income, NOI; tax on income, t; debt cost, kd; project duration, n; frequency of interest on debt, p1; and tax on income, p2, payments) on the net present value, NPV, one of the main parameters of the effectiveness of projects.
Developed models help study different investments’ problems, such as the impact of taxing, of debt financing, project duration, of leverage level, of financing method, of payments of interest, frequency on debt, of tax on profit frequency, and of any other parameters on investment efficiency. As well, these models will improve the quality of project ratings’ issues [23]. They help achieve more correct valuations of investment projects’ effectiveness.
We made the numerical calculations for four models without flow splitting and got the following results.
- –
- For equity capital owners, the net present value, NPV, increases with the payments’ frequency of interest on debt and tax on profit, p. In other words, the project effectiveness increases with p.
- –
- For equity and debt capital owners, the net present value, NPV, decreases with the payments’ frequency of interest on debt and tax on profit, p. In other words, the project effectiveness decreases with p.
Thus, from the point of view of the dependence of NPV on p, a separate company should pay tax on profit and interest on debt in advance as frequently as it is possible because, in this case, NPV increases with p, while the pair “company–creditor” should pay interest on debt and tax on profit once per year because, in this case, NPV decreases with p.
Additionally, from the calculations it was seen that size of the effect of p for long-term projects was not too significant. However, for the projects of arbitrary duration, the accounting of the number of payments could be very important and could impact the effectiveness of the project significantly, decreasing it or increasing it. The effect value depends on the project parameters kd, k0, n, t, S, etc.
7. General Conclusions: Comparing the Results of Current Paper and Our Previous Paper
We compared the results of the current paper with paper [1].
The results of the current paper and paper [1] are summarized in Table 7 below.

Table 7.
General conclusions: comparing the results of the current paper and paper [1].
Recommendations
By analyzing the results of the current paper and paper [1], the following recommendations are made (see Table 7).
For companies:
separate companies (see “Equity owners” line in Table 7)
- –
- From the point of view of the dependence of WACC on p (decreases with p [1]), a company should pay tax on profit at the end of periods as frequently as it is possible because in this case company value increases.
- –
- From the point of view of the dependence of NPV on p, a company should pay tax on profit in advance as frequently as it is possible because in this case NPV increases with p.
- –
- Pair “company–creditor” (see “Equity and Debt owners” line in Table 7)
- –
- From the point of view of the dependence of WACC on p (decreases with p [1]), a company should pay tax on profit at the end of periods as frequently as it is possible because in this case company value increases.
- –
- From the point of view of the dependence of NPV on p, a company should pay tax on profit at the end of periods as frequently as it is possible because in this case NPV increases with p.
For the tax regulator
The tax regulator must regulate the frequency and method of paying income tax (at the end of periods or in advance) in such a way as to stimulate the growth of the capitalization of companies, allowing an increase in the profitability of their investment programs.
To increase the capitalization of companies, it is necessary to reduce the cost of raising capital. Table 7 shows that for this purpose the payment of income tax must be made by frequent payments at the end of the payment periods.
The increase in the profitability of their investment programs for individual companies is achieved when income tax is paid in advance with frequent payments.
For a pair of “a company + creditor”, an increase in the profitability of their investment programs is achieved when income tax is paid by frequent payments at the end of the payment periods.
Thus, from the point of view of the effectiveness of investment programs of companies, the tax regulator should differentiate the method of paying income tax for individual companies and for pairs of “company + lender”.
The obtained results help the tax regulator (Finance Ministry) understand the influence of the frequency of payments of tax on income and the credit regulator (Central Bank) understand the influence of the frequency of payments of interest on debt on the investment projects’ effectiveness. This allows them to modify and improve tax legislation and credit policy, respectively.
Created by us in the current paper and in paper [1], modern investment models are much more close to possible real investment conditions than standard ones. This determines their importance for finance and economics, and they could be applied in real economic practice more successfully.
In conclusion, we present Table 8, showing the impact of equity cost, k0, and debt cost, kd, on WACC and NPV for different types of payments of tax on profit (at the ends of periods and in advance) for equity owners and for equity and duty owners. These results as well will be useful for company management, for tax regulators, and for credit regulators.

Table 8.
Impact of equity cost and debt cost on WACC and NPV for different types of payments of tax on profit (at the ends of periods and in advance) for equity owners and for equity and duty owners.
As future plans, the authors are planning to create investment models, both long-term as well as of arbitrary duration, with variable operating income (NPV), for this a new parameter. Growth rate, g, will be incorporated into consideration. As well, the authors are planning to consider investment models with uniform debt repayment. Additionally, there are some other ideas.
Author Contributions
Conceptualization, P.B., T.F. and N.O.; methodology, T.F. and P.B.; software, P.B. and T.F.; validation, N.O.; formal analysis, P.B., T.F. and N.O.; investigation, P.B., T.F. and N.O.; writing—original draft preparation, P.B., T.F. and N.O.; numerical calculations, P.B. and T.F. All authors have read and agreed to the published version of the manuscript.
Funding
This research received no external funding.
Data Availability Statement
The data presented in this study are available on request from the corresponding author.
Conflicts of Interest
The authors declare no conflict of interest.
References
- Brusov, P.; Filatova, T.; Chang, S.-I.; Lin, G. Innovative Investment Models with Frequent Payments of Tax on Income and of Interest on Debt. Mathematics 2021, 9, 1491. [Google Scholar] [CrossRef]
- Brusov, P.N.; Filatova, T.V.; Orekhova, N.P.; Kulik, V.L.; Chang, S.-I.; Lin, Y.C.G. Modification of the Modigliani—Miller Theory for the Case of Advance Payments of Tax on Profit. J. Rev. Glob. Econ. 2020, 9, 257–267. [Google Scholar] [CrossRef]
- Brusov, P.N.; Filatova, T.V.; Orekhova, N.P.; Kulik, V.L.; Chang, S.-I.; Lin, Y.C.G. Application of the Modigliani–Miller Theory, Modified for the Case of Advance Payments of Tax on Profit, in Rating Methodologies. J. Rev. Glob. Econ. 2020, 9, 282–292. [Google Scholar] [CrossRef]
- Kang, J. The conditional relationship between financial leverage and corporate investment: Further clarification. J. Bus. Financ. Account. 1995, 22, 1211–1219. [Google Scholar] [CrossRef]
- Whited, T. Debt, Liquidity constraints and corporate investment: Evidence from panel data. J. Financ. 1992, 47, 1425–1461. [Google Scholar] [CrossRef]
- Escobar-Anel, M.; Lichtenstern, A.; Zagst, R. Behavioral portfolio insurance strategies. Financ. Mark. Portf. Manag. 2020, 34, 353–399. [Google Scholar] [CrossRef]
- Kahneman, D.; Tversky, A. On the reality of cognitive illusions. Psychol. Rev. 1996, 103, 582–591. [Google Scholar] [CrossRef] [Green Version]
- Brown, K.; Harlow, W.; Zhang, H. Investment Style Volatility and Mutual Fund Performance. J. Investig. Manag. 2021, 19, 78. [Google Scholar]
- Gidwani, B. Some Issues with Using ESG Ratings in an Investment Process. J. Investig. 2020, 29, 76–84. [Google Scholar] [CrossRef]
- Cakici, N.; Zaremba, A. Size, Value, Profitability, and Investment Effects in International Stock Returns: Are They Really There? J. Investig. 2021, 30, 65–86. [Google Scholar] [CrossRef]
- Black, F.; Litterman, R. Global Portfolio Optimization. Financ. Anal. J. 1992, 48, 28–43. [Google Scholar] [CrossRef]
- Lang, L.E.; Ofek, E.; Stulz, R. Leverage, investment, and firm growth. J. Financ. Econ. 1996, 40, 3–29. [Google Scholar] [CrossRef] [Green Version]
- Brusova, A. A comparison of the three methods of estimation of weighted average cost of capital and equity cost of company. Financ. Anal. Probl. Solut. 2011, 34, 36–42. [Google Scholar]
- Brusov, P.; Filatova, T. The Modigliani–Miller theory with arbitrary frequency of payment of tax on profit. Mathematics 2021, 9, 1198. [Google Scholar] [CrossRef]
- Modigliani, F.; Miller, M. The cost of capital, corporate finance, and the theory of investment. Am. Econ. Rev. 1958, 48, 261–297. [Google Scholar]
- Modigliani, F.; Miller, M. Corporate income taxes and the cost of capital: A correction. Am. Econ. Rev. 1963, 53, 147–175. [Google Scholar]
- Modigliani, F.; Miller, M. Some estimates of the cost of capital to the electric utility industry 1954–1957. Am. Econ. Rev. 1966, 56, 333–391. [Google Scholar]
- Brusov, P.; Filatova, T.; Orehova, N.; Eskindarov, M. Modern Corporate Finance, Investments, Taxation and Ratings, 2nd ed.; Springer Nature Publishing: Cham, Switzerland, 2018; pp. 1–571. [Google Scholar]
- Ibragimov, R.G.; Panferov, G.A. Generalization of the Modigliani-Miller Theory: Myth and Reality. Financ. Theory Pract. 2014, 3, 114–122. (In Russian) [Google Scholar]
- Brusov, P. To the Question about One Publication. Financ. Theory Pract. 2015, 2. (In Russian). Available online: http://www.fa.ru/org/div/edition/vestnik/journals/2015%20%E2%84%962.pdf (accessed on 16 December 2021).
- Brusov, P.N.; Filatova, T.V.; Orekhova, N.P.; Eskindarov, M.A.; Kulik, V.L. Modern Theory of Capital Cost and Capital Structure by Brusov–Filatova–Orekhova (BFO Theory) for Companies, which Ceased to Exist at the Time Moment n. J. Rev. Glob. Econ. 2015, 4, 87–95. [Google Scholar] [CrossRef]
- Dimitropoulos, P. Capital structure and corporate governance of soccer clubs: European evidence. Manag. Res. Rev. 2014, 37, 658–678. [Google Scholar] [CrossRef]
- Machado, L.K.; Prado, J.W.; Vieira, K.C.; Antonialli, L.M.; Santos, A.C. The relevance of capital structure on firm performance: A multivariate analysis of publicly traded Brazilian companies. REPeC Brasília 2015, 9, 384–401. [Google Scholar] [CrossRef]
- Barbi, M. On the risk-neutral value of debt tax shields. Appl. Financ. Econ. 2011, 22, 251–258. [Google Scholar] [CrossRef]
- Pavel, Z. The Impact of Cash Flows and Weighted Average Cost of Capital to Enterprise Value in the Oil and Gas Sector. J. Rev. Glob. Econ. 2018, 7, 138–145. [Google Scholar] [CrossRef]
- Justyna, F.-D.; Magdalena, M.-S.; Anna, M. Energy Sector Risk and Cost of Capital Assessment—Companies and Investors Perspective. Energies 2021, 14, 1613. [Google Scholar] [CrossRef]
- Angotti, M.; de Lacerda Moreira, R.; Hipólito, J.; do Nascimento, B.; de Almeida Bispo, O.N. Analysis of an equity investment strategy based on accounting and financial reports in Latin American markets. Reficont 2018, 5. Available online: www.reficontunimep.com.br/ojs/index.php/Reficont/article/view/93 (accessed on 16 December 2021).
- Cristian, V.-N.; Juan, P.S.-R.; Alfaro Miguel, D.; Riveros, N. Cost Of Capital Estimation For Highway Concessionaires In Chile. J. Adv. Transp. 2018, 2018, 2153536. [Google Scholar] [CrossRef] [Green Version]
- Myers, S. Capital Structure. J. Econ. Perspect. 2001, 15, 81–102. [Google Scholar] [CrossRef] [Green Version]
Publisher’s Note: MDPI stays neutral with regard to jurisdictional claims in published maps and institutional affiliations. |
© 2022 by the authors. Licensee MDPI, Basel, Switzerland. This article is an open access article distributed under the terms and conditions of the Creative Commons Attribution (CC BY) license (https://creativecommons.org/licenses/by/4.0/).