Abstract
Motor Current Signature Analysis (MCSA) is a popular method for the detection of faults in electric motor drives, particularly in Induction Machines (IMs). For Bearing Defects (BDs), which are very much related to the rotational frequency, it is important to maintain the speed at a target reference value in order to distinguish and locate the different BDs. This can be achieved by using a powerful control such as the Direct Torque Control (DTC), but this control causes the variation of the supply frequency and the current signal to become non-stationary, so the integration of advanced signal processing methods becomes necessary by using a suitable filter to handle the frequency content depending on the BDs, such as the Hilbert filter. This paper aims to adopt the Hilbert Transform (HT) for extracting the signature of the faults from the stator current envelope to detect the different BDs in the IMs when they are controlled by an intelligent DTC control driven by Artificial Neural Networks (ANN-DTC). This ANN-DTC control is a shaping factor rather than a disturbing one, which contributes with the Hilbert filter to the diagnosis of BDs. This technique is tested for the four locations of BDs: the inner ring, the outer ring, the ball, and the bearing cage in different operating situations without control and with conventional DTC and ANN-DTC controls. Thus, detecting the location of the defect exactly at an early stage contributes to achieving maintenance in a fairly short time. The performance of the chosen approach lies in minimizing the electromagnetic torque ripples as a result of the control and increase of the amplitudes of the spectra related to BDs compared to other harmonics. This performance is verified in the MATLAB/SIMULINK environment.
1. Introduction
Many electric drive machines are induction machines (IMs) that account for about 90% of the rotating machines used in industries []. They are characterized by their robustness, reliability, low cost of manufacture and maintenance, etc. [,,]. Despite all these characteristics, human error, manufacturing defects, and power disruptions can cause electrical or mechanical failures, disrupt business continuity, and cause unexpected shutdowns.
The defects that concern the IM are of different types: (i) the bearing defects (BDs) (41–42%), (ii) the inter-whorl short circuits of the stator windings (28–36%), (iii) the defects in the rotor (8–9%), and (iv) the other failures (14–28%) []. This shows that the majority of defects are BDs. These failures may have occurred as a result of excessive load, lubricant contamination, or tree misalignment [].
The diagnostic procedures are diverse. The criteria for choosing an approach depend essentially on the information that the person wishes to acquire about the system and the complexity of the system itself. Basically, there are two main approaches: (i) model-based methods and (ii) model-free methods. The first is based on an analytical model using observation algorithms, especially the Kalman filter, in which the deviation between the values of the model parameters and the actual system is controlled and estimated [,,]. There are different methods for modeling a faulty IM; [] proposed an analytical model based on the presentation of different machine inductances in Fourier series without any reference frame transformation, this model is dedicated to the study of defects of inner ring of bearings of the IM. In [], an analytical model is designed to deal with eccentricity of an IM using a conformal winding tensor approach. In [], a model based on Winding Function Analysis (WFA) is adopted for the diagnosis of defects of broken rotor bars of an IM. The model-free methods are mainly based on the processing of different quantitative signals from the machine (current, voltage, vibration, noise emissions, speed, etc.). The principle of signal analysis methods is based on the existence of frequency characteristics specific to the healthy or faulty operation of the process. The signal processing-based method is preferred over the model-based method since it does not mandate any complex mathematical assumptions or models []. There is simplicity of implementation, especially when it comes to the sampling and analysis of electrical quantities in relation to mechanical quantities.
Motor current signature analysis (MCSA) is recognized as the prevalent and preferred approach to detect various faults in the IM [,,,,]. Generally the principle of this approach is dependent on the fast Fourier transform (FFT) which generates the spectra corresponding to each type of fault. However, the evolution of closed-loop control systems (e.g., Direct Torque Control (DTC)) makes the FFT insufficient, because of the overlap between the harmonics of the control and those caused by the fault due to the non-stationary of the current signal [,,,], so that during no-load operation the amplitudes of the spectra corresponding to the faults are no longer clear and it is difficult to distinguish them from those caused by the control.
Indeed, the challenge is to distinguish the measured signal from other disturbing signals in order to find an informative signal. In this context, there are several advanced methods of signal processing widely used in the literature in the diagnosis of various faults in case of non-stationary signals, namely the short-term Fourier transform (STFT) [], wavelet transform (WT) and Hilbert transform (HT) [,,]. The method based on the Hilbert transform (HT) has shown its effectiveness especially with regard to its low sensitivity to variations in load torque [,], as well as the simplicity of its mathematical model. The authors of [] have used the HT for the diagnosis of rotor bar breaks (BRB) in a DTC-controlled IM. In addition, the authors of [] also preferred HT for the diagnosis of BRBs of the IM, [] based on HT and DWT for diagnosing the various faults of the IM; thus in [], the Hilbert transform is adopted for the processing of non-stationary vibration signals.
Generally, the effectiveness of such a filter lies in the detection and classification of a fault in the presence of constraints such as the controls that control the behavior of the machine, so the choice of diagnostic procedures must take into account the control of the machine. It should be efficient not only for the machine but also not disturb the detection of different faults, where the development of a control to facilitate the diagnosis is important.
The first control developed in the literature is the Scalar Control (SC) [,], which is an open loop control widely used in industry. Its disadvantages arise from: the drive of the machine at low speeds, which causes a voltage drop caused by machine parameters, which becomes negligible during this regime; vector control, which requires the installation of a flux sensor in the machine gap; and direct flux orientation control (DFOC), which requires the installation of a flux sensor in the machine. For these reasons, researchers in recent years have resorted to the famous DTC control [,,,,,]. The main benefits of this strategy are as follows: (1) simplicity of implementation, (2) robustness, and (3) low sensitivity to the machine’s parametric variation. However, its main disadvantage lies in the ripples of the electromagnetic couple.
Several efforts have been focused on improving the performance of DTC. The solution that leads to the best result is based on artificial intelligence (AI). In [], fuzzy logic is presented to the DTC; it consists of replacing hysteresis regulators and the switching array with a Fuzzy Logic Controller (FLC) [,,,]. The authors have shown that this method substantially reduced torque ripples and THD stator currents.
The main goal of this work study is to diagnose the BDs of an IM controlled by a control using ANN. The method of analyzing the stator current using the Hilbert filter is adopted to detect and classify the BDs despite the presence of the harmonics generated by the control. The interest of choosing the ANN-DTC control is to track the reference speed depending on the spectra of the BDs, to minimize the effect of the control on the harmonics of the stator current of the machine in order to distinguish them from those caused by the BDs, and to increase the efficiency of the use of the Hilbert filter.
The main contributions of this article are summarized as:
- Development of an ANN-DTC control to minimize the harmonic rate of the current signal.
- The Hilbert filter applies to the signal processing of the stator current of the IM.
- Diagnosis of different types of BDs.
- A comparative analysis of the results driven by training without control, with conventional DTC control, and with ANN-DTC.
The main results of the proposed models lie in the increase of the spectra amplitudes of BDs compared to the other spectra of harmonics caused by the control itself; in fact, these amplitudes are increased by 30% when using an ANN-DTC control compared to a conventional DTC control and by 41% compared to a direct-feed. In the case of inner and outer ring defects, ANN-DTC improves the amplitudes of speed variations by 60% compared to a direct-feed, and by up to 50% compared to a conventional DTC.
The sections in this article will be organized as follows: Section 2 introduces the model of IM. The four bearing defects and the mathematical equations of their characteristic frequencies are illustrated in Section 3. Section 4 focuses on the ANN-DTC command. The Hilbert filter model is presented in Section 5. Section 6 is dedicated to the presentation of the signals obtained and their interpretations. The results of this work are compared with recent works as shown in Section 7, and Section 8 presents the conclusions of this paper.
2. IM Model
The IM model is characterized by electrical and mechanical parameters. The identification of electrical parameters makes it possible to build a model faithful to the real machine, as shown in Figure 1.
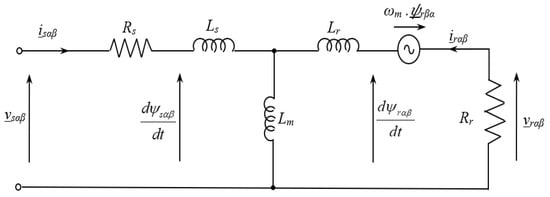
Figure 1.
Model of IM in the α, β frame.
Given the non-linearity of the IM system and the two-phase model in the α,β frame linked to the stator, the operation of the IM system is described by the following equations []:
- Electrical equations:
- Magnetic equations
- Mechanical equations:
3. Bearing Defects
A bearing is a rolling element to ensure rotational guidance and prevent displacement internally, with the exception of that of rotation. It includes: (1) rolling element, (2) outer ring (OR), (3) inner ring (IR), and (4) cage, as demonstrated in Figure 2, Most IMs use ball bearings (Ball) or roller bearings. Electrical machines use two bearings by which the end of the rotor shaft is held. Such bearings wear out as a matter of continuously undergoing friction.

Figure 2.
Bearing composition.
The main causes of bearing failure are as follows []:
- High rotor vibrations due to high load torque.
- Incorrect installation of the bearing.
- Heat is conducted through the shaft.
- Friction and contamination.
BDS generally lead to several mechanical effects in machines, such as an increase in noise level and the occurrence of vibrations through the rotor about the longitudinal axis of the machine. It has also been shown that bearing defects make the rotor eccentric, which produces an unbalanced magnetic attraction. In addition, they induce oscillations in the machine’s load torque and harmonics in the current signal spectrum [,,,,].
Most rolling element bearing condition monitoring techniques are designed for the detection of four characteristic fault frequencies. This has led to the well-known practice of categorizing BDs according to the location of the defect, i.e., defect of the inner ring, outer ring, ball or cage [].
The spectral content of the signals is usually attained by FFT. This transform makes it possible to move from the time domain to the frequency domain through a clear discovery of both the main spectrum and harmonic spectra [,].
With:
fr: Rotation frequency.
Nb: Number of balls.
Db: Ball diameter.
Dc: Cage diameter.
α: Contact angle.
The frequency that corresponds to the BD is determined by the following equation [,,]:
With:
k: Order of the harmonic.
fs: Frequency of power sources.
fc: Characteristic frequency of the defect, equivalent to fOR, fIR, fBall and fCage.
The presence of a mechanical fault produces vibrations, load torque oscillations and harmonics in the current signal; in Equation (9) the load torque can be represented by a DC component of amplitude T0, and torque variations related to BDs. These torque variations have amplitude Tc and frequency fc [].
4. Direct Torque Control Considering Neural Networks
Direct torque control (DTC) will be among the standard controls in the industry [] due to its good torque dynamics with a high degree of reliability for the industrial process. However, its major drawback lies in the significant undulations of torque and flux, caused by hysteresis comparators []. These ripples result in signals enriched with harmonics and cause mechanical vibrations and noticeable noises. Thus, they lead to a degradation in machine life [].
To cope with its drawbacks and increase the performance of this control, the researchers integrated artificial intelligence to design a new intelligent DTC control. Replacing speed controller, switching table, and hysteresis comparators by structures based on the ANN is one of the solutions used in several research works in this direction [,,].
4.1. Classic DTC
The proposal of DTC control of the asynchronous machine was made by Depenbrock and Takahashi in the 1980s [,]. This control became increasingly popular. The estimated quantities of stator flux and electromagnetic torque are calculated from the electrical quantities of the IM by the Equations (10) and (11) [].
The block diagram of DTC is shown in Figure 3.
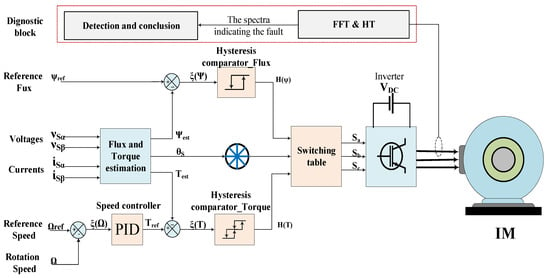
Figure 3.
Classic DTC with IM and the diagnostic block.
4.1.1. Hysteresis Comparators
Figure 4a shows a circular ring that delimits the end of each flux vector. This is achieved thanks to the comparator with two levels of hysteresis (Figure 4b). The other comparator, with three levels of hysteresis, illustrated in Figure 4c, is capable of providing the feature of controlling the electromagnetic torque of the motor in the two directions of rotation by developing a positive torque or a negative torque.
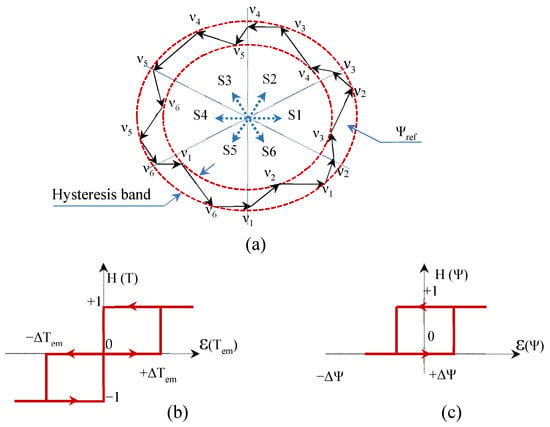
Figure 4.
(a) Flux trajectory. Hysteresis comparators: (b) three−level torque, (c) two−level flux.
4.1.2. Switching Table
The voltage vectors are determined as per the sector and the variation of flux and torque, for following both the flux and torque reference values [,]. Table 1 shows the possibilities of choosing the appropriate voltage vector.

Table 1.
Switching table.
4.2. ANN-DTC
The main drawbacks of DTC control are torque and flux ripples, as well as harmonic currents in transient and permanent modes. Hysteresis comparators, switching tables, and derived full proportional integrator control (PID) are the elements responsible for these problems. For this, these elements will be replaced by neural controllers in order to improve the functionality of DTC control. Figure 5 demonstrates the block diagram of the ANN-DTC control [,,].
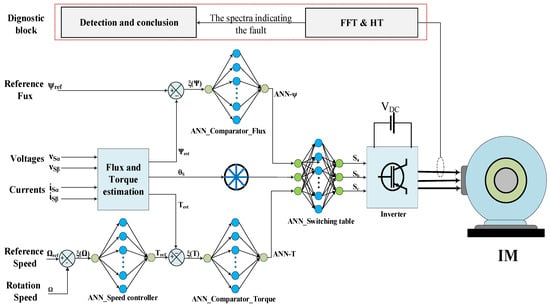
Figure 5.
Global structure of ANN-DTC for an induction motor, with diagnostic scheme.
4.2.1. ANN-Driven Comparators, Regulation Speed, and Switching Tables Controllers
The selection of neural network architecture is driven by the mean quadratic error (MSE) attained during learning and not on a mathematical model []. The procedure is described by the organizational chart in Figure 6.
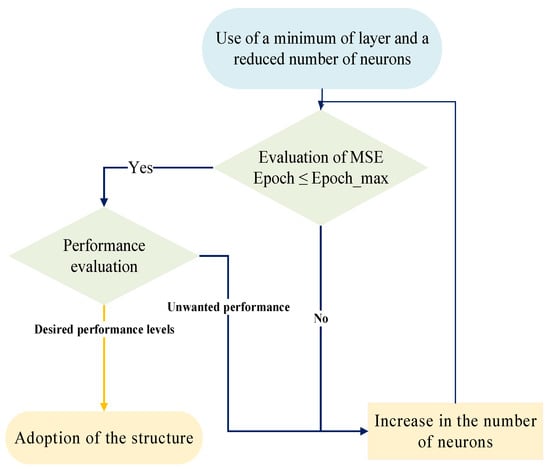
Figure 6.
Procedure for the adoption of the ANN structure.
A neural network is defined as a mathematical processing model. The neural networks share the same features as biological neural networks. They consist of many non-linear computational components called neurons, which operate in parallel. The mathematical expressions between them are weighted and represented through numerical values defined as weights []. ANNs are networks considering the connection of elementary processors running in parallel. Use of neural network training data is one of the most important characteristics of ANNs to both learn and improve the operation [,]. The neuron is the building component of the ANN and is associated with weights, biases, and activation functions as demonstrated in Figure 7. The below equations mathematically describe a neuron:
where xi, wi, b, and y are respectively the input signals, the corresponding input-signal synaptic weight, a bias parameter, and the output signals of the neuron. F1(s) is the hyperbolic nonlinear activation function demonstrated in Figure 7, that is described by the below equation [].

Figure 7.
Schematic structure of ANN for DTC.
And F2(s) is a linear activation function described by the below equation:
where both(α and β) are both known as gains. This activation function is differentiable, bipolar, and monotonic and is associated with zero value as the maximum possible gain.
The neural network in this work is formed through the use of the feed-forward back propagation technique until the mean quadratic error (MSE) between the desired model and the output model is very small. The calculation of the MSE is based on the below equation:
where Oi represents network’s real response, di(k) represents the response that is desired, N reflects the number of input-output training data, and k defines the number of iterations considered.
The objective behind the update in the weights of each neuron is the minimization of the error value (MSE). The expression of this update of the weights is expressed by (17) [].
where wji (k + 1) corresponds to the new weight between the ith and jth neurons, wji (k) reflects the old weight, and η represents the learning rate.
The total number of neurons for every controller is taken into consideration in a hidden layer for network training. In relevance to each hidden layer neuron, the input (xi) is associated with a synaptic weight (wi). The hidden layer’s output is where (b) represents the neuron bias value []. The output function of each neural unit is a nonlinear activation function of the hyperbolic-tan type, so there is a linear activation function to apply the error backpropagation algorithm. Given the ANN output value not having the exact values of 0 and 1 all the time, a comparator that does not account for a hysteresis band is presented to attain an output value of 0 or 1 of the ANN until the time comes to reach the output values as desired. The weights are updated through the utilization of a backpropagation method (see Equation (17)) with minimum error (see Equation (16)).
In this work, controllers considering neural networks of speed, stator flux, and torque are used, as demonstrated in Figure 8a–c. In the proposed model, the ANNs that play the role of hysteresis comparators are used for the generation of an on/off switching model in the ANN-based switching array shown in Figure 8d, to control the invertor’s switching elements. The error among the reference set point and the estimated set point, shown in Equation (18), represents the input of every ANN comparator.
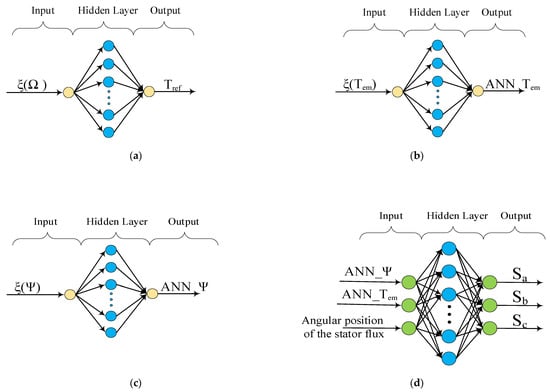
Figure 8.
ANNs for: speed controller (a), torque controller (b), stator flux controller (c), switching table (d).
4.2.2. ANN Algorithm Selection Results
Among the algorithms proposed in the Matlab toolbox, we find three algorithms which are: gradient descent, the gradient descent algorithm with momentum, and the Levenberg–Marquardt algorithm. They are described by the traingd, traingdm, and trainlm functions, respectively. The performance indices defined in the toolbox are: (1) MSE that should be minimized; and (2) R representing the regression value and that reflects the correlation among outputs and targeted outputs.
The results of the tests of these algorithms, in relevance to the speed of convergence towards the minimum of the quadratic error, showed that the Levenberg–Marquardt technique is the best, ahead of the other two, and it gives good performance. However, for all three algorithms, the time needed to learn is very slow causing the computer to crash when estimating speed, in addition to poor performance. The learning outcomes found for the ANN controller blocks are presented in Figure 9, Figure 10, Figure 11 and Figure 12. They correspond to results of Levenberg–Marquardt, which were chosen at the end for the application in the ANN-DTC control.
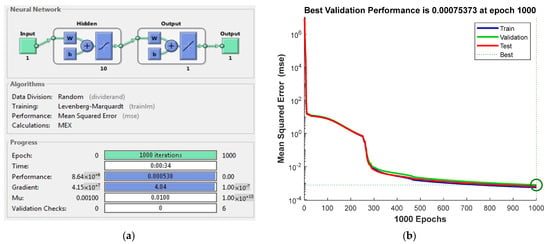
Figure 9.
ANN architecture of the speed controller and its evolution formation (a). Performance of the mean quadratic error (training, testing, validation) (b).
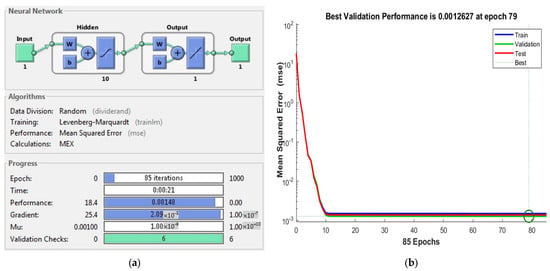
Figure 10.
ANN architecture of the torque controller and its evolution formation (a) Performance of the mean quadratic error (training, testing, validation) (b).
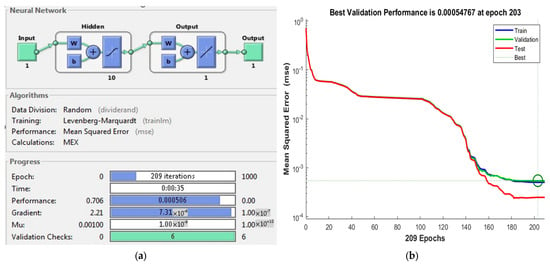
Figure 11.
ANN architecture of the flux controller and its evolution into training (a). Performance of the mean quadratic error (training, testing, validation) (b).
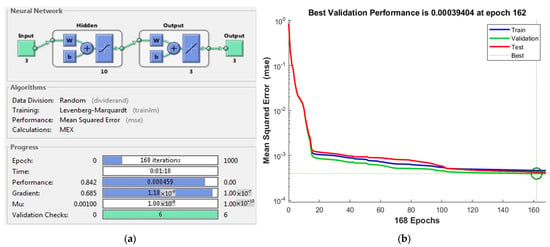
Figure 12.
ANN architecture of the switchboard controller and its evolution formation (a). Performance of the mean quadratic error (training, testing, validation) (b).
According to Figure 9a, Figure 10a, Figure 11a and Figure 12a, the architecture utilized for the speed, torque, and flux hysteresis is 1-10-1-1, and 3-10-3-3 for the switching table. Figure 9b, Figure 10b, Figure 11b and Figure 12b illustrate how the mean square error evolves as a function of the number of epochs for the four controllers and switching array. This is because the drive of the network leads to a considerable minimization of the error among the predicted values and those of the target output. At an initial stage, the error undergoes a rapid reduction to 1000 and 85 epochs for speed and flux controllers and 209 and 168 epochs for torque controllers and switching tables, after which it becomes stable. This is attained when the final MSE is of low value of the order of 7.5373 × 10⁻⁴, 1.2627 × 10⁻³, 5.4767 × 10⁻³, and 3.9404 × 10⁻⁴ for every controller successively. Table 2 summarizes the algorithms and adopted values adopted in this case.

Table 2.
Specification of the optimum proposed ANN models, values and methods.
5. Hilbert’s Filter
The disadvantages reported in the introduction and inherent in FFT-driven analysis have led to the development of new diagnostic approaches considering advanced signal analysis tools such as the Hilbert transform [,,,].
The Hilbert transform (HT) can be defined as a time-frequency signal processing tool offering a large degree of resolution. Furthermore, it is an adaptive approach utilized for non-stationary signals as well as non-linear signals. Therefore, HT is among the favored advanced signal analysis techniques for defect diagnosis [,,,,,,,,]. HT does not account for a domain change, unlike other transforms such as FFT [].
The convolution of both the stator current of the real signal x(t) and the Hilbert transform of such signal with the time function (1/t) is described mathematically as given by Equation (21) []:
No equivalency exists in terms of the result of the HT in comparison with the original signal. In other words, a completely different signal with an offset in frequency component by 90° in comparison to the original signal is obtained. However, the amplitude remains the same. Therefore, the original signal and its Hilbert transform are orthogonal; all cosinusoidal functions are transformed into sinusoidal and vice versa [,].
The combination of the original signal and its transformed version gives the analytical signal or the envelope signal, as shown in Figure 13, whose instantaneous amplitude is [,]:

Figure 13.
The signal of the stator current of an IM and its envelope. Healthy state (a); with OR defect (b).
Its instant phase is:
The deformation of the envelope signal in Figure 13b compared to Figure 13a indicates the presence of a defect in the IM. For the envelope signal in the frequency domain, the component of the fundamental is eliminated, while the harmonic components have appeared. The calculations that show this are illustrated in [,].
6. Simulation Results and Analysis
A SIMULINK model has been developed for the sake of comparing the BD diagnostic results for IM in different situations: (i) without control, (ii) with a classic DTC control, and (iii) with an ANN-DTC control; simulations are performed in the case where the machine is healthy and then in the presence of BDs.
The BDs are represented by a sum of the oscillatory components of frequency fc and amplitude 2 Nm, which are added to the load torque; the simulation parameters are presented by:
- ➢
- Simulation time: 10 s.
- ➢
- Sampling frequency: fs = 10 Khz
A 1.5 kW IM engine was used, the parameters of which are given in Table A1 of Annex A1. Among the standard bearings used for the IMs of 1.5 Kw and axis height of 90 mm, we find the ball bearing of reference 62052RSC3, whose technical characteristics are given in Table A2, so the determined dimensions that allow the calculation of the characteristic frequencies of BD are as given in Table A3.
The characteristic frequencies for this type of bearing are:
With
Initially, the IM is started empty, and a load torque (Tref = 5 N.m) is applied at the time t = 5 s.
The signals that will be presented concern, on the one hand, the quantities of the electromagnetic torque and the speed of rotation, by which we estimate the impact of the BDs on these quantities in terms of ripples. On the other hand, to determine the influence of the BDs on the stator current, the illustration of its signature and its THD is necessary. Thus, a spectral analysis of the current envelope will be approached to locate the different BDs, in the three situations already mentioned, for comparing the impact of the BDs, the classical DTC control and ANN-DTC on the spectral content of the electric current.
6.1. Simulation Results without Control
It is very interesting to see the performance of the IM when it is powered by a balanced three-phase source (ideal) of fixed frequency (50 Hz), in the healthy state, then in the presence of BDs.
Figure 14, Figure 15, Figure 16, Figure 17, Figure 18, Figure 19, Figure 20, Figure 21, Figure 22 and Figure 23:

Figure 14.
Performance in healthy state of IM without control: (a) rotation speed and (b) motor torque.

Figure 15.
Performance with IR bearing defect of IM without control: (a) rotation speed and (b) motor torque.

Figure 16.
Performance with OR bearing defect of IM without control: (a) rotation speed and (b) motor torque.

Figure 17.
Performance with Ball bearing defect of IM without control: (a) rotation speed and (b) motor torque.

Figure 18.
Performance with Cage bearing defect of IM without control: (a) rotation speed and (b) motor torque.

Figure 19.
Performance in healthy state of IM without control: (a) Stator current and (b) THD at no-load and (c) THD with load (5 Nm).

Figure 20.
Performance with IR bearing defect of IM without control: (a) Stator current and (b) THD at no-load and (c) THD with load (5 Nm).

Figure 21.
Performance with OR bearing defect of IM without control: (a) Stator current and (b) THD at no-load and (c) THD with load (5 Nm).

Figure 22.
Performance with Ball bearing defect of IM without control: (a) Stator current and (b) THD at no-load and (c) THD with load (5 Nm).

Figure 23.
Performance with Cage bearing defect of IM without control: (a) Stator current and (b) THD at no-load and (c) THD with load (5 Nm).
Figure 14, Figure 15, Figure 16, Figure 17 and Figure 18 illustrate the temporal signature of the mechanical quantities of torque and speed when the IM is powered directly by a fixed frequency source at 50 Hz for a healthy machine, and then in the presence of the four BDs.
In the healthy state, the speeds, and frequencies of rotation unloaded are, respectively, 1466.26 Rpm and 24.43 Hz. Under the load torque (Tref = 5 Nm) they become 1341.64 Rpm and 22.36 Hz. These values are the references that allow the determination of the characteristic frequencies in the case of BD. All electrical (current) and mechanical (torque and speed) signals are normal and have no ripples, so the THD in this case is zero.
In the presence of BDs, Figure 14, Figure 15, Figure 16, Figure 17 and Figure 18 clearly show the undulations of torque and speed, so the THD summarizes the influence of BDs on the current of the stator.
Indeed, for the BD at the bearing cage, the ripples of the speed and electromagnetic torque have an amplitude of about 6 Rpm and 0.2 Nm, respectively, while for the other BDs (IR, OR, and Ball), the speed and torque are less wavy and do not exceed 2 Rpm and 0.05 Nm, respectively.
In addition, Figure 19, Figure 20, Figure 21, Figure 22 and Figure 23, show the THD of the current in the event of BD. The THD deflates the amplitude of the ripples of the quantities of torque and speed. That is why it is higher for the defect of the cage (0.97% in load and 0.93% empty), and it comes up to 0.11% in load and 0.12% unload for the defect of the inner ring of the bearing. Moreover, for the three BDs (IR, OR, and Ball), the THD of the current under load is slightly lower than that in the empty case. The difference can reach 0.05%, but when the ripples are significant, as in the case of the cage defect, it becomes negative (−0.04%).
Figure 24 illustrates the spectra in relation to the different BDs. For each defect, there are two spectra; the first on the left depends on the empty speed (1466.26 Rpm), and the second on the right depends on the speed under load (1341.64 Rpm). Thus, the variation Δf of the frequency of the spectra depends on the type of BD. This variation is 11.2 Hz for the IR defect, which has the highest characteristic frequency (fIR = 5.43.fr) and for the cage defect, which has the smallest characteristic frequency (fCage = 0.79.fr), the variation Δf = 1.5 Hz. This is already confirmed in formulas 23 to 27, where the frequency content of BD is closely related to the speed of rotation, so if the speed varies due to the variability of the load torque or the supply voltage, the diagnosis becomes more difficult and less conclusive.
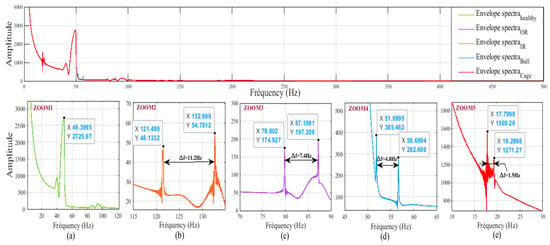
Figure 24.
The current envelope spectra corresponding to the BD for two speeds (top). Zoom showing each spectrum: (a) Healthy state, (b) IR defect, (c) OR defect, (d) Ball defect, (e) Cage defect.
Thus, it is better to target a single value of the rotational speed for which we already know the values of the spectra (nominal speed, for example). In Figure 25, the IM rotates at its nominal speed (1440 Rpm). This speed is obtained by acting on the loading torque (Tref = 1.086 Nm). Note that the IM rotates at this nominal speed, which corresponds to a mechanical frequency of fr = 24 Hz. The values of the characteristic frequencies of BDs are as follows:
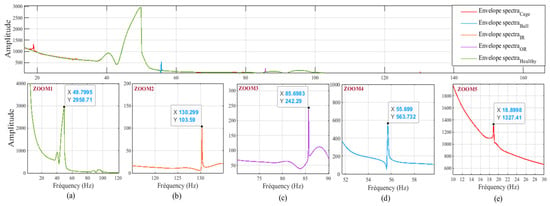
Figure 25.
The current envelope spectra corresponding to the BDs for the nominal speed (1440 Rpm) (top). Zoom showing each spectrum: (a) Healthy state, (b) IR defect, (c) OR defect, (d) Ball defect, (e) cage defect.
In this case, where the IM is powered directly by a fixed frequency voltage, it is difficult to detect the BDs by the MCSA because the speed varies constantly according to the load torque or the variation of the voltage of the power source, and even the BDs cause variations in the speed of rotation of the IM, which can bias the determination of the characteristic frequencies of the BD. Another important point is that when the signature of the wavy velocity contains only a few intersections with the targeted velocity, it will minimize the amplitude of the spectra indicating the BDs.
For these reasons, it is essential to follow the targeted (reference) speed at which these frequencies corresponding to the BDs have already been determined, so that the results are accurate, and the BD spectra are clear and of amplitude well distinguished from other harmonics. This can be achieved through robust and efficient controls.
The simulation results with DTC and ANN-DTC control are shown in figures ranging from 26 to 48, in which the IM must follow the nominal rotational speed (1440 Rpm) from the moment t = 1 s.
6.2. Simulation Results with Classic DTC
It is essential to present the results for a classic DTC control to show the importance of the chosen control (ANN-DTC) in this article.
Figure 26, Figure 27, Figure 28, Figure 29, Figure 30, Figure 31, Figure 32, Figure 33, Figure 34, Figure 35 and Figure 36:

Figure 26.
Performance in healthy state of IM with DTC control: (a) rotation speed and (b) motor torque.

Figure 27.
Performance with IR bearing defect of IM with DTC control: (a) rotation speed and (b) motor torque.

Figure 28.
Performance with OR bearing defect of IM with DTC control: (a) rotation speed and (b) motor torque.

Figure 29.
Performance with Ball bearing defect of IM with DTC control: (a) rotation speed and (b) motor torque.

Figure 30.
Performance with Cage bearing defect of IM with DTC control: (a) rotation speed and (b) motor torque.

Figure 31.
Performance in healthy state of IM with DTC control: (a) Stator current and (b) THD at no-load and (c) THD with load (5 Nm).

Figure 32.
Performance with IR bearing defect of IM with DTC control: (a) Stator current and (b) THD at no-load and (c) THD with load (5 Nm).

Figure 33.
Performance with OR bearing defect of IM with DTC control: (a) Stator current and (b) THD at no-load and (c) THD with load (5 Nm).

Figure 34.
Performance with Ball bearing defect of IM with DTC control: (a) Stator current and (b) THD at no-load and (c) THD with load (5 Nm).

Figure 35.
Performance with Cage bearing defect of IM with DTC control: (a) Stator current and (b) THD at no-load and (c) THD with load (5 Nm).
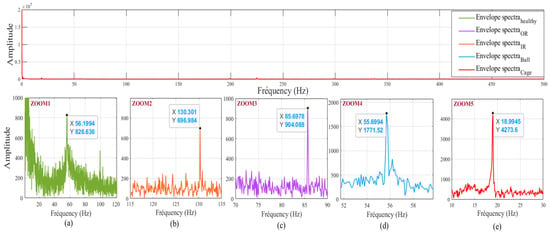
Figure 36.
The envelope spectra of the IM current controlled by DTC, corresponding to the BD (top) case of the classic DTC command, Zoom showing each fault spectrum: (a) Healthy state, (b) IR defect, (c) OR defect, (d) Ball defect, (e) cage defect.
In Figure 26, in the healthy state, the rotational speed signature follows the reference speed with some excesses that arrive at 1.5 Rpm, and for torque, this DTC command causes ripples that exceed 2 Nm in amplitude. Figure 31 presents the THD of the stator current in this situation, at 12.16% empty and 14.08%. This THD reflects the ripples in the current signal.
The presence of the BDs in the IM causes changes in the velocity signature by creating ripples of amplitude of about 1.5 Rpm for the three BDs (IR, OR, Ball) and exceeding 5 Rpm for the cage defect. For the torque, this DTC control causes ripples that exceed 3 Nm in amplitude for this IM in the case of BDs.
In addition, the Figure 31, Figure 32, Figure 33, Figure 34 and Figure 35 show the THD of the current in the event of BD. It varies between 13.08% and 15.49% empty, and between 14.58% and 15.75%, and there is not a big difference between the values that correspond to the first three defects (IR, OR, Ball) and those corresponding to the defect of the cage. Therefore the THD is not conclusive, because the proportion of harmonics created by the BDs is very small (11.5%) compared to the harmonics caused by the DTC control, so it is interesting to decrease the THD caused by the control, so that the distinction will be easier.
Despite the higher current THD, the functionality of this DTC command in relevance to tracking the reference speed makes the BD spectra clearer and their amplitudes are multiplied (Figure 36) compared to those in Figure 24. For example, the amplitude is 0.103 without control and 0.697 with the DTC control, an increase of seven times. The values of the amplitudes of the spectra for the three cases (without control, DTC, and ANN-DTC) are illustrated in Table 3.

Table 3.
Comparison of the amplitudes of the spectra of the BDs.
The most important thing in the case of diagnosis is to distinguish the spectra caused by the control from those caused by the BDs. The ANN-DTC control decreases the THD of the current, which minimizes the amplitude of the spectra caused by the control. On the other hand, it has good speed control functionality in comparison with the classical DTC, which increases the amplitude of the spectra caused by the BDs.
According to Figure 37, the spectra that correspond to the DTC command are always higher than those of the ANN-DTC command, but in the case of the OR defect, the spectrum amplitude indicating this defect is multiplied by about 6 times. This shows the interest of adopting this intelligent control for the diagnosis of BDs.
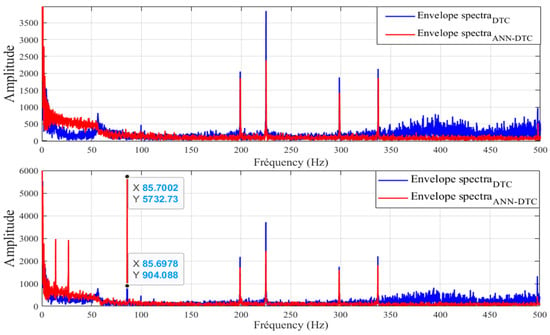
Figure 37.
Comparison of IM current envelope spectra controlled by DTC and ANN-DTC: Healthy State (top), with GOLD defect (Bottom).
6.3. Simulation Results with the ANN-DTC
The following figures relate to the approach taken in this article, which has yielded better results compared to the previous two cases.
Figure 38, Figure 39, Figure 40, Figure 41, Figure 42, Figure 43, Figure 44, Figure 45, Figure 46, Figure 47 and Figure 48

Figure 38.
Performance in healthy state of IM with ANN-DTC control: (a) rotation speed and (b) motor torque.

Figure 39.
Performance with IR bearing defect of IM with ANN-DTC control: (a) rotation speed and (b) motor torque.

Figure 40.
Performance with OR bearing defect of IM with ANN-DTC control: (a) rotation speed and (b) motor torque.

Figure 41.
Performances with Ball bearing defect of IM with ANN-DTC control: (a) rotation speed and (b) motor torque.

Figure 42.
Performance with Cage bearing defect of IM with ANN-DTC control: (a) rotation speed and (b) motor torque.

Figure 43.
Performance in healthy state of IM with ANN- DTC control: (a) Stator current and (b) THD at no-load and (c) THD with load (5 Nm).

Figure 44.
Performance with IR bearing defect of IM with ANN-DTC control: (a) Stator current and (b) THD at no-load and (c) THD with load (5 Nm).

Figure 45.
Performance with OR bearing defect of IM with ANN-DTC control: (a) Stator current and (b) THD at no-load and (c) THD with load (5 Nm).

Figure 46.
Performance with Ball bearing defect of IM with ANN-DTC control: (a) Stator current and (b) THD at no-load and (c) THD with load (5 Nm).

Figure 47.
Performance with Cage bearing defect of IM with ANN-DTC control: (a) Stator current and (b) THD at no-load and (c) THD with load (5 Nm).
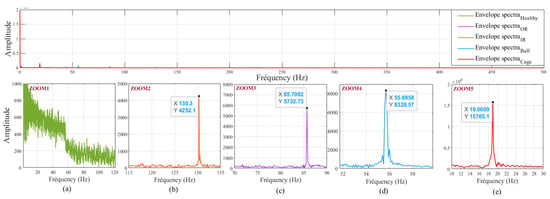
Figure 48.
The current envelope spectra corresponding to the BD (top) case of the ANN-DTC command. Zoom showing each fault spectrum: (a) healthy state, (b) IR defect, (c) OR defect, (d) Ball defect, (e) cage defect.
In Figure 38, in the healthy state, the rotational speed signature follows the reference speed with some excesses that arrive at 0.25 Rpm, and for the torque, this DTC command causes ripples that exceed 1 Nm amplitude. Figure 43 shows the THD of the stator current in this case, 7.01% (12.16% for the DTC control) empty and 7.26% (14.08% for the DTC control) under load. This THD reflects the ripples in the current signal in the case of this intelligent control, which are decreased by about 50% compared to the classic DTC.
The presence of the BDs in the IM causes changes in the velocity signature by creating ripples of amplitude of about 1 RPM for the three BDs (IR, OR, Ball) and does not exceed 3.5 RPM for the cage defect.
In addition, Figure 44, Figure 45, Figure 46 and Figure 47 show the THD of the current in the event of BD. It varies between 7.01% and 8.42% empty and between 7.26% and 8.94% under load. In this case also, there is not a big difference between the values of THD corresponding to the first three defects (IR, OR, Ball) and those corresponding to the defect of the cage. Therefore, the THD alone is not conclusive in this case, even if the proportion of harmonics created by the BDs has become larger (64.8%) compared to the harmonics caused by the ANN-DTC command, so the distinction is easier compared to the two previous cases (without control and classical DTC) during a spectral analysis.
The performance of this ANN-DTC command in terms of tracking the reference speed makes the spectra of BDs clearer and their amplitudes are multiplied (Figure 48) compared to those of Figure 24 and Figure 36. For example, for the IR defect, it is 0.103 without control, 0.697 with the DTC, and 4.252 with the ANN-DTC command, five times that of the classic DTC command and 40 times that in the non-control case. The values of the spectral amplitudes for the three cases (without control, DTC, and ANN-DTC) are illustrated in Table 3.
Table 3 illustrates the advantages of the adopted solution. In the healthy state, the impact of the ANN-DTC control on speed and torque is very clear. Indeed, the amplitudes of the speed variations are almost null (0.02 RPM) against 1.5 RPM when using the classic DTC control, so the torque ripples are effectively reduced (1.7 Nm for ANN-DTC against 2.4 Nm for classic DTC).
In the event of a fault in the bearing cage, the ANN-DTC control limits the torque ripples and the speed to 3.5 Nm and 3.5 RPM successively against 3.5 Nm and 5 RPM in the case of conventional DTC, and of course 0.02 Nm and 6 RPM in the case of no control, i.e., a reduction in the speed amplitudes of 41.6% compared to the supply by a fixed frequency source, and 30% in comparison with the conventional DTC control.
For the three other faults, the amplitudes of the speed variations are decreased compared to the supply by a fixed frequency source by 60%, 60%, and 34% in case of IR defect, OR defect, and Ball defect, respectively, and compared to the classical DTC these decreases become 41%, 50%, and 25%. When torque ripples are inspected in the presence of these three BDs, they are close in the case of both commands with a slight difference in the case of the IR defect (3 Nm for classical DTC and 2.6 Nm for ANN-DTC).
7. Comparison with Some Recent Works
There are several techniques in the literature which are applied to bearing defects Table 4 illustrates these methods. Despite the adoption of vibration analysis with advanced methods of signal processing [,], it remains a cumbersome method (installation of vibration sensors) [], or in the case of incipient defects, these are almost imperceptible []. The simulation results demonstrate how effective the MCSA is for the detection of BDs. This effectiveness is obtained thanks to the regulation of the rotation speed by an ANN-DTC control and the analysis of the envelope by the HT. As a result, recent works that employ MCSA attempt to contribute to an efficient solution while continuously varying speed and frequency to detect and locate the various BDs [,,,], and these works are primarily based on:

Table 4.
Comparison of the techniques proposed in recent works.
- Adequate modeling, such as the finite element method (FEM) of the machine in the presence of BDs []; in [], a specific model considering the variation of instantaneous angular speed (IAS), has been adopted.
- AI like machine learning algorithms (MLA) that are integrated in [], which resulted in better accuracy.
- The advanced methods of signal processing (STFT, DWT), which are adopted in [,], dealing with non-stationary signals.
For most of these works, the fault diagnosis of an inverter-fed IM is a challenge. However, for our solution, an intelligent control that effectively regulates the speed of the IM represents an added value for BD detection and is not a disruptive element.
8. Conclusions
This paper presents a technique for diagnosing the bearing defects considering MCSA with the Hilbert filter and regulation of rotational speed by the DTC and ANN-DTC control.
The study targeted improving the diagnostic efficiency of bearing failures in induction machines controlled by intelligent closed-loop controls, to develop the control in one fold and analyze the stator current envelope in another fold.
First, the bearing defects were reproduced as oscillatory components that add to the load torque. Then, the envelope analysis of the current was conducted in the frequency domain (the side bands, which depend on the frequency of rotation).
The results of the simulation on Matlab/Simulink and the interpretation of these results can be summarized as follows:
- Rotational speed is an important feature for accurately diagnosing a bearing defect.
- The amplitude of the sidebands of the components of the stator current envelope spectrum in relation to the bearing defects is considered a selective feature that clarifies the difference between healthy and defective bearings.
- The regulation of the speed of rotation of the machine by an ANN-DTC control is a means to precisely locate the bearing defect.
- The analysis of the current envelope is very useful for the diagnosis of mechanical defects since it is less sensitive to variations in the load torque, so the frequencies of the spectra that indicate the defects are directly readable; they are not correlated with the frequency of the supply current, which also makes it possible to avoid calculation gymnastics and facilitates the detection of BDs.
- The ANN-DTC control minimizes torque ripples as much as possible and also reduces the amplitudes of harmonic spectra caused by the control, making it possible to distinguish harmonics from BDs.
The future works that we wish to address are:
- -
- Experimentation using the technique adopted in this paper to validate the results found, where we will use an IM containing a BDs and a dSPACE board to implement the ANN-DTC control designed in this work.
- -
- Use of the thermography technique, which is totally different from the present one, to contribute to the diagnosis of the IM BDs at a distance, based on the analysis of thermal images of the external surface of the flasks of the bearings; these images will be captured by a thermal camera.
- -
- Enhancement of ANN-DTC by using Grid Search and Bayesian Optimization methods for induction motors in the presence of BDs.
Author Contributions
Conceptualization, A.E.I., M.A.M. and N.E.O.; methodology, S.M., A.D. and A.C.; software, A.E.I., S.M. and M.A.M.; validation, A.E.I., M.A.M., A.S.A.-S. and N.E.O.; formal analysis, A.E.I., M.A.M., S.M. and A.C. investigation, S.M., A.D., N.E.O. and A.S.A.-S.; resources, S.M., M.A.M., N.E.O. and A.D.; data curation, A.E.I., S.M., A.D. and A.C.; writing—original draft preparation, A.E.I., S.M. and M.A.M.; writing—review and editing, A.E.I., S.M., M.A.M., A.S.A.-S. and A.C.; visualization, A.E.I., M.A.M. and S.M.; supervision, M.A.M., A.S.A.-S., A.D. and M.A.M.; project administration, M.A.M., A.D. and A.S.A.-S.; funding acquisition, A.S.A.-S. and M.A.M. All authors have read and agreed to the published version of the manuscript.
Funding
This research is supported by Khalifa University as part of Research Excellence award KKJRC-2019-Trans 2.
Data Availability Statement
The data are available upon request from the corresponding author (M.A.M.).
Conflicts of Interest
The authors declare no conflict of interest.
Nomenclature
| Parameters | Description |
|---|---|
| Vsα, Vsβ, | Stator and rotor voltages in (α,β) |
| Isα, Isβ, Irα, and Irβ | Stator and rotor currents in (α, β) |
| Ysα, Ψsβ, Ψrα, and Ψrβ | Stator and rotor fluxes in (α, β) |
| Rs, Rr | Stator and rotor resistors |
| Lf | Leackage inductance |
| Lm | Mutual inductance |
| P | Number of pairs of poles |
| ωr | Rotor angular speed |
| ωs | Stator angular speed |
| Ω | Rotation speed |
| Tem | Electromagnetic torque |
| Tr | Resistant torque |
| F | Viscous friction coefficient |
| J | Moment of inertia |
| nr | Rotation speed (Rpm) |
| fr | Rotation frequency (Hz) |
Appendix A

Table A1.
Parameters of induction motor.
Table A1.
Parameters of induction motor.
| Variable | Value |
|---|---|
| Nominal power | Pu = 1.5 kW |
| Stator and rotor resistances | Rs = 4 H; Rr = 0.8 Ω |
| Self-inductances | Ls = 0.36 H; |
| Rotor inductance | Lr = 0.02143 H |
| Maximum of mutual inductance | M = 0.082 H |
| Viscous frictions | f = 0.004045 Kg·m2/s |
| Total inertia | J = 0.024 Kg·m2 |
| Pair pole number | P = 2 |

Table A2.
Technical characteristics of the bearing.
Table A2.
Technical characteristics of the bearing.
| Type Bearing | Inner Diameter | Outer Diameter | Width | Angle Contact α | Number of Balls |
|---|---|---|---|---|---|
| 62052RSC3 | 25 mm | 52 mm | 15 mm | 0 | 9 |

Table A3.
Calculated values.
Table A3.
Calculated values.
| Number of Balls | Diameter of a Ball | Average Diameter of the Cage | cosα |
|---|---|---|---|
| 9 | 7.94 mm | 38.5 mm | 1 |
References
- Mossa, M.A.; Echeikh, H. A novel fault tolerant control approach based on backstepping controller for a five phase induction motor drive: Experimental investigation. ISA Trans. 2020, 112, 373–385. [Google Scholar] [CrossRef] [PubMed]
- Konar, P.; Chattopadhyay, P. Multi-class fault diagnosis of induction motor using Hilbert and Wavelet Transform. Appl. Soft Comput. 2015, 30, 341–352. [Google Scholar] [CrossRef]
- Mossa, M.A.; Echeikh, H.; Quynh, N.V. A Novel Sensorless Predictive Voltage Control for an Induction Motor Drive Based on a Back-Stepping Observer-Experimental Validation. IEEE Access 2021, 9, 11921–11942. [Google Scholar] [CrossRef]
- Gangsar, P.; Tiwari, R. Signal based condition monitoring techniques for fault detection and diagnosis of induction motors: A state-of-the-art review. Mech. Syst. Signal Process. 2020, 144, 106908. [Google Scholar] [CrossRef]
- Lee, Y.-K.; Im, J.-H.; Hur, J. Online Fault Detection of Irreversible Demagnetization Using Current Injection and dual Extended Kalman Filter in Decoupled Vector Space Decomposition control. In Proceedings of the 2021 24th International Conference on Electrical Machines and Systems (ICEMS), Gyeongju, Korea, 31 October–3 November 2021; pp. 1331–1334. [Google Scholar]
- El Merraoui, K.; Ferdjouni, A.; Bounekhla, M. Real time observer-based stator fault diagnosis for IM. Int. J. Electr. Comput. Eng. (IJECE) 2020, 10, 210–222. [Google Scholar] [CrossRef]
- Hadjami, M.; Razik, H.; Oumaamar, M.E.K.; Kezzar, A. Analytical Model of Cage Induction Machine Dedicated to the Study of the Inner Race Bearing Fault. Int. J. Electr. Comput. Eng. (IJECE) 2018, 8, 458–471. [Google Scholar] [CrossRef]
- Terron-Santiago, C.; Martinez-Roman, J.; Puche-Panadero, R.; Sapena-Bano, A.; Burriel-Valencia, J.; Pineda-Sanchez, M. Analytical Model of Eccentric Induction Machines Using the Conformal Winding Tensor Approach. Sensors 2022, 22, 3150. [Google Scholar] [CrossRef]
- Asad, B.; Vaimann, T.; Belahcen, A.; Kallaste, A.; Rassõlkin, A.; Ghafarokhi, P.; Kudelina, K. Transient Modeling and Recovery of Non-Stationary Fault Signature for Condition Monitoring of Induction Motors. Appl. Sci. 2021, 11, 2806. [Google Scholar] [CrossRef]
- Tang, J.; Yang, Y.; Chen, J.; Qiu, R.; Liu, Z. Characteristics Analysis and Measurement of Inverter-Fed Induction Motors for Stator and Rotor Fault Detection. Energies 2019, 13, 101. [Google Scholar] [CrossRef]
- Abd-El-Malek, M.B.; Abdelsalam, A.K.; Hassan, O.E. Novel approach using Hilbert Transform for multiple broken rotor bars fault location detection for three phase induction motor. ISA Trans. 2018, 80, 439–457. [Google Scholar] [CrossRef]
- Bouras, A.; Bennedjai, S.; Bouras, S. Experimental detection of defects in variable speed fan bearing using stator current monitoring. SN Appl. Sci. 2020, 2, 1–8. [Google Scholar] [CrossRef]
- Toma, R.N.; Kim, J.M. Article bearing fault classification of induction motors using discrete wavelet transform and ensemble machine learning algorithms. Appl. Sci. 2020, 10, 15. [Google Scholar]
- Ramu, S.K.; Irudayaraj, G.C.R.; Subramani, S.; Subramaniam, U. Broken rotor bar fault detection using Hilbert transform and neural networks applied to direct torque control of induction motor drive. IET Power Electron. 2020, 13, 3328–3338. [Google Scholar] [CrossRef]
- Bazan, G.; Goedtel, A.; Duque-Perez, O.; Morinigo-Sotelo, D. Multi-Fault Diagnosis in Three-Phase Induction Motors Using Data Optimization and Machine Learning Techniques. Electronics 2021, 10, 1462. [Google Scholar] [CrossRef]
- Kumar, R.S.; Raj, I.G.C.; Suresh, K.P.; Leninpugalhanthi, P.; Suresh, M.; Panchal, H.; Meenakumari, R.; Sadasivuni, K.K. A method for broken bar fault diagnosis in three phase induction motor drive system using Artificial Neural Networks. Int. J. Ambient Energy 2021, 1–7. [Google Scholar] [CrossRef]
- Feldman, M. Hilbert transform in vibration analysis. Mech. Syst. Signal Process. 2011, 25, 735–802. [Google Scholar] [CrossRef]
- Mahfoud, S.; Derouich, A.; El Ouanjli, N.; Mossa, M.A.; Bhaskar, M.S.; Lan, N.K.; Quynh, N.V. A New Robust Direct TorqueControl Based on a Genetic Algorithm for a Doubly-Fed Induction Motor: Experimental Validation. Energies 2022, 15, 5384. [Google Scholar] [CrossRef]
- Yu, J.; Zhang, T.; Qian, J. (Eds.) Modern Control Methods for the Induction Motor; Woodhead Publishing: Sawston, UK, 2011; pp. 147–172. [Google Scholar]
- Mahfoud, S.; Derouich, A.; EL Ouanjli, N.; EL Mahfoud, M. Enhanement of the Direct Torque Control by using Artificial Neuron Network for a Doubly Fed Induction Motor. Intell. Syst. Appl. 2022, 13, 200060. [Google Scholar] [CrossRef]
- Mossa, M.A.; Echeikh, H.; Diab, A.; Alhelou, H.H.; Siano, P. Comparative Study of Hysteresis Controller, Resonant Controller and Direct Torque Control of Five-Phase IM under Open-Phase Fault Operation. Energies 2021, 14, 1317. [Google Scholar] [CrossRef]
- El Ouanjli, N.; Derouich, A.; El Ghzizal, A.; Motahhir, S.; Chebabhi, A.; EL Mourabit, Y.; Taoussi, M. Modern improvement techniques of direct torque control for induction motor drives-a review. Prot. Control Mod. Power Syst. 2019, 4, 11. [Google Scholar] [CrossRef]
- El Idrissi, A.; Derouich, A.; Mahfoud, S. Fault Diagnosis of the Bearing Outer Ring of an Induction Motor Under DTC Control by Using Hilbert Filter. In Proceedings of the International Conference on Digital Technologies and Applications 2022, Fez, Morocco, 28–30 January 2022; pp. 802–812. [Google Scholar] [CrossRef]
- Mossa, M.A.; Echeikh, H.; Diab, A.A.Z.; Quynh, N.V. Effective Direct Power Control for a Sensor-Less Doubly Fed Induction Generator with a Losses Minimization Criterion. Electronics 2020, 9, 1269. [Google Scholar] [CrossRef]
- Echeikh, H.; Mossa, M.; Quynh, N.; Ahmed, A.; Alhelou, H. Enhancement of Induction Motor Dynamics Using a Novel Sensorless Predictive Control Algorithm. Energies 2021, 14, 4377. [Google Scholar] [CrossRef]
- Ahmed, D.; Mokhtar, B.; Aek, B. DTC-ANN-2-level hybrid by neuronal hysteresis with mechanical sensorless induction motor drive using KUBOTA observer. Int. J. Power Electron. Drive Syst. (IJPEDS) 2020, 11, 34. [Google Scholar] [CrossRef][Green Version]
- Benbouhenni, H. Seven-Level Direct Torque Control of Induction Motor Based on Artificial Neural Networks with Regulation Speed Using Fuzzy PI Controller. Iran. J. Electr. Electron. Eng. 2018, 14, 85–94. [Google Scholar] [CrossRef]
- Mahfoud, S.; Derouich, A.; El Ouanjli, N.; Quynh, N.V.; Mossa, M.A. A New Hybrid Ant Colony Optimization Based PID of the Direct Torque Control for a Doubly Fed Induction Motor. World Electr. Veh. J. 2022, 13, 78. [Google Scholar] [CrossRef]
- Mahfoud, S.; Derouich, A.; Iqbal, A.; El Ouanjli, N. ANT-colony optimization-direct torque control for a doubly fed inductionmotor: An experimental validation. Energy Rep. 2022, 8, 81–98. [Google Scholar] [CrossRef]
- Mahfoud, S.; Derouich, A.; El Ouanjli, N.; Mossa, M.A.; Motahhir, S.; El Mahfoud, M.; Al-Sumaiti, A.S. Comparative Study between Cost Functions of Genetic Algorithm Used in Direct Torque Control of a Doubly Fed Induction Motor. Appl. Sci. 2022, 12, 8717. [Google Scholar] [CrossRef]
- Banin, R.V.; Butorin, V.A.; Tsarev, I.B. Studying Rate of Changing Parameters of Bearings’ Technical Condition in Asynchronous Motors for Agricultural Purpose When Transmitting Torque by Mechanical Clutch. In Lecture Notes in Mechanical Engineering; Springer: Berlin/Heidelberg, Germany, 2021; pp. 1206–1213. [Google Scholar]
- Laala, W.; Guedidi, A.; Guettaf, A. Bearing faults classification based on wavelet transform and artificial neural network. Int. J. Syst. Assur. Eng. Manag. 2020, 1–8. [Google Scholar] [CrossRef]
- Zimnickas, T.; Vanagas, J.; Dambrauskas, K.; Kalvaitis, A. A technique for frequency converter-fed asynchronous motor vibration monitoring and fault classification, applying continuous wavelet transform and convolutional neural networks. Energies 2020, 13, 3690. [Google Scholar] [CrossRef]
- Pilloni, A.; Pisano, A.; Riera-Guasp, M.; Puche-Panadero, R.; Pineda-Sanchez, M. Fault detection in induction motors. In AC electric motors control: Advanced design techniques and applications; John Wiley & Sons Ltd: West Sussex, UK, 2013; pp. 275–309. [Google Scholar]
- Blodt, M.; Granjon, P.; Raison, B.; Rostaing, G. Models for Bearing Damage Detection in Induction Motors Using Stator Current Monitoring. IEEE Trans. Ind. Electron. 2008, 55, 1813–1822. [Google Scholar] [CrossRef]
- Esen, H.; Inalli, M.; Sengur, A.; Esen, M. Forecasting of a ground-coupled heat pump performance using neural networks with statistical data weighting pre-processing. Int. J. Therm. Sci. 2008, 47, 431–441. [Google Scholar] [CrossRef]
- Özturan, P.M.; Bozanta, A.; Basarir-Ozel, B.; Akar, E.; Coşkun, M. A roadmap for an integrated university information system based on connectivity issues: Case of Turkey. Int. J. Manag. Sci. Inf. Technol. 2015, 17, 1–23. [Google Scholar]
- Benli, H. Performance prediction between horizontal and vertical source heat pump systems for greenhouse heating with the use of artificial neural networks. Heat Mass Transf. Und Stoffuebertragung 2015, 52, 1707–1724. [Google Scholar] [CrossRef]
- Mohammed, H.; Meroufel, A. Contribution to the Neural network speed estimator for sensor-less fuzzy direct control of torque application using double stars induction machine. In Proceedings of the 2014 International Conference on Electrical Sciences and Technologies in Maghreb (CISTEM 2014), Tunis, Tunisia, 3–6 November 2014. [Google Scholar]
- Pita, H.; Zurita, G.; Villarroel, A. Software development firmware system for broken rotor bar detection and diagnosis of induction motor through current signature analysis. J. Mech. Eng. Sci. 2020, 14, 6917–6933. [Google Scholar] [CrossRef]
- Belkacemi, B.; Saad, S. Inner and Outer Race Bearing Defects of Induction Motor Running at Low Speeds Signal Analysis with DWT. In Advances in Intelligent Systems and Computing; Springer: Berlin/Heidelberg, Germany, 2021; Volume 1383, pp. 975–983. [Google Scholar] [CrossRef]
- Jafarian, M.J.; Nazarzadeh, J. Spectral analysis for diagnosis of bearing defects in induction machine drives. IET Electr. Power Appl. 2019, 13, 340–348. [Google Scholar] [CrossRef]
- Fourati, A.; Bourdon, A.; Rémond, D.; Feki, N.; Chaari, F.; Haddar, M. Current Signal Analysis of an Induction Machine with a Defective Rolling Bearing. In Applied Condition Monitoring; Springer: Berlin/Heidelberg, Germany, 2018; Volume 9, pp. 45–54. [Google Scholar]
Publisher’s Note: MDPI stays neutral with regard to jurisdictional claims in published maps and institutional affiliations. |
© 2022 by the authors. Licensee MDPI, Basel, Switzerland. This article is an open access article distributed under the terms and conditions of the Creative Commons Attribution (CC BY) license (https://creativecommons.org/licenses/by/4.0/).