1. Introduction
Control and supervision are one of the tasks of management that the real performance of the program can be compared with its goals and necessary corrective actions can be taken [
1,
2,
3]. Control is the process by which operations are performed to match planned activities. This process is used to correct the performance of the organization to achieve organizational goals and shows the level of progress towards achieving. In any organization, planning has the nature of forecasting accompanied by a percentage of errors. No activity in the organization will be successful unless the necessary controls have been exercised against it. Planning and control are closely intertwined. Accordingly, some sources have expressed instrumental control for planning and management. The essence of control is taking action to achieve planning results. The basis for these measures is provided by two different mechanisms: formal and macro-guidelines; standard tools adjust regulations, guidelines, budgets, and help [
4]. Therefore, perhaps the most essential issue that necessitates the existence of control is that the percentage of errors always accompanies predictions and operational plans in the organization, and to eliminate these errors and correct operations, control is the only solution; in other words, the formal control system is among the most significant internal structures for achieving organizational objectives and executing plans [
5,
6,
7,
8,
9,
10]. These studies initially focused only on financial results control systems that researchers led by Merchant and Otley [
11] gradually realized the shortcomings of this approach and the need to consider other control dimensions, and gradually approached the combination of different control mechanisms in the form of a control package was developed. According to this view, organizations use a set of related control mechanisms to align activities with organizational goals. Together, these mechanisms form the management control system, and without considering this connection and interaction, it is impossible to obtain a correct insight into its financial results control systems. In recent years, there has been a gradual advancement in the study of the phenomenon of “control in terms of theory and methodology, but in most research related to the configuration and formation of management control packages, only the fictiveness of each control mechanism has been studied. These mechanisms have been neglected together in various contexts, such as the organization’s strategy to achieve effective control outcomes, and even more than two decades after the formation of the closed approach, it has not yet been used properly and perhaps in research. Management control systems contribute to the procedures and tools to give success to organizations in executing strategies. Management control systems help manage integration, impulse, decision support, communication goals, feedback, etc. When companies face many challenges to survive in competitive markets, financial health and identifying the factors that lead to financial management control crises in manufacturing projects are crucial. The purpose of the management control system is to present strong policies for presenting. Valuable information for decision-making, outlining, and execution appraisal. It is expected that this system, like other organizational elements, will communicate with tissue characteristics; therefore, it is especially the type of organizational strategy, which is one of the main organizational concerns that researchers of organizational ideas have widely examined for decades. Financial management control system components measured in the management control literature include cost standards, variance analysis, budget control, recruitment cost, variable cost, and overhead analysis. In this regard, the present study investigates the effect of conservatism and quality characteristics based on control management on the financial risk of manufacturing companies. The rating of profitability based on accounting data from the criteria of quality of accrual, stability, predictability, and smoothness has been used to measure financial risk. In this study, we assess and prioritize the risk factors of financial measurement of management control systems for production companies using a hybrid Z-SWARA and Z-WASPAS with the FMEA method.
2. Related Works
Many previous studies, using a contingency approach, have often examined management control in an isolated environment. They assumed that by combining the results of independent control mechanism analysis, effective control packages can be identified [
12]; Experimental evidence, however, suggests that most control mechanisms that are separately identified as effective for control outcomes will not necessarily be effective when tested in combination and in a single package [
13]. According to Grabner and Moers [
14], simply observing a set of management control mechanisms in a package is not a reason for the relationship and interdependence between them. Most control strategy texts rely on approaches that only support the effectiveness of the benefits of using management control mechanisms in the organization’s environmental conditions [
12,
15,
16,
17].
These approaches do not take into account the benefits of internal compatibility of control mechanisms with each other and overlook the impact of management control packages on the selected strategy [
14]. Gradually a closed view of control mechanisms found its place in control research, and researchers considered other types of control in addition to financial, formal, and computerized controls. There are few conceptual frameworks based on a closed view of control systems in the literature, based on which they have presented their own classification of control mechanisms. The most well-known classifications are Simons [
5], Merchant and Van der Stede [
9], Malmi and Brown [
18]. The framework proposed by Malmi and Brown [
18] claims that they are based on a review of 40 years of control literature [
18]. they provide five categories of typology of controls that, along with the second framework, were proposed by Merchant and Van der Stede [
9], which can be considered as the most popular control framework in the literature [
9] presented a classification of control mechanisms in the organization that is based about control and puts different types of control within the organization into three basic categories: (1) Financial Responsibility Centers (2) Planning and Budgeting and (3) Incentive Compensation Systems. Merchant [
2] argues that control mechanisms, including control of results, actions, personnel, and culture, can address three barriers related to employee behavior (lack of orientation, lack of motivation, and lack of ability) [
2]. In the control literature, the necessary analytical statements are produced to extract the configurations. Analyzes related to the relationships between the various dimensions of the control package and the contextual variables based on the available literature have been shown in
Table 1.
To understand the effectiveness of factors in research with the nature of causal conditions, it is necessary to examine each of the factors in terms of causality. The criteria for the necessity and adequacy of causal conditions will be different in each case. Factors that interact with each other will have an interactive effect, and this effect may improve or reduce the desired result; in other words, one factor may be very influential in the individual and independent study in creating a result, but in combination with other factors, it may be considered as an additional and ineffective factor; therefore, it is important to consider the appropriateness of the factors (appropriateness theory) and in terms of the combined (package) view in examining the necessary and sufficient causal conditions to achieve the effect (desired result).
The law of proportionality is depending on the assumption that there is generally no management control system that fits all organizations and their textural characteristics. This theory states that the specific characteristics of an appropriate system depend on the textural characteristics of each organization. The aim of this theory is to achieve a comparative relationship between mechanisms and organizational characteristics [
73]. Shin and Park [
74] have discussed enterprise risk management concepts and method topics based on case research. They aimed to adopt ERM with reduced price and progress methods. Ahmadi et al. [
75] presented a novel hybrid method for forecasting economic growth using a machine learning approach. In another research, Ghorbani and Korzeniowski [
76] have studied a novel method based on a discrete linear investment plane to evaluate pricing. Furthermore, Korzeniowski and Ghorbani [
77] studied the Hull-White Interest Rates using the linear investment technique. Khan et al. [
78] have assessed the risk management in the Halal supply chain management using the fuzzy BWM technique. Ahmadi and Taghizadeh [
79] have examined the GDP in Iran by a novel gene expression model based on knowledge-based economy factors using a statistical model. Jafarzadeh Ghoushchi et al. [
80] have analyzed novel mathematical model beads on Failure Modes to evaluate Medication Errors. Hasheminezhad et al. [
81] have studied a novel method for prioritizing risk factors in passenger trains regarding control management components based on fuzzy COPRAS and fuzzy DEMATEL technique.
Ghorbani [
82] have studied on pricing with investment plane based on random interest rates. Ahmadi [
83] has analyzed a new mathematical method with a linear fractional programming problem to evaluate the economic growth component. Tavana et al. [
84] studied supplier selection in close supply chains using a novel fuzzy best-worst technique and combined the method with Bonferroni functions in the research. Braglia et al. [
85] have designed a new integrated tool for risk failure deployment to prioritize remedial activities. Ghorbani and Korzeniowski [
86] have analyzed Call Options with Cox-Ingersoll-Ross using Interest Rates in investment projects. Furthermore, several methods for predicting control management are applied in researches, such as local wavelet acoustic pattern [
87], innovative coupled model of wavelet transform [
88,
89], statistical models based on the programming in an expert system [
90] wavelet transform combined with LSTM [
91], long short term memory (LSTM) [
92]. In another study, Celik and Gul [
93], have identified the risk evaluation and control management for safety using an integrated BWM and MARCOS methods. Gul and Ak [
94] have analyzed occupational risks from people health using fuzzy BWM and fuzzy MAIRCA method. In this paper, three features distinguish the conceptual approach from other comparable models. First, it examines the degree of danger and its risk from both a personal and an ecological standpoint. Next, it uses fuzzy BWM (F-BWM) to determine the relative relevance of three risk variables identified by the classic Fine–Kinney technique as “chance, frequency, and severity.” Finally, it uses fuzzy MAIRCA (F-MAIRCA) to rank risks as per their average risk using F-BWM significance values. A test case of risk assessment at a production factory is completed to demonstrate the technique’s usefulness.
To explain how the financial results control system mechanism fits into the organizational context of the organization, one of the most important of which is strategy, it is necessary to consider financial results as part of a set of control mechanisms; in other words, it is assumed that organizations, financial results, and other control mechanisms are purposefully designed and implemented together that can be considered as a whole [
9]. There are few conceptual frameworks based on a packages approach to control mechanisms. The framework of Merchant and Van Der Stede [
9], Simons [
5], Malmi and Brown [
18] and Bedford and Malmi [
95] are the most famous studies based on that. Simons [
5] considers the management control mechanism as routine procedures based on official information used by managers to maintain or change the pattern of organizational activity. Malmi and Brown [
18] consider the control mechanism as a set of procedures, actions, values, and activities that management uses to guide personnel behavior to achieve organizational goals. The abbreviations for
Table 2 are as follows: (+) Evidence for the use of the control mechanism in a strategic context has been identified. (-) Existence of evidence for nonuse of the control mechanism in a strategic context.
3. Methodology
3.1. The Control Function of Management
The method through which managers persuade other members of the company to implement organizational measures is known as management control. Management control entails a wide range of tasks, including:
Planning what the organization should do;
Coordinate different parts of the organization;
Communication information;
Evaluation information;
Decide what needs to be done;
Influencing people to change their behavior.
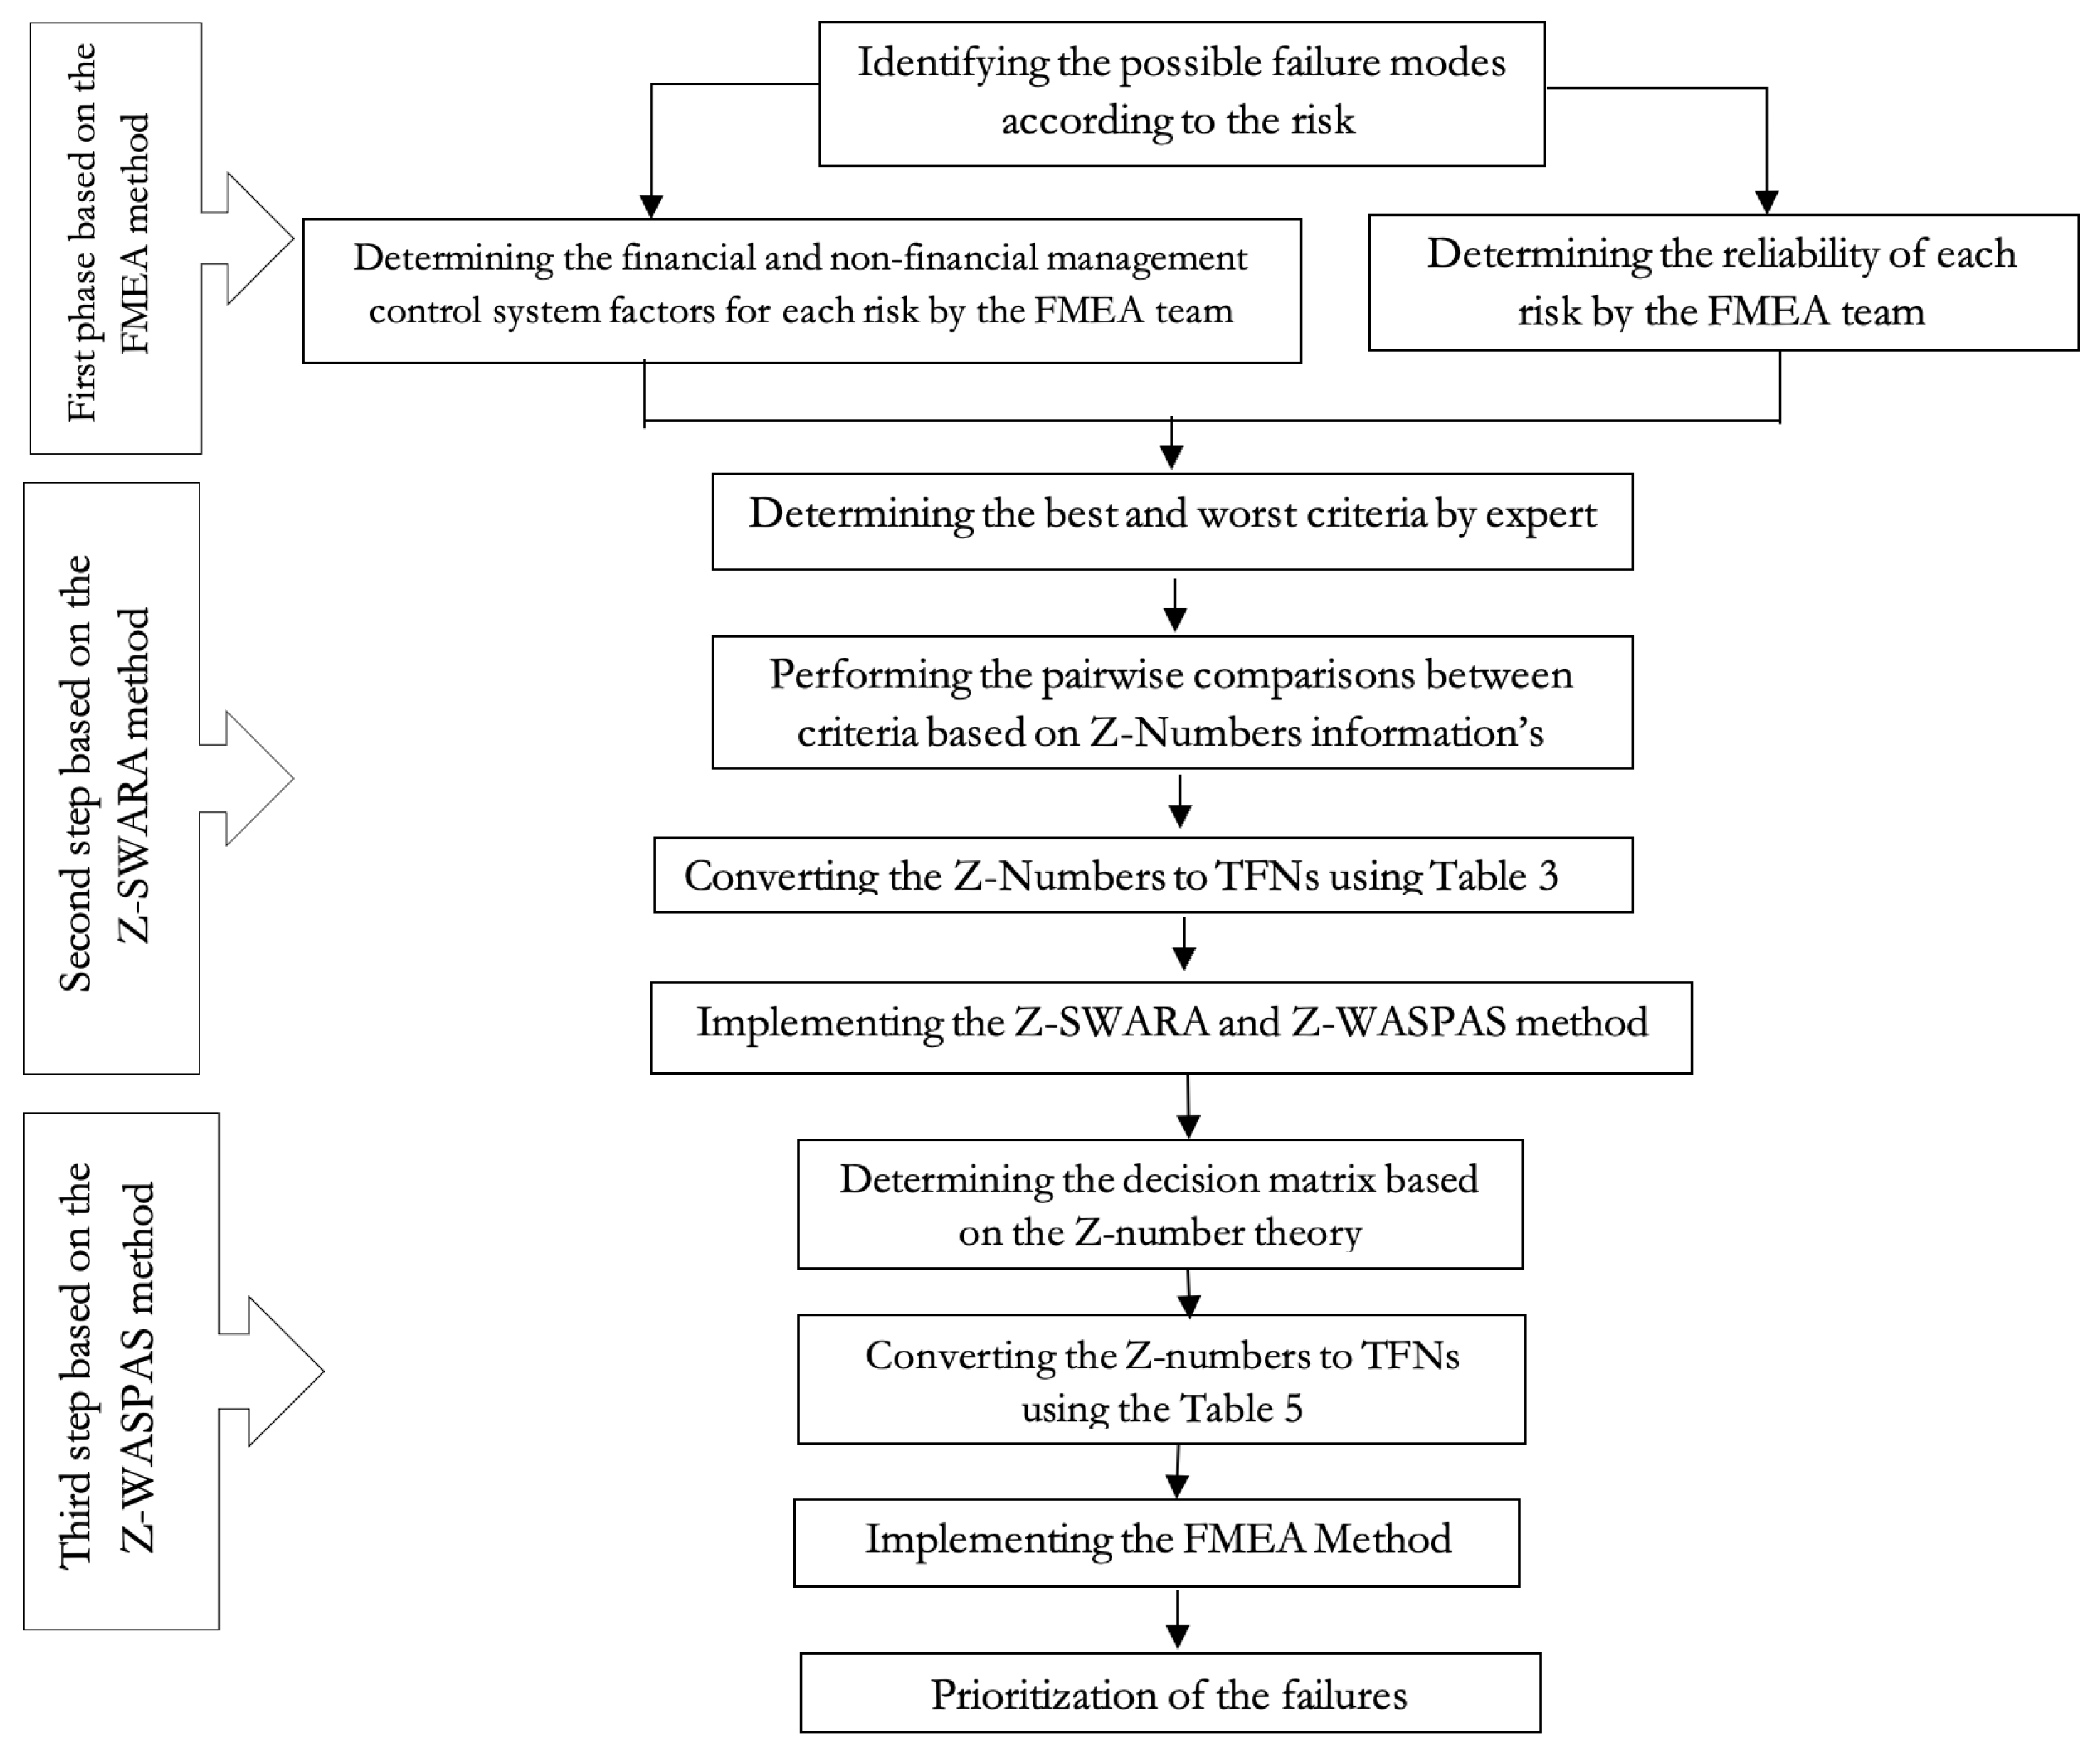
It is not required for all actions in control management to follow the previously set planning and budgeting. If a manager discovers a better solution, he or she is more likely to accomplish a predefined plan for the organization’s goals—the management control system must block its adoption. In other words, adhering to a budget is not always bad, and adhering to a budget is not always bad. Despite the fact that the management control method is systematic rather than mechanical. Rather, it involves the interaction between people who cannot be described by machines. Managers, like organizational goals, have personal goals. The problem of central management control of managers to encourage organizational goals in a way that will help them also achieved their personal goals. The management control system must be designed and implemented with appropriate principles [
101]. The assessment framework is described in
Figure 1.
3.2. Management Control System
The management control system gathers and analyzes data to assess the performance of different organizational resources, such as human, physical, and financial resources, as well as the organization as a whole, while taking organizational plans into account. Lastly, the behavior of organizational resources to apply strategies is influenced by the management control system [
102]. The management control system aids managers in guiding an organization toward its strategic objectives; as a result, management control is primarily concerned with the implementation of measures and plans. Financial and nonfinancial criteria are used to create management control systems. The financial aspect emphasizes net income, profits, and so on. However, all organizational subcategories have nonfinancial objectives such as product quality, customer satisfaction sales participation, timely submission, and employee ethics. In this study, the management control system is classified into two categories based on financial and nonfinancial factors. The activity of the management control system is used at three levels of the resource allocation process:
- (A)
Develop expectations through which resource allocation decisions are made.
- (B)
Allocate the resources of an organization in such a way as to ensure that it achieves its goals and objectives.
- (C)
Apply oversight and do the right things to ensure that the organization is still moving in the right direction and toward the overall goals.
The goals of management control are to achieve unity despite all the differences by using communication and coordination to achieve short-term and long-term goals.
3.3. Classification of Management Control System
Management control systems have been classified in a number of ways in the management accounting literature. Formal and informal controls, practice and control results, and inadequate financial and nonfinancial controls are some of these classifications [
96,
99]. The distinction between financial and nonfinancial controls has been taken into account in these many classes to evaluate the link between the management control system and strategy [
103,
104,
105]; thus, it has been argued that to further relate the management control system to the current competitive environment, there is a need for more than short-sighted financial analysis, including non-financial analysis [
106]. The classification of Simon [
106] used Controls, Diagnosis, and Confrontation as a useful reference for understanding the distinction between financial and nonfinancial management control systems. Recognition control tends to be a backward and intraorganizational approach and can be associated with financial management control system; mutual control is linked to a nonfinancial management control system since it tries to go ahead and outward. Regarding strategy formulation, both financial and nonfinancial considerations are critical. As a result, management control systems are classified into two groups in this study: financial and nonfinancial. Since such an examination allows for a more comprehensive assessment of the management control system’s interaction with businesses. According to Chenhall [
28], there is a pressing need for research into the nonfinancial aspects of management control systems. Managers’ capacity to forecast and handle unpredictable future events, particularly changing events in a competitive corporate climate, can be enhanced by such interactive forms of control [
57,
65]. Moreover, some past studies have tested the management control systems adaptation to traditional financial controls [
107,
108]; Therefore, the appropriate approach to these financial studies is also considered as a nonfinancial control. Financial management control system elements examined in the management control system literature include:
Cost standards;
Deviation analysis;
Budget control;
Recruitment cost (using all manufacturing costs such as materials and direct wages and fixed and variable overhead to determine the total cost of the product);
Variable cost (using only part of the cost of manufacturing the product to the full cost of the product that changes with production);
Overhead analysis.
Non-financial management control system elements examined in the management control system literature include:
Customer satisfaction
Timely and reliable delivery
Measures related to key product activities
Quality
Testing (continuous process of measuring products, services, and activities against competitors’ performance)
Employee-based actions
Strategic planning.
Taking into account the control time, control position, and control level, various classifications can be considered for control, including “temporary and cross-sectional control methods against continuous control methods”, “centralized control methods against decentralized control methods” and “Quantitative control methods are compared to qualitative control methods”.
Retrospective Control: Past feedback or control is based solely on past activities and information. In this class, feedback of results or, in system terms, staffing, makes control practical, but the new concept of control is beyond the feedback mechanism and attention to the past.
Perspective control: Perspective control is the controller using data to achieve control before implemented; on the other hand, this type of control predicts obstacles and problems before the occurrence and implementation of operations and makes it possible to carry out reforms. The purpose of this type of control is to prevent and carry out preimplementation reforms to achieve the desired results.
On time Control: Retrospective control is based on past information, perspective control over future predictions, and on time control is based on current information.
3.4. Performance Measurement
Organizational performance is the amount of resources that are used to produce a unit of a product and can be calculated according to the ratio of consumption to the product. How to use and exploit resources to achieve results is related to performance measurement. Performance means the least amount of time or energy consumed for most of what has been done. Performance measures are divided into two general categories: intraorganizational factors (at the disposal and power of the organization) and extraorganizational or environmental factors that are out of the organization’s control in the short term.
Intraorganizational factors include:
Hardware factors: technology, raw materials, financial resources, and land; machinery, equipment, and tools;
Software factors: formulas, instructions, maps, and information;
Humanities or brain factors:
Government policies, national and international rules and regulations, the work environment, access to financial resources, power, water, transportation, communications, raw materials, etc. are all examples of extraorganizational elements that enterprises cannot control [
109].
3.5. Statistical Population and Sampling
In this study, the statistical population is Maral Sanat Javid Co., Trailer Industrial Group in Urmia, Iran. Given that
can be considered as an unlimited sample for research, it is used to measure the volume of the Cochran’s formula as
and as the size of the community. The number of employees was unknown. Therefore, the Cochran’s formula is used for an infinitely large population. The sample size with a value of
is likely to occur in the statistical population, which is determined by the degree of scattering or variance between items or questionnaires. The items have a value of 0.235 and
with a confidence of 0.95% will be 1.96. Now, if
d, which is the error level for measuring the variables of this study is considered 0.07, thus the sample size will be 185 personnel.
The initial sample of this study was 185 personnel who were randomly distributed, but after distributing the questionnaires, 116 acceptable questionnaires were selected due to the refusal of some people or the incompleteness of some questionnaires. In this condition sample error level is increased by 0.018. Therefore, the size of the selected final sample is 116 people, whose error level for the unknown community is 0.088
3.6. Questionnaire Design
The present research questionnaire includes the following sections:
- (A)
Introduction: The purpose of this section is to explain the necessity of the respondent’s cooperation in providing the required data and how to answer the questions and also to determine the specifications related to the type of activity, type of ownership and number of personnel.
- (B)
Questionnaire questions: This section of the questionnaire consists of 2 parts.
Questions related to the company strategic position and performance measurement, each of which includes 9 questions from the Likert scale with 5 options from “significantly lower” to “significantly higher than the average” used.
Questions about the management control system, which first presents the concept of management control system for more transparency for the respondents. Then in two parts, Management control system questions based on financial and non-financial factors presented. It includes 8 questions in the non-financial factors section and 23 questions in financial factors. The Likert range with 5 options is used.
3.7. The Validity and Reliability of Research Tools
The purpose of the validity is that whether the measuring instrument can really measure the desired property. If the measuring device does not have sufficient validity in terms of the desired feature, the results would be worthless. To prevent it, the scientific validity of the questionnaire must first be achieved. The questionnaire was generally developed in two sections, Strategy and management control system, based on theoretical studies. The Strategy section was originally designed and developed by Jermias and Gani [
110]. It is divided into two sections, Financial and Non-Financial factors, based on Firth [
107]. Furthermore, in the preparation and design of a questionnaire we used specialized experts in this field. Both questionnaires, divided into four categories, were tested by Cronbach’s alpha validity test.
This research consists of five variables, including the company’s strategy. First is the management control system that the company uses, which is also studied as an adjustment variable. The second is the company’s performance measurement, which is the dependent variable of the research. The management control system is divided into two variables, the management control system based on financial factors and the management control system based on nonfinancial factors, by which the four regression equations are as follows:
Used to test research hypotheses, all variables are present in the regression equations, which include:
P: The company performance is comparable to its leading competitor;
CLS: The degree to which a company’s strategy adapts to the cost leadership strategy;
DS: The degree to which a company’s strategy adapts to the differentiation strategy;
FMCS: Compliance with the Financial Management Control System;
NFMCS: Compliance with the Non-financial Control Management System.
It is obtained by means of a questionnaire that has a value between values 1 to 5. The variables of this study, in addition to the performance measurement as the dependent variable, other variables according to the hypothesis tested, will have the role of independent and control variables. Furthermore, in the case of financial and nonfinancial management control system variables, they will have the role of moderator variable.
Fuzzy Sets Theory
Zadeh was the first to establish the notion of fuzzy sets. A fuzzy set specifies a membership function that describes the items in a particular interval in terms of their degree of membership, usually as . The following are the basic definitions of the fuzzy number sets utilized in this study:
Definition 1. Equation gives a fuzzy set (A) specified in Equation (7). In Equation (
8), is the membership function of set A. The membership value shows the degree of dependency in A.
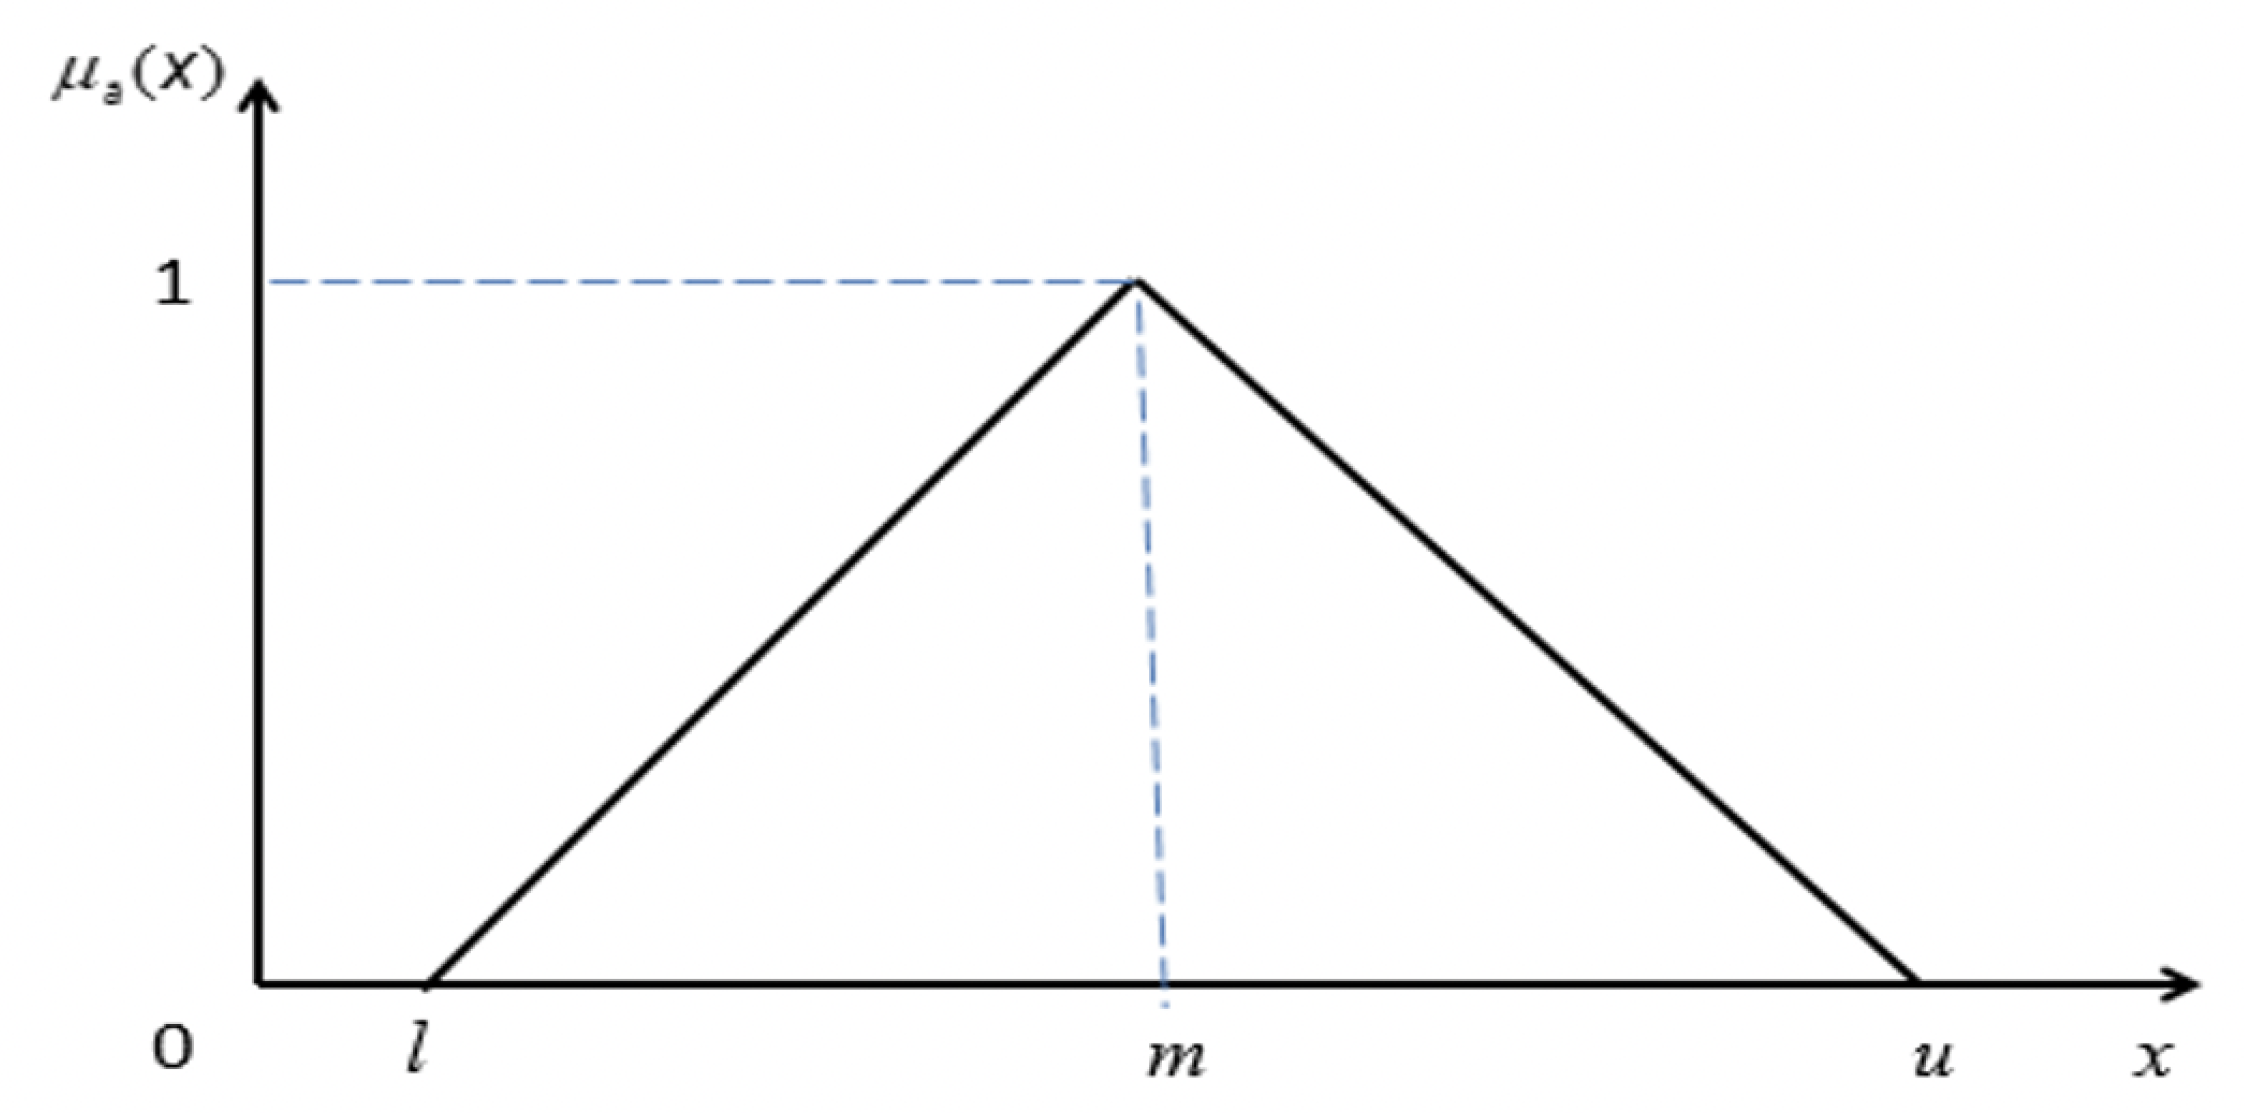
Definition 2. The fuzzy sets numbers is defined as a triplet, the membership function is given by Equation (8), and the graphic is shown below in Figure 2. Definition 3. Assume that and are two triangular fuzzy numbers and λ is a numeric constant greater than zero. In this case, arithmetic operations are performed on these fuzzy numbers in accordance with Equations (9)–(11). Definition 4. Assume that and are two positive triangular fuzzy numbers and the distance between and is defined as Equation (14): Definition 5. Defuzzification can be used to convert a fuzzy set into a crisp real number as shown in: 3.8. Z-Number Theory
Zadeh initially presented the notion of Z-Numbers as a broader form of uncertainty theory for unreliable computing integers. They are a pair of fuzzy integers
, where
A is a fuzzy subset of the
X domain and
B is a fuzzy subset of the single interval. They represent component
A’
s dependability. If the damage assessment is considered a Z-Number, for example, the first and second components may be “low” and “not sure,” respectively. The triple
is called Z-VALUATION, which is defined as a restriction on
X as an equation and is equal to an assignment statement (
16).
This constraint is known as a probability constraint that denotes the probability distribution function
. In particular, it can be described as Equation (
17).
In the above formula,
u represent the membership degree and generic value of the intervals
A and
X, respectively. It can be thought of as a related constraint to. This refers to how satisfied you are. As a result,
X is a random variable with a probability distribution that acts as a probability restriction on the constant. Equations (
18) and (
19) define the risk restriction and the probability density function
X:
In Equation (
19),
denotes the derivative of
u.
A Z-number is an ordered pair of
, with
and
both being considered TFN. As a first component,
is a fuzzy subset of the
Y domain.
Z is a Z-number that is linked to a real-valued uncertain variable
Y.
is a fuzzy subset of the generic interval
as a second component. Where
refers for limitation and
stands for confidence or dependability, a Z-number may be employed to express information about an uncertain variable. The term “Z-information” refers to a collection of Z-values. In a lot of everyday thinking and decision-making, Z-information is used. Assume
Y is a stochastic variable, based on the fuzzy constraint in Equation (
20). The probabilistic constraint on
Y is indicated by the probability distribution of
Y. The following is the probabilistic limitation:
and the probability density function of
Y is described in the (
21) depending on Equation (
20).
where
p is deferential of
u and
denotes the probability density function of
Y.
Suppose that
to convert Z-number to TFN. The limitation is represented by the first component
, whereas dependability is represented by the second part
. The second element (reliability) is initially converted into a crisp integer as follows:
where
is the same as in Equation (
21). Then,
as the second element (reliability) contributes to the first part’s weight (restriction). Equation (
23) may be used to derive the TFN form of the weighted Z-number:
3.9. Z-SWARA Method
When there are multicriteria for the decision problem, the decision-making needs to be the approach that can obtain the weight of the criteria [
111]. In a fuzzy context, fuzzy SWARA (fuzzy Step-wise Weight Assessment Ratio Analysis) is a multiattribute decision-making approach for computing the weight of criterion and sub-criteria. The fuzzy SWARA method works in the same way as the SWARA method. However, due to uncertainty in decision-making or a lack of knowledge, it is expanded to fuzzy SWARA [
112,
113]. In the fuzzy SWARA method, researchers play an important role in determining the weight of the criterion. Hence, the data collected depend on expert judgments. The fuzzy SWARA technique was expanded to the Z-SWARA technique in this work, and a reliability factor was introduced to increase the confidence of the outcome. The Z-SWARA technique is broken down into the following steps:
Step 1:
Due to self, the professionals arrange criteria from the most essential to least significant in decreasing order.
Step 2:
Based on their first evaluation, experts must allocate linguistic characteristics to the relative significance of criterion
j about the previous
criteria. Experts then use
Table 3 to calculate the value of the first component
.
Table 2 is used to calculate the dependability component
. The result is a Z-number for each condition.
Step 3:
The second component (reliability) is turned into a crisp number using Equation (
22) to convert the Z-number produced in Step 2 to a TFN (
20). The equation is then used to add the weight to the first component (
21).
As an instance, assume the relative significance in the form of linguistic variables for the
j-th criteria is
. The Z-number becomes
by changing the appropriate
values of
and
M from
Table 4 and
Table 5, respectively. The Crisp value is
, and about Equation (
21), the
form of Z-number is
.
Table 5 shows more Z-number to
conversions.
Step 4:
Depending on the findings of Step 3, the fuzzy weight coefficient
is defined as follows:
where
is TFN and
.
Step 5:
Ultimately, the relative weights of the
j-th assessment criteria were computed, taking into consideration
n assessment criteria:
where
is a TFN.
3.10. Z-WASPAS Method
The fuzzy WASPAS approach [
114], like the WASPAS methodology [
115] is a multi-variable decision-making methodology for determining the system’s certainty in highly sensitive situations. The Weighted Sum Model (WSM) and the Weighted Product Model (WPM), two well-known MCDM techniques, are combined in the fuzzy WASPAS methodology (WPM). The fuzzy WASPAS approach must be used to analyze the favorable (e.g., profit, efficiency) or nonbeneficial (e.g., cost) side of each risk element, which relies on expert judgment. Higher values are generally preferred for good features, while smaller values are typically desirable for nonbeneficial features. Only the positive features of the criteria are examined in this research, and the fuzzy WASPAS result is presented as a utility function
that may be used to rank alternatives. For rating failure modes, the new expanded Z-number of fuzzy WASPAS, called Z-WASPAS, is utilized [
116]. The Z-WASPAS technique is broken down into the following steps:
Step 1:
For each piece, researchers firstly define a linguistic variable. Subsequently, to construct the decision matrix
H, the relevant value of each linguistic variable is provided to every element. Assume the Z-number
, which is the linguistic value for
in
Table 4 [
117].
can also extract linguistic values from
Table 5 in an identical way as the Z-SAWARA technique. As a result, the following is the decision-making matrix
H containing Z-number elements:
The number of options is indicated by
m, and the number of criteria is shown by
n.
Table 6 lists the linguistic variables used to rate failure modes [
117].
Step 2:
TFN
transforms the decision matrix
H with Z-number elements. The following is the modified decision-making matrix
H:
where
is a TFN in the form of
m represents the number of options, and
n represents the number of criteria.
As an instance, imagine the expert determines the significance,
, as “Medium poor” (MP) and the reliability,
, as “Weak” (W) for the
i-th choice and the
j-th criterion. As a result, the Z-number and crisp value are
, and
, respectively. As a result, the converted form of a Z-number
is
.
Table 7 shows further Z-number to TFN
conversions.
Step 3:
Using the
matrix to normalize the beneficial and nonbeneficial components
Step 4:
Compute the weighted normalized fuzzy decision-making matrix of
for the WSM (
TFN) and WPM (
TFN) as follows:
Evaluate the center-of-area of each TFN for decision making to assist in de-fuzzify performance assessment:
Step 5:
For the
i-th choice, use the utility function
to determine the value of failure modes and rank them as follows:
Ultimately, the options may be sorted from the highest to the lowest value.
4. Results
Cronbach’s alpha coefficient was employed in this research to pretest the questionnaire’s reliability in terms of the link between business strategy, management control system, and business unit performance assessment. Prior to the final implementation, 29 research samples were randomly selected and a questionnaire was provided to them. Using the data obtained from these questionnaires and using SPSS, the confidence factor was calculated using Cronbach’s alpha method. The questionnaire data is generally divided into four categories of questions; all four categories, as seen in their reliability tables, have significant internal correlations between questions. This is because the Cronbach’s alpha is significantly higher than 0.7 among all four categories of questions. Therefore, questions can be assessed on the validity and reliability. The total amount of Cronbach’s alpha for each of the four categories of relevant items and the overall correlation of each item, also the amount of Cronbach’s alpha after deleting each item are listed in
Table 8,
Table 9,
Table 10 and
Table 11.
To test the effect of the management control system moderator on the relationship between performance and strategy, moderated regression analysis has been used. In addition to the independent variable (strategy) and the moderator variable (Management control system), there is a multiplicity of these two variables. In the regression output, represents the ratio of total variability or variance in the dependent variable, which is explained by the independent variables.
If is equal to 1, it indicates that the dependent variable is completely predictable through the independent variable. A value of zero indicates that the dependent variable is not linearly related to the independent variable. If the regression coefficients of the multiplier variable are significant, the modification effect of the moderator variable can be inferred.
In the first part of the whole data, the entered sample is divided into two groups:
According to the paper (Tsamenyi et al. [
118]), people with a strategy value less than (3 mean values) are considered as people under the leadership strategy, and people who have a strategy value of 3 or more are considered as people under differentiation strategy. The moderated regression for each category was performed separately. For both regression categories, performance measurement is considered as a dependent variable. In the leadership group, the cost of strategic value of individuals is less than 3 and the absolute value of the score is considered as the value of the strategy of individuals, because in the strategy variable, lower values mean more reliance on the cost leadership strategy. An approximate value of 3 will indicate the dependence of at least on the cost leadership strategy. The independent variable strategy and management control system based on financial factors will be the cost variable for the leadership, and for the group pursuing the differentiation strategy, the management control system adjustment variable will be based on nonfinancial factors. The hypotheses after the correlation test to examine the relationship between the studied variables have been investigated by controlling other variables involved in the relationship by moderated regression analysis. In this analysis, apart from the independent variable and the modifier variable, the interaction product of the independent variable and the modifier variable in the regression equation will be considered.
Because the distribution of these data are not normal and the variance of the different groups is not equal, we can test the nonparametric Kruskal–Wallis one-way analysis of variance between each of the elements of strategic position, performance measurement and financial and nonfinancial management control system. The results of moderated regression (
) analysis between variables show that there is a significant amount of significant relationship between business strategy variables and performance measurement. There is also the least amount of semantic relationship between the variables of financial management systems and nonfinancial management system (
Table 10). Considering that in this test, the performance measurement is as a dependent variable and the other three variables are as independent variables. Therefore, we can conclude that among the independent variables, the most correlation is related to the business strategy variable and the lowest is related to the management control system nonfinancial variable. Considering that the adjusted coefficient in most of these relations is close to one, it can be stated that there is a nonlinear relationship between the independent variables and the dependent variable, and the effect of modifying variables can be deduced.
The results obtained from the Kruskal–Wallis test show that all variables have a significant difference of 99%; then the hypothesis is rejected (
Table 11). Accordingly, to observe the different levels of factors within each component, we will go to the average ranking.
The average ranking in the business strategy shows that the product quality factor is at the highest level with 4.02 and the After-sales service factor is at the lowest level with 2.68. In the average business strategy, it has been observed that the factors of Product price, Company brand, Activities related to product development, Program change rate, After-sales service, and Product Features with an average of less than 3 are considered as leadership strategies. On the other hand, factors such as Research and Development for sales, Product Distribution Standards, and Product quality are called as differentiation strategies (
Table 12).
In the results of the average ranking, the Development of the new product performance component is at the highest level and the sales volume is at the lowest level (
Table 13). In the nonfinancial management control system component, the Customer satisfaction factor and in the financial component, Cost standards are at the highest level. Furthermore, the strategic planning factor with a rate of 2.95 and the deviation analysis factor with a rate of 2.87 are at the lowest level, respectively (
Table 14,
Table 15,
Table 16 and
Table 17).
Our results show that factors such as product distribution standards and product quality as part of the differentiation strategy are similar to factors in the financial management control system, such as customer satisfaction, quality, and criteria for determining key products and they are consistent with the findings of Langfield and Smith, 1997 stating that the nonfinancial management control system is consistent with the differentiation strategy.
5. Results of Failure Mode Prioritization
When utilizing the traditional FMEA approach, one of the primary issues that decision-makers encounter is assigning identical ratings to distinct failure scenarios. Because of a lack of organizational resources, decision-makers are unable to effectively identify important failure modes and take remedial action to mitigate their negative impacts. By creating this traditional technique relying on the SWARA and WASPAS methodologies and employing the Z-number concept, this research attempted to provide the findings with great separability compared to the FMEA. Furthermore, compared to the fuzzy WASPAS technique, the Z-WASPAS technique may produce more realistic findings by combining the notions of uncertainty and dependability. In sum, is the primary cause of risk in businesses, according to FMEA methodology and the opinions of three professionals. Modifications in need as a result of a weaker economy or other macroeconomic modifications, adjustments in the cost of raw materials critical to Balco’s manufacturing, and alterations in competition or pricing by rivals are all examples of industry and market risks. or financial challenges with cash flow, capital, or cost constraints is recognized as a major failure mode in rank 2 in the suggested technique, which involves reliability aspects in detecting failure modes. When the amount of money pouring into a firm does not satisfy the standards for accounts payable, it is a problem. Cash flow is the lifeblood of every successful business, and if it is not adequate, you might be on the verge of going bankrupt.
Finding a flexible line of credit that allows businesses to access money when they are needed might be a simple method to weather a cash flow storm. The findings also show that
, or fluctuations among consumers or in demand, is the most common failure mechanism. The recommended remedial action is on demographics and consumer tastes are rapidly changing, making it more difficult than ever to keep up with client expectations. Globally, rising incomes, middle-class bulges, aging populations, and next-generation millennials are reshaping the customer base. Consumer expectations for tailored experiences have risen as a result of technological advancements. Customers have grown to customize rapid service at cheap costs to internet streaming, Uber, Amazon Prime, and other services. The proposed methodology prioritizes failure modes (
Table 18), compared to previous techniques (
Table 19).
Results of Sensitivity Analysis
In five distinct scenarios, a sensitivity analysis is performed by altering the weight values of the criterion (see
Table 20). The basic crisp weights of the criteria computed using the Z-SWARA technique in this study are represented by
. The crisp value of weights are provided to the SODCT components and
to
are produced to evaluate how the rank of alternatives changes in potential situations.
Table 21 shows the results of a sensitivity analysis for rating the outcomes of ten failure types and various instances. The order of significance in SODCT factors is S, C, D, T, and O, according to the aggregated judgment of three sets of decision-makers in this research. In compared to component C, factor S has a substantial influence on ME regulation. In all situations,
is the failure mode with the greatest risk priority, based on
Table 21. In terms of SODCT factors,
is the second most significant failure mode in
,
, and
due to the high weight of S, but in
and
,
is the second most essential failure mode due to the lower weight of S. This comparison holds true for a variety of additional criteria and failure types as well. According to the results of the sensitivity analysis, the weight of the criterion has a substantial impact on the final ranking order of failure modes.
As a result, choosing the appropriate weight for criteria based on the actual scenario is critical to risk prioritizing of failure modes and subsequent remedial measures. As previously mentioned, this research tried to offer an expanded methodology for prioritizing ME failure scenarios utilizing FMEA, SWARA, and WASPAS methodologies. In compared to the FMEA method, this method included additional cost and time variables depending on the case study in addition to the standard ones. Furthermore, utilizing the newly established Z-SWARA technique, this study attempted to give alternative weights to risk variables. When compared to other traditional techniques, such as the AHP method, this technique uses less pairwise comparisons, and this study took into account the notions of uncertainty and dependability in the process of calculating the weights of risk variables concurrently utilizing the Z-SWARA technique. Other techniques, such as AHP or ANP, build models depending on criteria and expert assessments that influence priority and rankings. As a result, SWARA can be beneficial for specific challenges where the priorities are known ahead of time based on the circumstance [
113].
Furthermore, compared to the standard RPN score, the WASPAS technique centered on the Z-number concept has been developed and used in the suggested methodology, resulting in a more distinct prioritizing of failures. Growing market innovations suggest that the life of new items is shortening and design expenses are rising. As a result, before embarking on an expensive design and creating a production team, each firm must investigate the viability of product manufacturing and its potential to create the required profit. Globalization, outsourcing, and the establishment of strategic alliances are among the numerous alterations and revolutions that are taking place in the world of business and industry.
6. Conclusions
Management control systems contribute to the procedures and tools to give success to organizations in executing strategies. Management control systems help manage integration, impulse, decision support, communication goals, feedback, and so on. The purpose of the management control system is to present powerful policies for presenting valuable information for decision making, outlining, and execution appraisal. It is expected that this system, like other organizational elements, will communicate with tissue characteristics; therefore, it is especially the type of organizational strategy, which is one of the main organizational concerns that has been widely examined by researchers of organizational ideas for decades. Financial management control system components measured in the management control literature include cost standards, variance analysis, budget control, recruitment cost, and variable cost, and overhead analysis. Timely and reliable delivery measures related to production, quality, benchmarking, employee-based measures, and strategic planning of knowledge have determined that approval of a particular decisive control can enhance the business execution. The corporate management control financial process is a profitable planning and cost management approach that is motivated by sales price, customer-centric, design-focused, and cross-functional. By actively engaging the whole value chain in the early phases of product creation and assessing financial risk throughout the product life cycle, this approach is able to control risk. By demonstrating a logical link between financial risk management and strategic cost management, this essay aims to analyze its influence on financial risk analysis and control
In this paper, we present a systematic review to evaluate the association between business strategy and management control system and their impacts on financial performance measurement of a production organization. To achieve the conceptual model, we used the questionnaire method with 185 employees randomly. Then 116 satisfactory questionnaires were chosen due to the incompleteness of some questionnaires. In this condition, the sample error level is incremented by 0.018. Accordingly, the size of the chosen final individual is 116 people, whose error level for the unknown community is 0.088. This research includes five variables, which include the policy that a company continues. First, the type of management control system that the business uses, which is also analyzed as an improvement variable. Second, the performance measurement of the business, which is the dependent variable of the study. The management control system is divided into two variables, the management control system based on financial factors and the management control system based on nonfinancial factors. The variables of this paper, in addition to the performance measurement as a dependent variable, other variables according to the hypothesis tested, will have the role of independent and control variables. Furthermore, in the case of financial and nonfinancial management control system variables, they will have the role of the moderator variable. In the results of the average ranking, the Development of a new product performance element is at the most important level and the sales quantity is at the most under level. In the nonfinancial management control system component, the Customer satisfaction factor, and in the financial component, Cost standards are at the essential level. Furthermore, the strategic planning factor with a rate of 2.95 and the deviation analysis factor with a rate of 2.87 are at the lowest values, respectively. Our results show that factors such as product distribution standards and product quality as part of the differentiation strategy are similar to factors in the financial management control system, such as customer satisfaction, quality, and criteria for managing key products and they are consistent with the findings of Langfield and Smith [
99] states that the nonfinancial management control system is compatible with the differentiation approach. Financial risk analysis and control has grown more essential in the activities of commercial and noncommercial organizations. As a result, in a competitive market, businesses must place a high priority on strategic cost control to stay afloat. Furthermore, in this case, a decision-making strategy centered on the FMEA is used to identify and prioritize the risk factors financial of the control system in companies. Nevertheless, because this strategy has some significant limitations, this research has presented a decision-making approach depending on Z-number theory. For tackle some of the RPN score’s drawbacks, the suggested decision-making methodology combines the Z-SWARA and Z-WASPAS techniques with the FMEA method. The findings of this study, which involved applying and comparing the suggested method with the traditional FMEA and fuzzy-WASPAS techniques, showed that prioritizing failure modes using the suggested approach is closer to reality due to the incorporation of dependability factors. In sum, market or industry change is the primary cause of risk in businesses, according to FMEA methodology and the opinions of three professionals. Decision-makers, on the other hand, can offer a variety of appropriate corrective/preventive measures for substantial failures, carry out corrective actions with appropriate departments, and evaluate the new circumstances and the effectiveness of the measures. The study’s main flaw is that it fails to notice the cause-and-effect link between failure modes. Considering the results of the research on the lack of relationship between risk management and profit characteristics, it is suggested to investors in production projects that in their decisions, they do not consider only the existence of risk management as a criterion for improving profit characteristics; it is also suggested to the managers of manufacturing companies to pay more attention to creating the necessary conditions for formulating the strategic plan of the organization and creating a risk committee, which is one of the pillars of the corporate governance system. Risk management is introduced as a tool to respond to external market risks beyond management control to reduce the fluctuation of the company’s profitability. Because profitability stability may reduce the likelihood of financial distress and increase the likelihood of providing low-cost capital to use the appropriate plans and situations, so companies are advised to pay more attention to risk management in their organization; and put the following actions on the agenda: Assigning responsibility for risk management to a committee, submitting at least one formal annual report on detailed company risks to the board of directors of manufacturing companies, requesting the board of directors of manufacturing companies to involve more executives in risk monitoring, providing guidelines and criteria on how Risk Assessment.
Limitations
In general, production management is an intraorganizational activity that consists of forecasting, planning, and marketing for products or services. The production manager is always concerned with product development and product marketing, and these two activities will ultimately lead to increased revenue, market share, and profit margins. On the other hand, a production manager must be responsible for market analysis and product performance and features. Therefore, in different organizational structures, sometimes the production manager has a specific organizational position and, in some cases, is a member of the sales and marketing departments or a member of the engineering department. One of the most important tasks of the financial system, which is often forgotten in practice, is to provide useful information to management. Lack of information exchange between control systems in manufacturing and financial management companies is one of the major management problems in countries. This problem is considered one of the important limitations of financial system design in government agencies. It is very difficult and tedious to customize the managerial use of accounting information, and it is not easy. Non-reliance on financial information in managers’ decisions causes that when designing the financial system, the real needs of managers for financial information are not clear. As a result, the designed system does not meet users’ needs. The mentioned cases are among the limitations of this research.


 ,
, 


