
A Fuzzy AHP-Fuzzy TOPSIS Urged Baseline Aid for Execution Amendment of an Online Food Delivery Affability

 and
and
Abstract
:1. Introduction
2. Literature Survey
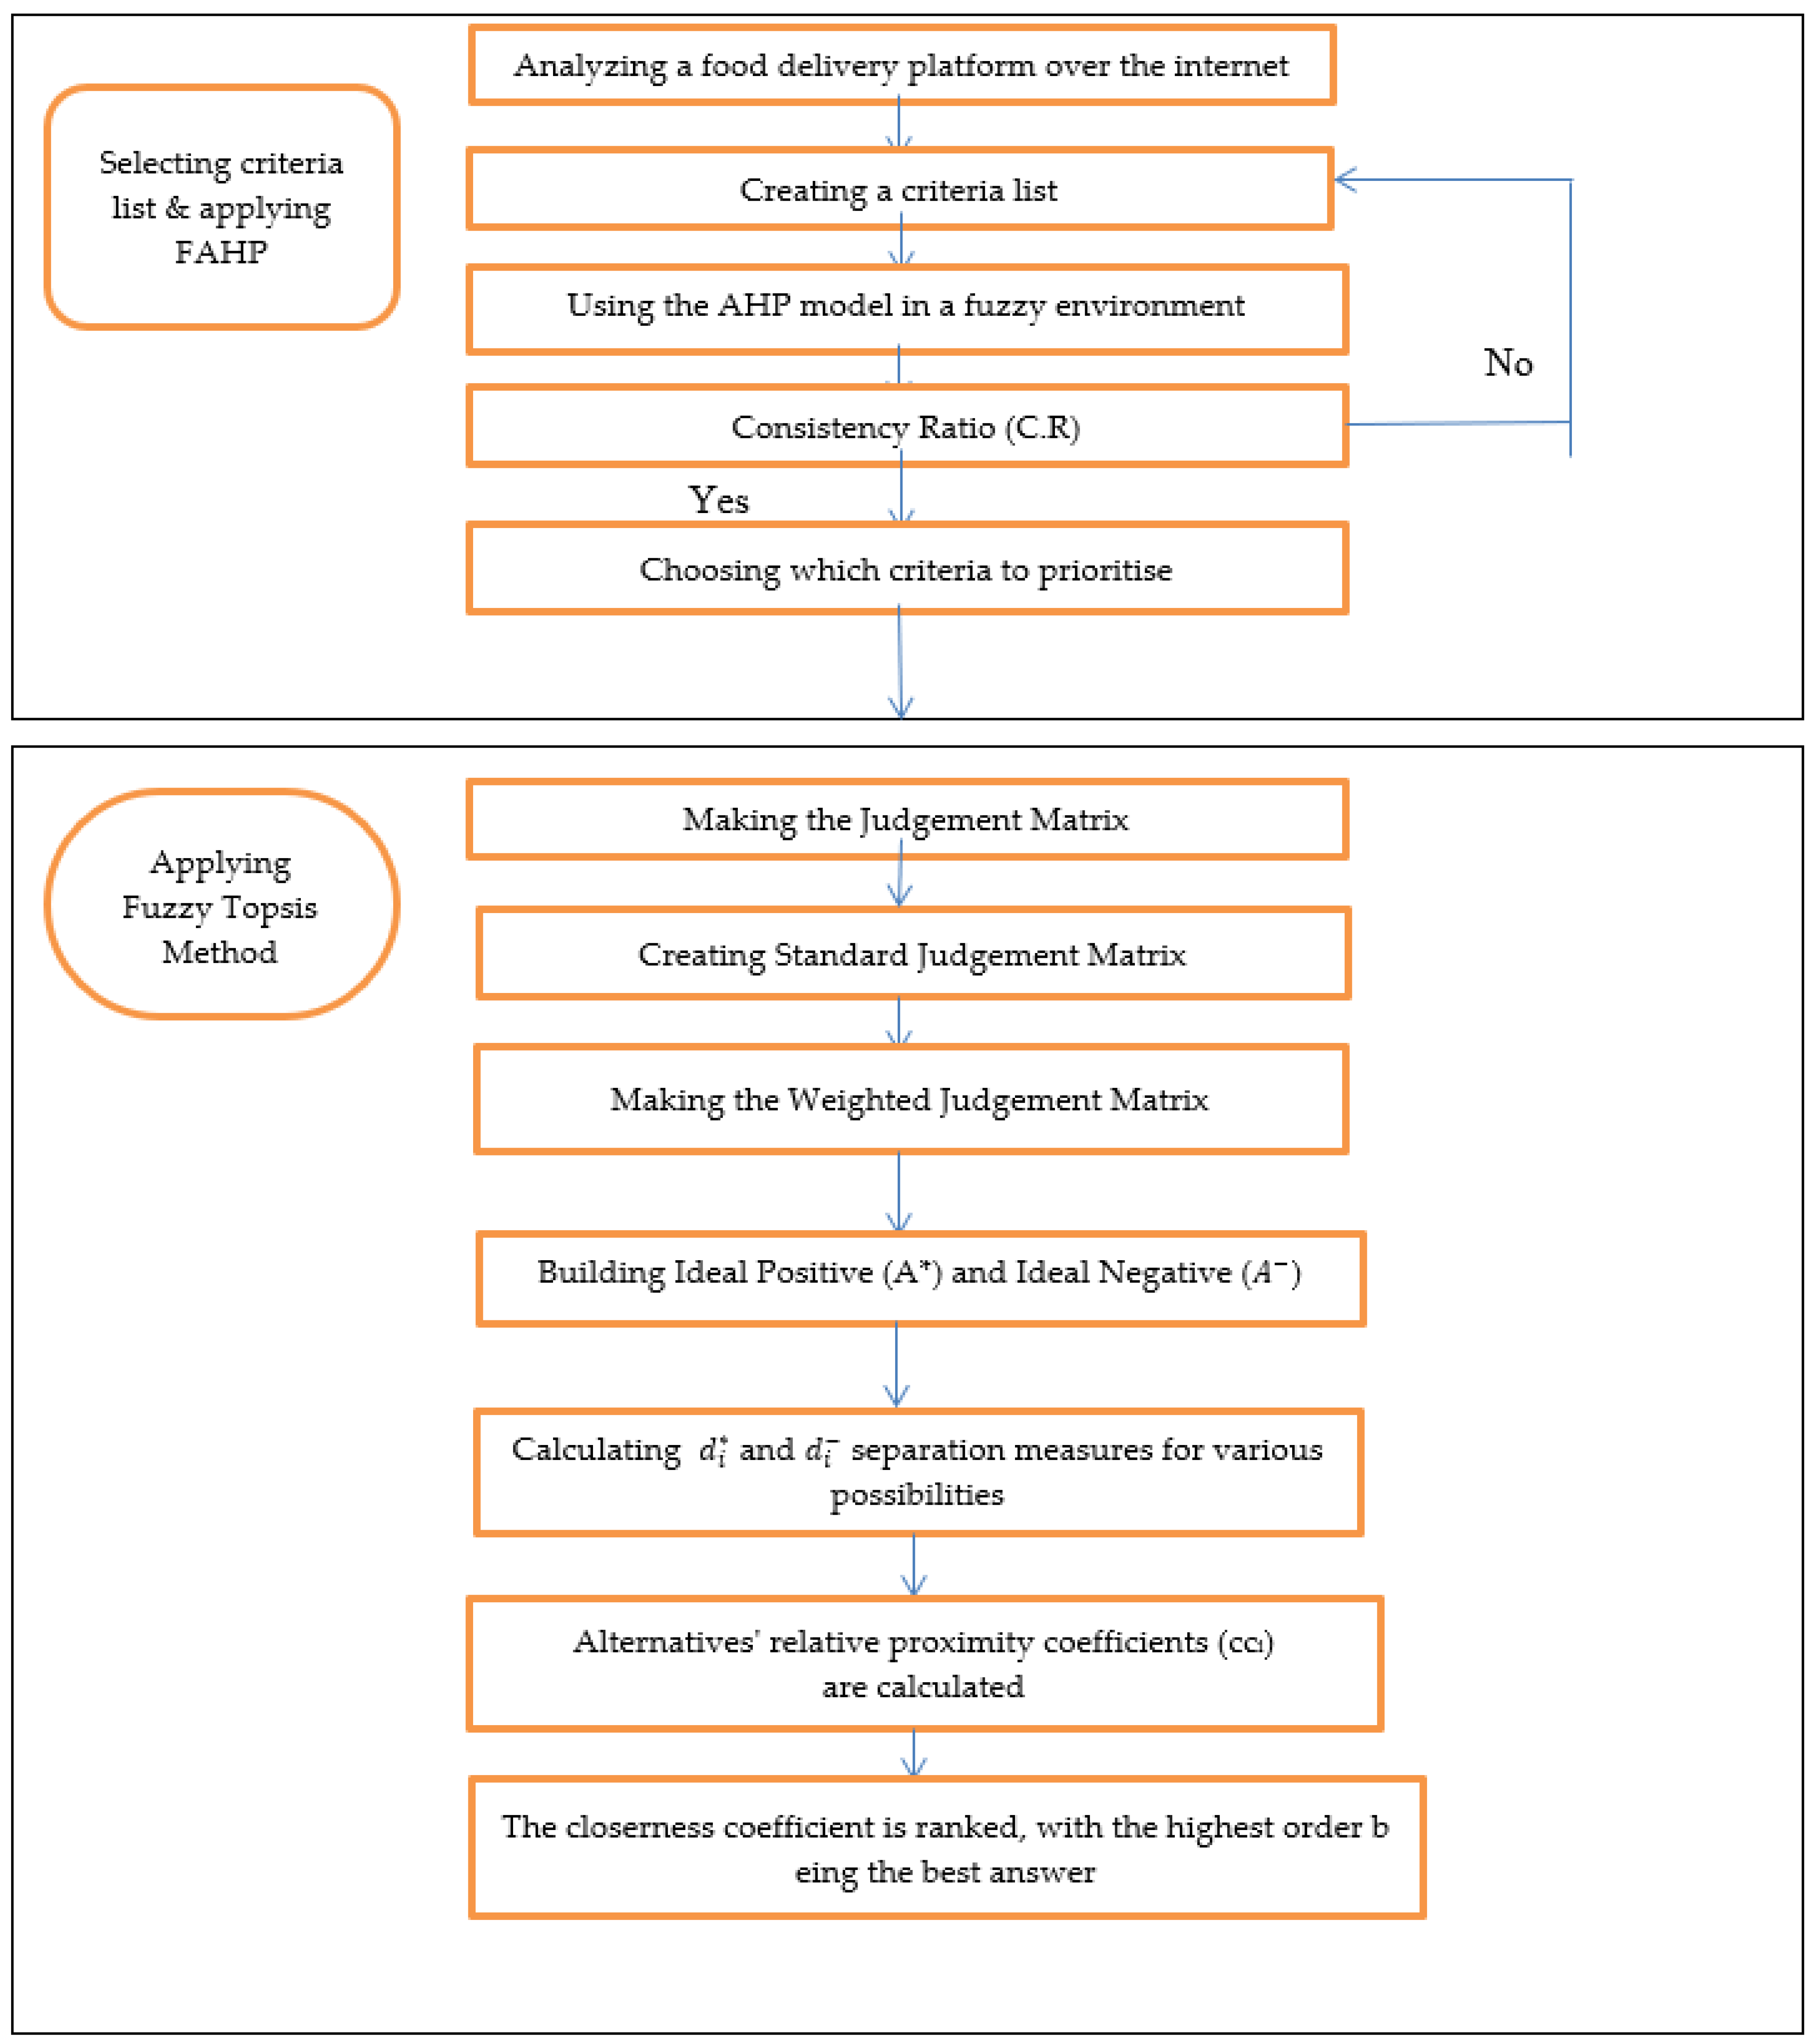
3. Materials and Methods
3.1. The Analytic Hierarchy Process Method
3.2. The Fuzzy Analytic Hierarchy Process Method
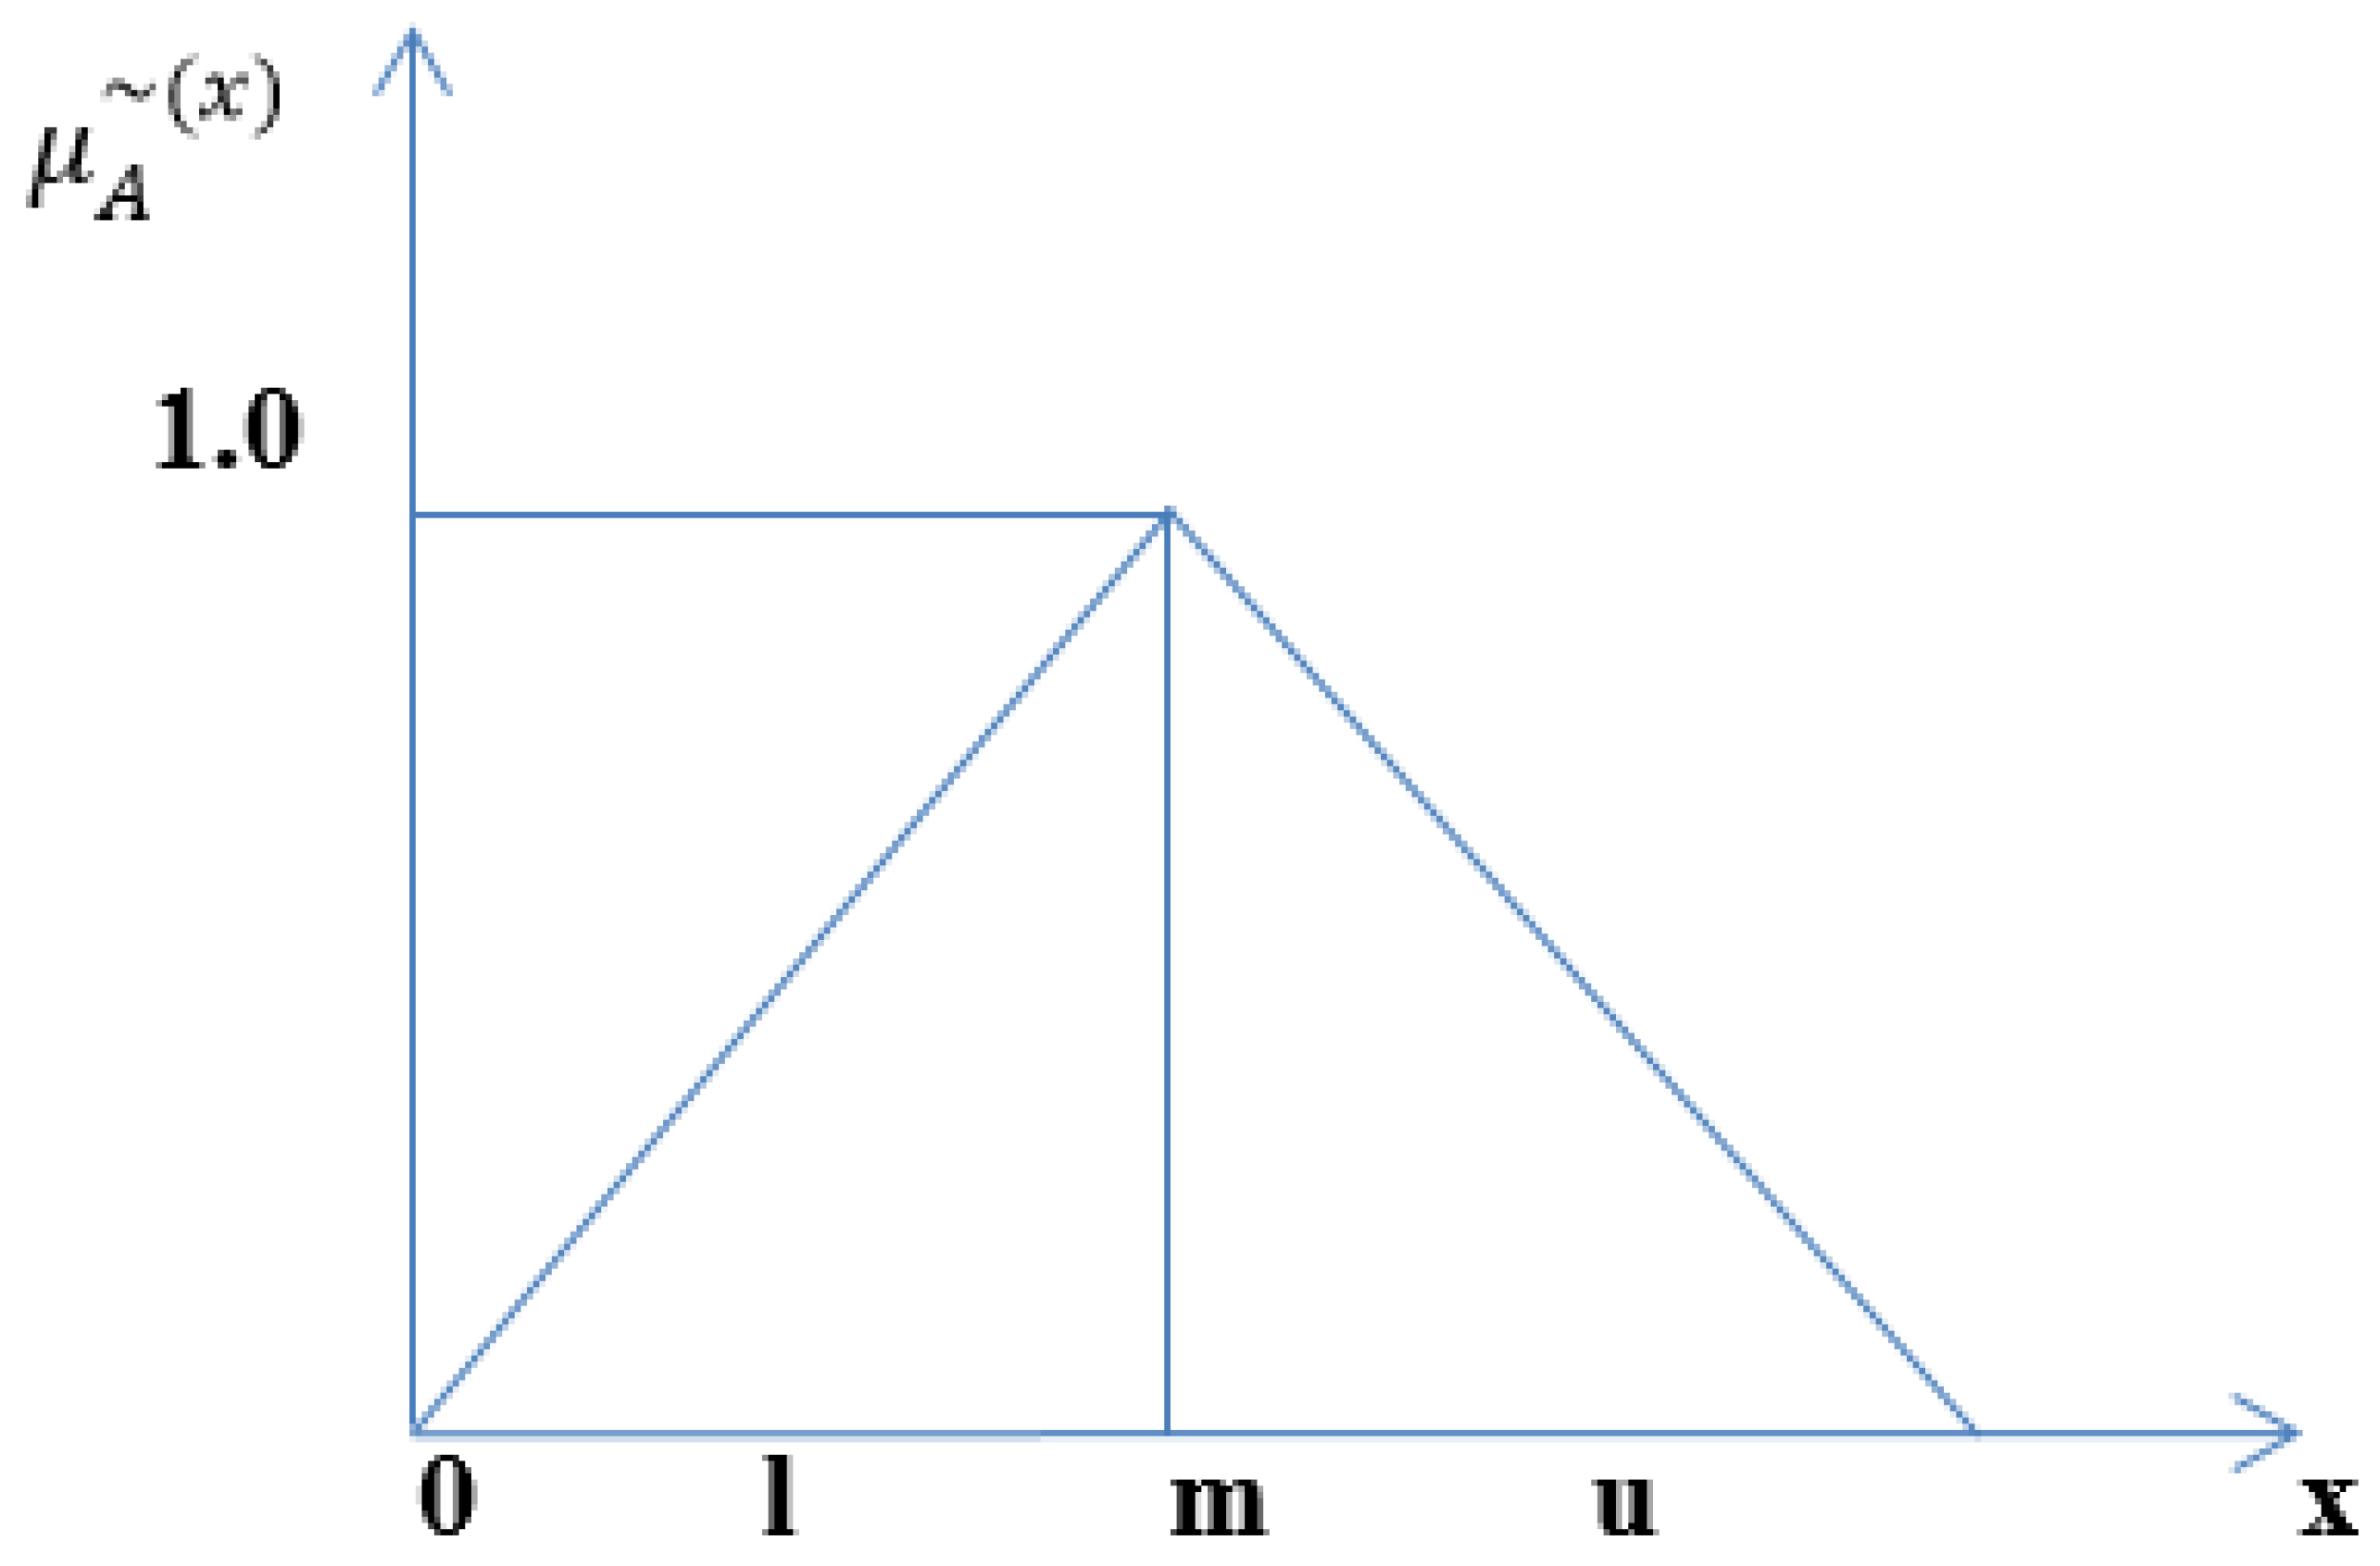
- Establishing fuzzy number
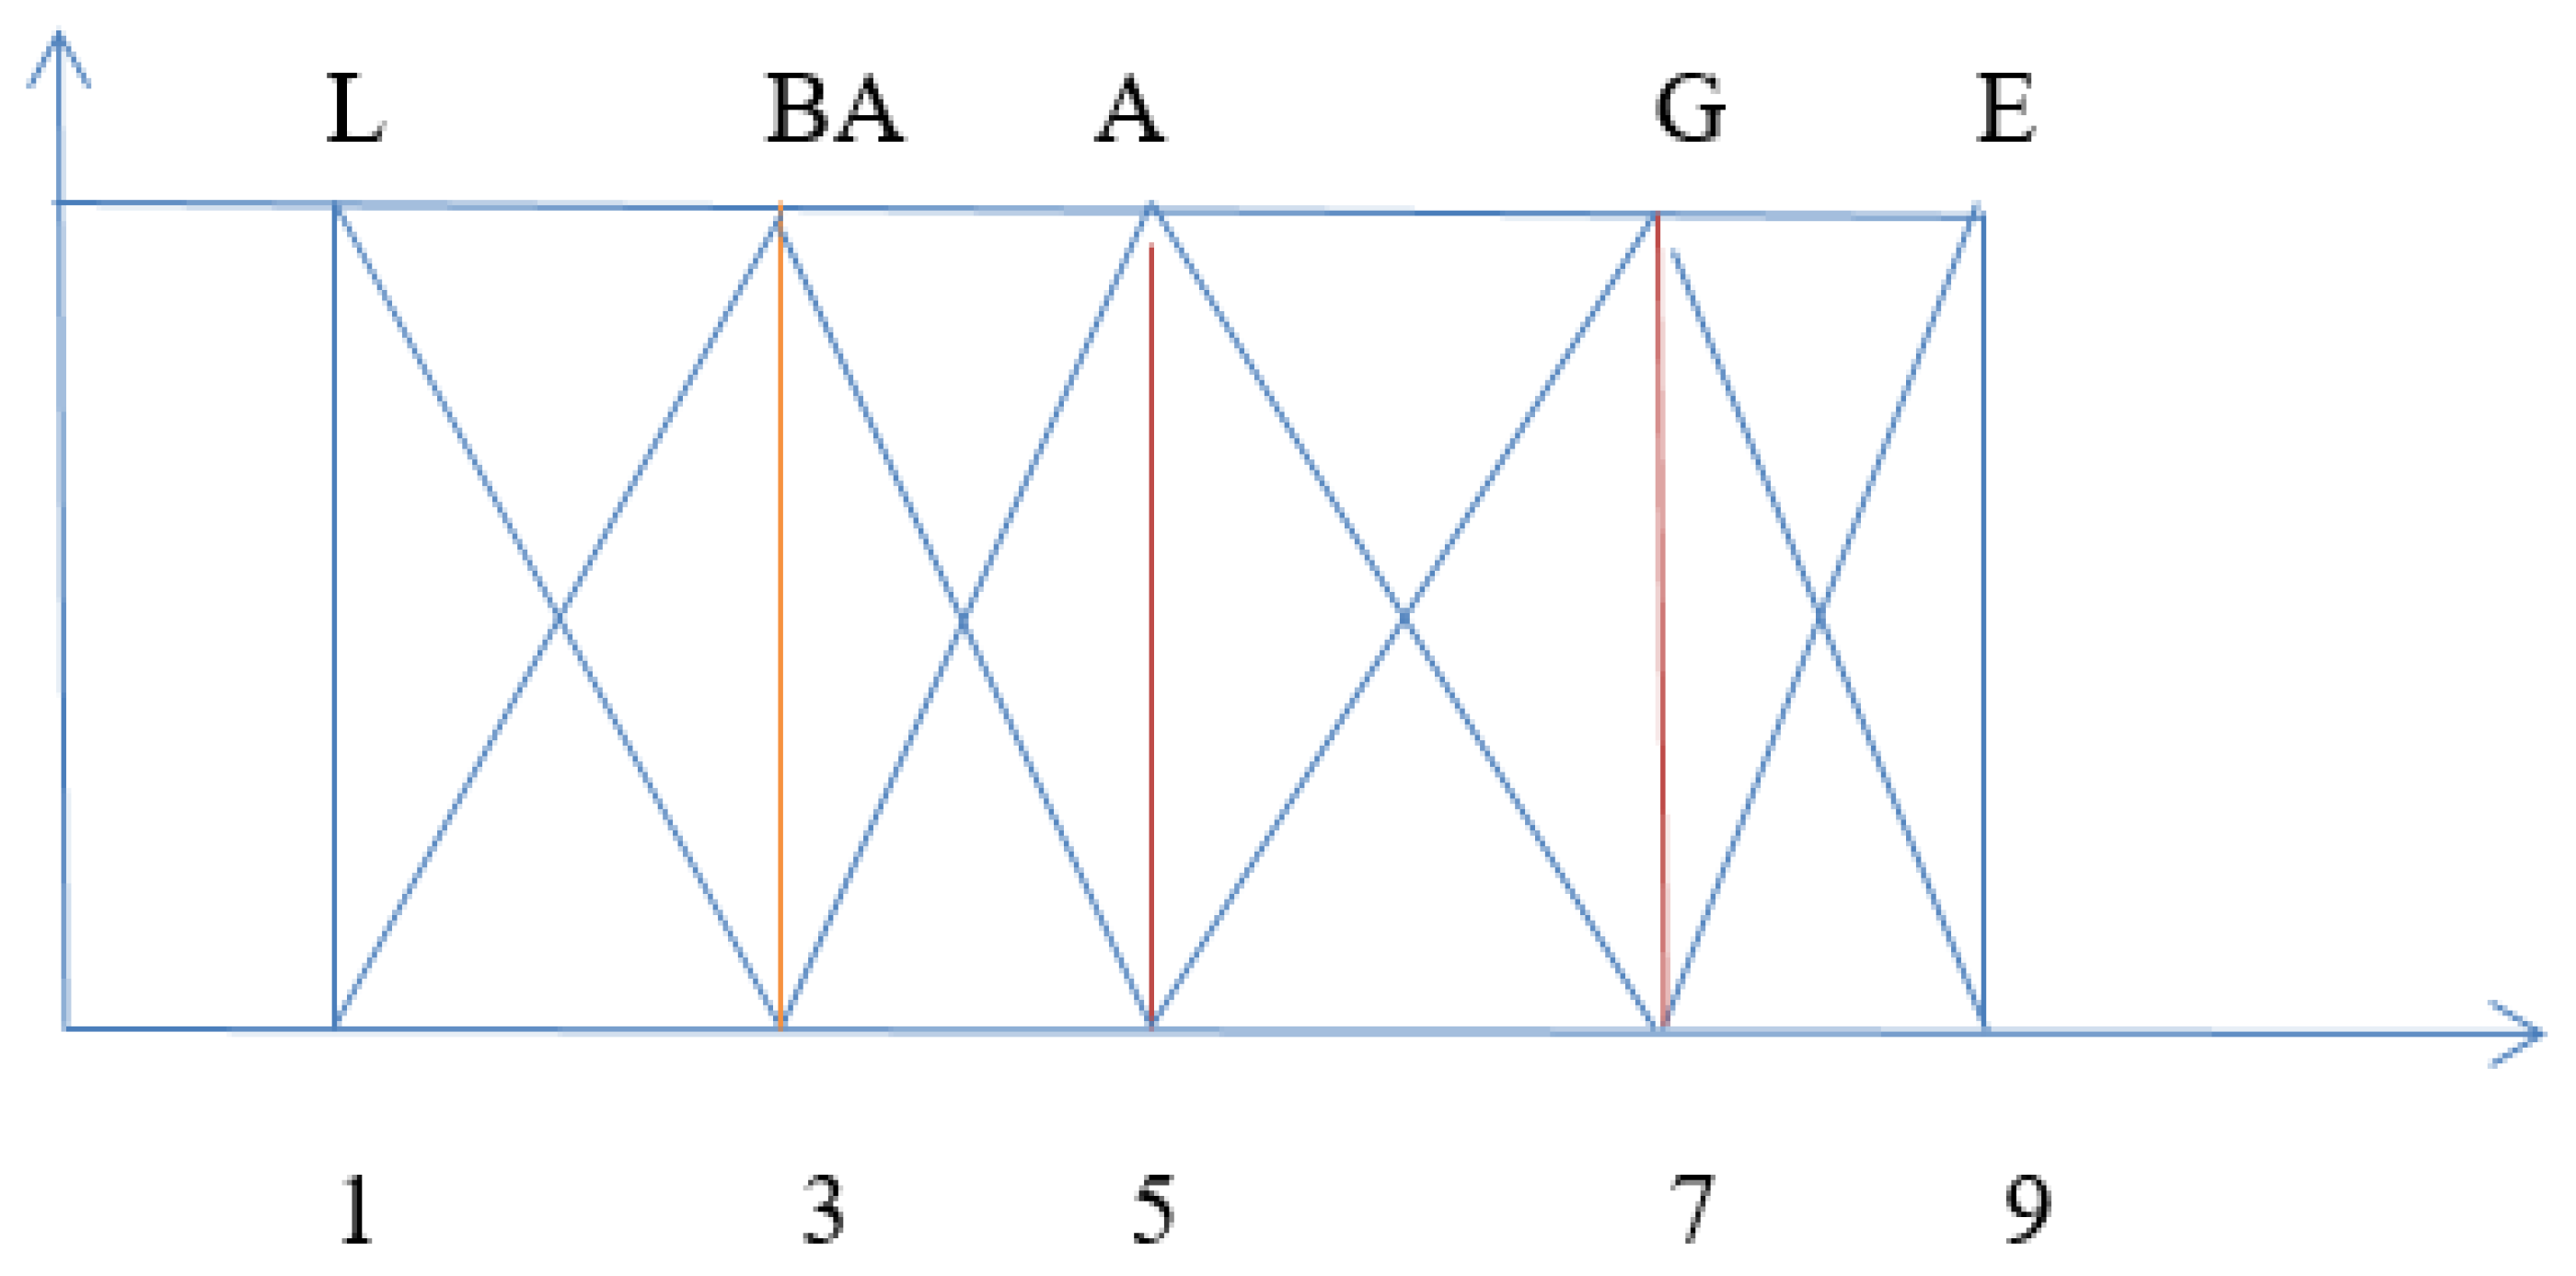
- Identifying phonological variables
- Fuzzy analytic hierarchy process
3.3. The Fuzzy Technique for Order Performance by Similarity to Ideal Solution Method
- Step 1: For criteria alternatives, choose the phonological values . The property of normalised triangular fuzzy integers belonging to [0, 1] is preserved by the fuzzy linguistic rating ; consequently, no normalisation is required.
- Step 2: Determine the fuzzy-decision matrix’s weighted normalised weights. Equation (12). Calculates the weighted normalised value .
- Step 3: Determine if the solution is beneficial-perfect (A*) or deleterious-perfect (). The fuzzy beneficial-perfect solution (FBPS, A*) and the fuzzy deleterious-perfect solution (FDPS, ) is depicted.
- Step 4: Using the equations below, calculate the distance between A* and A for each alternative:
- Step 5: Compare your results to the optimum solution.where is a hazy level of satisfaction and is an indistinct break step that demonstrates how indistinct openings are corrected to meet decision-makers’ target levels.
4. Case Study
5. Results Analysis
6. Discussion
7. Conclusions
Author Contributions
Funding
Institutional Review Board Statement
Informed Consent Statement
Data Availability Statement
Conflicts of Interest
Appendix A

| Parameters | f11 | f12 | f13 | ||||||
| f11 | 1.00 | 1.00 | 1.00 | 1.00 | 1.00 | 1.00 | 1.00 | 1.00 | 1.00 |
| f12 | 1.00 | 1.00 | 1.00 | 1.00 | 1.00 | 1.00 | 1.00 | 1.00 | 1.00 |
| f13 | 1.00 | 1.00 | 1.00 | 1.00 | 1.00 | 1.00 | 1.00 | 1.00 | 1.00 |
| f21 | 1.00 | 1.00 | 1.00 | 1.00 | 1.05 | 1.08 | 1.00 | 1.05 | 1.08 |
| f22 | 1.00 | 1.00 | 1.00 | 1.05 | 1.08 | 1.10 | 1.05 | 1.08 | 1.10 |
| f23 | 1.00 | 1.00 | 1.00 | 1.00 | 1.00 | 1.00 | 1.00 | 1.00 | 1.00 |
| f24 | 1.00 | 1.00 | 1.00 | 1.00 | 1.00 | 1.00 | 1.00 | 1.00 | 1.00 |
| f25 | 1.00 | 1.00 | 1.00 | 1.00 | 1.00 | 1.00 | 1.00 | 1.00 | 1.00 |
| f26 | 1.08 | 1.10 | 1.11 | 1.00 | 1.00 | 1.00 | 1.00 | 1.00 | 1.00 |
| f31 | 1.00 | 1.05 | 1.08 | 1.00 | 1.00 | 1.00 | 1.00 | 1.00 | 1.00 |
| f32 | 1.00 | 1.00 | 1.00 | 1.00 | 1.00 | 1.00 | 1.00 | 1.00 | 1.00 |
| f33 | 0.93 | 0.95 | 1.00 | 1.00 | 1.00 | 1.00 | 0.93 | 0.95 | 1.00 |
| f41 | 0.91 | 0.93 | 0.95 | 0.93 | 0.95 | 1.00 | 1.00 | 1.00 | 1.00 |
| f42 | 0.90 | 0.91 | 0.93 | 1.00 | 1.00 | 1.00 | 1.00 | 1.00 | 1.00 |
| f43 | 1.00 | 1.00 | 1.00 | 0.90 | 0.91 | 0.93 | 1.00 | 1.00 | 1.00 |
| Parameters | f21 | f22 | f23 | ||||||
| f11 | 1.00 | 1.00 | 1.00 | 1.00 | 1.00 | 1.00 | 1.00 | 1.00 | 1.00 |
| f12 | 0.93 | 0.95 | 1.00 | 0.91 | 0.93 | 0.95 | 1.00 | 1.00 | 1.00 |
| f13 | 0.93 | 0.95 | 1.00 | 0.91 | 0.93 | 0.95 | 1.00 | 1.00 | 1.00 |
| f21 | 1.00 | 1.00 | 1.00 | 0.93 | 0.95 | 1.00 | 0.91 | 0.93 | 0.95 |
| f22 | 1.00 | 1.05 | 1.08 | 1.00 | 1.00 | 1.00 | 0.93 | 0.95 | 1.00 |
| f23 | 1.05 | 1.08 | 1.10 | 1.00 | 1.05 | 1.08 | 1.00 | 1.00 | 1.00 |
| f24 | 1.00 | 1.00 | 1.00 | 1.05 | 1.08 | 1.10 | 1.00 | 1.05 | 1.08 |
| f25 | 1.00 | 1.00 | 1.00 | 1.00 | 1.00 | 1.00 | 1.05 | 1.08 | 1.10 |
| f26 | 1.00 | 1.00 | 1.00 | 1.00 | 1.00 | 1.00 | 1.00 | 1.00 | 1.00 |
| f31 | 1.00 | 1.00 | 1.00 | 1.00 | 1.00 | 1.00 | 1.00 | 1.00 | 1.00 |
| f32 | 1.00 | 1.00 | 1.00 | 1.00 | 1.00 | 1.00 | 1.00 | 1.00 | 1.00 |
| f33 | 1.00 | 1.00 | 1.00 | 1.00 | 1.00 | 1.00 | 1.00 | 1.00 | 1.00 |
| f41 | 1.00 | 1.00 | 1.00 | 1.00 | 1.00 | 1.00 | 1.00 | 1.00 | 1.00 |
| f42 | 0.89 | 0.90 | 0.91 | 0.93 | 0.95 | 1.00 | 1.00 | 1.00 | 1.00 |
| f43 | 0.91 | 0.93 | 0.95 | 1.00 | 1.00 | 1.00 | 1.00 | 1.00 | 1.00 |
| Parameters | f24 | f25 | f26 | ||||||
| f11 | 1.00 | 1.00 | 1.00 | 1.00 | 1.00 | 1.00 | 0.91 | 0.93 | 0.95 |
| f12 | 1.00 | 1.00 | 1.00 | 1.00 | 1.00 | 1.00 | 1.00 | 1.00 | 1.00 |
| f13 | 1.00 | 1.00 | 1.00 | 1.00 | 1.00 | 1.00 | 1.00 | 1.00 | 1.00 |
| f21 | 1.00 | 1.00 | 1.00 | 1.00 | 1.00 | 1.00 | 1.00 | 1.00 | 1.00 |
| f22 | 0.91 | 0.93 | 0.95 | 1.00 | 1.00 | 1.00 | 1.00 | 1.00 | 1.00 |
| f23 | 0.93 | 0.95 | 1.00 | 0.91 | 0.93 | 0.95 | 1.00 | 1.00 | 1.00 |
| f24 | 1.00 | 1.00 | 1.00 | 1.00 | 1.00 | 1.00 | 1.00 | 1.00 | 1.00 |
| f25 | 1.00 | 1.00 | 1.00 | 1.00 | 1.00 | 1.00 | 1.00 | 1.00 | 1.00 |
| f26 | 1.00 | 1.00 | 1.00 | 1.00 | 1.00 | 1.00 | 1.00 | 1.00 | 1.00 |
| f31 | 1.00 | 1.00 | 1.00 | 1.05 | 1.08 | 1.10 | 1.00 | 1.00 | 1.00 |
| f32 | 1.00 | 1.00 | 1.00 | 1.00 | 1.00 | 1.00 | 1.00 | 1.00 | 1.00 |
| f33 | 1.00 | 1.00 | 1.00 | 1.00 | 1.00 | 1.00 | 1.00 | 1.00 | 1.00 |
| f41 | 1.00 | 1.00 | 1.00 | 1.00 | 1.00 | 1.00 | 1.00 | 1.00 | 1.00 |
| f42 | 1.00 | 1.00 | 1.00 | 1.00 | 1.00 | 1.00 | 1.00 | 1.00 | 1.00 |
| f43 | 1.00 | 1.00 | 1.00 | 1.00 | 1.00 | 1.00 | 1.00 | 1.00 | 1.00 |
| Parameters | f31 | f32 | f33 | ||||||
| f11 | 0.93 | 0.95 | 1.00 | 1.00 | 1.00 | 1.00 | 1.00 | 1.05 | 1.10 |
| f12 | 1.00 | 1.00 | 1.00 | 1.00 | 1.00 | 1.00 | 1.00 | 1.00 | 1.00 |
| f13 | 1.00 | 1.00 | 1.00 | 1.00 | 1.00 | 1.00 | 1.00 | 1.05 | 1.10 |
| f21 | 1.00 | 1.00 | 1.00 | 1.00 | 1.00 | 1.00 | 1.00 | 1.00 | 1.00 |
| f22 | 1.00 | 1.00 | 1.00 | 1.00 | 1.00 | 1.00 | 1.00 | 1.00 | 1.00 |
| f23 | 1.00 | 1.00 | 1.00 | 1.00 | 1.00 | 1.00 | 1.00 | 1.00 | 1.00 |
| f24 | 1.00 | 1.00 | 1.00 | 1.00 | 1.00 | 1.00 | 1.00 | 1.00 | 1.00 |
| f25 | 0.91 | 0.93 | 0.95 | 1.00 | 1.00 | 1.00 | 1.00 | 1.00 | 1.00 |
| f26 | 1.00 | 1.00 | 1.00 | 1.00 | 1.00 | 1.00 | 1.00 | 1.00 | 1.00 |
| f31 | 1.00 | 1.00 | 1.00 | 1.00 | 1.05 | 1.10 | 1.05 | 1.08 | 1.10 |
| f32 | 0.93 | 0.95 | 1.00 | 1.00 | 1.00 | 1.00 | 1.00 | 1.05 | 1.10 |
| f33 | 0.91 | 0.93 | 0.95 | 0.93 | 0.95 | 1.00 | 1.00 | 1.00 | 1.00 |
| f41 | 1.00 | 1.00 | 1.00 | 0.91 | 0.93 | 0.95 | 0.93 | 0.95 | 1.00 |
| f42 | 1.00 | 1.00 | 1.00 | 1.00 | 1.00 | 1.00 | 0.91 | 0.93 | 0.95 |
| f43 | 1.00 | 1.00 | 1.00 | 0.89 | 0.90 | 0.91 | 1.00 | 1.00 | 1.00 |
| Parameters | f41 | f42 | f43 | ||||||
| f11 | 1.05 | 1.08 | 1.10 | 1.08 | 1.10 | 1.11 | 1.00 | 1.00 | 1.00 |
| f12 | 1.00 | 1.05 | 1.10 | 1.00 | 1.00 | 1.00 | 1.08 | 1.10 | 1.11 |
| f13 | 1.00 | 1.00 | 1.00 | 1.00 | 1.00 | 1.00 | 1.00 | 1.00 | 1.00 |
| f21 | 1.00 | 1.00 | 1.00 | 1.10 | 1.11 | 1.13 | 1.05 | 1.08 | 1.10 |
| f22 | 1.00 | 1.00 | 1.00 | 1.00 | 1.05 | 1.10 | 1.00 | 1.00 | 1.00 |
| f23 | 1.00 | 1.00 | 1.00 | 1.00 | 1.00 | 1.00 | 1.00 | 1.00 | 1.00 |
| f24 | 1.00 | 1.00 | 1.00 | 1.00 | 1.00 | 1.00 | 1.00 | 1.00 | 1.00 |
| f25 | 1.00 | 1.00 | 1.00 | 1.00 | 1.00 | 1.00 | 1.00 | 1.00 | 1.00 |
| f26 | 1.00 | 1.00 | 1.00 | 1.00 | 1.00 | 1.00 | 1.00 | 1.00 | 1.00 |
| f31 | 1.00 | 1.00 | 1.00 | 1.00 | 1.00 | 1.00 | 1.00 | 1.00 | 1.00 |
| f32 | 1.05 | 1.08 | 1.10 | 1.00 | 1.00 | 1.00 | 1.10 | 1.11 | 1.13 |
| f33 | 1.00 | 1.05 | 1.10 | 1.05 | 1.08 | 1.10 | 1.00 | 1.00 | 1.00 |
| f41 | 1.00 | 1.00 | 1.00 | 1.00 | 1.05 | 1.10 | 1.05 | 1.08 | 1.10 |
| f42 | 0.93 | 0.95 | 1.00 | 1.00 | 1.00 | 1.00 | 1.00 | 1.05 | 1.10 |
| f43 | 0.91 | 0.93 | 0.95 | 0.93 | 0.95 | 1.00 | 1.00 | 1.00 | 1.00 |
References
- Yu, K.D.S.; Aviso, K.B. Modelling the economic impact and ripple effects of disease outbreaks. Process Integr. Optim. Sustain. 2020, 4, 183–186. [Google Scholar] [CrossRef]
- Song, H.J.; Yeon, J.; Lee, S. Impact of the COVID-19 pandemic: Evidence from the U.S. restaurant industry. Int. J. Hosp. Manag. 2021, 92, 102702. [Google Scholar] [CrossRef] [PubMed]
- Pigatto, G.; Machado, J.G.D.C.F.; dos Santos Negreti, A.; Machado, L.M. Have you chosen your request? Analysis of online food delivery companies in Brazil. Br. Food J. 2017, 119, 639–657. [Google Scholar] [CrossRef]
- Baker, S.R.; Farrokhnia, R.A.; Meyer, S.; Pagel, M.; Yannelis, C. How does household spending respond to an epidemic? Consumption during the 2020 COVID-19 pandemic. Rev. Asset Pricing Stud. 2020, 10, 834–862. [Google Scholar] [CrossRef]
- Kim, J.; Lee, J.C. Effects of COVID-19 on preferences for private dining facilities in restaurants. J. Hosp. Tour. Manag. 2020, 45, 67–70. [Google Scholar] [CrossRef]
- Chang, H.-H.; Meyerhoefer, C. COVID-19 and the demand for online food shopping services: Empirical evidence from Taiwan. Am. J. Agric. Econ. 2020, 103, 448–465. [Google Scholar] [CrossRef]
- Blumtritt, C. Online Food Delivery Report. 2020. Available online: https://www.statista.com/outlook/dmo/eservices/online-food-delivery/worldwide (accessed on 18 July 2022).
- Li, C.; Mirosa, M.; Bremer, P. Review of online food delivery platforms and their impacts on sustainability. Sustainability 2020, 12, 5528. [Google Scholar] [CrossRef]
- Baabdullah, A.M.; Alalwan, A.A.; Rana, N.P.; Patil, P.; Dwivedi, Y.K. An integrated model for m-banking adoption in Saudi Arabia. Int. J. Bank Mark. 2019, 37, 452–478. [Google Scholar] [CrossRef]
- Statista. Mobile App Usage—Statistics & Facts. 2018. Available online: https://www.statista.com/topics/1002/mobile-app-usage/ (accessed on 15 December 2018).
- Statista. Number of Mobile App Downloads Worldwide in (2017, 2018 and 2022) in Billions. 2018. Available online: https://www.statista.com/statistics/271644/worldwidefree-and-paid-mobile-app-store-downloads/ (accessed on 15 December 2018).
- Statista. eServices Report. 2020. Available online: https://www.statista.com/study/42306/eservices-report/ (accessed on 2 December 2021).
- Maida, J. Analysis on Impact of COVID-19-Online on-Demand Food Delivery Services Market 2019–2023; Businesswire: San Francisco, CA, USA, 2020. [Google Scholar]
- Yeo, V.C.S.; Goh, S.-K.; Rezaei, S. Consumer experiences, attitude and behavioral intention toward online food delivery (OFD) services. J. Retail. Consum. Serv. 2017, 35, 150–162. [Google Scholar] [CrossRef]
- Hale, R.C.; Song, B. Single-use plastics and COVID-19: Scientific evidence and environmental regulations. Environ. Sci. Technol. 2020, 54, 7034–7036. [Google Scholar] [CrossRef]
- Prakash, C.; Barua, M.K. An analysis of integrated robust hybrid model for third-party reverse logistics partner selection under fuzzy environment. Resources. Conserv. Recycl. 2016, 108, 63–81. [Google Scholar] [CrossRef]
- Chiu, Y.-J.; Hu, Y.-C.; Yao, C.-Y.; Yeh, C.-H. Identifying Key Risk Factors in Product Development Projects. Mathematics 2022, 10, 1295. [Google Scholar] [CrossRef]
- Mehdi, K.G.; Maghsoud, A.; Kazimieras, Z.E.; Jurgita, A. A new hybrid fuzzy MCDM approach for evaluation of construction equipment with sustainability considerations. Arch. Civ. Mech. Eng. 2018, 18, 32–49. [Google Scholar] [CrossRef]
- Gunawan, F.E.; Sondakh, B.L.; Alamsjah, F. Factors affecting the user of online food delivery through mobile apps. ICIC Express Lett. 2020, 14, 1069–1081. [Google Scholar] [CrossRef]
- Tirkolaee, E.B.; Dashtian, Z.; Weber, G.; Tomaskova, H.; Soltani, M.; Mousavi, N.S. An Integrated Decision-Making Approach for Green Supplier Selection in an Agri-Food Supply Chain: Threshold of Robustness Worthiness. Mathematics 2021, 9, 1304. [Google Scholar] [CrossRef]
- Van Doremalen, N.; Bushmaker, T.; Morris, D.H.; Holbrook, M.G.; Gamble, A.; Williamson, B.N.; Tamin, A.; Harcourt, J.L.; Thornburg, N.J.; Gerber, S.I.; et al. Aerosol and surface stability of SARSCoV-2 as compared with SARS-CoV-1. N. Engl. J. Med. 2020, 382, 1564–1567. [Google Scholar] [CrossRef]
- Goldman, E. Exaggerated risk of transmission of COVID-19 by fomites. Lancet Infect. Dis. 2020, 20, 892–893. [Google Scholar] [CrossRef]
- Gavilan, D.; Balderas-Cejudo, A.; Fernández-Lores, S.; Martinez-Navarro, G. Innovation in online food delivery: Learnings from COVID-19. Int. J. Gastron. Food Sci. 2021, 24, 100330. [Google Scholar] [CrossRef]
- Tanackov, I.; Badi, I.; Stević, Ž.; Pamučar, D.; Zavadskas, E.K.; Bausys, R. A Novel Hybrid Interval Rough SWARA–Interval Rough ARAS Model for Evaluation Strategies of Cleaner Production. Sustainability 2022, 14, 4343. [Google Scholar] [CrossRef]
- Lu, M.; Wudhikarn, R. Using the best-worst method to develop intellectual capital indicators in financial service company. In Proceedings of the 2022 Joint International Conference on Digital Arts, Media and Technology with ECTI Northern Section Conference on Electrical, Electronics, Computer and Telecommunications Engineering (ECTI DAMT & NCON), Chiang Rai, Thailand, 26–28 January 2022. [Google Scholar] [CrossRef]
- Mishra, A.R.; Rani, P.; Krishankumar, R.; Zavadskas, E.K.; Cavallaro, F.; Ravichandran, K.S. A Hesitant Fuzzy Combined Compromise Solution Framework-Based on Discrimination Measure for Ranking Sustainable Third-Party Reverse Logistic Providers. Sustainability 2021, 13, 2064. [Google Scholar] [CrossRef]
- Wudhikarn, R. An approach to enhancing the human capital of enterprises associated with cooperative education. Int. J. Learn. Intellect. Cap. 2015, 12, 61–81. [Google Scholar] [CrossRef]
- Saaty, T.L. The Analytic hierarchy process; McGraw-Hill: New York, NY, USA, 1980. [Google Scholar]
- Badri, M.A. A combined AHP–GP model for quality control systems. Int. J. Prod. Econ. 2001, 72, 27–40. [Google Scholar] [CrossRef]
- Chan, F.T.S.; Kumar, N. Global supplier development considering risk factors using fuzzy extended AHP-based approach. Omega 2007, 35, 417–431. [Google Scholar] [CrossRef]
- Albayrak, E.; Erensal, Y.C. Using analytic hierarchy process (AHP) to improve human performance. An application of multiple criteria decision making problem. J. Intell. Manuf. 2004, 15, 491–503. [Google Scholar] [CrossRef]
- Wang, J.J.; Yang, D.L. Using a hybrid multi-criteria decision aid method for information systems outsourcing. Comput. Oper. Res. 2007, 34, 3691–3700. [Google Scholar] [CrossRef]
- Zadeh, L.A. Information and Control. Fuzzy Sets 1965, 8, 338–353. [Google Scholar]
- Gumus, A.-T. Evaluation of hazardous waste transportation firms by using a twostep fuzzy-AHP and TOPSIS methodology. Expert Syst. Appl. 2009, 36, 4067–4074. [Google Scholar] [CrossRef]
- Huang, C.-C.; Chu, P.-Y.; Chiang, Y.-H. A fuzzy AHP application in government-sponsored R&D project selection. Omega 2008, 36, 1038–1052. [Google Scholar]
- Cakir, O.; Canbolat, M.-S. A web-based decision support system for multicriteria inventory classification using fuzzy AHP methodology. Expert Syst. Appl. 2008, 35, 1367–1378. [Google Scholar] [CrossRef]
- Wang, T.-C.; Chen, Y.-H. Applying fuzzy linguistic preference relations to the improvement of consistency of fuzzy AHP. Inf. Sci. 2008, 178, 3755–3765. [Google Scholar] [CrossRef]
- Sambasivan, M.; Fei, N.-Y. Evaluation of critical success factors of implementation of ISO 14001 using analytic hierarchy process (AHP): A case study from Malaysia. J. Clean. Prod. 2008, 16, 1424–1433. [Google Scholar] [CrossRef]
- Sharma, M.-J.; Moon, I.; Bae, H. Analytic hierarchy process to assess and optimize distribution network. Appl. Math. Comput. 2008, 202, 256–265. [Google Scholar] [CrossRef]
- Costa, C.-A.-B.; Vansnick, J.-C. A critical analysis of the eigenvalue method used to derive priorities in AHP. Eur. J. Oper. Res. 2008, 187, 1422–1428. [Google Scholar] [CrossRef]
- Firouzabadi, S.-M.-A.-K.; Henson, B.; Barnes, C. A multiple stakeholders’ approach to strategic selection decisions. Comput. Ind. Eng. 2008, 54, 851–865. [Google Scholar] [CrossRef]
- Wang, Y.-M.; Luo, Y.; Hua, Z. On the extent analysis method for fuzzy AHP and its applications. Eur. J. Oper. Res. 2008, 186, 735–747. [Google Scholar] [CrossRef]
- Kuo, M.-S.; Tzeng, G.-H.; Huang, W.-C. Group decision making based on concepts of ideal and anti-ideal points in fuzzy environment. Math. Comput. Modeling 2007, 45, 324–339. [Google Scholar] [CrossRef]
- Armillotta, A. Selection of layered manufacturing techniques by an adaptive AHP decision model. Robot. Comput.-Integr. Manuf. 2008, 24, 450–461. [Google Scholar] [CrossRef]
- Dagdeviren, M.; Yuksel, I. Developing a fuzzy analytic hierarchy process (AHP) model for behavior-based safety management. Inf. Sci. 2008, 178, 1717–1733. [Google Scholar] [CrossRef]
- Chen, M.-F.; Tzeng, G.-H.; Ding, C.-G. Combining fuzzy AHP with MDS in identifying the preference similarity of alternatives. Appl. Soft Comput. 2008, 8, 110–117. [Google Scholar] [CrossRef]
- Lin, M.-C.; Wang, C.-C.; Chen, M.-S.; Chang, C.-A. Using AHP and TOPSIS approaches in customer-driven product design process. Comput. Ind. 2008, 59, 17–31. [Google Scholar] [CrossRef]
- Kulak, O.; Durmusoglu, B.; Kahraman, C. Fuzzy multi-attribute equipment selection based on information axiom. J. Mater. Processing Technol. 2005, 169, 337–345. [Google Scholar] [CrossRef]
- Büyükzkan, G.; Feyzioglu, O.; Nebol, E. Selection of the strategic alliance partner in logistics value chain. Int. J. Prod. Econ. 2008, 113, 148–158. [Google Scholar] [CrossRef]
- Chen, T.Y.; Tsao, C.Y. The interval-valued fuzzy TOPSIS methods and experimental analysis. Fuzzy Sets Syst. 2008, 159, 1410–1428. [Google Scholar] [CrossRef]
- Kahraman, C.; Büyükzkan, G.; Ates, N.Y. A two phase multi-attribute decision making approach for new product introduction. Inf. Sci. 2007, 177, 1567–1582. [Google Scholar] [CrossRef]
- Onüt, S.; Soner, S. Transshipment site selection using the AHP and TOPSIS approaches under fuzzy environment. Waste Manag. 2007, 28, 1552–1559. [Google Scholar] [CrossRef] [PubMed]
- Wang, Y.M.; Elhag, T.M.S. Fuzzy TOPSIS method based on alpha level sets with an application to bridge risk assessment. Expert Syst. Appl. 2006, 31, 309–319. [Google Scholar] [CrossRef]
- Yong, D. Plant location selection based on fuzzy TOPSIS. Int. J. Adv. Manuf. Technol. 2006, 28, 839–844. [Google Scholar] [CrossRef]
- Chang, Y.H.; Chung, H.Y.; Wang, S.Y. A survey and optimization-based evaluation of development strategies for the air cargo industry. Int. J. Prod. Econ. 2007, 106, 550–562. [Google Scholar] [CrossRef]
- Chang, Y.H.; Yeh, C.H. A survey analysis of service quality for domestic airlines. Eur. J. Oper. Res. 2002, 139, 166–177. [Google Scholar] [CrossRef]
- Kahraman, C.; Beskese, A.; Ruan, D. Measuring flexibility of computer integrated manufacturing systems using fuzzy cash flow analysis. Inf. Sci. 2004, 168, 77–94. [Google Scholar] [CrossRef]
- Zimmerman, H.J. Fuzzy Sets Theory and Its Applications; Kluwer Academic Publisher: Boston, MA, USA, 1996. [Google Scholar]
- Xu, Z.S.; Chen, J. An interactive method for fuzzy multiple attributes group decision making. Inf. Sci. 2007, 177, 248–263. [Google Scholar] [CrossRef]


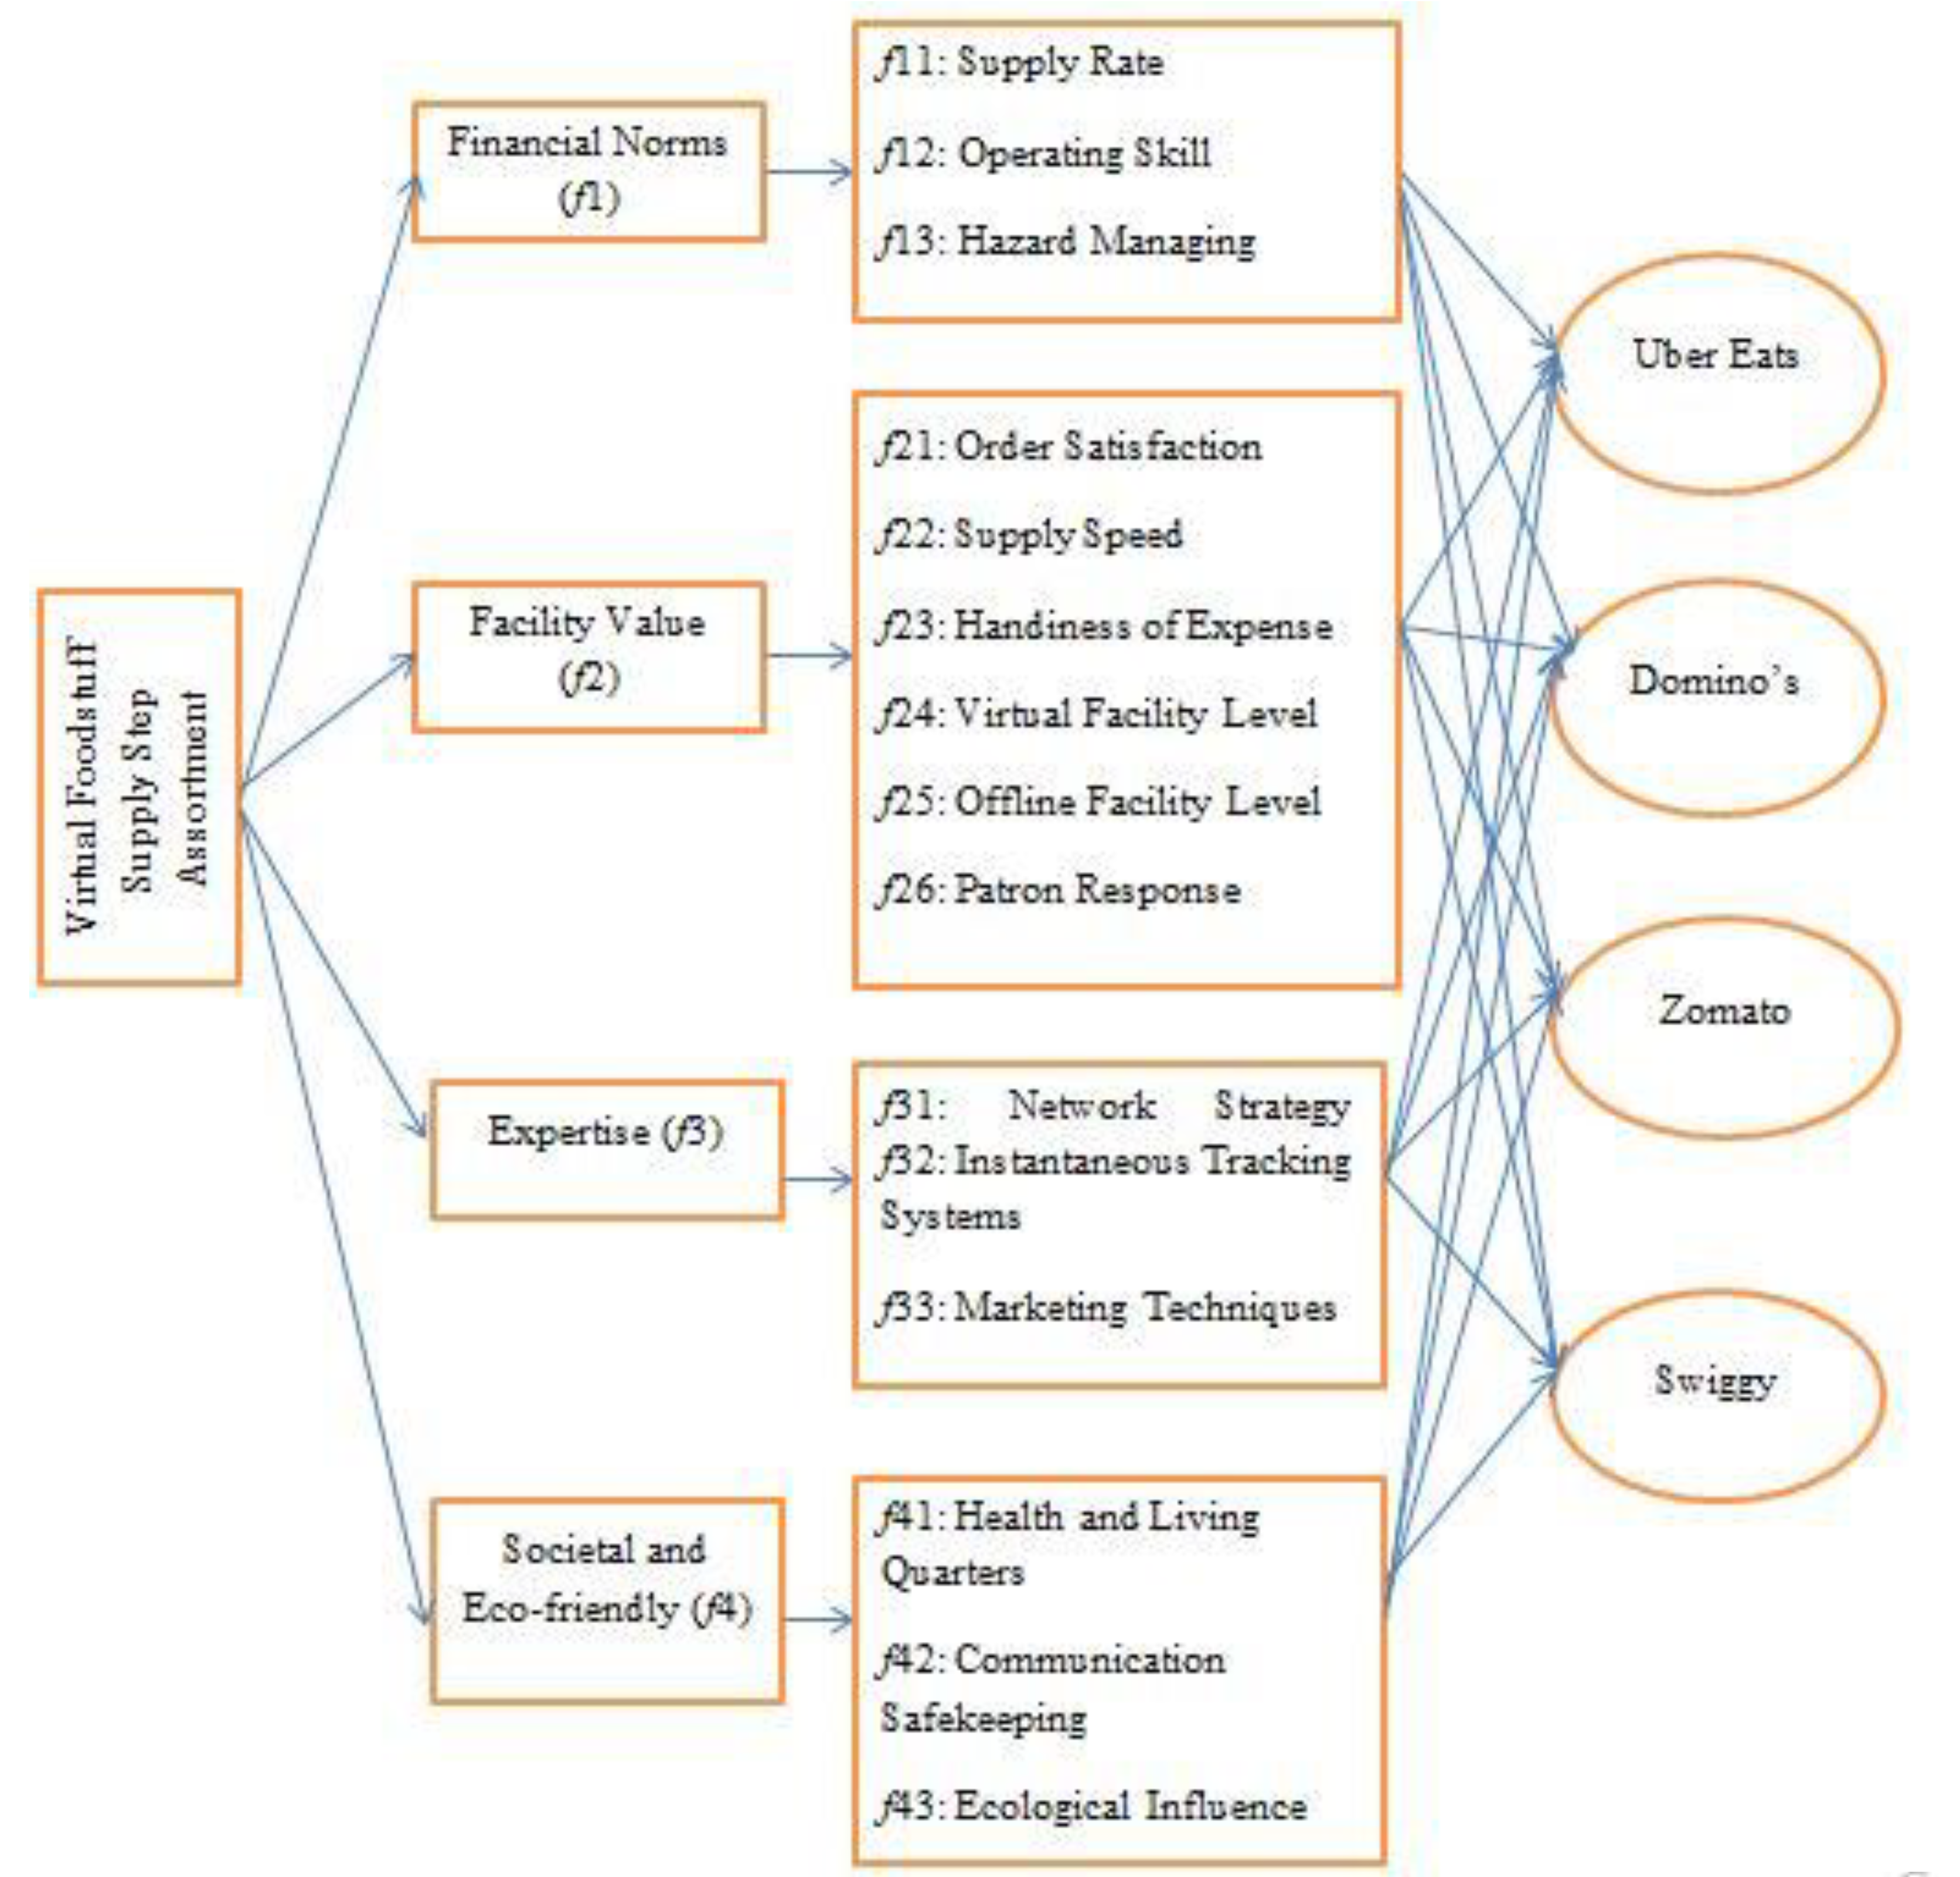
| Main Criteria | Sub-Criteria | Goal | Descriptions |
|---|---|---|---|
| Financial Norms (f1) | f11: Supply Rate | Minimal | Transportation, labour, and administration costs all add up to a significant amount of money |
| f12: Operating Skill | Maximal | Value propositions offered by the company, as well as the extension of its operational capabilities | |
| f13: Hazard Managing | Minimal | Investor risk management, cash flow statement, and shareholders’ equity | |
| Facility Value (f2) | f21: Order Satisfaction | Maximal | Order processing time is reduced, order pick-up time is reduced, and packaged food is kept clean. |
| f22: Supply Speed | Minimal | Arrival of orders in a timely manner | |
| f23: Handiness of Expense | Maximal | Payment options are varied. | |
| f24: Virtual Facility Level | Maximal | SMS response time and customer service employee response time | |
| f25: Offline Facility Level | Maximal | Delivery personnel’s attitudes, as well as dealers’ responses to consumer concerns | |
| f26: Patron Response | Maximal | Customer behaviour intents, online reviews, and online rating | |
| Expertise (f3) | f31: Network Strategy | Maximal | Platform that is up to date, has visual impacts on the pages, and is user-friendly |
| f32: Instantaneous tracking systems | Maximal | Tracking and tracing over the internet, using cutting-edge technologies | |
| f33: Marketing Techniques | Maximal | Digital marketing, as well as digital technologies, are being used to promote products. | |
| Societal and Eco-friendly (f4) | f41: Health and Living quarters | Maximal | Health and safety regulations, food cleanliness, and contactless delivery |
| f42: Communication Safekeeping | Maximal | Data security for customers, as well as online payment security | |
| f43: Ecological Influence | Minimal | CO2 emissions from automobiles, solid waste, and traffic noise are all examples of environmental issues |
| Scale Rating | Meaning |
|---|---|
| 1 | Equally vital |
| 3 | Moderately Crucial |
| 5 | Crucial |
| 7 | Imperative |
| 9 | Very Important |
| 2, 4, 6, 8 | Between binary neighbouring decisions, there are values in the middle |
| Fuzzy Numeral | Phonological Variables | Gage of Fuzzy Numeral |
|---|---|---|
| 9 | Flawless | (9, 9, 9) |
| 8 | Complete | (7, 8, 9) |
| 7 | Brilliant | (6, 7, 8) |
| 6 | Decent Enough | (5, 6, 7) |
| 5 | Decent | (4, 5, 6) |
| 4 | Better | (3, 4, 5) |
| 3 | Average | (2, 3, 4) |
| 2 | Less Benefit | (1, 2, 3) |
| 1 | Equivalent | (1, 1, 1) |
| Linguistics Rating Level | Allocated Triangular Fuzzy Number |
|---|---|
| Low | (1, 1, 3) |
| Below Average | (1, 3, 5) |
| Average | (3, 5, 7) |
| Good | (5, 7, 9) |
| Excellent | (7, 9, 9) |
| Criteria | Weight |
|---|---|
| Financial Norms (f1) | 0.4649 |
| Facility Value (f2) | 0.2086 |
| Expertise (f3) | 0.2341 |
| Societal and Eco-friendly (f4) | 0.0924 |
| Sub Criteria | Weight | Sub Criteria | Weight |
|---|---|---|---|
| f11 | 0.0728 | f26 | 0.0684 |
| f12 | 0.0659 | f31 | 0.0842 |
| f13 | 0.0559 | f32 | 0.0776 |
| f21 | 0.0789 | f33 | 0.0590 |
| f22 | 0.0775 | f41 | 0.0581 |
| f23 | 0.0678 | f42 | 0.0499 |
| f24 | 0.0726 | f43 | 0.0469 |
| f25 | 0.0645 |
| Main Criteria | (7,8,9) | (6,7,8) | (5,6,7) | (4,5,6) | (3,4,5) | (2,3,4) | (1,2,3) | (1,1,1) | (1,2,3) | (2,3,4) | (3,4,5) | (4,5,6) | (5,6,7) | (6,7,8) | (7,8,9) | Main Criteria |
|---|---|---|---|---|---|---|---|---|---|---|---|---|---|---|---|---|
| f1 | * | f2 | ||||||||||||||
| f1 | * | f3 | ||||||||||||||
| f1 | * | f4 | ||||||||||||||
| f2 | * | f3 | ||||||||||||||
| f2 | * | f3 | ||||||||||||||
| f2 | * | f4 | ||||||||||||||
| f3 | * | f4 |
| Criteria | Financial Norms (f1) | Facility Value (f2) | Expertise (f3) | Societal and Eco-Friendly (f4) |
|---|---|---|---|---|
| Financial Norms (f1) | (1,1,1) | (1,2,3) | (2,3,4) | (3,4,5) |
| Facility Value (f2) | (1/3,1/2,1/1) | (1,1,1) | (1,1,1) | (1,2,3) |
| Expertise (f3) | (1/4,1/3,1/2) | (1,1,1) | (1,1,1) | (3,4,5) |
| Societal and Eco-friendly (f4) | (1/5,1/4,1/3) | (1/3,1/2,1/1) | (1/5,1/4,1/3) | (1,1,1) |
| Criteria | Financial Norms (f1) | Facility Value (f2) | Expertise (f3) | Societal and Eco-Friendly (f4) |
|---|---|---|---|---|
| Financial Norms (f1) | 1 | 1.7321 | 2.8284 | 3.8730 |
| Facility Value (f2) | 0.5774 | 1 | 1 | 1.7321 |
| Expertise (f3) | 0.3536 | 1 | 1 | 3.8730 |
| Societal and Eco-friendly (f4) | 0.2582 | 0.5774 | 0.2582 | 1 |
| Sum | 2.1892 | 4.3095 | 5.0866 | 10.4781 |
| Criteria | Financial Norms (f1) | Facility Value (f2) | Expertise (f3) | Societal and Eco-Friendly (f4) | Priority Vector |
|---|---|---|---|---|---|
| Financial Norms (f1) | 0.4568 | 0.4019 | 0.5561 | 0.3701 | 0.4462 |
| Facility Value (f2) | 0.2638 | 0.2321 | 0.1966 | 0.1652 | 0.2144 |
| Expertise (f3) | 0.1615 | 0.2321 | 0.1966 | 0.3701 | 0.2400 |
| Societal and Eco-friendly (f4) | 0.1179 | 0.1339 | 0.0507 | 0.0954 | 0.0994 |
| Sum | 1.0000 | 1.0000 | 1.0000 | 1.0000 | 1.0000 |
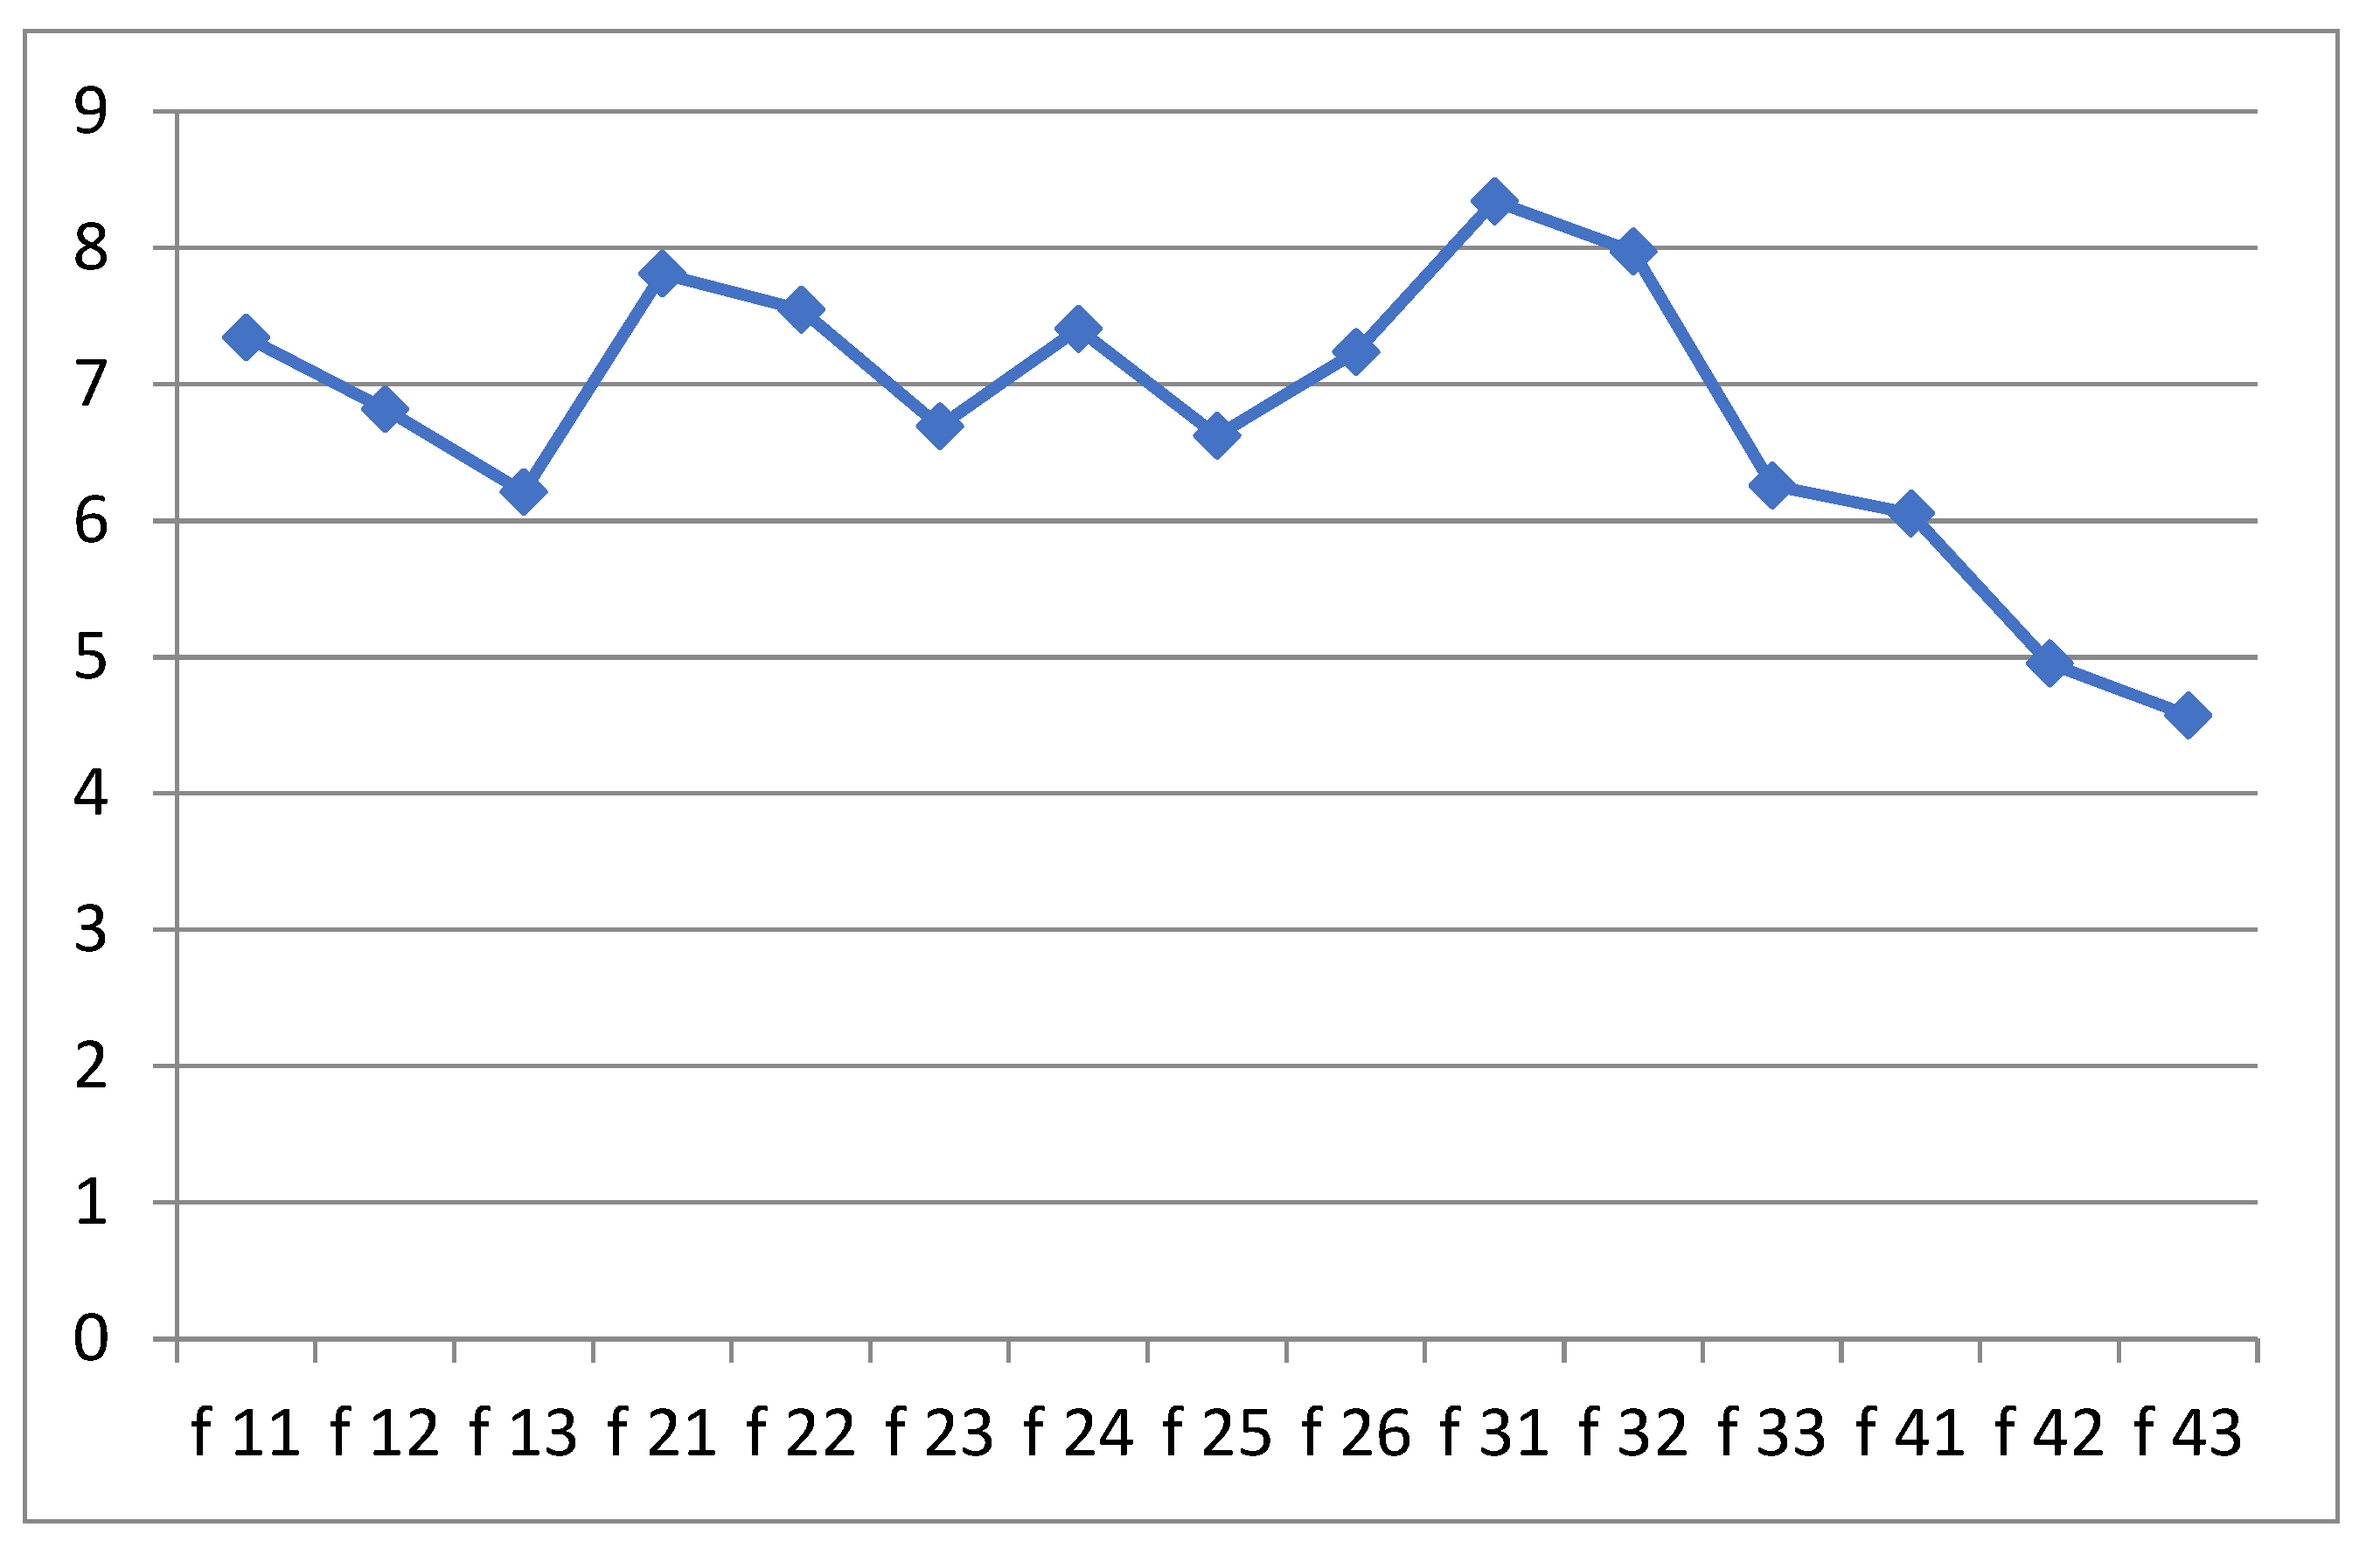
| Major Indicators | Parameters | Goal | Uncertain Parametric Means | Fuzzy Weights |
|---|---|---|---|---|
| Financial Norms (f1) | f11: Supply Rate | Minimal | (0.9548, 1.0968, 1.2545) | (0.0556, 0.0720, 0.0928) |
| f12: Operating Skill | Maximal | (0.9117, 1.0193, 1.1437) | (0.0531, 0.0669, 0.0846) | |
| f13:Hazard Managing | Minimal | (0.8473, 0.9293, 1.0273) | (0.0493, 0.0610, 0.0760) | |
| Facility Value (f2) | f21:Order Satisfaction | Maximal | (0.9733, 1.1659, 1.3663) | (0.0567, 0.0765, 0.1011) |
| f22: Supply Speed | Minimal | (0.9293, 1.1268, 1.3299) | (0.0541, 0.0739, 0.0984) | |
| f23: Handiness of Expense | Maximal | (0.8874, 1, 1.1268) | (0.0517, 0.0656, 0.0834) | |
| f24: Virtual Facility Level | Maximal | (1.0472, 1.1268, 1.1801) | (0.0610, 0.0739, 0.0873) | |
| f25:Offline Facility Level | Maximal | (0.9548, 1, 1.0472) | (0.0556, 0.0656, 0.0775) | |
| f26:Patron Response | Maximal | (1.0759, 1.0968, 1.1132) | (0.0627, 0.0720, 0.0824) | |
| Expertise (f3) | f31:Network Strategy | Maximal | (1.0968, 1.2698, 1.3928) | (0.0639, 0.0833, 0.1031) |
| f32: Instantaneous tracking systems | Maximal | (1.0675, 1.1978, 1.3299) | (0.0622, 0.0786, 0.0984) | |
| f33:Marketing Techniques | Maximal | (0.7664, 0.9117, 1.1268) | (0.0446, 0.0598, 0.0834) | |
| Societal and Eco-friendly (f4) | f41: Health and Living quarters | Maximal | (0.7519, 0.8874, 1.0759) | (0.0438, 0.0582, 0.0796) |
| f42:Communication Safekeeping | Maximal | (0.6277, 0.7267, 0.8705) | (0.0365, 0.0477, 0.0644) | |
| f43:Ecological Influence | Minimal | (0.6158, 0.6754, 0.7725) | (0.0358, 0.0443, 0.0571) |
| Financial Norms (f1) | Facility Value (f2) | Expertise (f3) | Societal and Eco-Friendly (f4) | |
|---|---|---|---|---|
| Uber Eats | 0.1111, 0.3333, 0.7777 | 0.1111, 0.6296, 1 | 0.3333, 0.6296, 1 | 0.3333, 0.5294, 1 |
| Domino’s | 0.3333, 0.7777, 1 | 0.5555, 0.8518, 1 | 0.3333, 0.7037, 1 | 0.3333, 0.3600, 0.6 |
| Zomato | 0.5555, 0.8518, 1 | 0.3333, 0.7777, 1 | 0.5555, 0.8518, 1 | 0.3333, 0.4736, 1 |
| Swiggy | 0.3333, 0.6296, 1 | 0.3333, 0.7777, 1 | 0.3333, 0.6296, 1 | 0.3333, 0.4736, 1 |
| Financial Norms (f1) | Facility Value (f2) | Expertise (f3) | Societal and Eco-Friendly (f4) | |
|---|---|---|---|---|
| Uber Eats | 0.3333, 1.6665, 5.4439 | 0.7777, 5.6664, 9 | 2.3331, 5.6664, 9 | 1.6665, 3.7058, 9 |
| Domino’s | 0.9999, 3.8885, 7 | 3.8885, 7.6662, 9 | 2.3331, 6.3333, 9 | 1.6665, 2.52, 5.4 |
| Zomato | 1.6665, 4.259, 7 | 2.3331, 6.9993, 9 | 3.8885, 7.6662, 9 | 1.6665, 3.3152, 9 |
| Swiggy | 0.9999, 3.148, 7 | 2.3331, 6.9993, 9 | 2.3331, 5.6664, 9 | 1.6665, 3.3152, 9 |
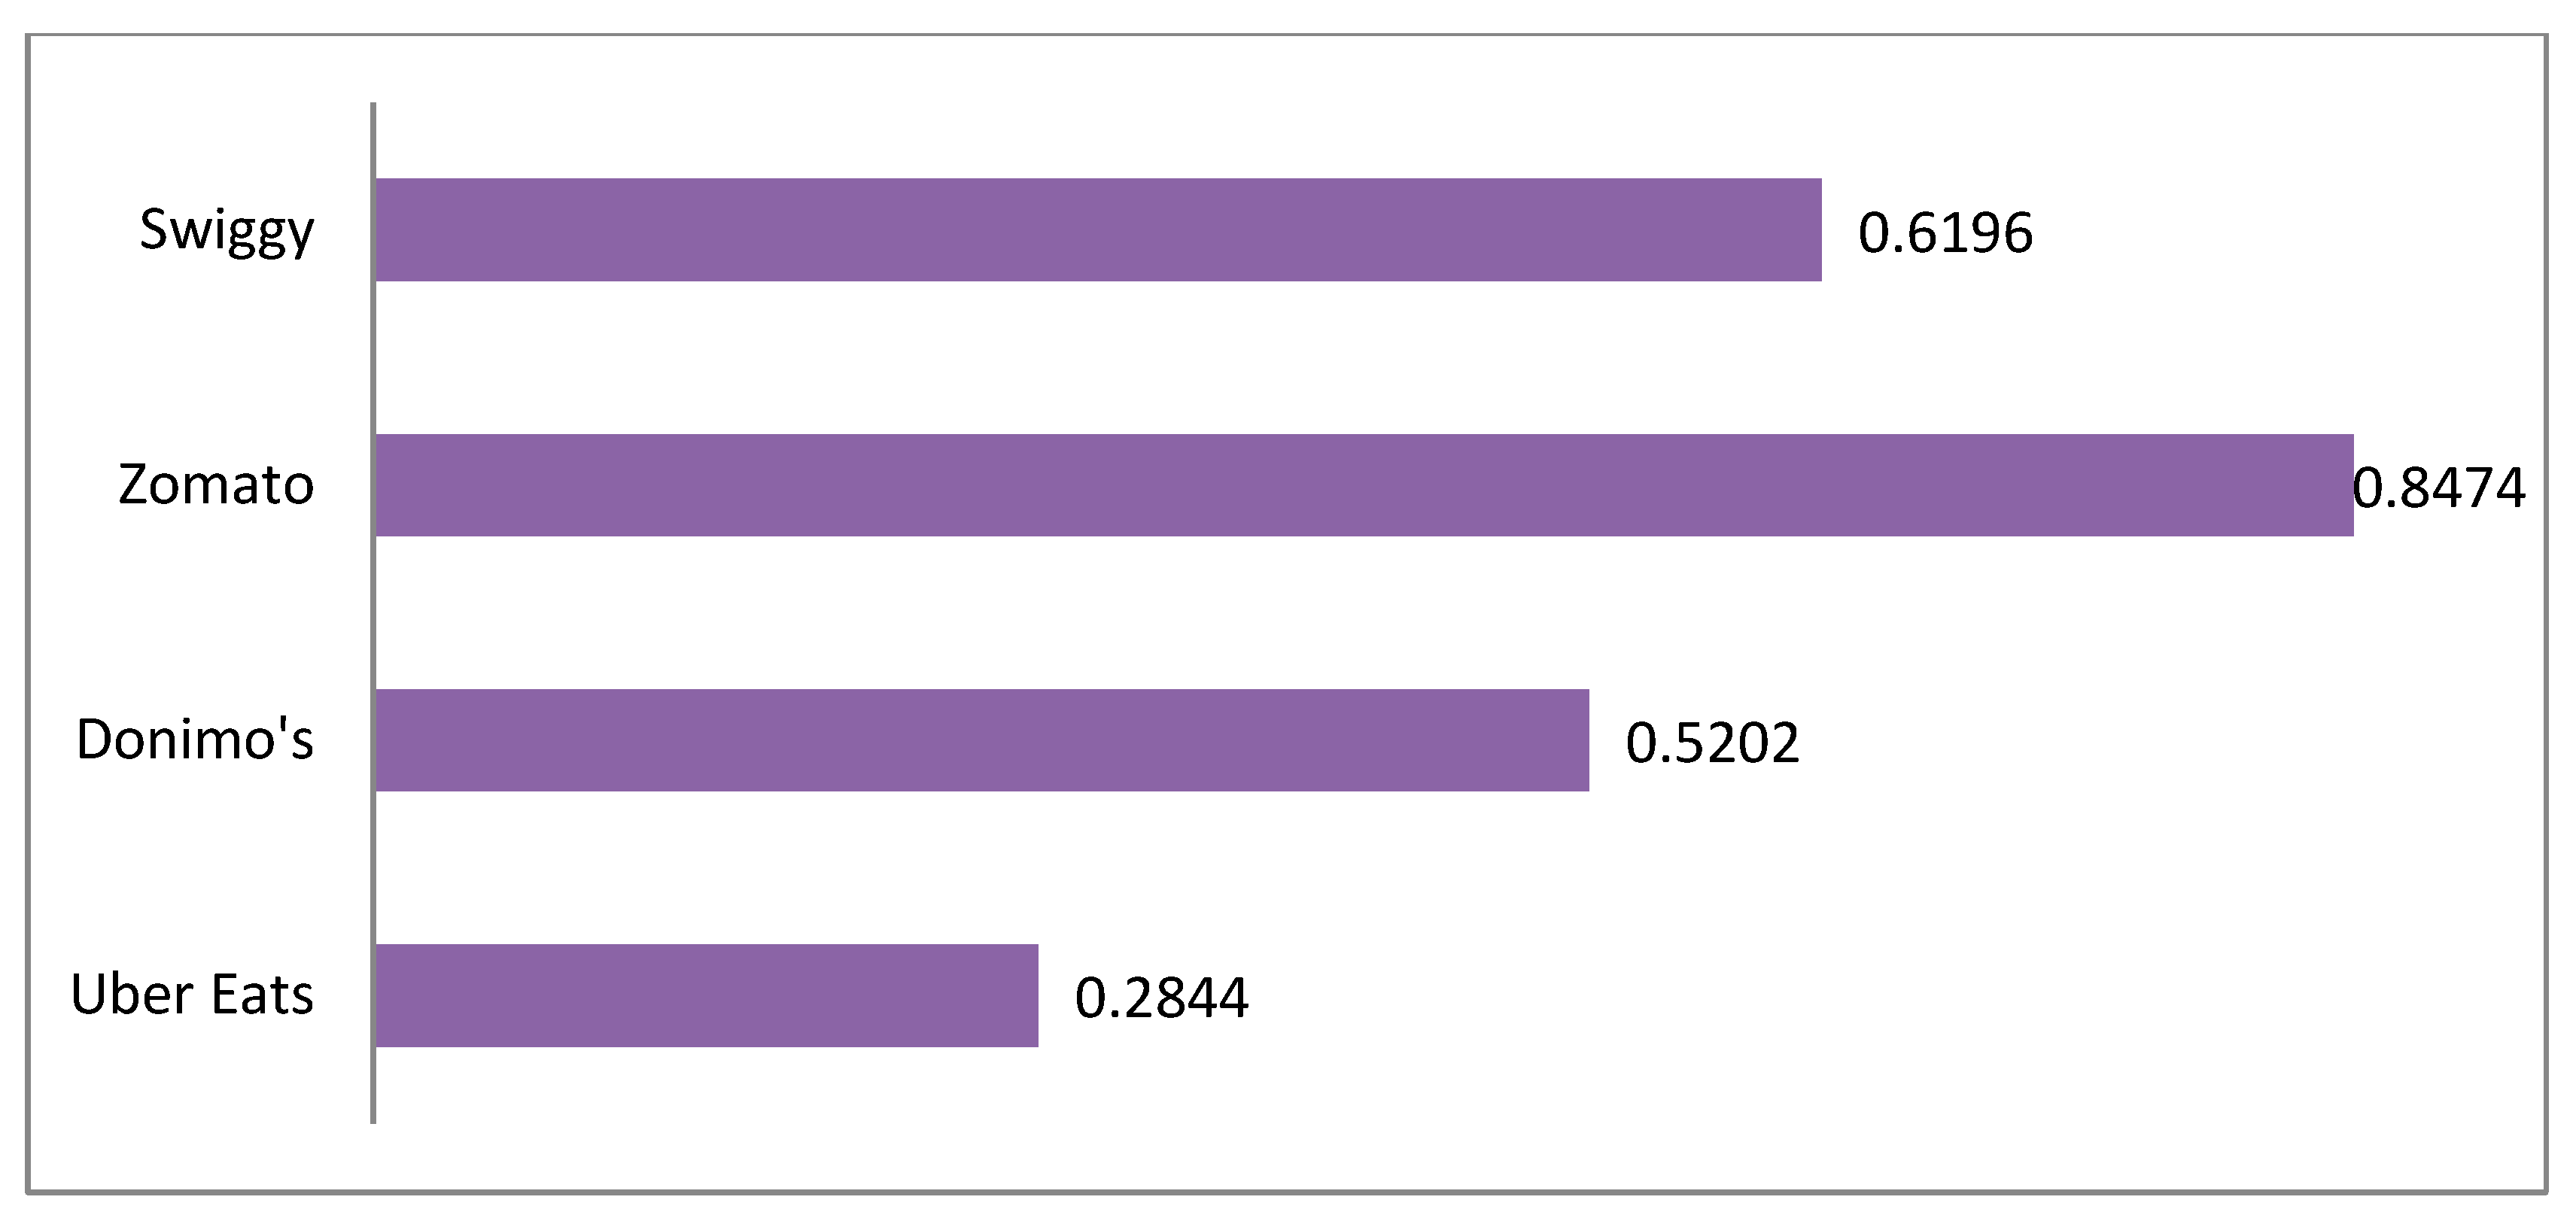
| Alternatives | Level of Satisfaction | Rank | ||
|---|---|---|---|---|
| Uber Eats | 2.1883 | 5.5055 | 0.2844 | 4 |
| Domino’s | 4.1327 | 3.8111 | 0.5202 | 3 |
| Zomato | 6.6815 | 1.2023 | 0.8474 | 1 |
| Swiggy | 5.5606 | 3.4128 | 0.6196 | 2 |
Publisher’s Note: MDPI stays neutral with regard to jurisdictional claims in published maps and institutional affiliations. |
© 2022 by the authors. Licensee MDPI, Basel, Switzerland. This article is an open access article distributed under the terms and conditions of the Creative Commons Attribution (CC BY) license (https://creativecommons.org/licenses/by/4.0/).
Share and Cite
Ajjipura Shankar, H.U.; Kodipalya Nanjappa, U.K.; Alsulami, M.D.; Prasannakumara, B.C. A Fuzzy AHP-Fuzzy TOPSIS Urged Baseline Aid for Execution Amendment of an Online Food Delivery Affability. Mathematics 2022, 10, 2930. https://doi.org/10.3390/math10162930
Ajjipura Shankar HU, Kodipalya Nanjappa UK, Alsulami MD, Prasannakumara BC. A Fuzzy AHP-Fuzzy TOPSIS Urged Baseline Aid for Execution Amendment of an Online Food Delivery Affability. Mathematics. 2022; 10(16):2930. https://doi.org/10.3390/math10162930
Chicago/Turabian StyleAjjipura Shankar, Harshitha Urs, Udaya Kumara Kodipalya Nanjappa, M. D. Alsulami, and Ballajja C. Prasannakumara. 2022. "A Fuzzy AHP-Fuzzy TOPSIS Urged Baseline Aid for Execution Amendment of an Online Food Delivery Affability" Mathematics 10, no. 16: 2930. https://doi.org/10.3390/math10162930
APA StyleAjjipura Shankar, H. U., Kodipalya Nanjappa, U. K., Alsulami, M. D., & Prasannakumara, B. C. (2022). A Fuzzy AHP-Fuzzy TOPSIS Urged Baseline Aid for Execution Amendment of an Online Food Delivery Affability. Mathematics, 10(16), 2930. https://doi.org/10.3390/math10162930