Article

Comprehensive Identification of Surface Subsidence Evaluation Grades of Mines in Southwest China

College of Mining, Guizhou University, Guiyang 550025, China
*
Authors to whom correspondence should be addressed.
Mathematics 2022, 10(15), 2664; https://doi.org/10.3390/math10152664
Submission received: 23 June 2022 / Revised: 17 July 2022 / Accepted: 25 July 2022 / Published: 28 July 2022
(This article belongs to the Section E2: Control Theory and Mechanics)

Abstract

:
Due to their complex geological structure, it is difficult to systematically analyze the surface subsidence of coal mines in southwest China, and the factors that cause surface subsidence are also different from other coal mines. Focusing on the problem of surface subsidence caused by mining in southwest China’s mines, a grade evaluation system for surface subsidence of southwest mines is constructed based on the analytic hierarchy process, and ten evaluation indicators are established from the perspectives of mining disturbance and geological structure. A matter–element model of surface subsidence based on matter–element extension theory and a cloud model of surface subsidence based on cloud theory are then constructed. A coal mine in Anshun, Guizhou, is taken as an example to calculate the evaluation level of surface subsidence and thus verify the scientificity of extension theory and cloud theory. The results show that the main factors that affect the surface subsidence of southwest mines are the number of coal seam layers, mining height and comprehensive Platt hardness of rock, similar to that of northern plain coal mines. Surface slope and subsidence area are also very important. The comprehensive correlation degree of each grade of the coal mine is −0.29836, 0.192232, −0.1093 and −0.46531, and the coal mine is concluded to be in grade 2. The calculated similarity of the overall index evaluation cloud map of the coal mine and each grade is 0, 0.3453, 0.7872 and 0, respectively. The coal mine is in grade 2, which is a relatively safe state. Consistent with the calculation results of the extension model and in line with the field situation, the extension matter–element model and cloud model built in this paper can verify each other and have a certain scientificity.

1. Introduction

Surface subsidence caused by coal mining will not only cause ecological harm, but can also easily damage buildings [1,2]. Coal mines in southwest China, represented by Yunnan, Guizhou and Sichuan, have always been the main areas for coal mining in China. However, most of these coal mines are in mountainous areas, and mining can easily lead to landslides [3,4]. Compared with the coal mines in the northern plains, the mine geology in the southwest is more complex, and as a result, surface subsidence caused by mining in the southwest will cause greater harm and loss. Therefore, the influencing factors of surface subsidence in southwest mines needs to be analyzed, and the main influencing indexes need to be determined in order to comprehensively evaluate the surface subsidence.
At present, for coal mines in the northern plains, mining surface subsidence is generally believed to be mainly related to the mining method, mining speed, mining depth, mining height, mining width and roof management [5,6,7,8,9,10,11,12]. At this stage, many scholars and experts have a relatively comprehensive understanding of the influencing factors of surface subsidence after coal mining in the northern plains [13,14,15,16]. Oleg presented the results of predicting the physical and mechanical properties and stress–strain state of rock mass, and K.I. Satpayev, in his study Zhezkazgan copper ore region and its mineral resources, created a map of metallogenic predictions for Kazakhstan, thereby reducing the risk of mine subsidence in Kazakhstan [17,18,19]. Large-scale mining operations in highly stressed hard rock masses are characterized by significant geomechanical and geodynamic processes associated with changes in the stress state, deformation and displacement of the mine rock. These processes caused severe losses in Germany, the United States, Poland and the Czech Republic [20,21,22,23,24]. However, less research has been conducted on the influencing factors of surface subsidence in coal mines in the southwest mountainous area of China, and systematic research on the influencing factors of surface subsidence in coal mines in the southwestern mountainous area is lacking. This lack of research is due to the fact that the influencing factors of surface subsidence have great ambiguity, and quantifying them is therefore difficult. In recent years, traditional evaluation methods, such as the analytic hierarchy process (AHP) and grey correlation, have been widely used in various fields of coal mines [25,26,27,28,29,30,31,32,33], but these traditional methods contain ambiguity. Extension matter–element analysis [34,35,36,37,38] and cloud model analysis [39,40,41] can quantitatively and qualitatively analyze the events to be evaluated with strong visibility and easy observation, and have a good effect on the ambiguity events. Compared to mines with more obvious occurrence conditions at home and abroad, the surface subsidence evaluation of mines in southwest China is particularly difficult. Therefore, it is necessary to analyze and evaluate the surface subsidence of mines in Southwest China.
On the basis of the above content, this paper firstly uses AHP to construct a grade evaluation system for the surface subsidence of southwest mines and thus determine the weight of each index. The material element model is then established based on extended theory, and the cloud model is established based on cloud theory. Combined with the specific engineering background, a comprehensive evaluation of the surface subsidence of the southwest mines is performed to provide a reference for the early warning of surface subsidence.

2. Methods

2.1. Southwest Mine Surface Subsidence Grade Evaluation System

The influencing factors of surface subsidence in shallow-buried mines can be summarized by analyzing two main aspects: the mine’s own geological structure, and human factors (i.e., mining disturbance). The geological structure can be subdivided into surface slope aspect, comprehensive Platt hardness of overlying rock (overlying rock strength), fault density and subsidence area rate. Mining disturbance can be subdivided into six indicators: mining depth, mining height, mining width, support assistance, mining coal layers and working face advancement speed. According to the summarized influencing factors, the evaluation system for the surface subsidence grade of shallow-buried mines, shown in Figure 1, can be constructed.
According to various indicators, the surface subsidence levels of shallow-buried mines are then divided into four grades: first-level Q1 (safe), second-level Q2 (slightly safe), third-level Q3 (slightly serious) and fourth-level Q4 (very serious). The corresponding ranges of different grades and different indicators are shown in Table 1. The mining depth is the burial depth of the coal seam, and a deep burial depth corresponds to less impact on the subsidence [42]. The mining height is less than or equal to the thickness of the coal seam, and most of the southwest coal mines are thin coal seams; a small mining thickness corresponds to less impact on the subsidence [43]. The mining width depends on the occurrence conditions of the coal mine; a small mining width corresponds to less impact on the subsidence [44]. Support strength is represented by the support resistance; when the support resistance is larger, the support force on the surface is greater, and therefore the impact is smaller [45]. Coal mines are mostly shallow-buried coal seam groups with two to four layers. The advancing speed of the working face is influenced by equipment and production, and has a greater impact on the surface subsidence over time [46]. Most of the southwest areas are mountainous karst areas, and mines usually have a certain slope. The surface slope indicates the steepness of the mine mountain. The comprehensive Platt hardness of the overlying rock is used to indicate the hardness of the overlying rock [47]. A large area ratio and fault density indicate a higher likelihood of the mine experiencing surface subsidence [48].

2.2. AHP Determines the Weight of Each Index of Surface Subsidence

AHP is a qualitative and quantitative analysis, as well as an evaluation method that decomposes each element of a decision-making problem into three levels: objectives, criteria and plans. AHP can increase the effectiveness of decision-making. Using AHP mainly includes the steps of establishing a judgement matrix group, calculating the weight of each index and checking the consistency of the calculation results [49].
The weight vector is calculated by judging the largest eigenvalue (λm) of the matrix. The corresponding feature vector U j is expressed as
U j = ( U 1 , U 2 , U 3 , , U n )
According to the above formula, the exponential weight (ωj) and the weight vector are calculated as follows:
ω j = U j j = 1 n U j ( j = 1 , 2 , 3 , , n )
( ω 1 , ω 2 , ω 3 , , ω n ) T
To ensure the accuracy of the calculation results, the maximum eigenvalue (m) of the interpretation matrix needs to be used for a consistency check. Consistency testing requires the use of the consistency ratio ( C R ) and the consistency index ( C I ), which are calculated as follows:
C I = λ n n 1
C R = C I R I
where R I is the random C I , and its value is shown in Table 2.
When the CR is less than 1, it is considered that the CR has passed; otherwise, it will continue to be adjusted until the consistency is passed.

2.2.1. Constructing the Judgement Matrix and Calculating the Indicator Weights

A judgement matrix is constructed according to the evaluation index system of mine surface subsidence, plus the influence degree of each index on surface subsidence, combined with the literature knowledge [50,51,52].
(1)
Judgement matrix southwest mine surface subsidence evaluation system M A
M A = B 1 , 1 B 1 , 2 B 2 , 1 B 2 , 2 = 1 6 / 4 4 / 6 1
(2)
Judgement matrix mining disturbance M B 1
M B 1 = C 1 , 1 C 1 , 2 C 1 , 3 C 1 , 4 C 1 , 5 C 1 , 6 C 2 , 1 C 2 , 2 C 2 , 3 C 2 , 4 C 2 , 5 C 2 , 6 C 3 , 1 C 3 , 2 C 3 , 3 C 3 , 4 C 3 , 5 C 3 , 6 C 4 , 1 C 4 , 2 C 4 , 3 C 4 , 4 C 4 , 5 C 4 , 6 C 5 , 1 C 5 , 2 C 5 , 3 C 5 , 4 C 5 , 5 C 5 , 6 C 6 , 1 C 6 , 2 C 6 , 3 C 6 , 4 C 65 C 6 , 6 = 1 2 3 4 / 3 5 / 6 3 1 / 2 1 2 3 / 2 1 / 3 1 1 / 3 1 / 2 1 1 / 2 1 / 4 2 3 / 4 2 / 3 2 1 1 / 3 5 / 6 6 / 5 3 4 3 1 4 1 / 3 1 1 / 2 6 / 5 1 / 4 1
(3)
Judgement matrix geological structure M B 2
M B 2 = C 7 , 7 C 7 , 8 C 7 , 9 C 7 , 10 C 8 , 7 C 8 , 8 C 8 , 9 C 8 , 10 C 9 , 7 C 9 , 8 C 9 , 9 C 9 , 10 C 10 , 7 C 10 , 8 C 10 , 9 C 10 , 10 = 1 2 / 3 4 / 3 4 / 5 3 / 2 1 3 / 5 2 3 / 4 5 / 3 1 1 5 / 4 1 / 2 1 1
According to the above formula and the corresponding values in Table 2, the index weight, C I and C R of each standard level are calculated, as shown in Table 3.

2.2.2. Formatting of Mathematical Components

The ranking weight of the elements in the scheme layer of the decision objective can be calculated according to the following formula:
ω A ( C i ) = m = 1 n ω A ( B i ) ω B i ( C i )
where ω A ( C i ) represents the weight of the elements in the scheme layer of the decision target. The weight ranking results are shown in Table 4.
The above table indicates that the three indicators that have the greatest impact on mine surface subsidence are: the number of mining coal layers, the mining height and the comprehensive Platt hardness of the overlying rock, followed by the surface slope, subsidence area rate, mining depth, support resistance, working face advancing speed, and mining width.
These findings show that, similar to most northern plain coal mines, the number of coal seams, mining height, comprehensive Platt hardness of overlying rock and fault density are the main factors that affect the surface subsidence after coal mining. Unlike the coal mines in the northern plains, the slope of the mountain is also one of the factors that affects the surface subsidence of the southwest mines.

2.3. Construction of Extension Evaluation Model of Surface Subsidence

Extension theory was first created by scholar Cai Wen, and it has been greatly used and expanded in rock mechanics. On this basis, this paper establishes a mine surface subsidence evaluation model, as shown in Figure 2.

2.3.1. Establishment of the Classical Domain, Section Domain and Matter–Element to Be Evaluated

(1)
Classical domain matter–element
M j = ( Q j , c i , ν j i ) = Q j c 1 ν j 1 c 2 ν j 2 · · · · · · c n ν j n = Q j c 1 < a j 1 , b j 1 > c 2 < a j 2 , b j 2 > · · · · · · c n < a j n , b j n >
where M j represents the matter-element of the classical domain, and ν j i = < a j i , b j i > is the range of the index.
(2)
Segmental matter–element
M p = ( Q p , c i , ν p i ) = Q p c 1 ν p 1 c 2 ν p 2 · · · · · · c n ν p n = Q p c 1 < a p 1 , b p 1 > c 2 < a p 2 , b p 2 > · · · · · · c n < a p n , b p n >
where M p represents the matter–element of the node domain, and ν p i = < a p i , b p i > is the range of the index feature quantity, p represents the totality of the evaluation grades in the entire matter–element system, and < a j i , b j i > < a p i , b p i > .
(3)
Judgement matrix geological structure MB2
M x = ( Q x , c i , ν i ) = Q x c 1 ν 1 c 2 ν 2 · · · · · · c n ν n
where M x is the event to be evaluated, and ν i is the specific value of the influencing factor c i .

2.3.2. Determination of the Correlation Function

(1)
Correlation of the evaluation index to the evaluation level
The relevant calculation formula for the correlation between the evaluation index ν i and the evaluation level j is as follows:
r j ( ν i ) = l ( ν i , ν j i ) ν j i l ( ν i , ν j i ) l ( ν i , ν p i ) l ( ν i , ν j i ) ( ν i ν j i ) ( ν i ν j i ) j
where l ( ν i , ν j i ) is the distance from the point to the interval.
The following relationship is satisfied:
ν j i = b j i a j i
l ( ν i , ν j i ) = ν a j i + b j i 2 ( b j i a j i ) 2
l ( ν i , ν p i ) = ν a p i + b p i 2 ( b p i a p i ) 2
(2)
Comprehensive correlation degree for the event to be evaluated to the evaluation level
The comprehensive correlation degree for the event to be evaluated can effectively combine the correlation degree of the evaluation index with the evaluation level and the weight of each evaluation index. The specific calculation formula is as follows:
r j ( Q x ) = i = 1 n ω A ( C i ) r j ( ν i )
where ω A ( C i ) is the weight value of each index calculated by AHP.
(3)
Judgement of the level of the event to be evaluated
Firstly, the relevance vector is constructed according to the calculated relevance
r j ( Q x ) = ( r j ( Q 1 ) , r j ( Q 2 ) , r j ( Q 3 ) , · · · , r j ( Q n ) )
If r j ( Q x ) = max ( r j ( Q x ) ) , x = 1 , 2 , · · · , 3 , then the level of the event to be evaluated is x , so as to classify the event to be evaluated.

3. Result

3.1. Cloud Model Theory

The Cloud model is the specific implementation method of the cloud, and it is also the basis of cloud-based computing, reasoning and control. It can represent the process from a qualitative concept to a quantitative representation (forward cloud generator) and a quantitative representation to a qualitative concept (reverse cloud generator). It is mainly represented by the expected value ( E x ), entropy value ( E n ) and super-entropy value ( H e ). The digital characteristics of cloud parameters can be calculated by the following formula:
H e = k E x = 1 2 ( C max + C min ) E n = 1 6 ( C max C min )
where k represents the degree of uncertainty cohesion, and C max and C min are the maximum and minimum values of the evaluation index range, respectively.
The evaluation process for the surface subsidence of mines in southwest China on the basis of cloud model theory is shown in Figure 3.

Building a Standard Cloud Model

The data in Table 1 were normalized, and the standard cloud digital features of each index corresponding to each level were calculated according to the above formula. Combined with the index weights and index cloud characteristics of each index, the following formulas were used to calculate the comprehensive standard cloud numerical characteristics of the four evaluation levels corresponding to the two first-level indexes and the standard cloud numerical characteristics of the total index, as shown in Table 5.
( E x , E n , H e ) = ( ω 1 ω 1 ω 1 ) E x 1 E n 1 H e 1 E x 2 E n 2 H e 2 E x m E n m H e m
where E x m , E n m and H e m are the numerical characteristics of each index, respectively, and E x , E n and H e are the numerical characteristics of the comprehensive index.
In accordance with the above table, the forward cloud generator was used to set 5000 cloud droplets to generate the standard cloud model of each first-level index and the total index of the surface subsidence of mines in southwest China, as shown in the Figure 4 and Figure 5 below.
The intuitive identification of the cloud model was used to compare the range of the cloud image to be evaluated with the grade range of the standard cloud model, and to intuitively reflect that the cloud droplets to be evaluated are concentrated in the grade range of the standard cloud image, thus determining the index level.

3.2. Case Analysis

This paper takes a mine in Anshun City, Guizhou Province, as the research object. The main body of the minefield is a low–medium mountain landform with a fault block structure. The highest point is Lantern Mountain, and the lowest point is the intersection of the Moshi River and Youzhong River. The mineable coal seams are M8 and M9, in which the thickness of the M8 coal seam in the minefield is 0.03–1.98 m, with an average thickness of 1.21 m, and the thickness of the M9 coal seam is 0–1.97 m, with an average thickness of 1.53 m. The mining depth ranges from +600 m to +920 m. This seam is a typical shallow-buried coal seam in the southwest mountainous area and has important research significance for the research object of this paper. The mine is located in Anshun City, Guizhou Province, as shown in Figure 6.

3.2.1. Construction of Extension Model

Firstly, the classical domain and the section domain were constructed according to the above extension theory, as follows:
M j = c j i Q 1 Q 2 Q 3 Q 4 c 1 < 400 , 600 > < 600 , 800 > < 800 , 1000 > < 1000 , 1200 > c 2 < 0 , 1 > < 1 , 2 > < 2 , 3 > < 3 , 4 > c 3 < 100 , 150 > < 150 , 200 > < 200 , 250 > < 250 , 300 > c 4 < 0 , 6000 > < 6000 , 8000 > < 8000 , 10,000 > < 10,000 , 12,000 > c 5 < 0.5 , 1.5 > < 1.5 , 2.5 > < 2.5 , 3.5 > < 3.5 , 4.5 > c 6 < 0 , 40 > < 4065 > < 6585 > < 85,100 > c 7 < 0 , 15 > < 15 , 30 > < 30 , 45 > < 45 , 60 > c 8 < 0 , 3 > < 3 , 6 > < 6 , 9 > < 9 , 12 > c 9 < 0 , 1 > < 12.5 > < 2.54 > < 4 , 6 > c 10 < 0 , 10 > < 1030 > < 30 , 70 > < 70 , 100 >
Some data changes and simplifications were applied for the convenience of calculation (for example, the number of coal seams to be mined can only be an integer, and the interval was added for the convenience of calculation), but the calculation results were not affected.
In accordance with actual coal mine engineering, the matter-–element to be evaluated was obtained as follows:
M x = N x c 1 780 c 2 1.2 c 3 200 c 4 9000 c 5 2 c 6 70 c 7 25 c 8 7 c 9 2.6 c 10 20
  • Calculation of Matter–Element Correlation Degree to Be Evaluated
Firstly, the correlation function value of each index for the mine surface subsidence evaluation grade to be evaluated was calculated according to Equations (10)–(13), as shown in Table 6.
Then, according to Equation (14) and the weight of each index, determined by the AHP, the comprehensive correlation degree of mine surface subsidence to the evaluation grade was finally obtained, as shown in Table 7.
2.
Level of the Event to be Evaluated is Determined
The correlation degree vector of the coal mine surface subsidence was constructed according to the calculated correlation degree.
The following can be obtained: we can determine that the coal mine surface subsidence grade is second-grade, Q2 (safer grade).

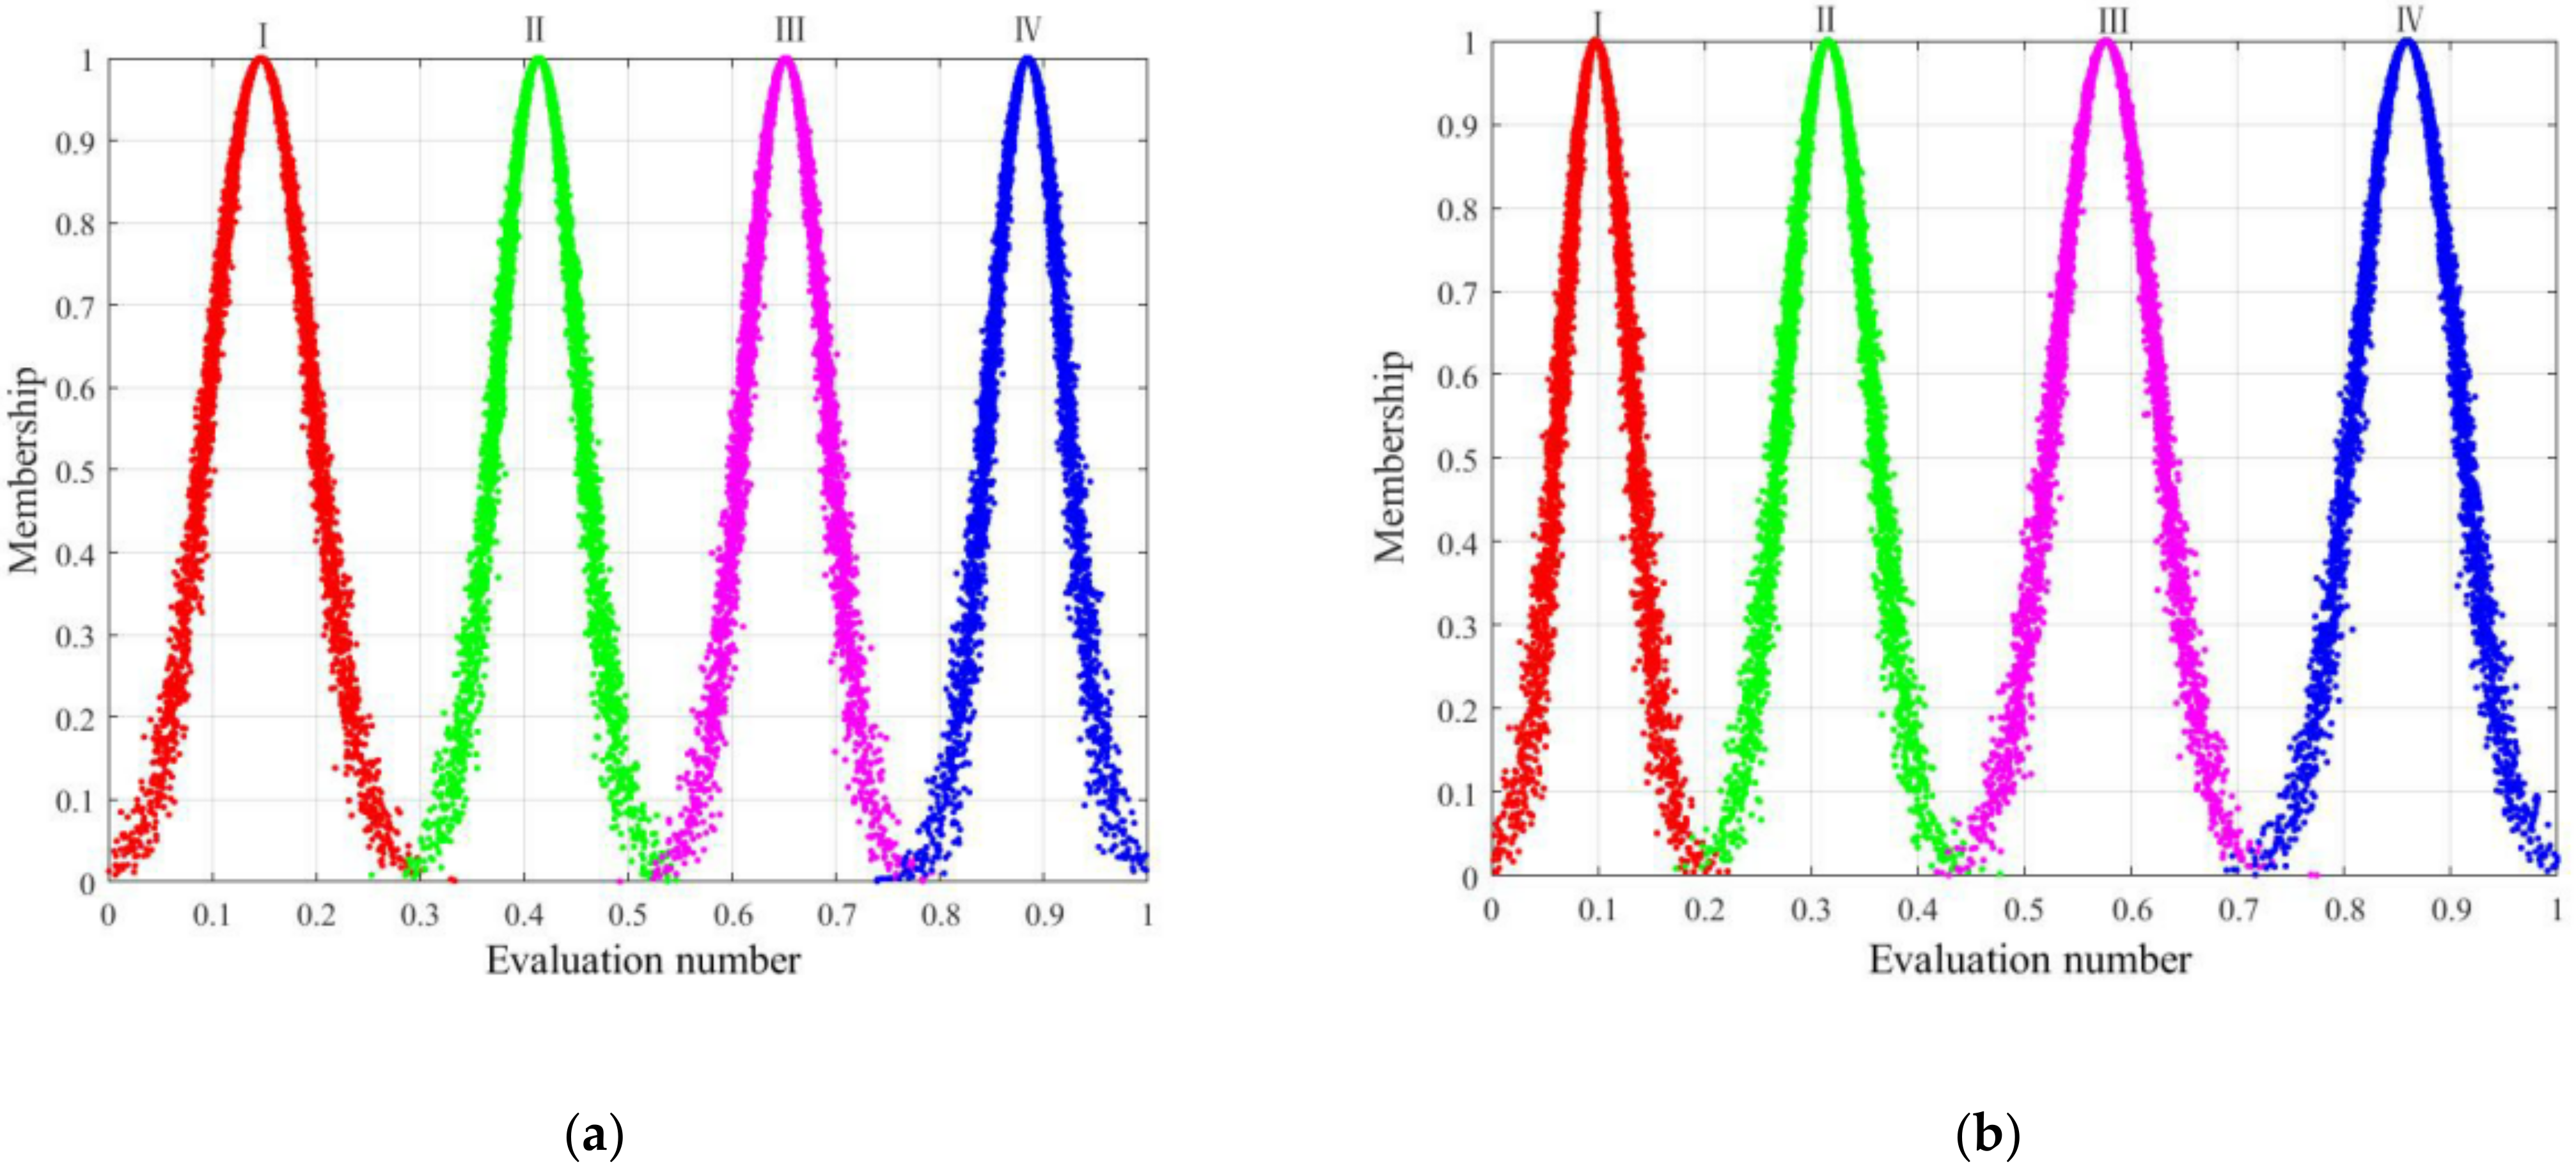
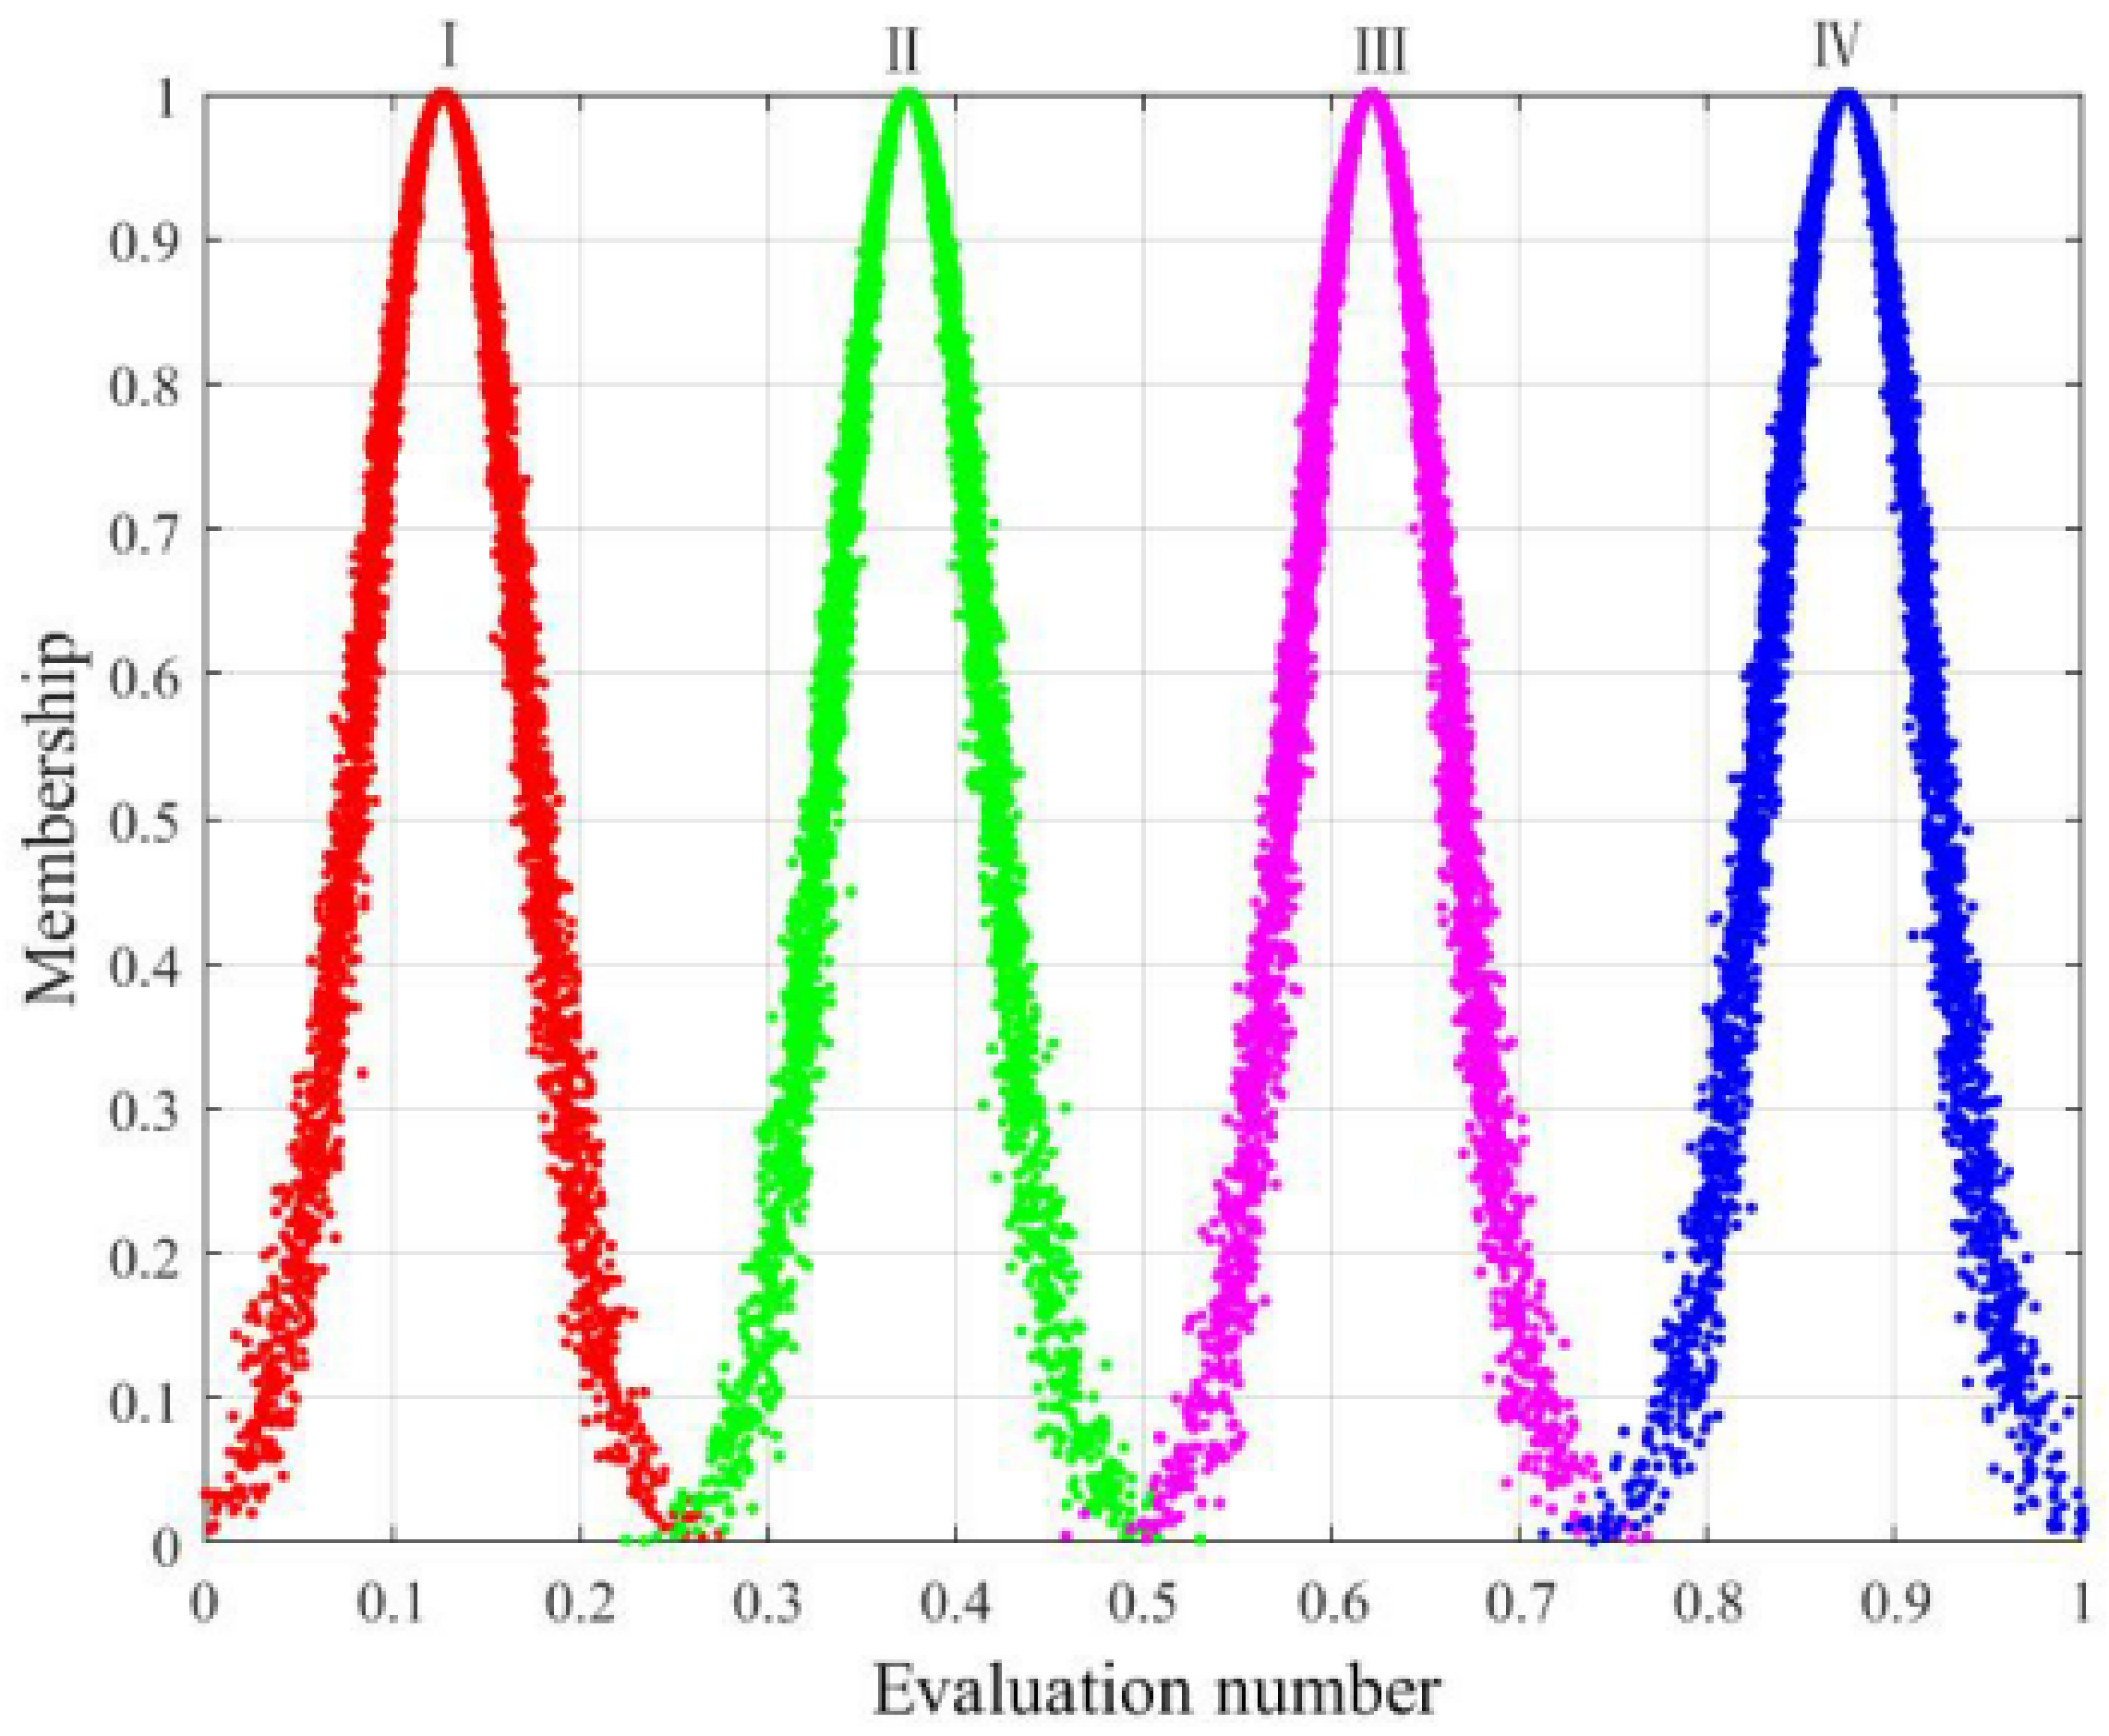
3.2.2. Construction of the Cloud Model

The evaluation index values of surface subsidence were summarized and then normalized. The cloud digital characteristics of each evaluation index were calculated according to Equations (16) and (17), as shown in Table 8. The comprehensive evaluation calculated the cloud digital characteristics of the total index as 0.4539, 0.0345 and 0.0034.

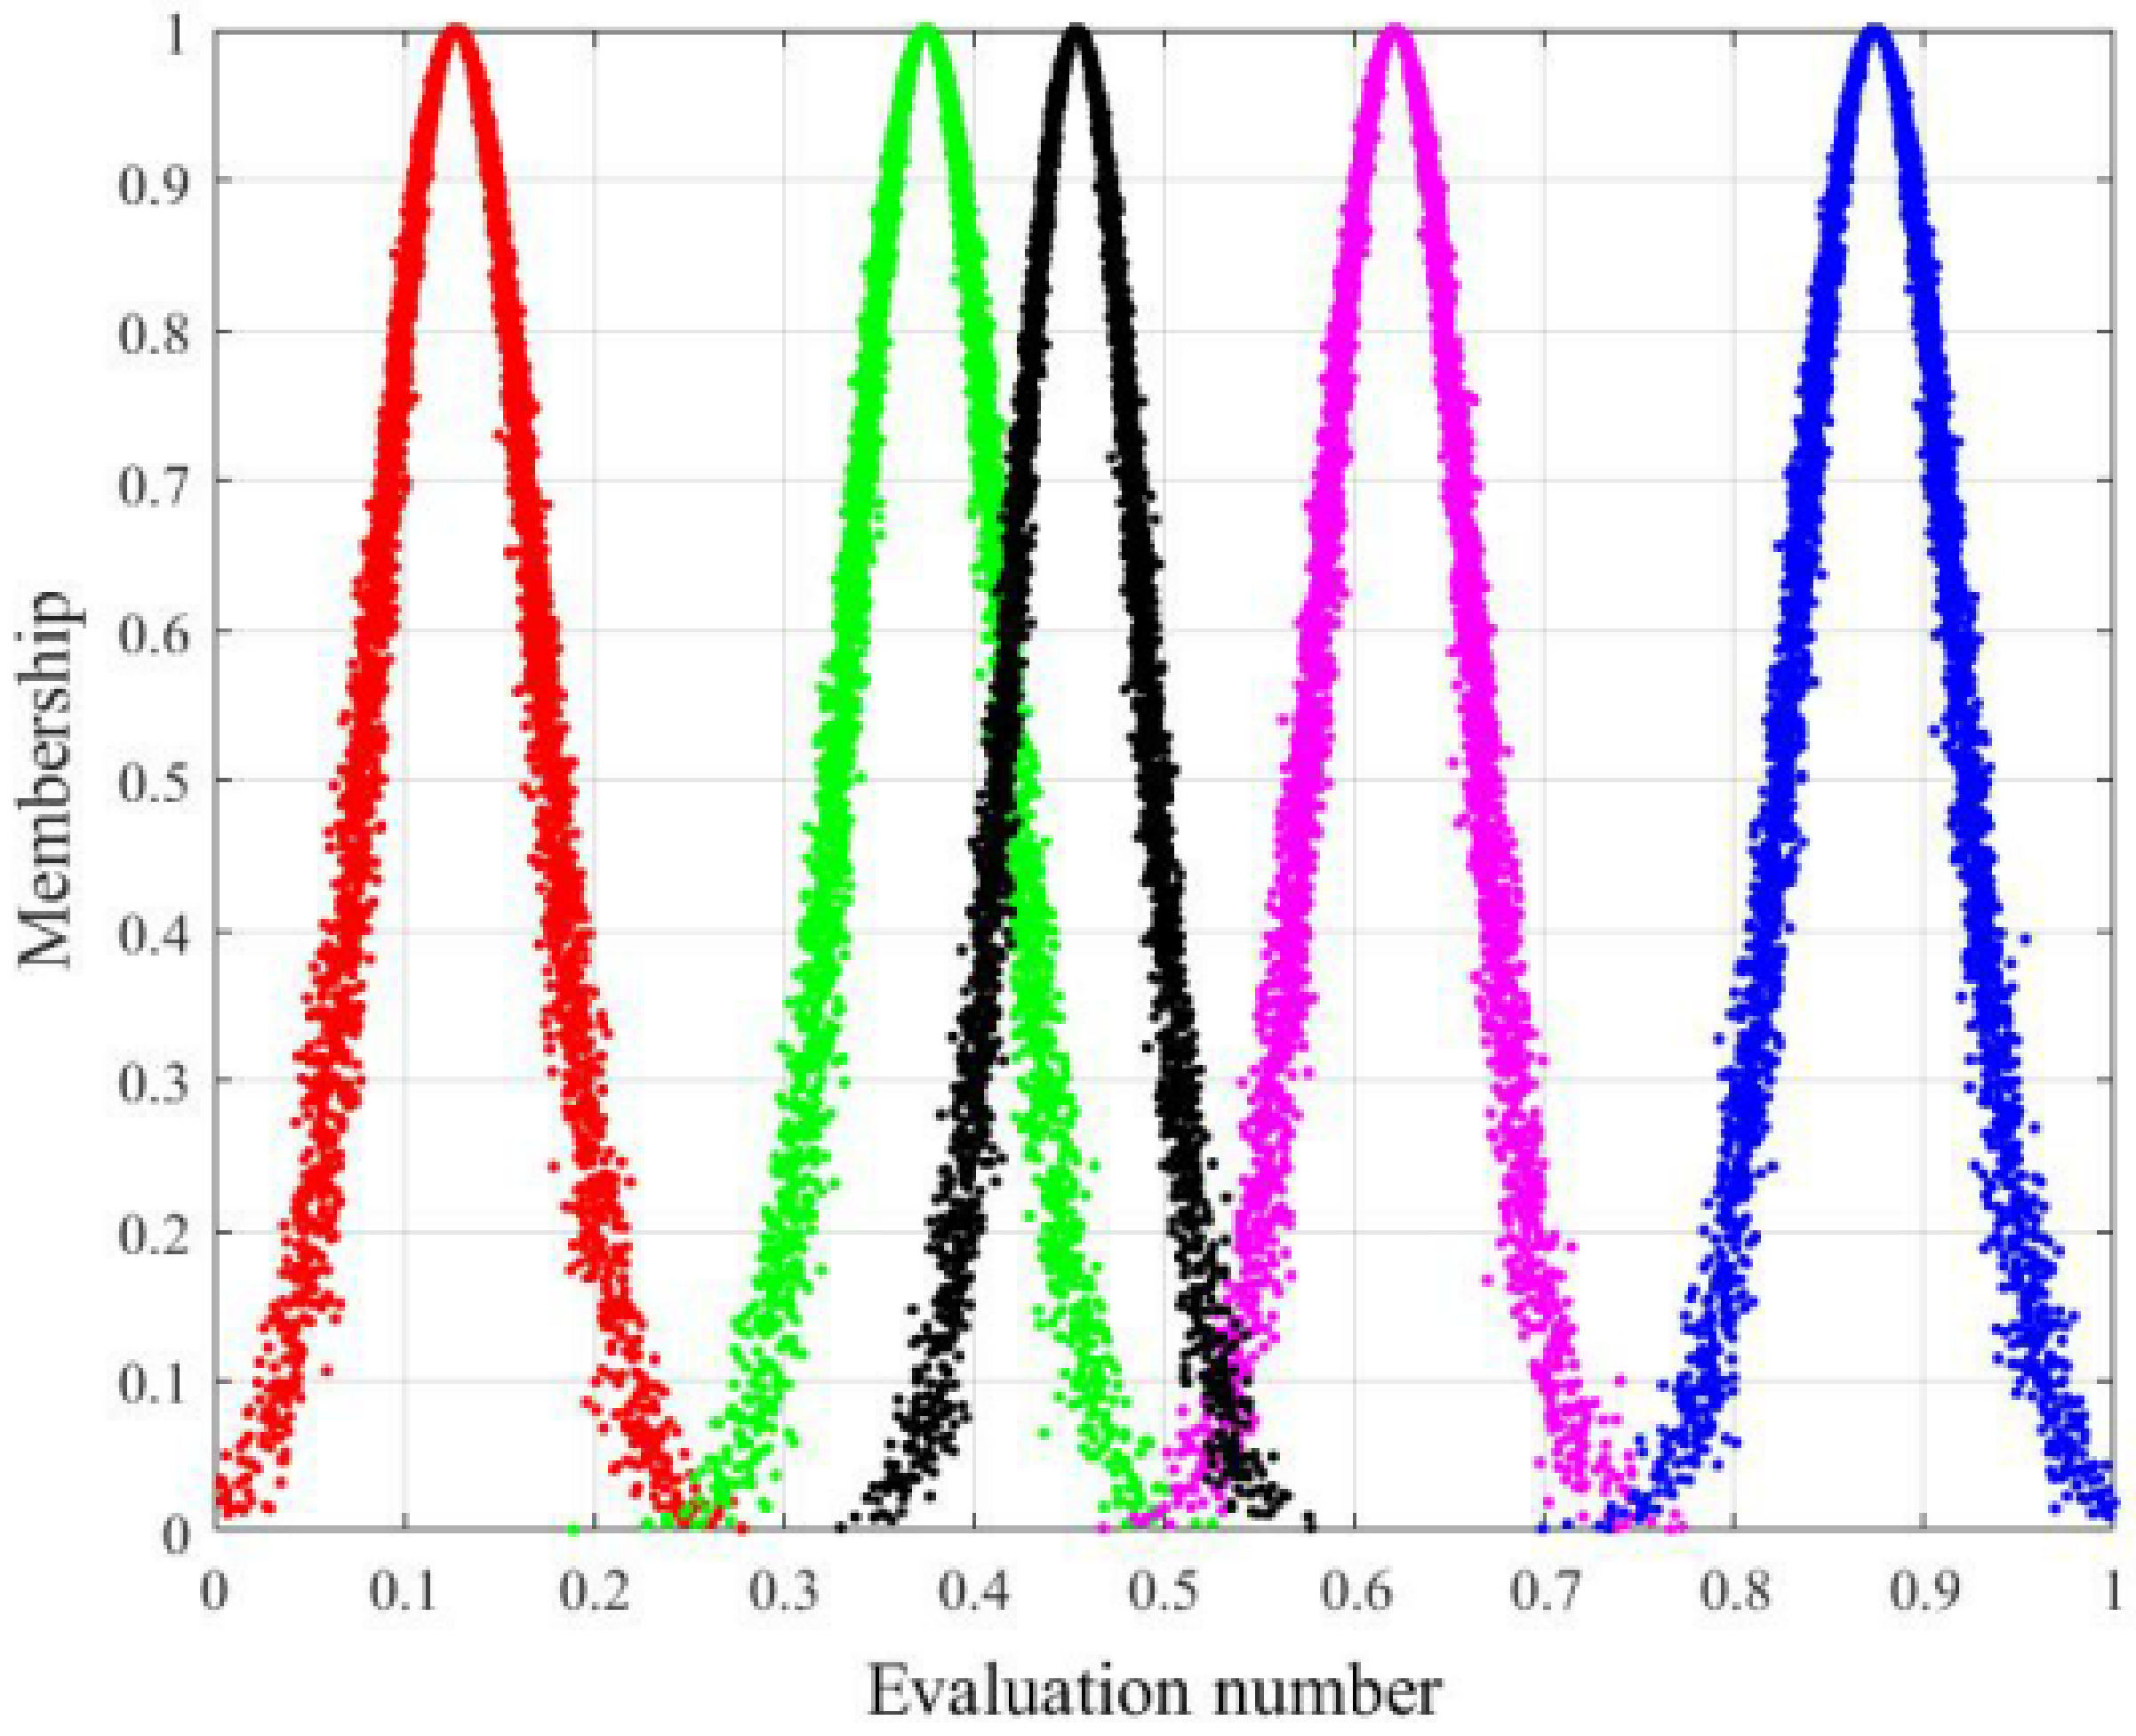
3.2.3. Cloud Map for Comprehensive Evaluation of Surface Subsidence Grades

According to the numerical characteristics of each first-level index and total index of the coal mine’s surface subsidence, 5000 cloud droplets were set on the basis of its standard cloud model to generate a comprehensive evaluation cloud map of the surface subsidence level, as shown in Figure 7 and Figure 8.
These figures show that the cloud droplets are mainly concentrated in the second level, and only a few of them are in the third level. Each first-level index and the total index with the four levels were then calculated, as shown in Table 9. From Table 9, we can conclude that the surface subsidence of the coal mine is at level 2 under the comprehensive evaluation of 10 indicators, which is a relatively safe state.
Both the extension model and the cloud model show that the surface subsidence level of the coal mine is in a relatively safe state. No mining-induced landslide has taken place for ten years, and no large surface subsidence pit has developed. The surface subsidence evaluation grade of the mine obtained in this paper can accurately reflect the mine’s subsidence situation and the actual situation of the mine. Despite the relatively safe surface subsidence level of the mine, surface subsidence still needs to be monitored and managed at all times to ensure that there is no risk, and to minimize any potential risk as much as possible, thus ensuring the safety of people’s lives and property.

4. Discussion

Based on AHP theory, matter–element extension analysis method and cloud model theory, this paper establishes an evaluation system for surface subsidence grades of mines in Southwest China, and takes the Anshun Coal Mine as an example to prove the accuracy of the evaluation system. The evaluation system will continue to be applied to the evaluation of surface subsidence grading of other southwest coal mines.
The scientific novelty of the proposed study is that, due to the complex geological structure, there is little research available on the surface subsidence of mines in southwest China. This paper not only continues to weight the factors affecting the surface subsidence of the southwest mines, so that people can understand the degree of influence of each factor on surface subsidence, but it also accurately evaluates the level of the surface subsidence, so as to better protect and control the mines.
An improvement of this study includes the analysis of some additional factors not studied in this paper, and which have a lesser effect on surface subsidence, such as the water content of the coal and rock mass etc. Although these factors have little effect on surface subsidence, they should still be properly studied. We will continue to study these factors.

5. Conclusions

(1)
With the use of AHP, ten evaluation indicators were established from the perspectives of mining disturbance and geological structure. Similar to the northern plain coal mines, the main factors that affect the surface subsidence of southwest mines are: the number of coal seams, mining height and comprehensive Platt hardness of the overlying rock, as well as the surface slope, subsidence area rate, and other important factors.
(2)
An extension matter–element model was constructed, and the correlation degree was calculated according to the surface subsidence index of the southwest mines. The surface subsidence level of the mines can therefore be obtained directly. With a coal mine in Anshun used as an example, the comprehensive correlation degree of 4 levels was obtained. The comprehensive correlation degree of each level of the coal mine is −0.29836, 0.192232, −0.1093 and 0.46531, respectively. Therefore, the surface subsidence level of the coal mine is level Q2, which is a relatively safe level and is in line with actual engineering.
(3)
A cloud model for the comprehensive evaluation of the coal mine surface subsidence was established. Findings show that the similarity between the cloud map of the total index evaluation and each standard grade is 0, 0.3453, 0.7872 and 0, respectively. This result indicates that the surface subsidence of the coal mine is in a relatively safe state, which is consistent with the calculation results of the extension model, thereby showing that the two evaluation methods can verify each other to a certain extent. Moreover, both methods have certain feasibility and scientificity.

Author Contributions

L.L.: Data curation, formal analysis, investigation, software, writing—original draft; D.K. and Q.L.: Conceptualization, data curation, funding acquisition, methodology, project administration, writing—review and editing; F.C. and Y.X.: Formal analysis, methodology, validation, writing—review and editing; H.Z.: Funding acquisition, project administration, resources, supervision, validation, visualization; Y.C.: Formal analysis, investigation. All authors have read and agreed to the published version of the manuscript.

Funding

This research was funded by the National Natural Science Foundation of China Regional Fund (No. 52064005), the National Natural Science Foundation of China Regional Fund (No. 52164002), the National Natural Science Foundation of China Regional Fund (No. 52164005), Guizhou Province Graduate Research Fund (YJSKYJJ (2021) 044), Guizhou University Laboratory Open Project(SYSKF2022-066), Guizhou University Laboratory Open Project(SYSKF2022-067), Guizhou University Laboratory Open Project(SYSKF2022-009). The authors would also like to thank the editors and anonymous reviewers for their valuable time and suggestions.

Institutional Review Board Statement

Not applicable.

Informed Consent Statement

Not applicable.

Data Availability Statement

All data used during the study appear in the submitted article.

Conflicts of Interest

The authors declare no conflict of interest.

References

  1. Cui, X.M.; Zhao, Y.L.; Wang, G.R.; Zhang, B.; Li, C.Y. Calculation of Residual Surface Subsidence Above Abandoned Longwall Coal Mining. Sustainability 2020, 12, 1528. [Google Scholar] [CrossRef] [Green Version]
  2. Han, H.L.; Hu, N.L.; Cui, B. Dynamic Modeling of Surface Subsidence Induced by Underground Mining. Adv. Mater. Res. 2012, 382, 323–327. [Google Scholar] [CrossRef]
  3. Yu, X.J. Coal mining and environmental development in southwest China. Environ. Dev. 2017, 21, 77–86. [Google Scholar] [CrossRef]
  4. Yang, M.G.H.; Hu, Z.Q.; Li, Y.J.; Li, X.J. Analysis of Reclamation for Coal Mining Subsidence Land in Chongqing. AASRI-AIT 2011 2011, 3, 291–294. [Google Scholar]
  5. Wang, S.Y.; Zhang, G.; Chen, Z.W.; Cui, H.; Zheng, Y.Z.; Xu, Z.X.; Li, Q.H. Surface deformation extraction from small baseline subset synthetic aperture radar interferometry (SBAS-InSAR) using coherence-optimized baseline combinations. GISci. Remote Sens. 2022, 59, 295–309. [Google Scholar] [CrossRef]
  6. Guo, Y.Q.; Zhao, Y.L.; Yan, H.Y. Disturbed boundaries extraction in coal-grain overlap areas with high groundwater levels using UAV-based visible and multispectral imagery. Environ. Sci. Pollut. Res. 2022. [Google Scholar] [CrossRef] [PubMed]
  7. Kong, D.Z.; Li, Q.; Wu, G.Y.; Song, G.F. Characteristics and control technology of face-end roof leaks subjected to repeated mining in close-distance coal seams. Bull. Eng. Geol. Environ. 2021, 80, 8363–8383. [Google Scholar] [CrossRef]
  8. Li, Q.; Wu, G.Y.; Kong, D.Z.; Han, S.; Ma, Z.Q. Study on Mechanism of End Face Roof Leaks Based on Stope Roof Structure Movement under Repeated Mining. Eng. Fail. Anal. 2022, 135, 106162. [Google Scholar] [CrossRef]
  9. Xiong, Y.; Kong, D.Z.; Cheng, Z.B.; Wu, G.Y.; Zhang, Q. The Comprehensive Identification of Roof Risk in a Fully Mechanized Working Face Using the Cloud Model. Mathematics 2021, 9, 2072. [Google Scholar] [CrossRef]
  10. Kong, D.Z.; Xiong, Y.; Cheng, Z.B. Stability analysis of coal face based on coal face-support-roof system in steeply inclined coal seam. Geomech. Eng. 2021, 25, 233–243. [Google Scholar] [CrossRef]
  11. Li, L.; Wu, G.Y.; Liu, Q.Z. Study on Overburden Movement and Fissure Evolution Law of Protective Layer Mining in Shallow Coal Seam. Energies 2022, 15, 1831. [Google Scholar] [CrossRef]
  12. Pathak, P.; Ghosh, P.; Banerjee, S.; Chatterjee, R.S.; Muzakkira, N.; Sikdar, P.K.; Ghosal, U.; Liang, M.C.; Meeran, K. Relic surface water (clay-pore water) input triggers arsenic release into the shallow groundwater of Bengal aquifers. J. Earth Syst. Sci. 2022, 131, 80. [Google Scholar] [CrossRef]
  13. Jirankova, E.; Waclawik, P.; Nemcik, J. Assessment of models to predict surface subsidence in the czech part of the upper silesian coal basin-case study. Acta Geodyn. Geomater. 2020, 17, 469–484. [Google Scholar] [CrossRef]
  14. Yan, W.T.; Chen, J.J.; Yan, Y.G. A new model for predicting surface mining subsidence: The improved lognormal function model. Geosci. J. 2019, 23, 165–174. [Google Scholar] [CrossRef]
  15. Han, H.K.; Xu, J.L.; Wang, X.Z.; Xie, J.L.; Xing, Y.T. Surface Subsidence Prediction Method for Coal Mines with Ultrathick and Hard Stratum. Adv. Civ. Eng. 2019, 2019, 3714381. [Google Scholar] [CrossRef]
  16. Vyazmensky, A.; Elmo, D.; Stead, D. Role of Rock Mass Fabric and Faulting in the Development of Block Caving Induced Surface Subsidence. Rock Mech. Rock Eng. 2010, 43, 533–556. [Google Scholar] [CrossRef]
  17. Bazaluk, O.; Rysbekov, K.; Nurpeisova, M.; Lozynskyi, V.; Kyrgizbayeva, G.; Turumbetov, T. Integrated monitoring for the rock mass state during large-scale subsoil development. Front. Environ. Sci. 2022, 10, 852591. [Google Scholar] [CrossRef]
  18. Petlovanyi, M.; Malashkevych, D.; Sai, K.; Zubko, S. Research into balance of rocks and underground cavities formation in the coal mine flowsheet when mining thin seams. Min. Miner. Depos. 2020, 14, 66–81. [Google Scholar] [CrossRef]
  19. Vynnykov, Y.; Kharchenko, M.; Dmytrenko, V.; Manhura, A. Probabilistic calculation in terms of deformations of the formations consisting of compacted overburden of Quarternary rocks. Min. Miner. Depos. 2020, 14, 122–129. [Google Scholar] [CrossRef]
  20. Field, E.H. Overview of the Working Group for the Development of Regional Earthquake Likelihood Models (RELM). Seismol. Res. Lett. 2007, 78, 7–16. [Google Scholar] [CrossRef]
  21. Fleurisson, J.-A. Slope Design and Implementation in Open Pit Mines: Geological and Geomechanical Approach. Procedia Eng. 2012, 46, 27–38. [Google Scholar] [CrossRef]
  22. Gerasymenko, O.; Shumlyanska, L.; Nadezhka, L.; Pivovarov, S.; Ganiev, O.; Ostapchuk, N.; Shipko, N. Neural Network Modeling in the Problem of Localization Earthquake of Ukraine. Geofiz. Zhurnal 2020, 42, 86–98. [Google Scholar] [CrossRef]
  23. Golik, V.I.; Komashchenko, V.I.; Morkun, V.S.; Morkun, N.V.; Hryshchenko, S.M. Energy Saving in Mining Production. Sci. Innov. 2018, 14, 29–39. [Google Scholar] [CrossRef]
  24. Haiko, H.; Saik, P.; Lozynskyi, V. The Philosophy of Mining: Historical Aspect and Future Prospect. Philos. Cosmol. 2019, 22, 76–90. [Google Scholar] [CrossRef]
  25. Kong, D.Z.; Pu, S.J.; Cheng, Z.H.; Wu, G.Y.; Liu, Y. Coordinated Deformation Mechanism of the Top Coal and Filling Body of Gob-Side Entry Retaining in a Fully Mechanized Caving Face. Int. J. Geomech. 2021, 21, 04021030. [Google Scholar] [CrossRef]
  26. Diaz, H.; Teixeira, A.P.; Soares, C.G. Application of Monte Carlo and Fuzzy Analytic Hierarchy Processes for ranking floating wind farm locations. Ocean Eng. 2022, 245, 110453. [Google Scholar] [CrossRef]
  27. Fedrizzi, M.; Krejci, J. A Note on the Paper “Fuzzy Analytic Hierarchy Process: Fallacy of the Popular Methods”. Int. J. Uncertain. Fuzziness Knowl.-Based Syst. 2015, 23, 965–970. [Google Scholar] [CrossRef]
  28. Wang, F.; Lu, Y.; Li, J.; Ni, J. Evaluating Environmentally Sustainable Development Based on the PSR Framework and Variable Weigh Analytic Hierarchy Process. Int. J. Environ. Res. Public Health 2021, 18, 2836. [Google Scholar] [CrossRef]
  29. Hadi-Vencheh, A.; Niazi-Motlagh, M. An improved voting analytic hierarchy process-data envelopment analysis methodology for suppliers selection. Int. J. Comput. Integr. Manuf. 2011, 24, 189–197. [Google Scholar] [CrossRef]
  30. Fan, Y.; Fang, Z.G.; Liu, S.F.; Liu, J. A grey approach to site selection for nursing homes: An extension of the fuzzy analytic hierarchy process. J. Intell. Fuzzy Syst. 2021, 40, 8807–8818. [Google Scholar] [CrossRef]
  31. Yuen, K.K.F. The primitive cognitive network process: Comparisons with the analytic hierarchy process. Int. J. Inf. Technol. Decis. Mak. 2011, 10, 659–680. [Google Scholar] [CrossRef]
  32. Naghashzargar, E.; Ghiasi, M.; Semnani, D. Using analytical hierarchy process to optimize mechanical properties of multi-twisted buckled silk yarn as a collagenous tissue scaffold. J. Text. Inst. 2022, 113, 460–466. [Google Scholar] [CrossRef]
  33. Sherin, S.; Rehman, Z.; Hussain, S.; Mohammad, N.; Raza, S. Hazards identification and risk analysis in surface mines of Pakistan using fault tree analysis technique. Min. Miner. Depos. 2021, 15, 119–126. [Google Scholar] [CrossRef]
  34. Cox, M.A.A. Which is the appropriate triangular distribution to employ in the modified analytic hierarchy process? IMA J. Manag. Math. 2012, 23, 227–239. [Google Scholar] [CrossRef]
  35. Li, S.Q.; Li, R.R. Energy Sustainability Evaluation Model Based on the Matter-Element Extension Method: A Case Study of Shandong Province, China. Sustainability 2017, 9, 2128. [Google Scholar] [CrossRef] [Green Version]
  36. Jin, J.; Qian, H.; Chen, Y.F.; Xi, W.J. Assessment of Groundwater Quality Based on Matter Element Extension Model. J. Chem. 2013, 2013, 715647. [Google Scholar] [CrossRef]
  37. Liu, J.C.; Lu, Y.Y. Research on the evaluation of China’s photovoltaic policy driving ability under the background of carbon neutrality. Energy 2022, 250, 123809. [Google Scholar] [CrossRef]
  38. Li, X.J.; Zhang, Z.; Jim, C.Y.; Lai, J.Y.; Chen, X.Q. Owner-based benefit evaluation of BIM applications in China’s engineering projects. Eng. Constr. Archit. Manag. 2022. [Google Scholar] [CrossRef]
  39. Yang, S.; Xu, Z.T.; Su, K.J. Variable Weight Matter-Element Extension Model for the Stability Classification of Slope Rock Mass. Mathematics 2021, 9, 2807. [Google Scholar] [CrossRef]
  40. Zhang, K.; Yu, X.D.; Liu, S.L.; Dong, X.; Li, D.Q.; Zang, H.Z.; Xu, R. Wind power interval prediction based on hybrid semi-cloud model and nonparametric kernel density estimation. Energy Rep. 2022, 8, 1068–1078. [Google Scholar] [CrossRef]
  41. Xu, Q.W.; Xu, K.L. Evaluation of ambient air quality based on synthetic cloud model. Fresenius Environ. Bull. 2018, 27, 141–146. [Google Scholar]
  42. Davies, H.J.; Bachtiger, P.; Williams, I.; Molyneaux, P.L.; Peters, N.S.; Mandic, D.P. Wearable In-Ear PPG: Detailed Respiratory Variations Enable Classification of COPD. IEEE Trans. Biomed. Eng. 2022, 69, 2390–2400. [Google Scholar] [CrossRef]
  43. Yang, D.J.; Bian, Z.F. Comparison of the disturbance of soil physical quality indices between different underground mining stages in semi-arid regions of Western China. Environ. Earth Sci. 2022, 81, 354. [Google Scholar] [CrossRef]
  44. Wang, E.; Xie, S.R. Determination of coal pillar width for gob-side entry driving in isolated coal face and its control in deep soft-broken coal seam: A case study. Energy Sci. Eng. 2022, 10, 2305–2316. [Google Scholar] [CrossRef]
  45. Rastegarmanesh, A.; Mirzaghorbanali, A.; McDougall, K.; Aziz, N.; Anzanpour, S.; Nourizadeh, H.; Moosavi, M. Axial Performance of Cementitious Grouted Cable Bolts Under Rotation Constraint Scenarios. Rock Mech. Rock Eng. 2022. [Google Scholar] [CrossRef]
  46. Yan, W.T.; Chen, J.J.; Yang, W.F.; Liu, X.S.; Wang, W.W.; Zhang, W.K. On-Site Measurement on Surface Disturbance Law of Repeated Mining with High Relief Terrain. Sustainability 2022, 14, 3166. [Google Scholar] [CrossRef]
  47. Liu, P.Z.; Gao, L.; Zhang, P.D.; Wu, G.Y.; Wang, C.; Ma, Z.Q.; Kong, D.Z.; Kang, X.T.; Han, S. A Case Study on Surrounding Rock Deformation Control Technology of Gob-Side Coal-Rock Roadway in Inclined Coal Seam of a Mine in Guizhou, China. Processes 2022, 10, 863. [Google Scholar] [CrossRef]
  48. Shang, Y.; Kong, D.; Pu, S.; Xiong, Y.; Li, Q.; Cheng, Z. Study on Failure Characteristics and Control Technology of Roadway Surrounding Rock under Repeated Mining in Close-Distance Coal Seam. Mathematics 2022, 10, 2166. [Google Scholar] [CrossRef]
  49. Wang, G.Y.; Xu, C.L.; Li, D.Y. Generic normal cloud model. Inf. Sci. 2014, 280, 1–15. [Google Scholar] [CrossRef]
  50. Li, Y.; Zhang, S.H.; Han, J.T.; Zhao, Y.; Han, Q.; Wu, L.Y.; Wang, X.; Qiu, Z.Y.; Zou, T.Q.; Fan, C. A study of the temporal and spatial variations in the suitability of the environment in Chinese cities for tourism and in strategies for optimizing the environment. Int. J. Digit. Earth. 2022, 15, 527–552. [Google Scholar] [CrossRef]
  51. Zhu, X.J.; Guo, G.L.; Liu, H.; Yang, X.Y. Surface subsidence prediction method of backfill-strip mining in coal mining. Bull. Eng. Geol. Environ. 2019, 78, 6235–6248. [Google Scholar] [CrossRef]
  52. Ju, J.F.; Xu, J.L. Surface stepped subsidence related to top-coal caving longwall mining of extremely thick coal seam under shallow cover. Int. J. Rock Mech. Min. Sci. 2015, 78, 27–35. [Google Scholar] [CrossRef]
Figure 1. Evaluation system for surface subsidence grades in southwest mines.
Mathematics 10 02664 g001
Figure 2. Mine surface subsidence evaluation model.
Mathematics 10 02664 g002
Figure 3. Evaluation process for surface subsidence grade cloud model.
Mathematics 10 02664 g003
Figure 4. Comprehensive standard cloud model for first-level indicators; (a) mining disturbance; (b) geological structure.
Mathematics 10 02664 g004
Figure 5. Comprehensive standard cloud model for total indicators.
Mathematics 10 02664 g005
Figure 6. Comprehensive standard cloud model for total indicators.
Mathematics 10 02664 g006
Figure 7. Cloud map of a comprehensive evaluation of first-level indicators; (a) mining disturbance; (b) geological structure.
Mathematics 10 02664 g007
Figure 8. Comprehensive evaluation cloud map of total indicators.
Mathematics 10 02664 g008
Table 1. Classification of evaluation indexes of mine surface subsidence.
Influencing FactorsEvaluation Level
Level 4 (Q4)Level 3 (Q3)Level 2 (Q2)Level 1 (Q1)
Mining DisturbanceMining depth (m)>1000800–1000600–800<600
Mining height (m)>32–31–20–1
Mining width (m)250–300200–250150–200100–150
Stent resistance (KN)0–60006000–80008000–10,00010,000–12,000
Mining coal seams (layer)4321
Working face advancing speed85–10065–8540–65<40
Geological structureSurface slope (°)>4530–4515–300–15
Comprehensive Platts Hardness (KN)0–33–66~9>9
Fault density (strip × km−2)>42.5–41–2.50–1
Subsidence area rate (%)>7030–7010–300–10
Table 2. Random consistency index RI.
Matrix Order123456
RI000.580.91.121.24
Table 3. Judgement matrix eigenvectors, index weights and consistency test.
Judgement MatrixJudgement Matrix Maximum EigenvalueEigenvectorVector of Index
Weight
CIRIConsistency Check
MA2(0.6, 0.4)0.6, 0.400pass
MB16.2518(0.2360, 0.1293, 0.0894, 0.1199, 0.3340, 0.0914)0.2360, 0.1293, 0.0894, 0.1199, 0.3340, 0.09140.0500.040pass
MB24.2193(0.2252, 0.2894, 0.2694, 0.2161)0.2252, 0.2894, 0.2694, 0.21610.0730.081pass
Table 4. Weights of elements in the scheme layer to decision goals.
C i C 1 C 2 C 3 C 4 C 5 C 6 C 7 C 8 C 9 C 10
ω A ( C i ) 0.07760.14160.05360.07190.20040.05480.09010.11570.10780.0864
Table 5. Comprehensive standard cloud digital characteristics of each indicator.
Evaluation IndicatorsEvaluation Index Level
Q1Q2Q3Q4
B1(0.1468, 0.0490, 0.004)(0.4139, 0.0400, 0.004)(0.6514, 0.0391, 0.004)(0.8844, 0.0386, 0.004)
B2(0.0980, 0.0327, 0.004)(0.3157, 0.0399, 0.004)(0.5765, 0.0471, 0.004)(0.8589, 0.0471, 0.004)
Overall indicator(0.1273, 0.0425, 0.004)(0.3746, 0.0400, 0.004)(0.6214, 0.0401, 0.004)(0.8742, 0.0420, 0.004)
Table 6. Correlation function value of each index to the evaluation level of mine surface subsidence.
Level r j ( ν 1 ) r j ( ν 2 ) r j ( ν 3 ) r j ( ν 4 ) r j ( ν 5 ) r j ( ν 6 ) r j ( ν 7 ) r j ( ν 8 ) r j ( ν 9 ) r j ( ν 10 )
Q1−0.300−0.143−0.333−0.500−0.250−0.500−0.256−0.445−0.187−0.333
Q20.1000.2000−0.2500.500−0.1430.3330.333−0.2780.500
Q3−0.005−0.40000.500−0.2500.500−0.167−0.2500.067−0.333
Q4−0.525−0.600−0.333−0.250−0.500−0.333−0.444−0.286−0.469−0.714
Table 7. Comprehensive correlation degree of mine surface subsidence to evaluation grade.
Comprehensive Correlation DegreeQ1Q2Q3Q4
r j ( Q x ) −0.298360.192232−0.1093−0.46531
Table 8. Digital characteristics of second-level indexes.
IndexExEnHe
C10.46880.01040.0010
C20.30000.02500.0025
C30.40000.06670.0067
C40.73750.00970.0009
C50.50000.08330.0083
C60.67500.01170.0012
C70.42500.01940.0019
C80.45830.04170.0042
C90.40000.01670.0017
C100.21000.01330.0013
B10.50230.04170.0042
B20.38140.02380.0024
Table 9. Similarity between Each Index and the Evaluation Level.
Comprehensive Evaluation IndexEvaluation Level
Q1Q2Q3Q4
B100.75760.45790
B200.65190.14010
overall indicator00.66580.3480
Publisher’s Note: MDPI stays neutral with regard to jurisdictional claims in published maps and institutional affiliations.

