Article

Enhanced Teaching Learning-Based Algorithm for Fuel Costs and Losses Minimization in AC-DC Systems

1
Faculty of Computing and Information Technology, King Abdulaziz University, Jeddah 21589, Saudi Arabia
2
Faculty of Computers and Information Sciences, Mansoura University, Mansoura 35516, Egypt
3
Electrical Engineering Department, Faculty of Engineering, Suez University, Suez 41522, Egypt
4
Electrical Engineering Department, Faculty of Engineering, Kafrelsheikh University, Kafrelsheikh 33516, Egypt
5
Department of Computer Science, College of Science and Humanities in Al-Sulail, Prince Sattam Bin Abdulaziz University, Kharj 16278, Saudi Arabia
6
Machine Learning and Information Retrieval Department, Artificial Intelligence, Kafrelsheikh University, Kafrelsheikh 33516, Egypt
*
Author to whom correspondence should be addressed.
Mathematics 2022, 10(13), 2337; https://doi.org/10.3390/math10132337
Submission received: 22 April 2022 / Revised: 16 June 2022 / Accepted: 18 June 2022 / Published: 4 July 2022
(This article belongs to the Topic Multi-Energy Systems)

Abstract

:
The Teaching Learning-Based Algorithm (TLBA) is a powerful and effective optimization approach. TLBA mimics the teaching-learning process in a classroom, where TLBA’s iterative computing process is separated into two phases, unlike standard evolutionary algorithms and swarm intelligence algorithms, and each phase conducts an iterative learning operation. Advanced technologies of Voltage Source Converters (VSCs) enable greater active and reactive power regulation in these networks. Various objectives are addressed for optimal energy management, with the goal of attaining economic and technical advantages by decreasing overall production fuel costs and transmission power losses in AC-DC transmission networks. In this paper, the TLBA is applied for various sorts of nonlinear and multimodal functioning of hybrid alternating current (AC) and multi-terminal direct current (DC) power grids. The proposed TLBA is evaluated on modified IEEE 30-bus and IEEE 57-bus AC-DC networks and compared to other published methods in the literature. Numerical results demonstrate that the proposed TLBA has great effectiveness and robustness indices over the others. Economically, the reduction percentages of 13.84 and 21.94% are achieved for the IEEE 30-bus and IEEE 57-bus test systems when the fuel costs are minimized. Technically, significant improvement in the transmission power losses with reduction 28.01% and 69.83%, are found for the IEEE 30-bus and IEEE 57-bus test system compared to the initial case. Nevertheless, TLBA has faster convergence, higher quality for the final optimal solution, and more power for escaping from convergence to local optima compared to other published methods in the literature.

1. Introduction

To satisfy the ever-increasing household and industrial loads, the development of electric power networks has become a must-do operation. As power systems expand, power losses grow, resulting in a waste of huge amounts of money annually. Furthermore, the proper functioning of electrical networks takes into account a variety of factors such as fuel cost reduction, environmental pollution, network losses, security, quality, and stability [1]. As a consequence, for the effective supply of electricity, the operational condition is separate to the main objective functions such as reducing power losses, seeking to avoid voltage irregularities, and growing system security while complying to numerous equality and inequality restrictions.
Optimal power flow and economic dispatch (ED) seem to be crucial minimization aspects in power systems that necessitate efficient generator interoperability, strategic planning, and scheduling [2]. In [3], a slime mould technique driven by customizable weight vector to control the series among positive and negative propagation waves was utilized for the minimized ED problem. In [4], a bi-stage self-adaptive differential evolution (DE) approach of k-nearest neighbours relying computation system has been designed to address numerous metaheuristic issues, and it was suggested that the ED problem be addressed in the upcoming years. A Manta ray forage optimizer with non-dominated sorting approach was developed in [5] to solve the multi-objective load flow encompassing solar, wind and small-hydro energy production. In [6], a social network searching algorithm was used to schedule the power network outputs with non-dominated electrical losses and fuel costs. A multi-verse algorithm for minimizing the dynamic ED management issue in electricity frameworks utilizing valve point effects was presented in [7].
In most countries, high voltage alternating current (HVAC) technology is used in conjunction with electric power components and the incorporation of significant alternative electricity sources [8]. However, shortcomings caused by excessive system losses, expenditures, and reactive power compensation requirements as the length of transmission circuits rises drawing HVAC technologies inappropriate for linking bulk systems or faraway renewable energy production companies [9]. Based on voltage source converters (VSCs), the transmission technology of HV direct current (HVDC) has arisen as an appealing option. It has outstanding features to control the voltage in the AC system by appropriate management of the reactive power injection and absorption. Regardless of the DC transferring power, the VSC scheme can govern respectively real and reactive power throughout its station at the same time [10,11]. An AC-DC load flow procedure was introduced for managing the VSCs-HVDC in power systems by de-coupling the AC network from the DC power network together with the VSC transformer stations; however, its relevance was demonstrated using simple frameworks of 5 and 14-bus test systems [12]. In [13], a sequential algorithm to perform a load flow assessment in hybridized AC-DC networks incorporating all their operational types in the steady-state model. In [14], a sequential method relying on Gauss-Seidel and modified Gauss techniques was used to handle the operation in an AC-DC system, with DC sides controlled by injecting current into the linking stations. Nevertheless, their implementation was executed on a small IEEE 9-bus system because the utilized AC-DC formulations have been solved independently [14]. A quasi-AC alternative centred on relaxing the semi-definite coding framework was also addressed [15]; however, the test data have only been conducted on a basic IEEE 30-bus network. Additionally, in Ref. [16], a sequential method to solve the AC-DC system equations separately for each repeat, employing the interface variables projected from the AC load flow until the solution convergence was achieved. Even though it is simple to construct, it may confront convergence issues under certain instances. Owing to the significance of environmental and economic power operations in HVAC systems hybridized with HVDC systems, an OPF optimization model has been developed [17].
VSCs system developments can be extensively simulated, keeping in view their converter station, transformer, phase reactor, and filter parts [18]. Power losses in the parts of VSCs system were typically represented by a quadratic relationship of the converter current [18,19,20]. In [21], a hybrid AC-DC distribution system was presented considering the integration of distributed generators with AC and DC soft open. However, the presented methodology in [21] has been dedicated for minimizing the system power losses as a single target. In [22], an analysis based on the invested costs and the gained benefit for HVDC and AC options for integrating the offshore wind turbines or bulk power has been handled. Notwithstanding, the investigation of HVDC frameworks was limited to a two-terminal configuration. Otherwise, integrating a linked DC system within an established AC system complicates the coordinated control consideration of these structures [23]. However, despite this, the DC load flow calculations in [24] were overlooked, as were specific AC-DC system characteristics in [25,26] were neglected. Also, A second-order cone programme solver has also been applied for hybrid power networks to investigate VSC-DC mechanisms in an optimisation problem [27]. There is also a primal-dual interior point method merged with upgraded Jacobian and Hessian matrices [28]. The impact of tap changer situations and VAr variation in the AC configuration was ignored in these reviews, and some applied methodologies were dependent on the initial estimate in certain cases, based on finite assumptions that restricted the required precision.
Despite advances in artificial intelligence-based metaheuristic solvers, including crow search optimizer [29] and manta ray forage technique [30], little attention has been paid to solving the OPF challenging problem in hybrid AC systems. In [31], genetic metaheuristic method has been performed to optimise the OPF for minimizing the power losses in hybrid AC-DC power systems. Ref. [32] used the DE algorithm to solve the OPF issue in hybridized AC-DC systems as a minimization goal. In addition, techniques focusing on material equilibrium state [33] and marine predators’ simulation [34] were established to address multi-objective OPF modelling in AC-DC systems.
The teaching–learning–based Algorithm (TLBA) is a population-based intelligent algorithm that mimics the teaching–learning process in a classroom [35]. TLBA’s iterative computing process is separated into two phases, unlike standard evolutionary algorithms and swarm intelligence algorithms, and each phase conducts an iterative learning operation. Since its debut by Rao and colleagues, TLBA has garnered the attention of an increasing number of academics because to several of its merits, including its simple idea, lack of algorithm-specific parameters, quick convergence, and ease of implementation while being effective [36,37]. The TLBA has fairly recently been used effectively to solve numerous engineering design issues such as parameter identification of Photovoltaic (PV) panels [38,39], operation assessment of integrated PV and batteries with power system [40], harmonic elimination inside inverters [41], robots manipulator calibration [42], condition prediction in water supply pipes [43], welding processes [44], optimal design of electrical filters [45], expansion planning of power generation in electrical networks [46], tsallis-entropy-based feature selection [47], service restoration problem in delivery networks [48] and reactive power management in power grids [49]. The TLBA’s strengths and effective implementations in a broad range of engineering design problems are the prime motivations for its utilization in this study. TLBA is used to various sorts of nonlinear and multimodal functioning of hybrid alternating current (AC) and multi-terminal direct current (DC) power grids. The proposed TLBA is evaluated on modified IEEE 30-bus AC-DC networks and compared to other published methods in the literature.
This paper’s main contribution could be explained simply:
Various objective targets for optimized energy management in AC-DC transmission systems are handled, by achieving technical and economic benefits.
TLBA is developed with the capability to handle the operational optimization OPF problem by reducing the power losses and the total power generation costs in AC-DC transmission networks with successful application on two IEEE systems comprising 30 and 57 buses
For IEEE 30 and 57 bus systems, very high success rates are demonstrated accompanying to the proposed TLBA
Moreover, when compared to other reported techniques in the literature, TLBA possesses higher convergence rate, greater quality for the ultimate best solution, and more strength for attempting to escape from convergence to optimum.

2. Problem Formulation

In high voltage AC-DC systems, the main operation target is technical and economical by determining the optimal decision variables for attaining a variety of defined aims in AC-DC networks that are subject to different equality and inequity constraints.

2.1. Problem Objectives

Primarily, the total fuel costs (TFCs), in $/h, are the sum of the fuel costs of each generator. Therefore, TFCs minimization objective function is the first one (M1) that can be mathematically modelled in (1) [50,51]:
M 1 = i = 1 N g c c i + b b i P G i + a a i P G i 2
where PGi indicates the real output power in MW of generator i, and aai, bbi, and cci are the related cost coefficients.
On the other side, the TFCs may be formulated considering numerous ripples due to the loading impacts of the valve point. Therefore, it could be mathematically modelled as additional rectified terms in sinusoids forms to the cost model in (1) [52] as follows:
M 1 = i = 1 N g c c i + b b i P G i + a a i P Gi 2 + | e e i ( sin f f i ( P G i min P G i ) ) |
where, eei and ffi refer to the additional cost coefficients of the valve point loadings [53]:
Secondly, the entire transmission losses (ETLs) (M2) is handled with three parts in such systems, as described in (3), including the losses in AC system (LossAC) that described in (4), the losses in DC system (LossDC) that described in (5), and the losses in VSC stations (LossVSC) that are described in (6) [54]:
M 2 = L o s s A C + L o s s D C + L o s s V S C
L o s s A C = i = 1 N b j = 1 N b G i j ( 2 ( V i V j c o s   θ i j + V i 2 + V j 2 ) )
L o s s D C = i , j N b D C R i j I i j 2
L o s s V S C = i = 1 N V A i I c i 2 + B i I c i + C i
where Gij is to the conductance of the line connected between buses i and j: Nb indicate the buses number; V and θ are the voltage and phase angle; Rij refers to the resistance of the DC link between buses i and j: NbDC indicates the DC buses number; Iij indicates the DC Ampere flow over the link between buses i and j; A, B and C are the factors of the losses due to each VSC (i).

2.2. Control and Dependent Variables in AC-DC Network

The control variables in AC-DC systems are changed to involve the following variables that corresponding to the DC side. So, the implementation is extended to sense the variables added to the AC variables in the main grid. Also, current and voltage sensors are needed at different lines and buses to check several operational constraints.
Firstly, related to the AC network, the control variables are:
(a)
(Vg1: VgNg) Voltages at generators
(b)
(Pg1: PgNg) Real output power of each generator
(c)
(Tap1: TapNt) tap setting of transformers
(d)
(Qc1: QcNq) Reactive output power of VAr devices
where, Ng, Nt, and Nq refer to, accordingly the generators number, the number of on-load tap transformers, and the number of VAr devices [55].
Secondly, related to the VSC type, the control variables are [56]:
(a)
(Vdc-Qc) Constant voltage and reactive power, respectively, at DC and AC buses.
(b)
(Vdc-Vc) Constant voltages at DC and AC buses.
(c)
(Pdc-Qc) Constant real power and constant reactive power, respectively, trough the DC line and at AC bus
(d)
(Pdc-Vc) Constant active power and voltage, respectively, trough the DC line and at the AC bus
Similarly, at first, some dependent variables are related to the AC network which are
(a)
(SF1: SFNf) Apparent flow over AC branches
(b)
(VL1: VLNPQ) Voltages at load buses
(c)
(Qg1: QgNg) Reactive powers of each generator
where, Nf, and NPQ are, respectively the number of the branches, and the number of load buses.
Secondly, related to the VSC type, dependent variables are
(a)
Real Power flow over DC links.
(b)
Voltages at DC buses

2.3. Equality Constraints

There are two forms of equality restrictions which are belonging to the balanced real and reactive powers flow in the AC system as defined in Equations (7) and (8), the balanced power flow in the DC system as defined in Equation (9).
P L i + P G i V i j = 1 N b V j ( B i j s i n   θ i j + G i j c o s   θ i j ) = 0 ,   i = 1 ,   N b
Q L i + Q G i V i j = 1 N b V j ( B i j c o s θ i j + G i j s i n θ i j ) = 0 ,   i = 1 ,     N b
S k j = [ V s k ] [ I k j ] * = [ V s k ] [ V s k V c j [ R j k ] + j [ X j k ] ] * = [ P k j ] + j [ Q k j ] ,   k = 1 : N A ,   j = 1 : N V  
where PL and PG are the real powers of loads and generators; Bij is the line susceptance connected between buses i and j; QL and QG are the reactive powers of load and generators; Skj is the injected MVA from AC system to the VSCs; Rdc refers to the DC resistance of the link; P and Q are, correspondingly, the injected powers of active and reactive type. Vcj indicates the VSC voltage; Rjk + jXjk is the equivalent impedance of the VSC accessories; Vsk is the voltage at the AC connected bus. NV and NA are, accordingly, the VSCs number and the AC buses whereas Ikj symbolizes the injected current.

2.4. Inequality Constraints

Also, the operating limitations I the AC-DC system should be maintained within the permissible bounds which can be mathematically described as follows:
P g G max P g G P g G min , G = 1   :   N g
Q g G max Q g G Q g G min , G = 1   :   N g
V g G max V g G V g G min , G = 1   :   N g
Q c q max Q c q Q c q min , q = 1   :   N q
T a p T max T a p T T a p T min , T = 1   :   N t
| S F l i n e | S F l i n e max ,   line = 1   :   N f
V L k max V L k V L k min , k = 1   :   N P Q
P s j max P s j P s j min , j = 1   :   N V
Q s j max Q s j Q s j min , j = 1   :   N V
V c j max V c j V c j min , j = 1   :   N V
V d c , j max V d c , j V d c , j min , j = 1   :   N b D C
d j max 2 ( P s j P o ) 2 ( Q s j Q o ) 2 d j min 2 ,   j = 1   :   N V
where, (Po, Qo) indicated the circle’s centre connected to the VSC’s PQ-capacity and d is its diameter. The superscripts “min” and “max” denote the linked variable’s lowest and highest bounds.

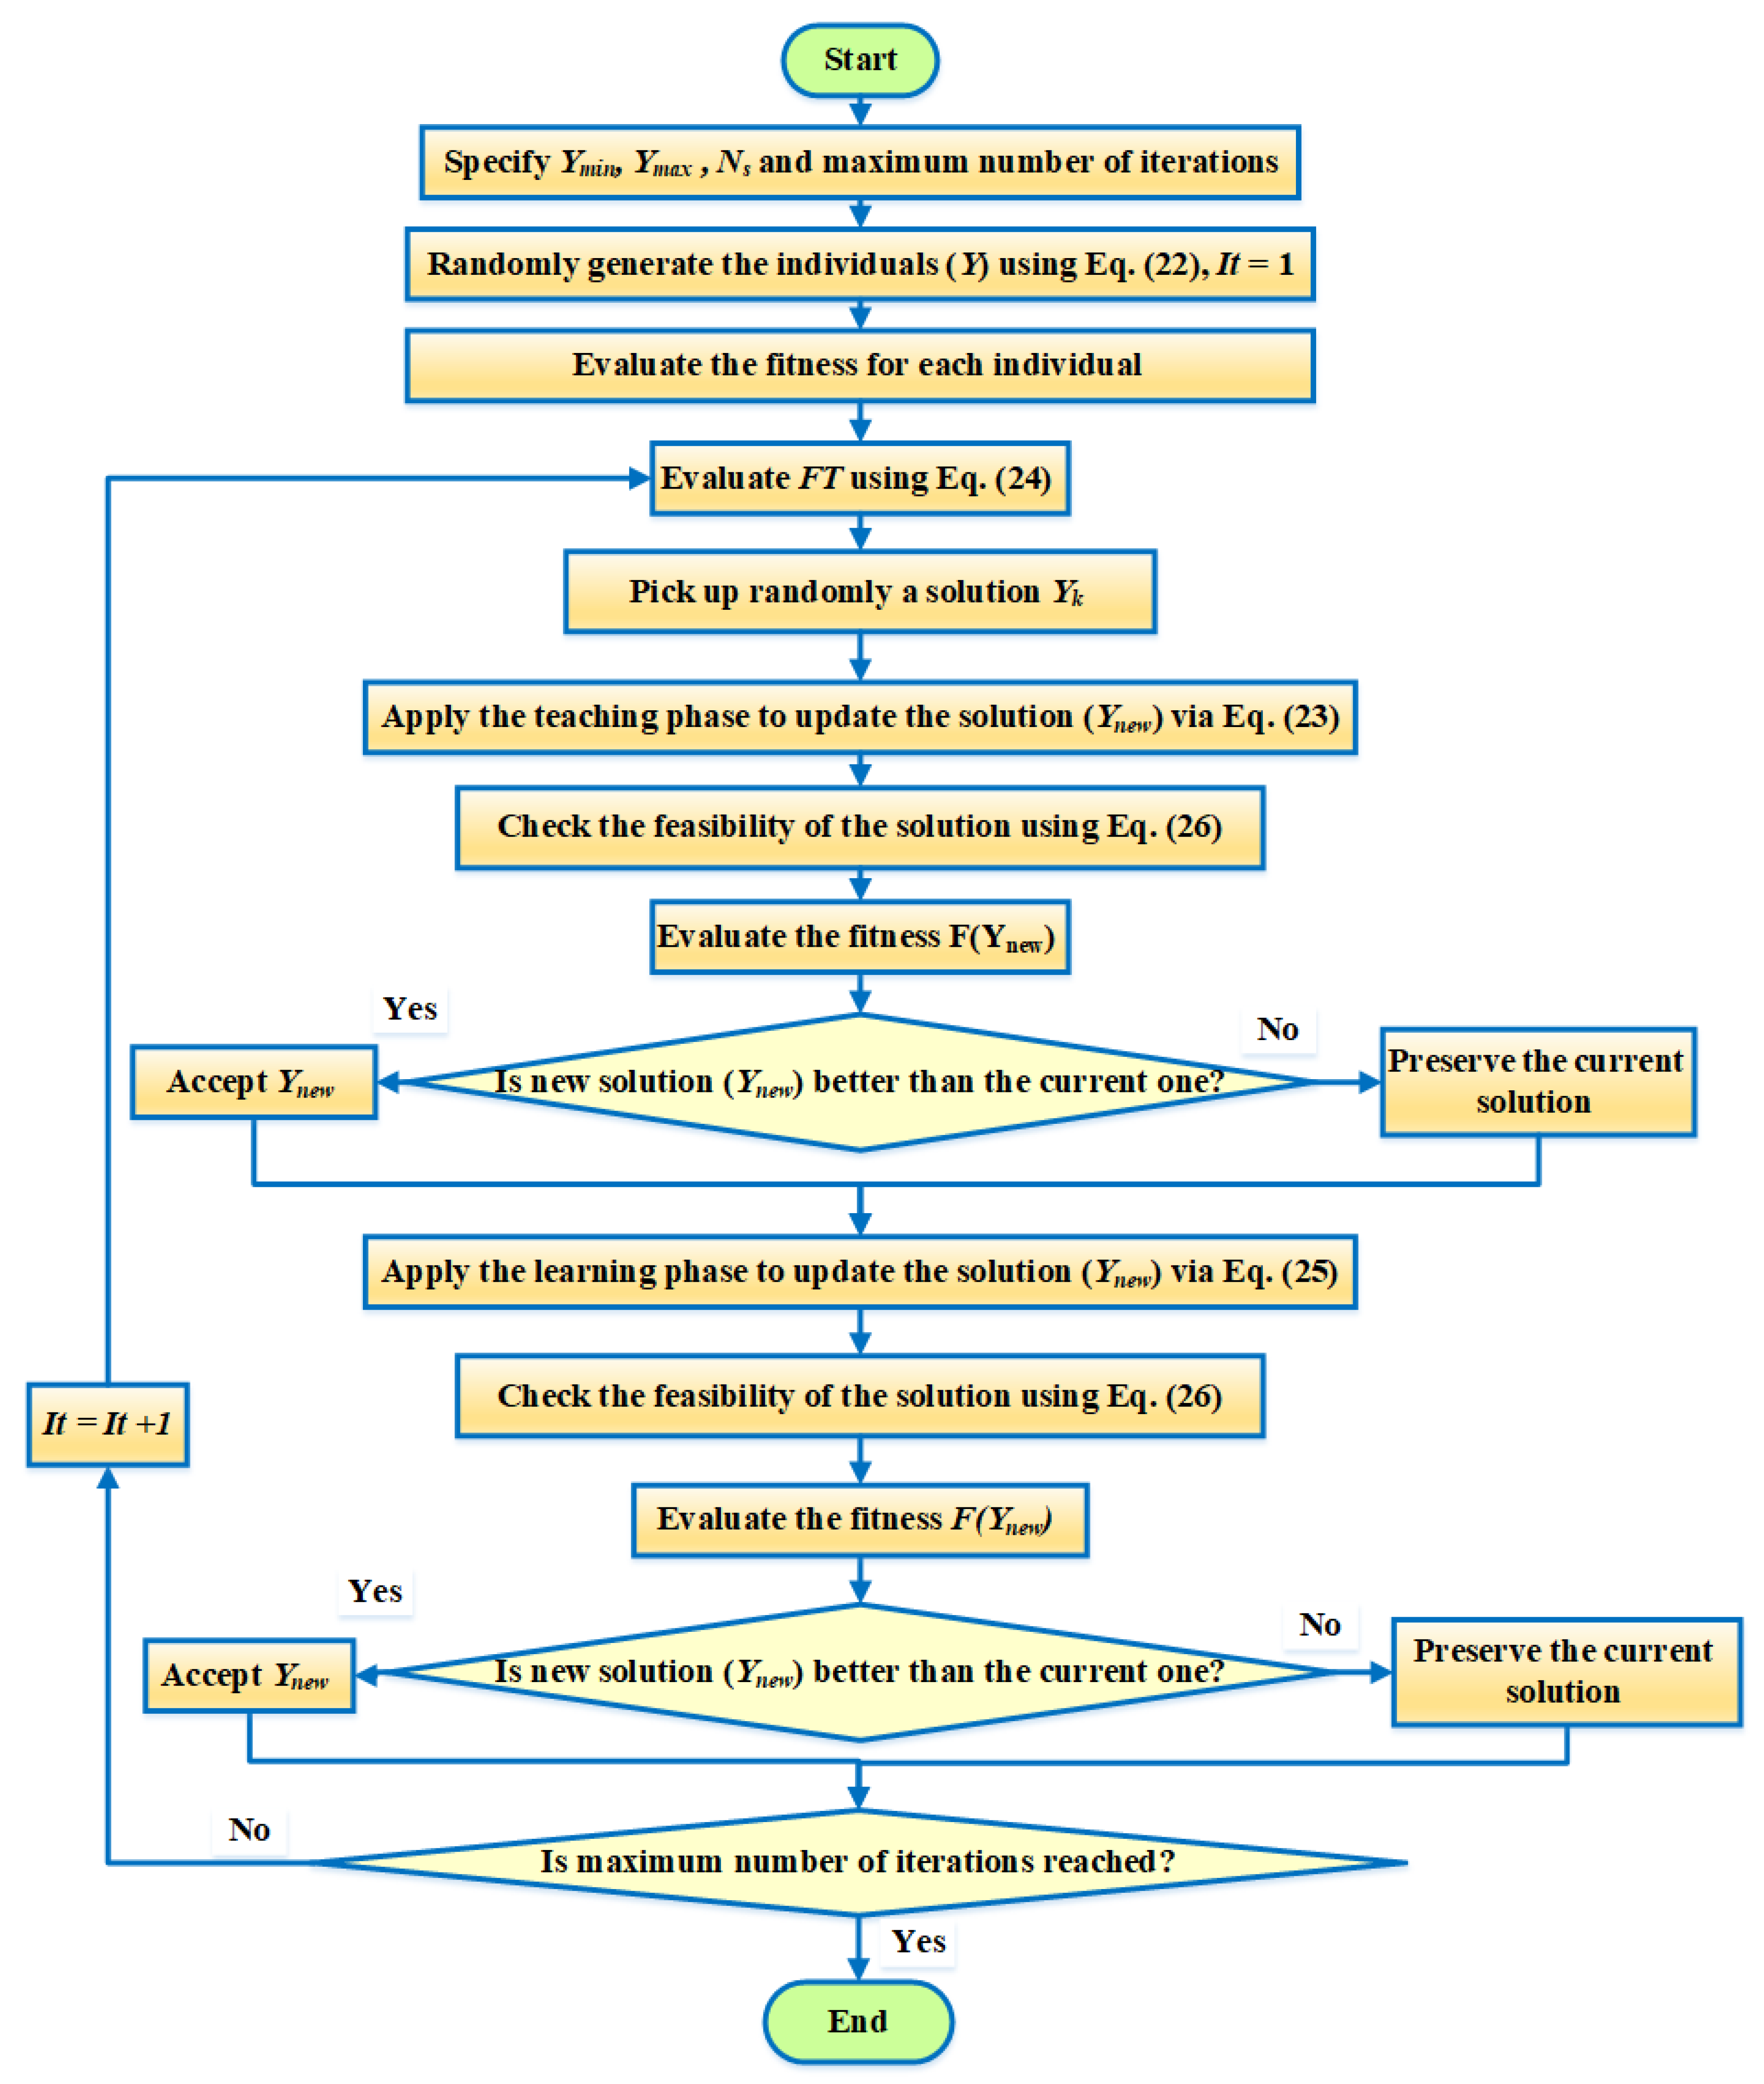
3. Proposed TLBA for OPF Problem in AC-DC Grids

3.1. TLBA Concept

TLBA seems to be a population adaptive technique that simulates the teaching–learning procedure in a classroom [35]. Unlike basic evolutionary algorithms and swarm intelligent computational methods, the iterative computing method of TLBA is divided into two stages, with each stage performing an adaptive learning procedure. First and foremost,
Y j = Y min + r a n d ( 0 , 1 ) . [ Y max Y min ]           j = 1 , 2   ,   .   .   .   .   .   .   .   N s
where, Ymax and Ymin represent the maximum and minimum bounds due to the decision variables and Ns is the students’ number in a population.
The fundamental TLBA has been split into two stages: teaching and learning.
Initially, during the teaching stage of development, the teacher is regarded as the person with the deepest expertise, understanding, and skillset (the best student with minimum objective). In this stage, the teacher (Yt) continues to strive to increase the classroom mean (Ym). As a result, the jth student new knowledge (Ynew) following the teaching stage of development is as follows:
Y n e w = Y j + r a n d ( 0 , 1 ) . [ Y t ( F T . Y m ) ]           j = 1 , 2   ,   .   .   .   .   .   .   .   N s
where ,   F T = r o u n d [ 1 + r a n d ( 0 , 1 ) ]
where, Yj is the jth student in the classroom and round is an integer approximated value which is randomly generated; FT indicates the factor of learning variation.
Conversely, through peer engagement, students gain experience and skill across the learning stage. Consequently, the jth student (Yj) continues to strive to improve his/her investigative information and knowledge in the classroom by learning from another randomly selected person involved (Yk), where k and j are different.
Y n e w = { Y j + r a n d ( 0 , 1 ) . [ Y j Y k ]           i f   F ( Y j ) F ( Y k ) Y j + r a n d ( 0 , 1 ) . [ Y k Y j ]           i f   F ( Y j ) > F ( Y k )
where, F(Yk) and F(Yj) are, respectively the objective values related to the students k and j.
As illustrated, based on Yj and Yk, two outcomes are possible: if Yj is preferable than Yk, Yk is shifted towards Yj. Alternatively, it is pushed away from Yj.
A pseudocode of the TLBA is described in Algorithm 1.
Algorithm 1. A pseudocode of the TLBA.
Input: Number of students (Ns), lower limits (Ymin) and upper limits (Ymax), Maximum number of iterations
Output: Minimum fitness solution
1: procedure TLBA
2: Set It = 1
3: Initialize the population of students (Yj), Yj = Ymin + rand*( YmaxYmin)
4: Evaluate the fitness functions of each student j as (F(Yj))
5: while (It < Maximum number of iterations) do
6: Evaluate the learning changing factor (FT), FT=round[1+rand(0,1)]
7: Select the instructor with the best solution obtained in all population (Yt)
8: Extract the classroom mean (Ym)
9: Apply the teaching phase to update the position of the member (Ynew) based on Eq. (23)
10: Evaluate the fitness functions as (F(Ynew))
11: Compare the new and current members and accept the one with better fitness value.
12: Randomly select a member (Yk)
13: Apply the learning phase to update the position of the member (Ynew) based on Eq. (25)
14: Evaluate the fitness functions as (F(Ynew))
15: Compare the new and current members and accept the one with better fitness value.
16: End while
17: Find the best solution with the minimum fitness
18: End procedure

3.2. Proposed TLBA for OPF Problem in AC-DC Grids

This sub-section illustrates the developed teaching-learning studying-based algorithm for OPF Problem in AC-DC grids. For handling the OPF problem in AC-DC grids, the proposed TLBA is enhanced. The new solutions of infeasible dimensions must always be treated appropriately in order to determine whether one student is superior to the other. Therefore, each new solution is checked for each dimension as follows:
Y n e w , d = { Y max , d Y min , d Y n e w , d i f   Y n e w , d > Y max , d i f   Y n e w , d < Y min , d E l s e
Also, the balancing equations in AC-DC grids, which express the equality restrictions, are assured fundamentally for dealing with the discussed problem using the consecutive Load flow approach [57]. The Newtonian algorithm typically finds a solution if the load flow in the AC-DC grid is met.
Additionally, the operating boundaries of the independent variables are begun fulfilling their boundaries, and if any of them are breached through the iterations, they are set at the nearest limits, as illustrated in Equation (26). In the investigated objectives, the operational limitations of the dependent variables in AC-DC grid are checked as well and any violation in the regarding constraints are penalized and added to the fitness function. The proposed TLBA is dedicated for solving the OPF problem in AC-DC grids, as described in Figure 1.

4. Simulation Results

The proposed TLBA is applied in MATLAB and included in this section to solve the economic technical OPF issue in AC systems using modified IEEE 30 and 57 bus schemes. The population of students is 50 and 100 for the two examined networks, while the number of iterations is 300. The suggested TLBA is repeated 15 times and compared to some of the many other methods published in the literature.

4.1. Results of the IEEE 30-Bus Network

The initial IEEE 30-bus test system consists of 6 generators, 30 buses, 41 transmission branches, 4 on-load tap transformer, and 9 VAr sources. Its buses and branch data are derived from [58]. The cost parameters are derived from [59]. The modified system consists of two DC grid systems. The generators voltage has highest and lowest ranges of, respectively, 1.1 and 0.95 per-unit (pu). For the tap changing transformer, the permissible range is [0.9–1.1] pu. The highest and lowest voltage values for the load buses are assumed to be, respectively, 1.05 and 0.95 p.u. VSC 1 in the first DC system is under Vdc-Qc controlling, whereas VSCs 2 and 3 are under Pdc-Vc controlling. VSC 4 is in Vdc-Qc operating setting in the second DC system, whereas VSCs 5 and 6 are under Pdc-Vc controlling. The highest and lowest voltage values for the VSC stations and DC buses are 1.1 and 0.9 pu, correspondingly, and the conversion power for the VSC stations is 100 MVA. Two instances are analyzed where the goal of minimizing the TFCs is considered first, and the minimization of the ETLs is taken into account second.

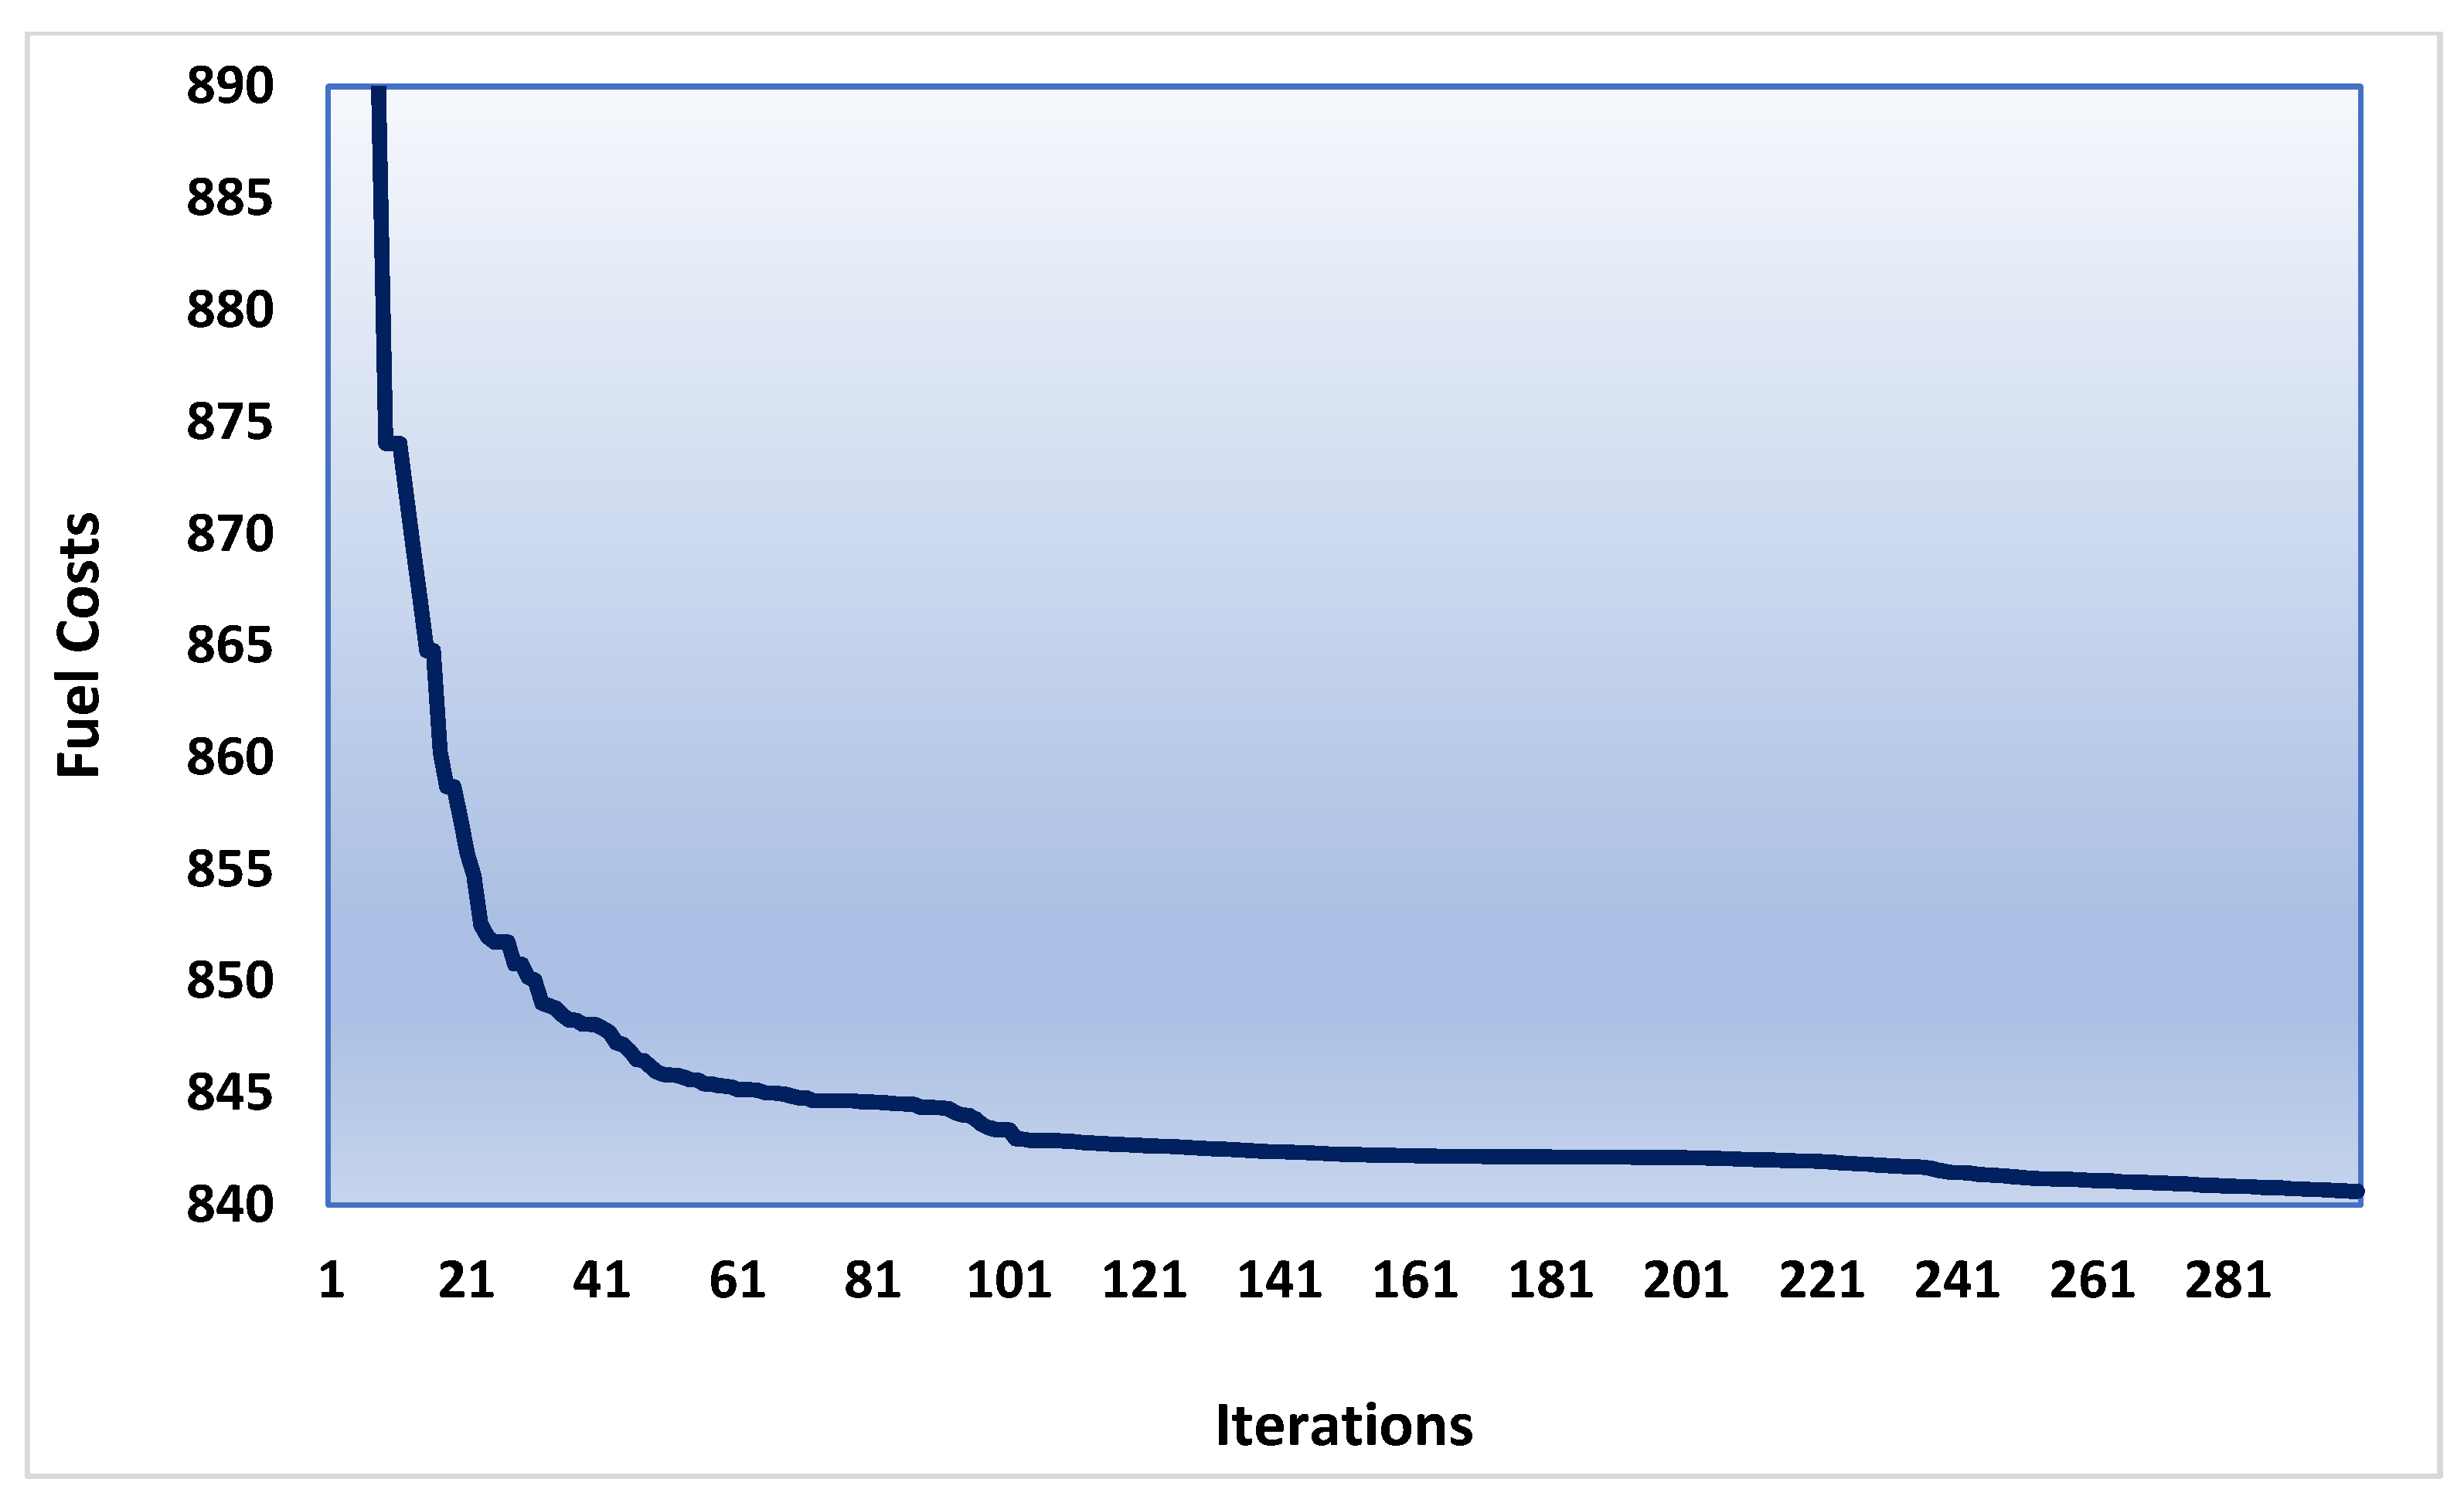
4.1.1. Minimization of the TFCs of the IEEE 30-Bus Network

In the first instance, the TFCs minimization is considered in its quadratic form with additional sinusoid terms. The proposed TLBA is run, and the optimal results are shown in Table 1. As shown, the TLBA minimizes the TFCs value from 975.64 of 840.6166 $/h which indicates to a huge reduction percentage of 13.84%. Also, the convergence characteristics related to the proposed TLBA for this instance are shown in Figure 2.
As illustrated, the proposed TLBA has significant convergent performance in avoiding local minima since it provides successive decreasing in the obtained objective.
Otherwise, Table 2 tabulates comparative results with other reported techniques of GWO [29], CSA [29], PSO [29] and ICSA [29]. In Appendix A, Table A1 identifies the settings of the control parameters for the methods established and reported in the comparisons. Table 2 deduces the great superiority of the proposed TLBA in finding the least TFCs of 840.6166 $/h where GWO, CSA, PSO and ICSA obtains TFCs of 854.43, 848.93, 846.25 and 842.34 $/h. Then, the TLBA achieves the most economical solution compared with the competitive algorithms.
To investigate the analysis of the proposed TLBA in terms of average success rate and convergence characteristics, the minimizing of the TFCs for IEEE 30-bus system is considered. Table 3 tabulates the related absolute difference between the best and worst, its percentage and the regarded success rate. The absolute difference between the best and worst, its percentage and the success rate are computed at different percentage of the convergence including 50, 66.67, 83.33 and 100%. The proposed TLBA provides higher exploitation ability which is increased with the increasing of the convergence level. It always achieves small difference percentage, which is less than 0.5% at all the convergence levels. It always achieves high success rate which is increased with the increasing of tolerance level. At 83.33%, it provides more than 90% success rate at tolerances of 0.5 and 0.25%. Also, it provides more 86.67% and 46.67% success rates are achieved at tolerances of 0.1 and 0.05%, respectively. At 100% convergence, the proposed TLBA achieves 100% success rate at all tolerance levels. Decreasing the tolerance rates leads to decrease the success rates at different progress stages. An increased success rate is achieved for increasing the iteration number for all tolerance levels.

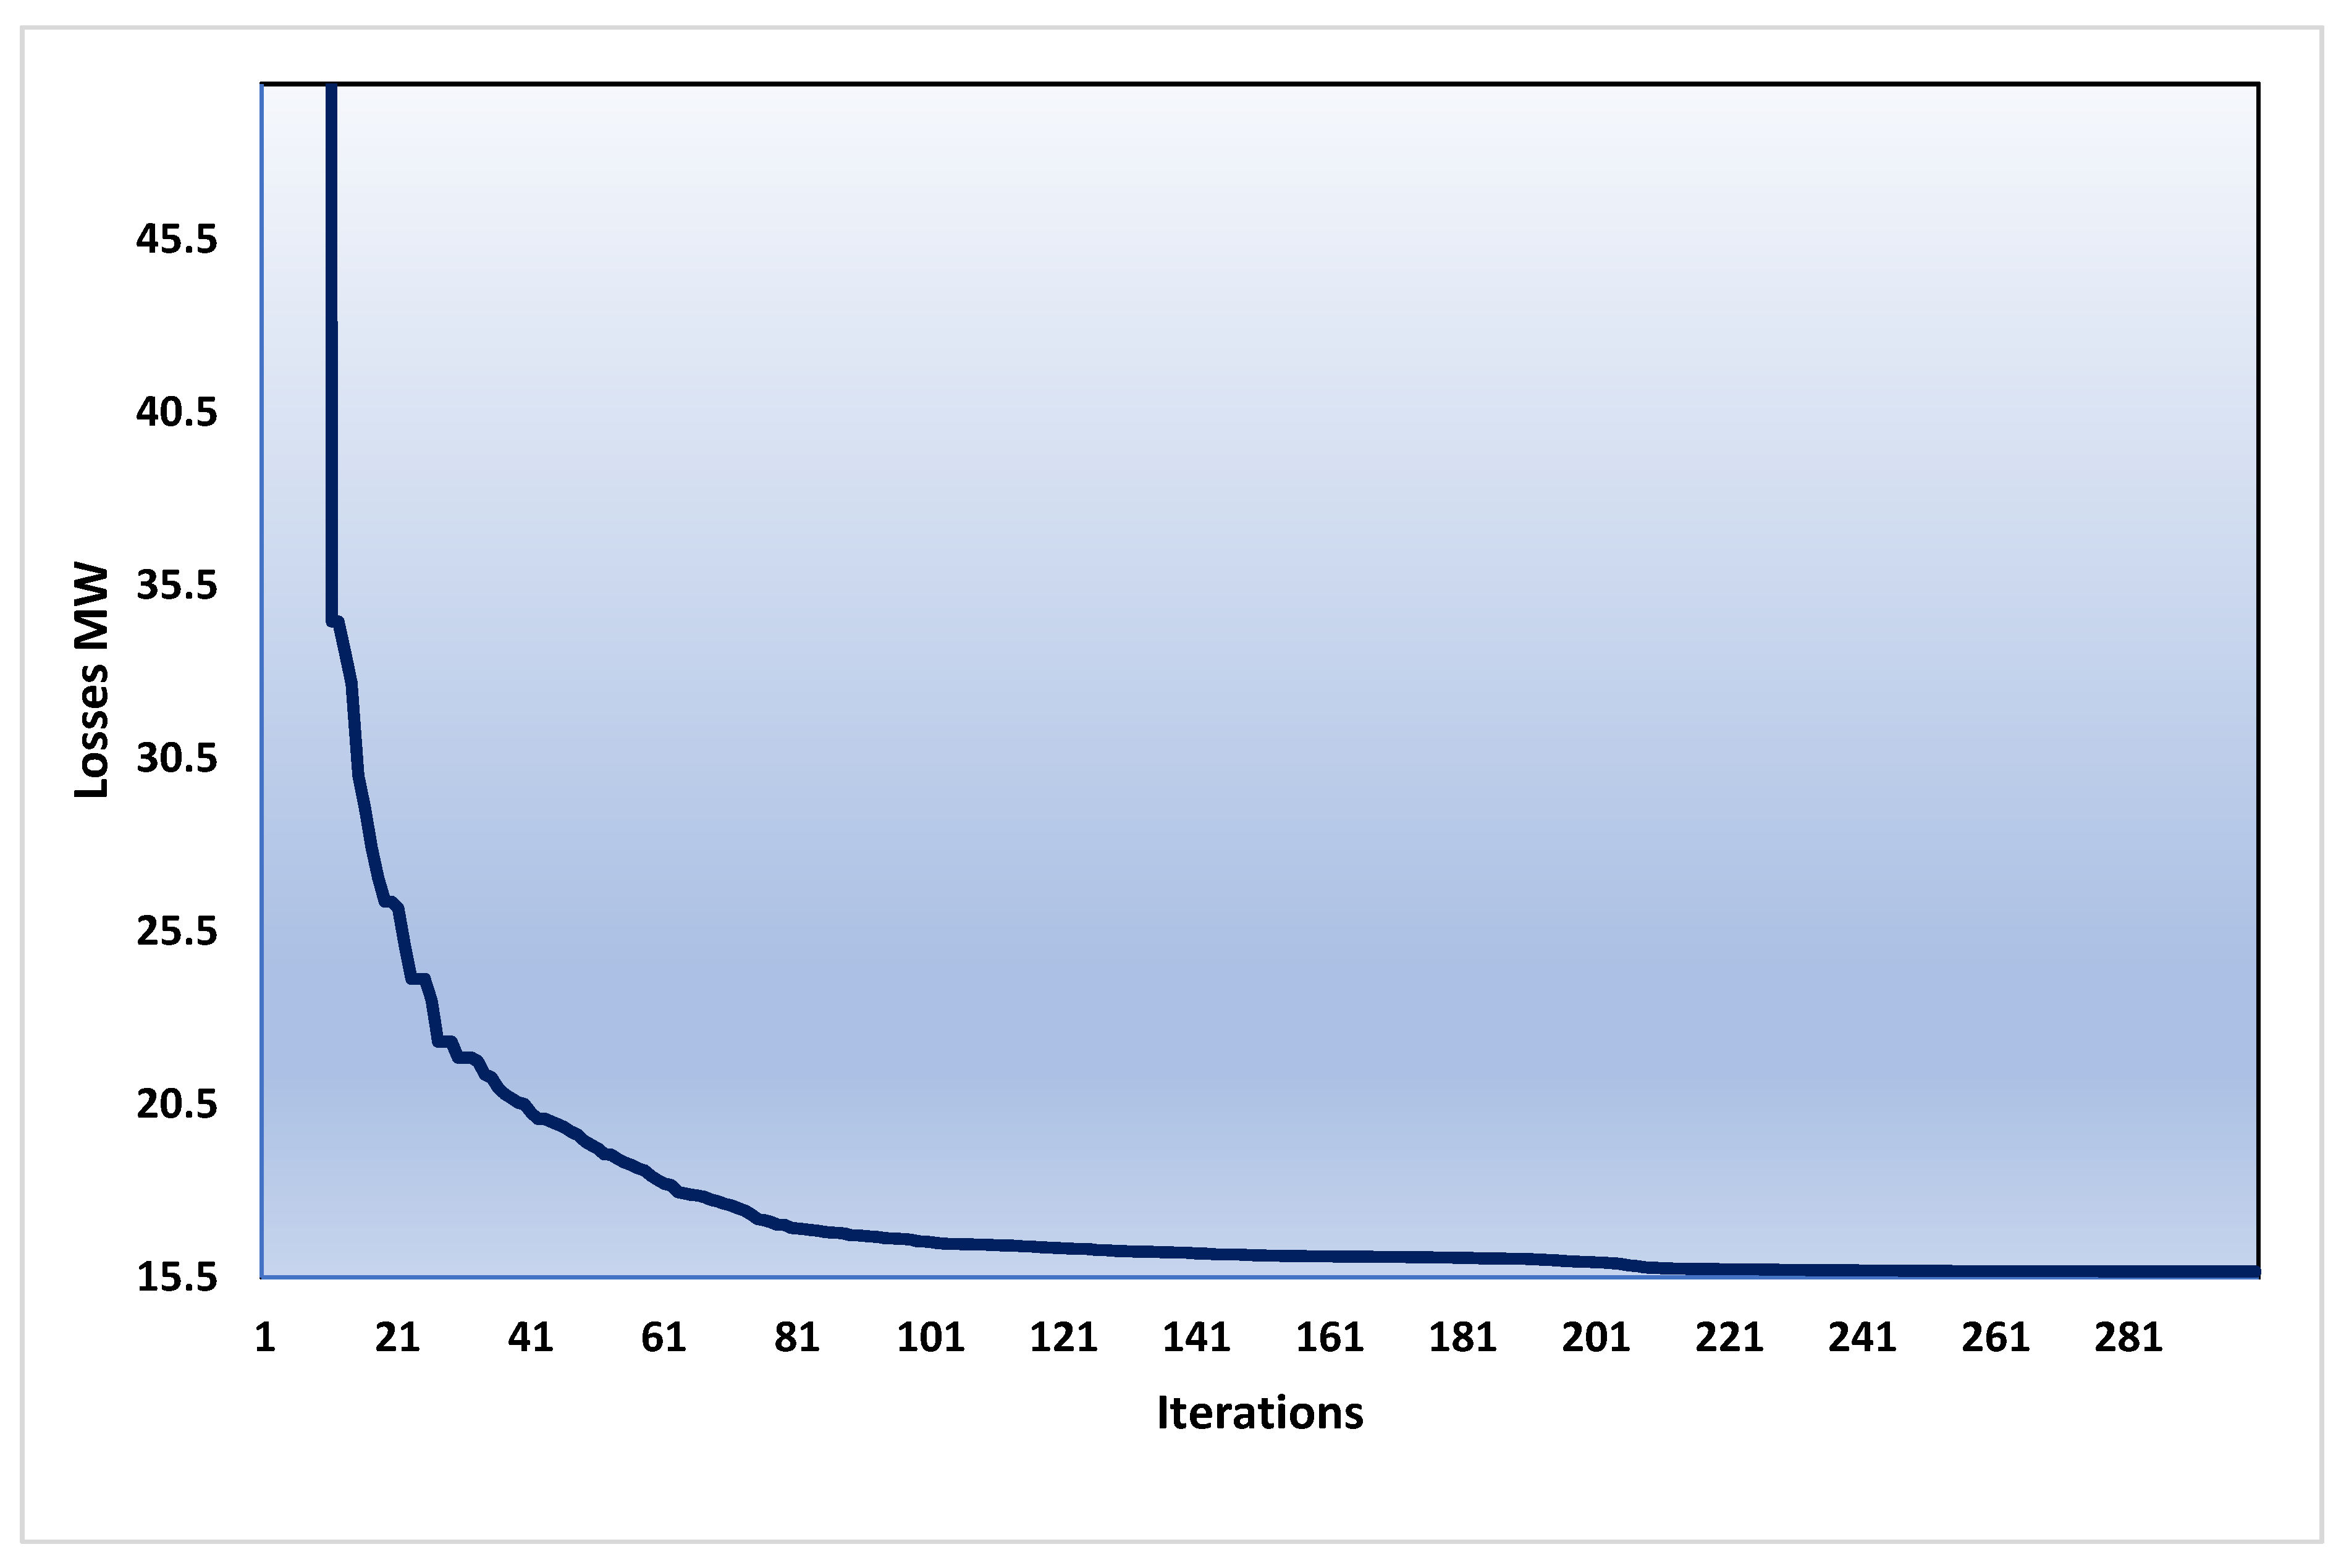
4.1.2. Minimization of the ETLs of the IEEE 30-Bus Network

In this case, the minimization of the ETLs is considered. The proposed TLBA is run, and the optimal simulation results that obtained by the proposed TLBA are reported in Table 4 compared with the initial operating condition. As shown, the proposed TLBA minimizes the ETLs values from 11.9236 MW to 8.582753 MW which indicates to a significant reduction percentage of 28.01%. Then, more technical improvement is noticed. However, the associated fuel costs are increased from 975.64 to 1044.197 $/h.
Also, the convergence characteristics related to the proposed TLBA for this instance is shown in Figure 3. As illustrated, the proposed TLBA has better convergent performance in avoiding local minima.
Also, for the minimization of the ETLs, Table 5 tabulates comparative results with various reported techniques of CSA [30], PSO [56], MVO [34], MPO [56], IMPO [34] and MRFO [30]. This table deduces the great superiority of the proposed TLBA in finding the least ETLs of 8.5827 MW where CSA, PSO, MVO, MPO, IMPO and MRFO [30] obtains ETLs of 9.57, 9.078, 9.005, 8.75, 8.66 and 8.5704 MW. The accepted level of accuracy, in terms of the technical merits, in ETLs is noted and compared with other methods in the literature.
To investigate the analysis of the proposed TLBA in terms of average success rate and convergence characteristics, Table 6 tabulates the related absolute difference between the best and worst, its percentage and the regarded success rate. Minimizing the ETLs for a IEEE 30-bus system is considered in Table 6. As shown, the proposed TLBA provides higher exploitation ability, which is increased with the increasing of the convergence level. It always achieves a small difference percentage which is less than 0.5% at all the convergence levels. It always achieves high success rate, which is increased with the increasing of tolerance level. At 83.33%, it provides more than 90% success rate at tolerances of 1, 0.75 and 0.5%. At 100% convergence, the proposed TLBA achieves 100% success rate at all tolerance levels. From the tabulated success rates, it is possible to state that:
  • Decreasing the tolerance rates leads to decrease the success rates
  • An increased success rate is achieved for increasing the iteration number

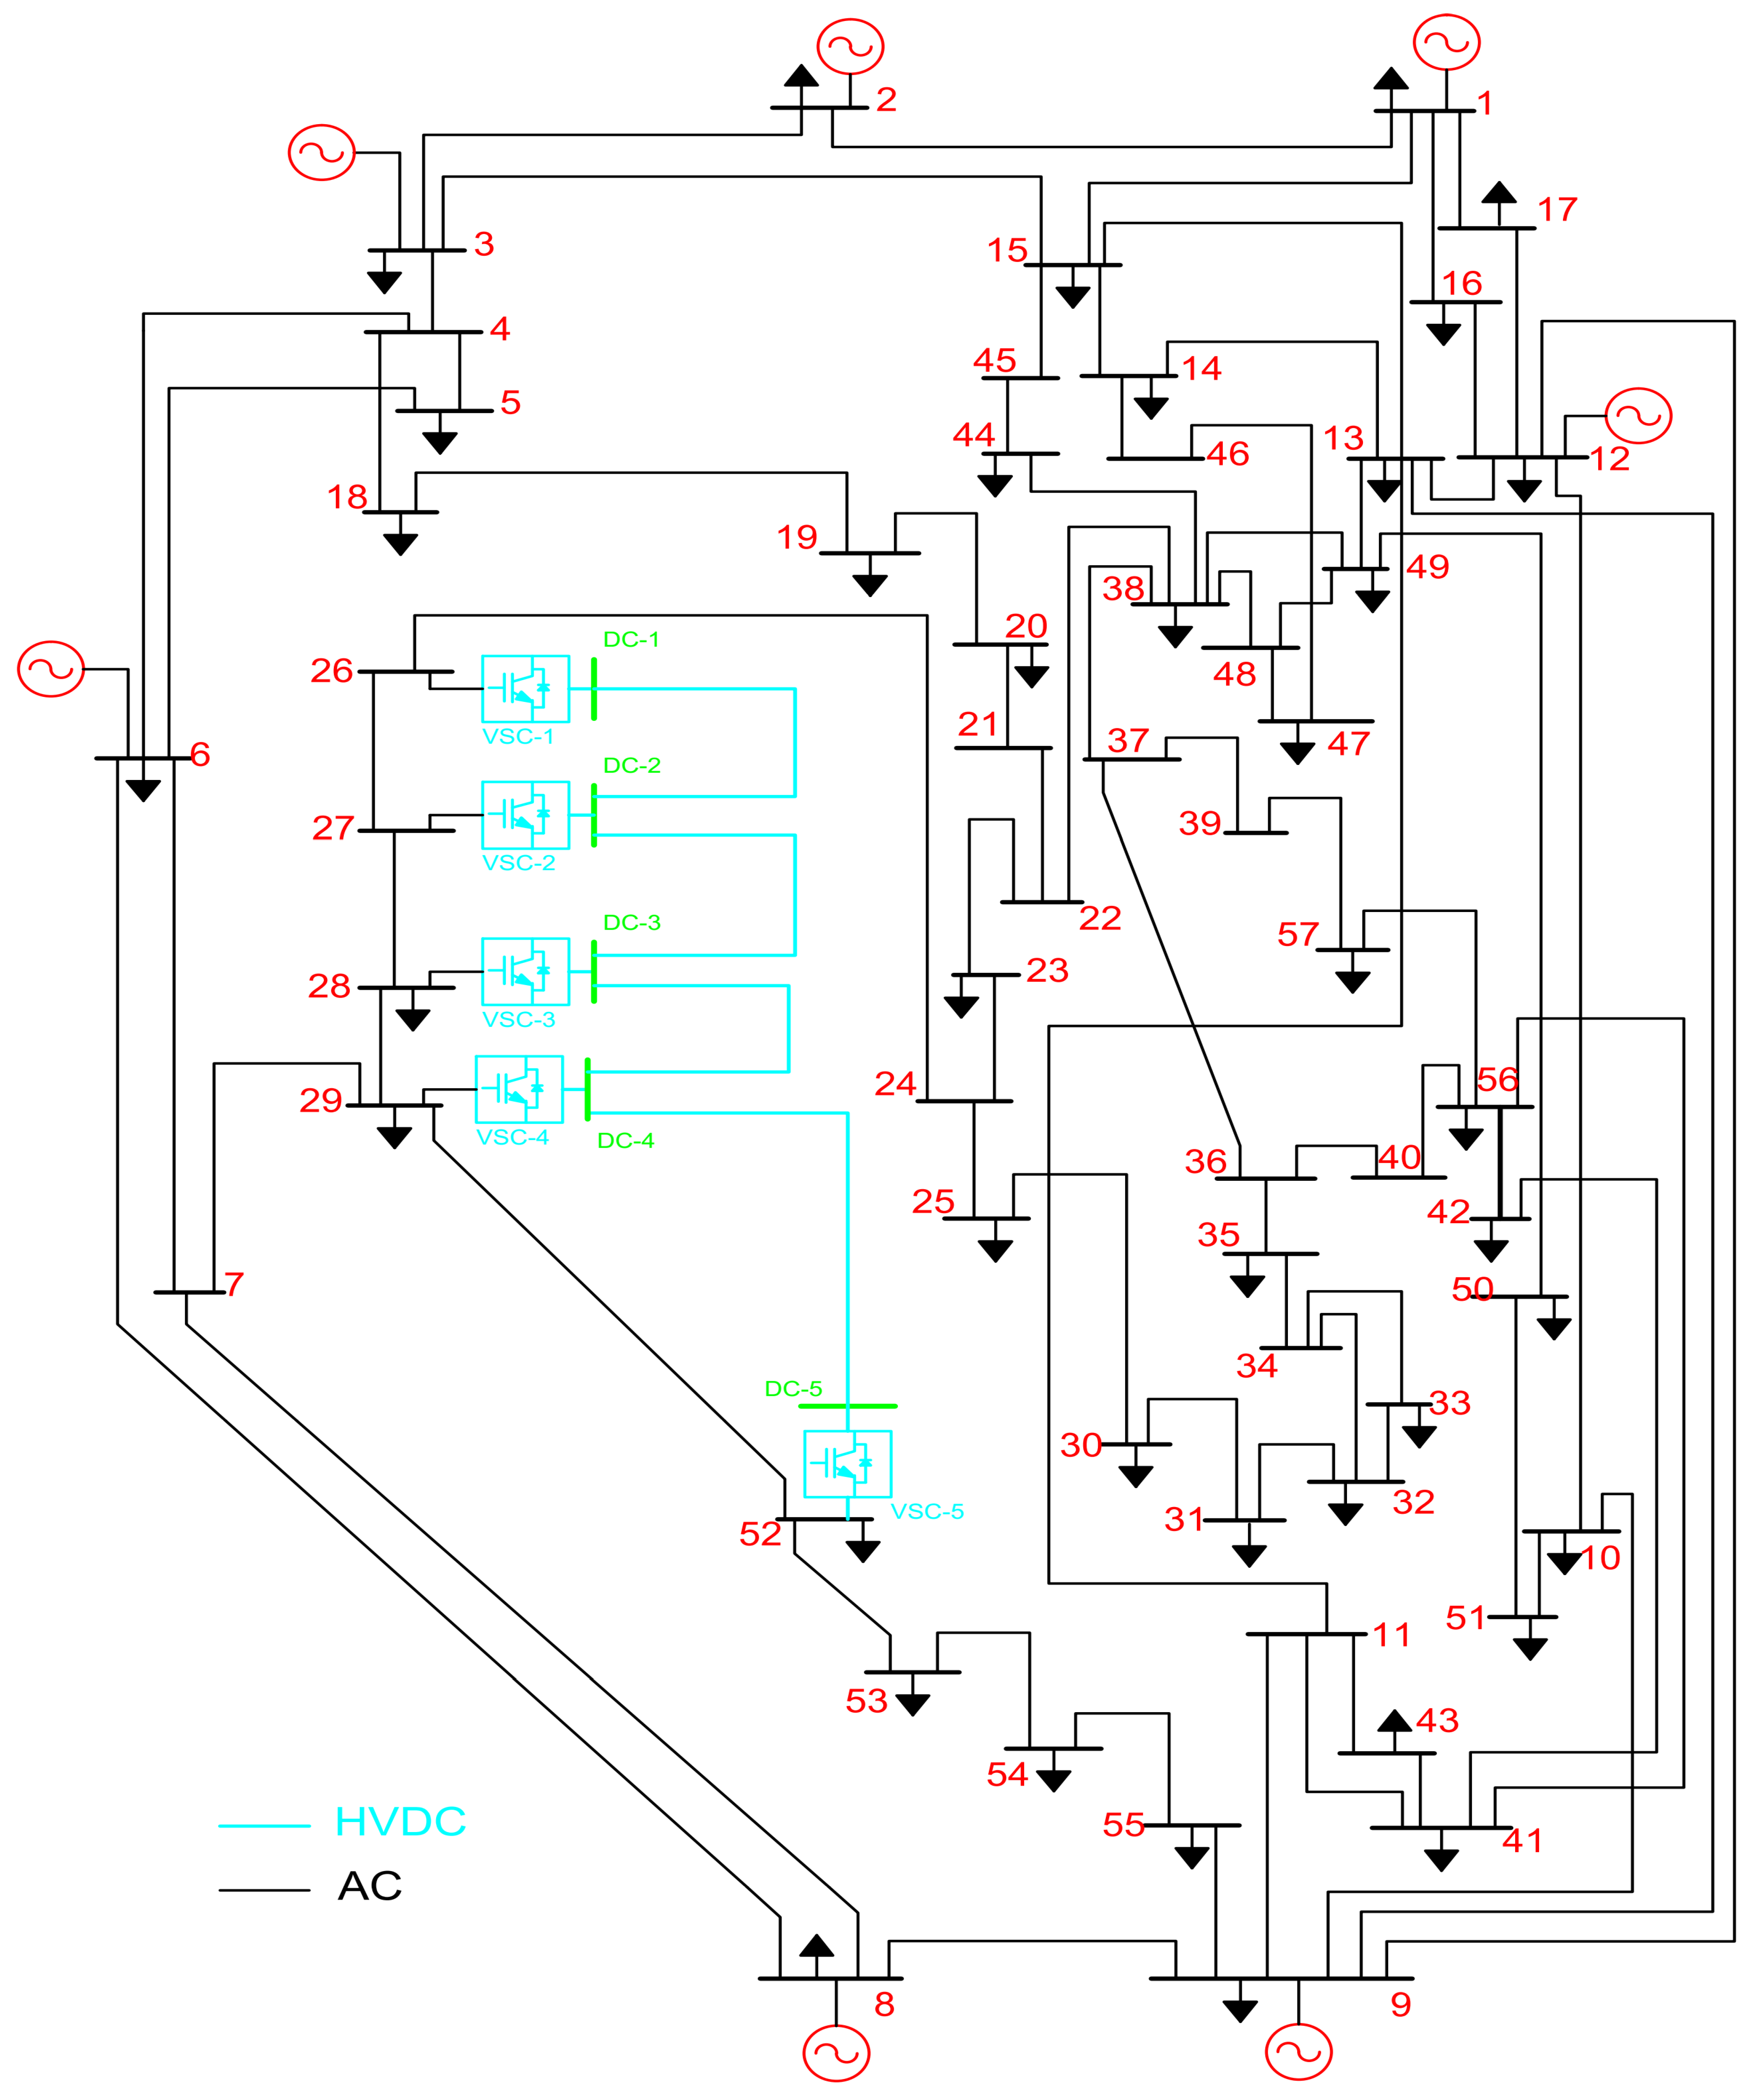
4.2. Results of the IEEE 57-Bus Network

The original IEEE 57-bus testing network includes 57 buses, 8 generators, 8 lines, 17 on-load tapping transformers, and 3 reactive sources. Its branch and bus data is based on [60]. As illustrated in Figure 4, the modified system consists of one DC grid system with five VSCs and four DC connected lines. The generators and loads voltage have highest and lowest ranges of, respectively, 1.06 and 0.94 pu. For the tap changing transformer, the permissible range is [0.9–1.1] pu. The VSCs may be found on buses 26–29 and 52, accordingly. VSC 1 is under Vdc-Qc controlling, whereas VSCs 2–5 are under Pdc-Vc controlling. The highest and lowest voltage values for the VSC stations and DC buses are 1.1 and 0.9 pu, correspondingly, and the conversion power for the VSC stations is 100 MVA. For this system, three instances are analysed, each with a distinct aim in mind. The first introduces the goal of minimizing the TFCs in its quadratic form, while the second one takes the minimization of the ETLs into account.

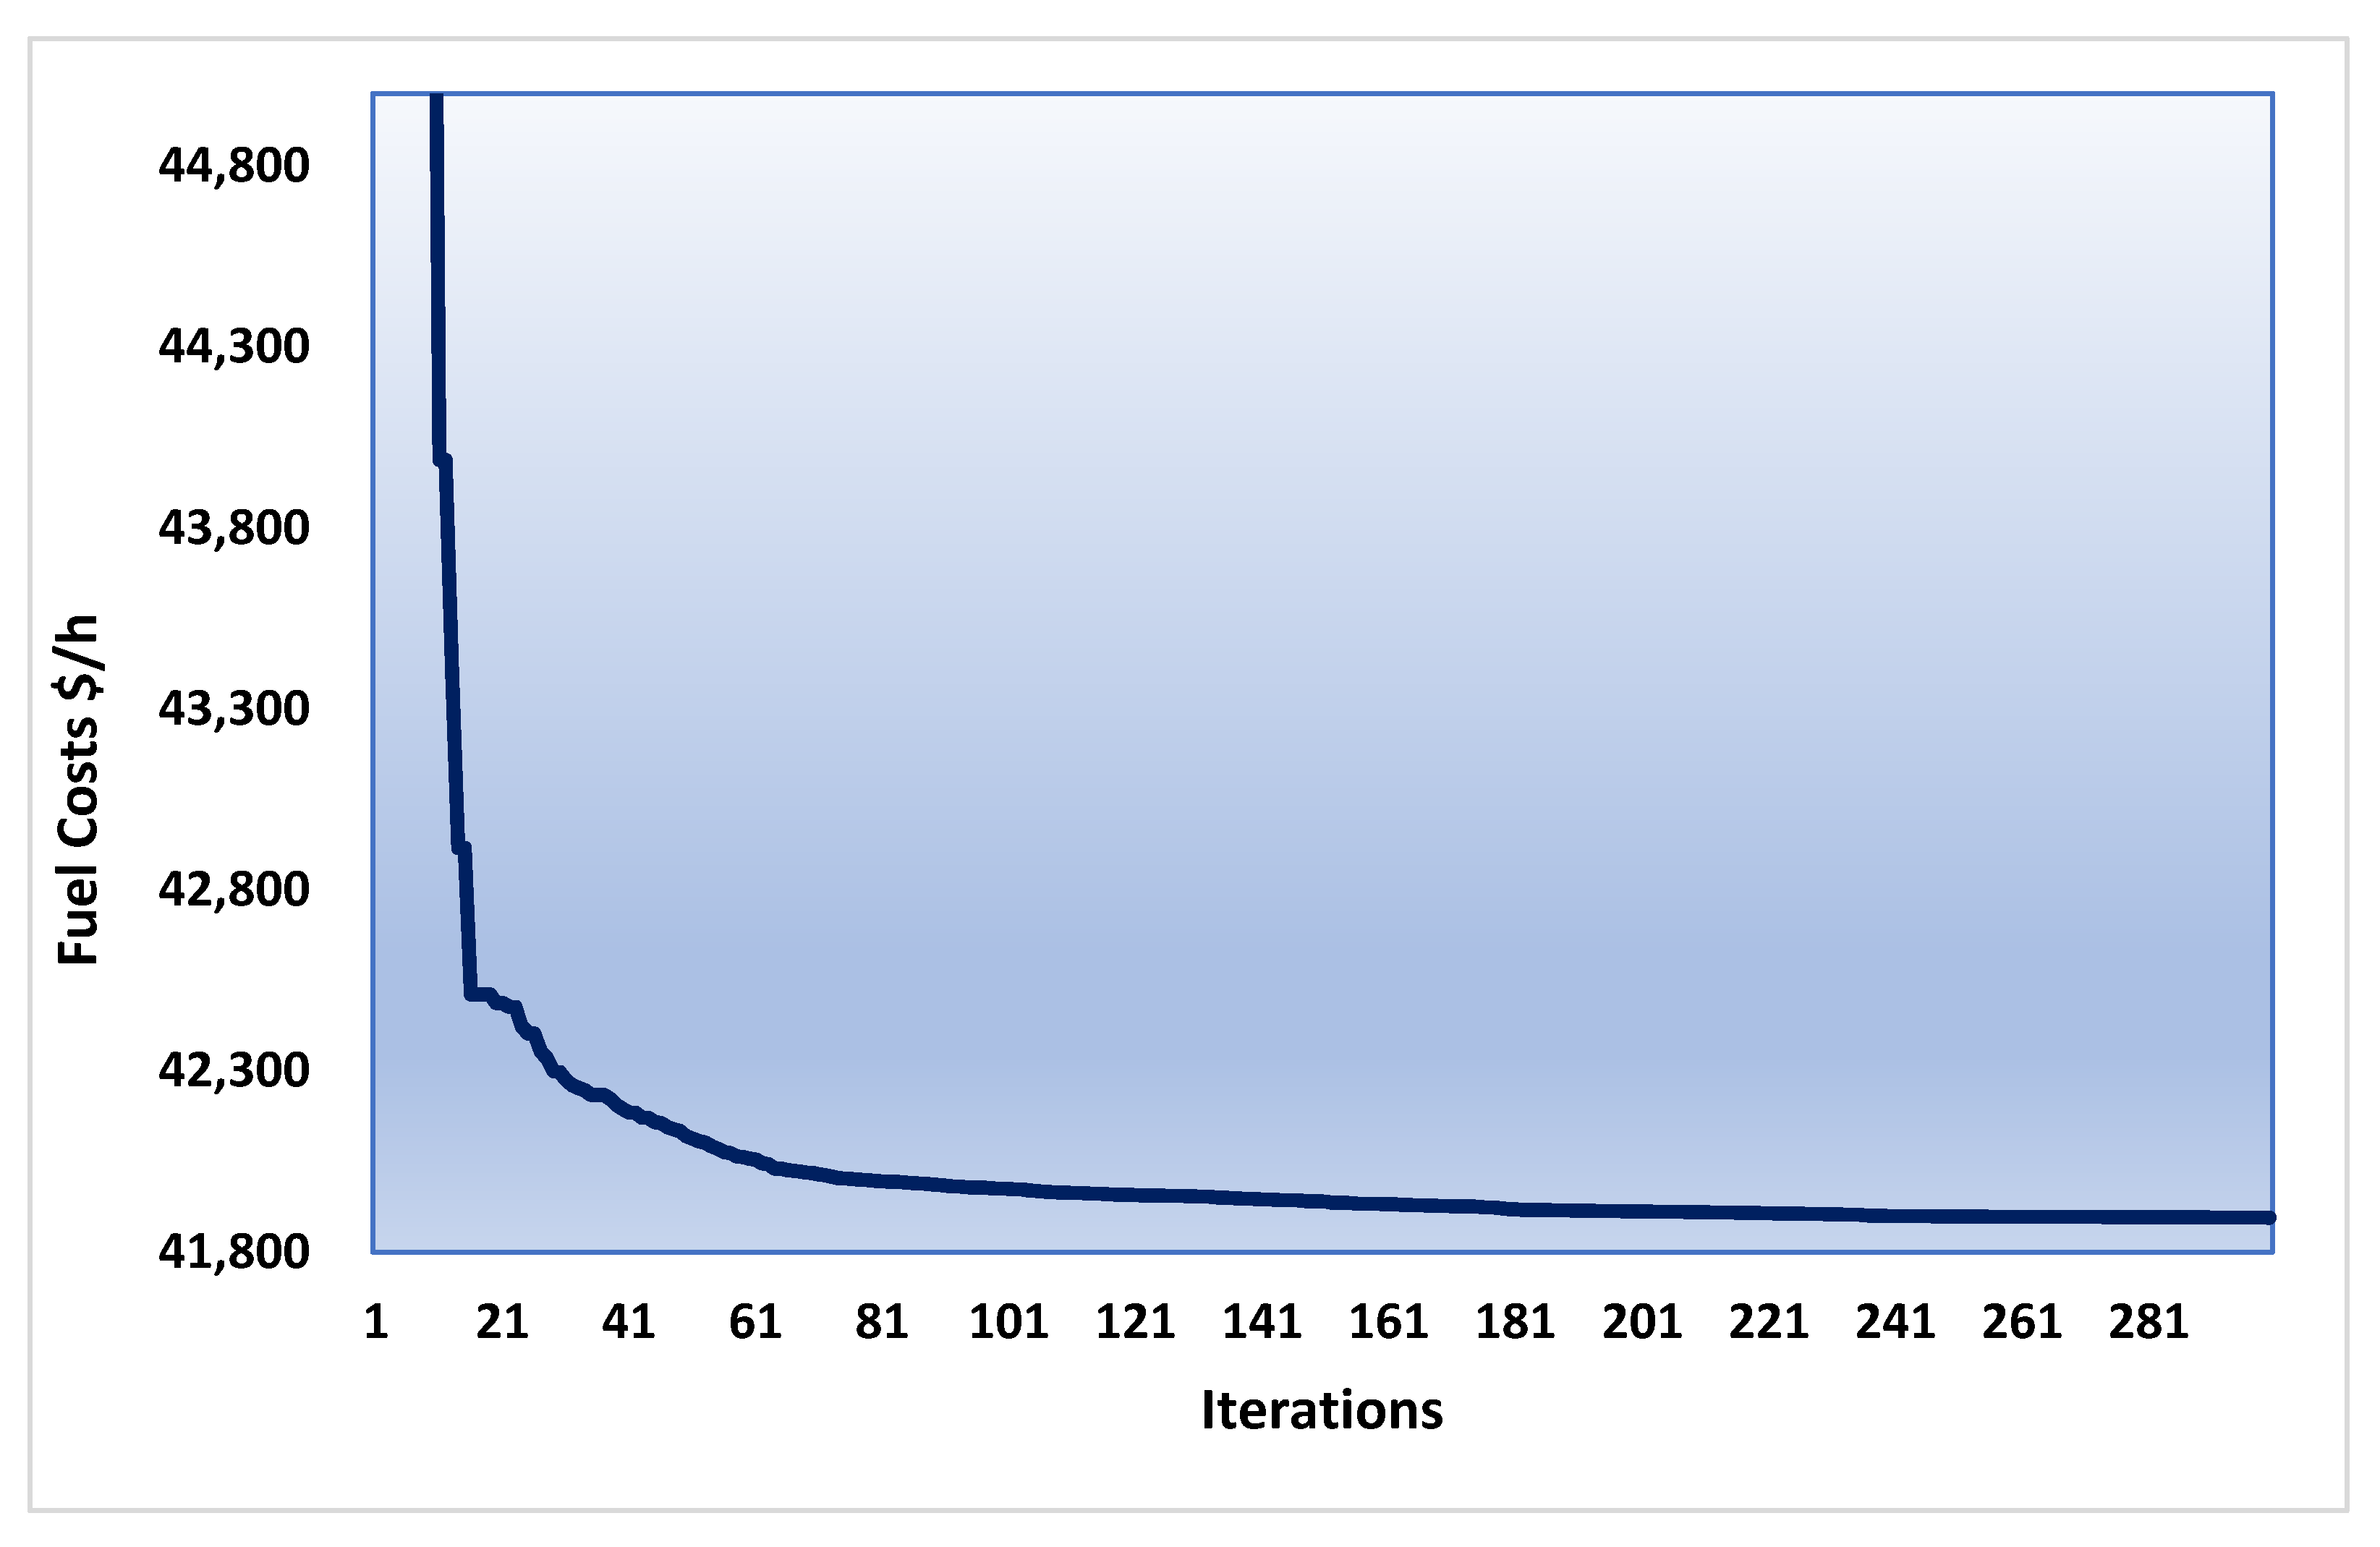
4.2.1. Minimization of the TFCs of the IEEE 57-Bus Network

In the first instance, the minimization of the TFCs is considered in its quadratic form. The proposed TLBA is run, and the optimal results are shown in Table 7 where their convergence characteristics are described in Figure 5. As shown, based on the proposed TLBA, the TFCs are reduced from 53,673.1 to 41,894.89 $/h compared with the initial case. This indicates to a huge reduction percentage of 21.94%.
For this instance, Table 8 tabulates comparative results with other reported techniques in CSA [30], MVO [17], PSO [30], MPO [17], MRFO [30] and IMPO [17]. This table deduces the great superiority of the proposed TLBA in finding the least TFCs of 41,888.86 $/h where CSA, MVO, PSO, MPO, MRFO and IMPO obtains TFCs of 42,050.2, 43,628.05, 41,932.8, 41,987.91, 41,923.6 and 41,920.67 $/h.

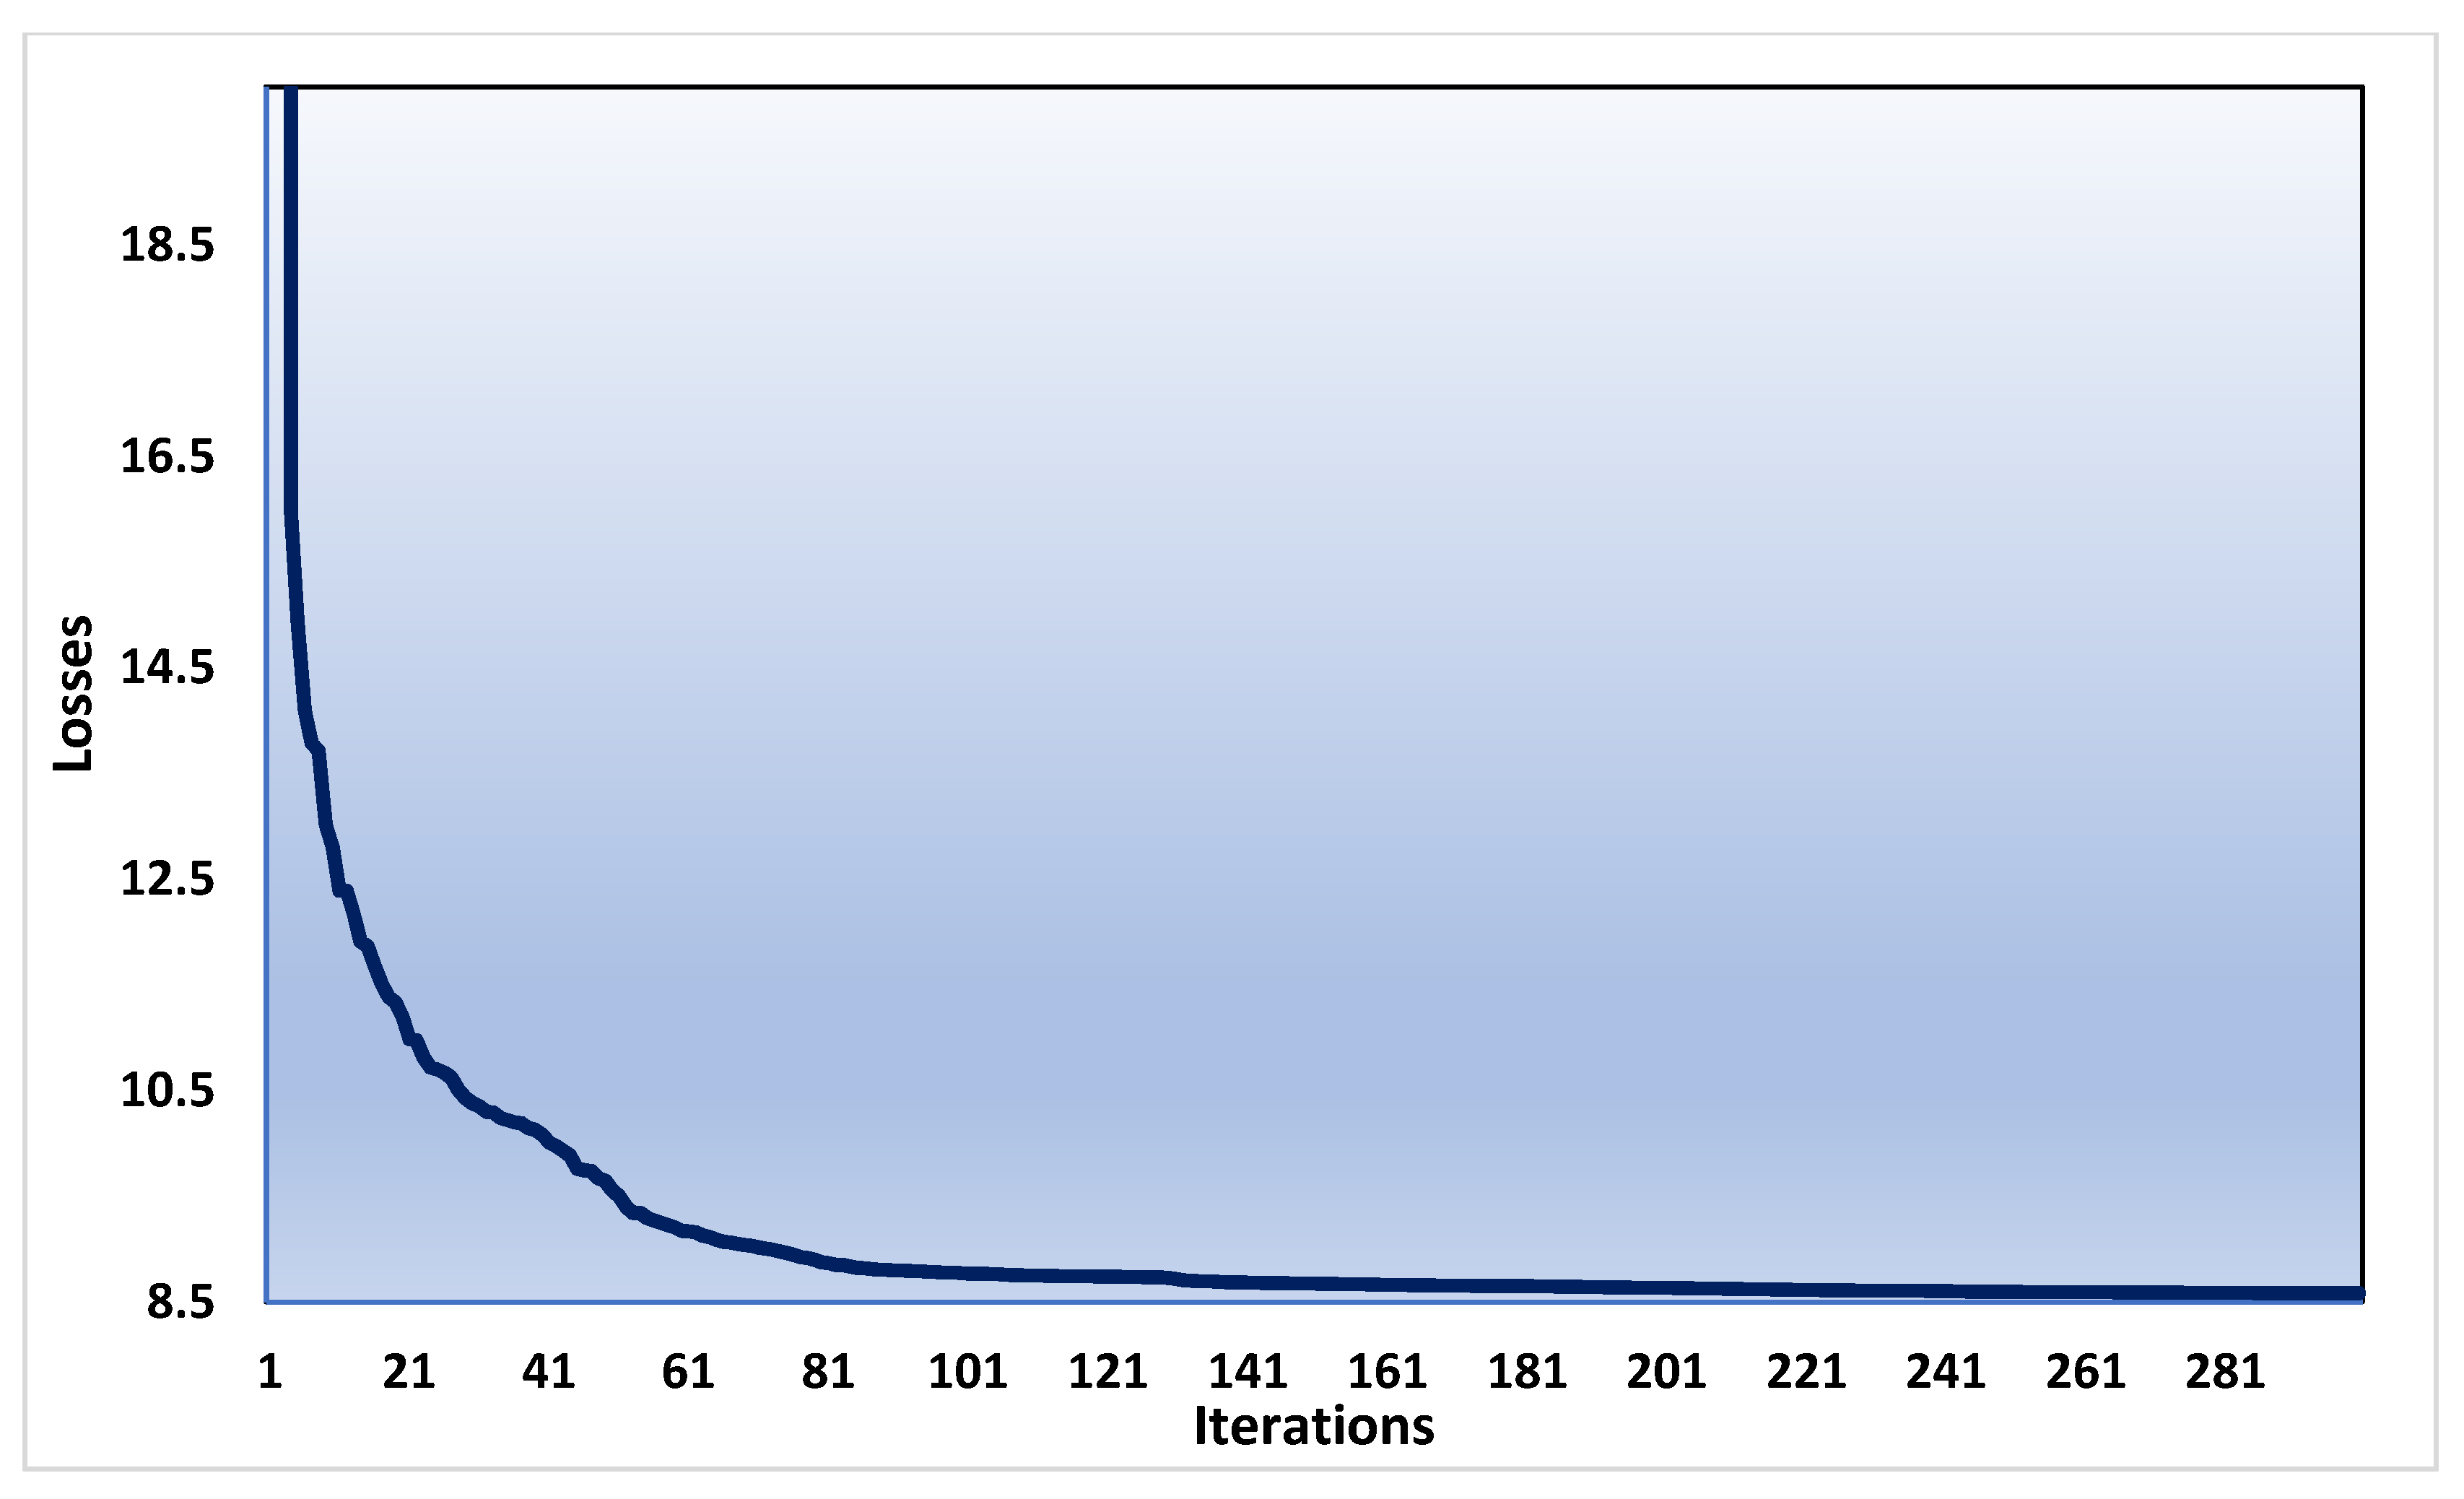
4.2.2. Minimization of the ETLs of the IEEE 57-Bus Network

In the second instance, the minimization of the ETLs is considered. The proposed TLBA is run, and the optimal results are shown in Table 9. As shown, the proposed TLBA obtains lower ETLs value from 52.04 of 15.67 MW which indicates to a huge reduction percentage of 69.83%. The voltage level at generation buses are close to 1.0 p.u and therefore enhanced voltage profile. Also, the convergence characteristics related to the proposed TLBA are for this instance is shown in Figure 6. As illustrated, the proposed TLBA has better convergent performance in avoiding local minima. Also, for minimizing the power losses, Table 10 tabulates comparative results with various reported techniques of CSA [30], PSO [30], MPO [17], MRFO [30] and IMPO [17]. This table deduces the great superiority of the proposed TLBA in finding the least ETLs of 15.6711 MW where CSA, PSO, MPO, MRFO and IMPO obtains ETLs of 18.635, 17.337, 16.20859, 16.82 and 16.10132 MW. Then, more technical benefits are achieved using TLBA.

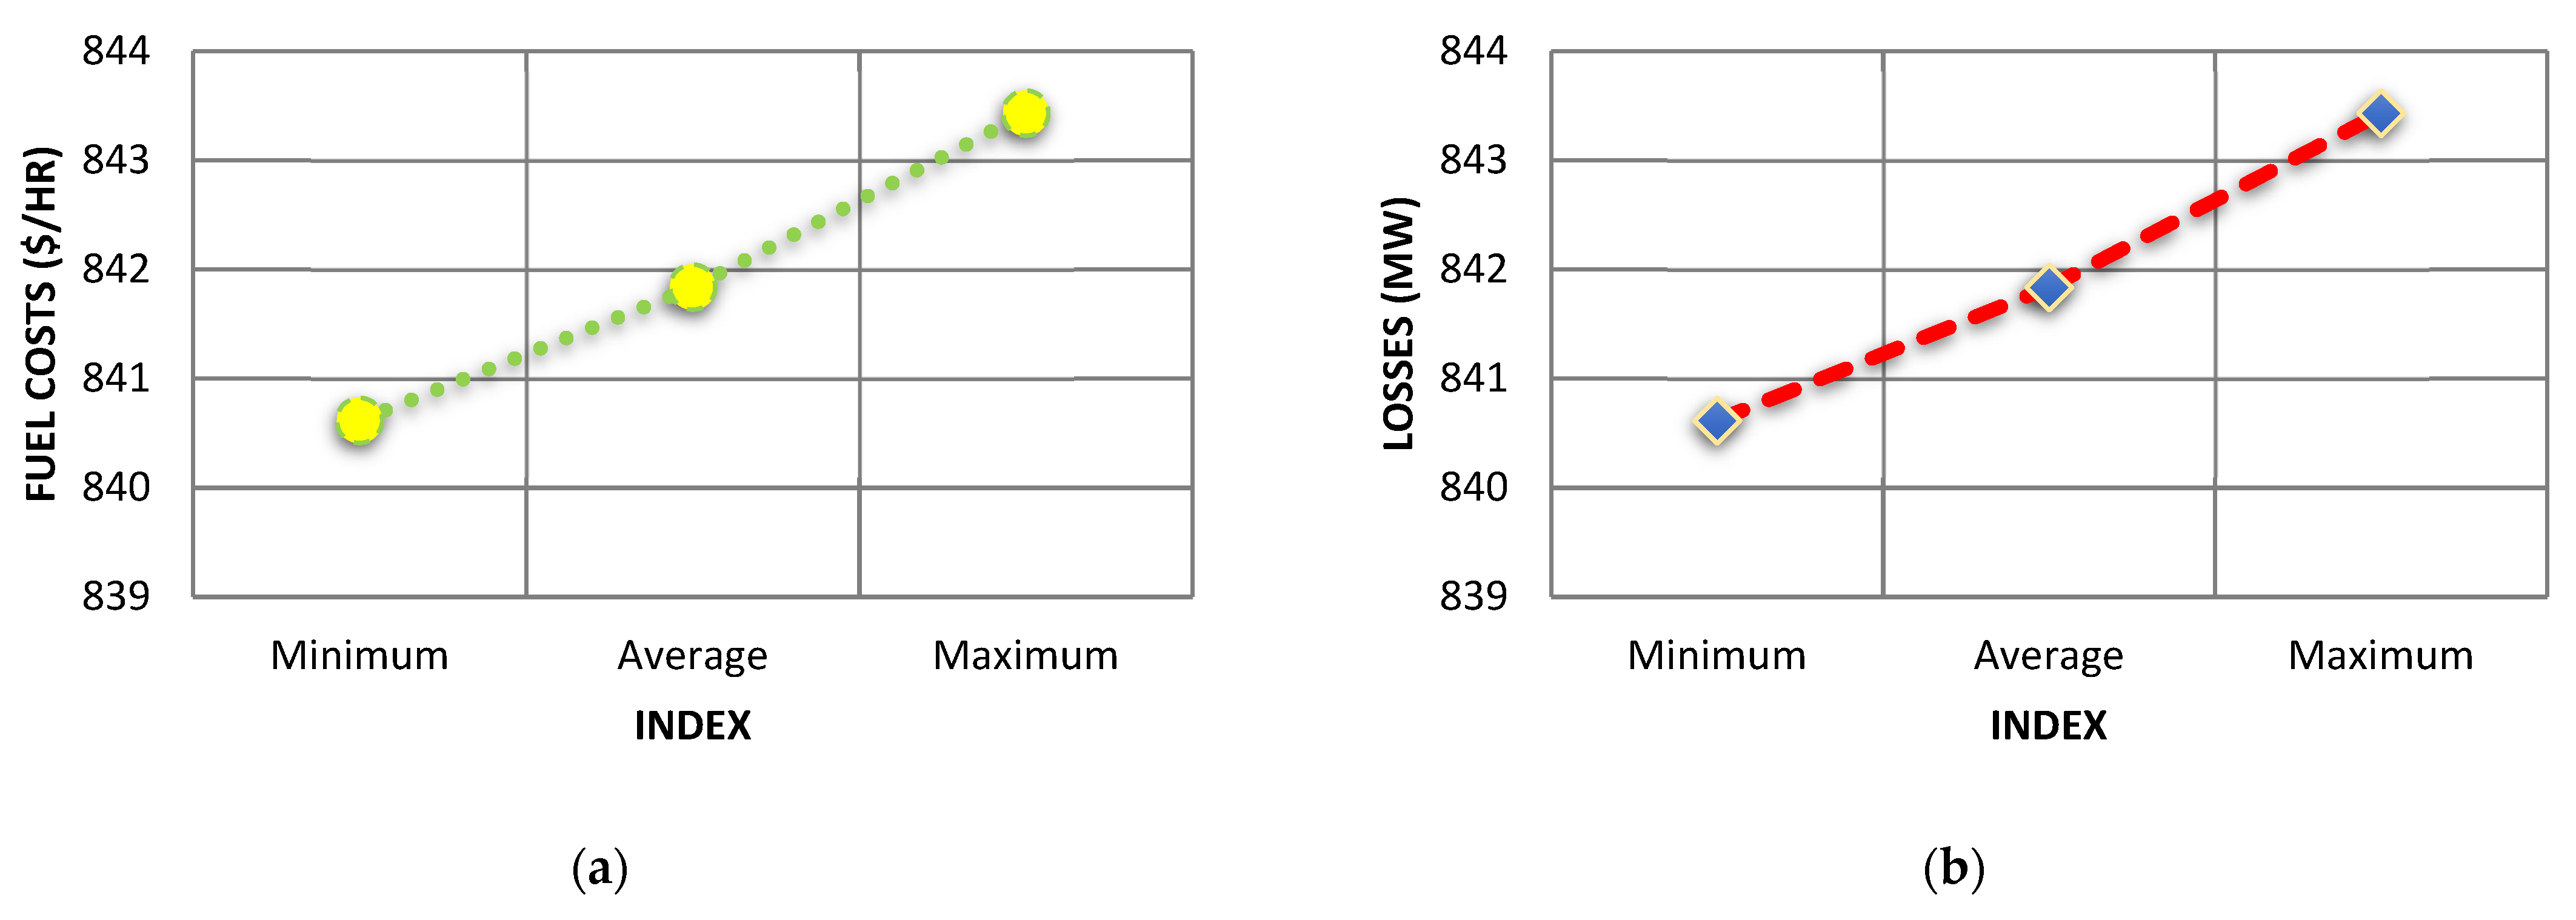
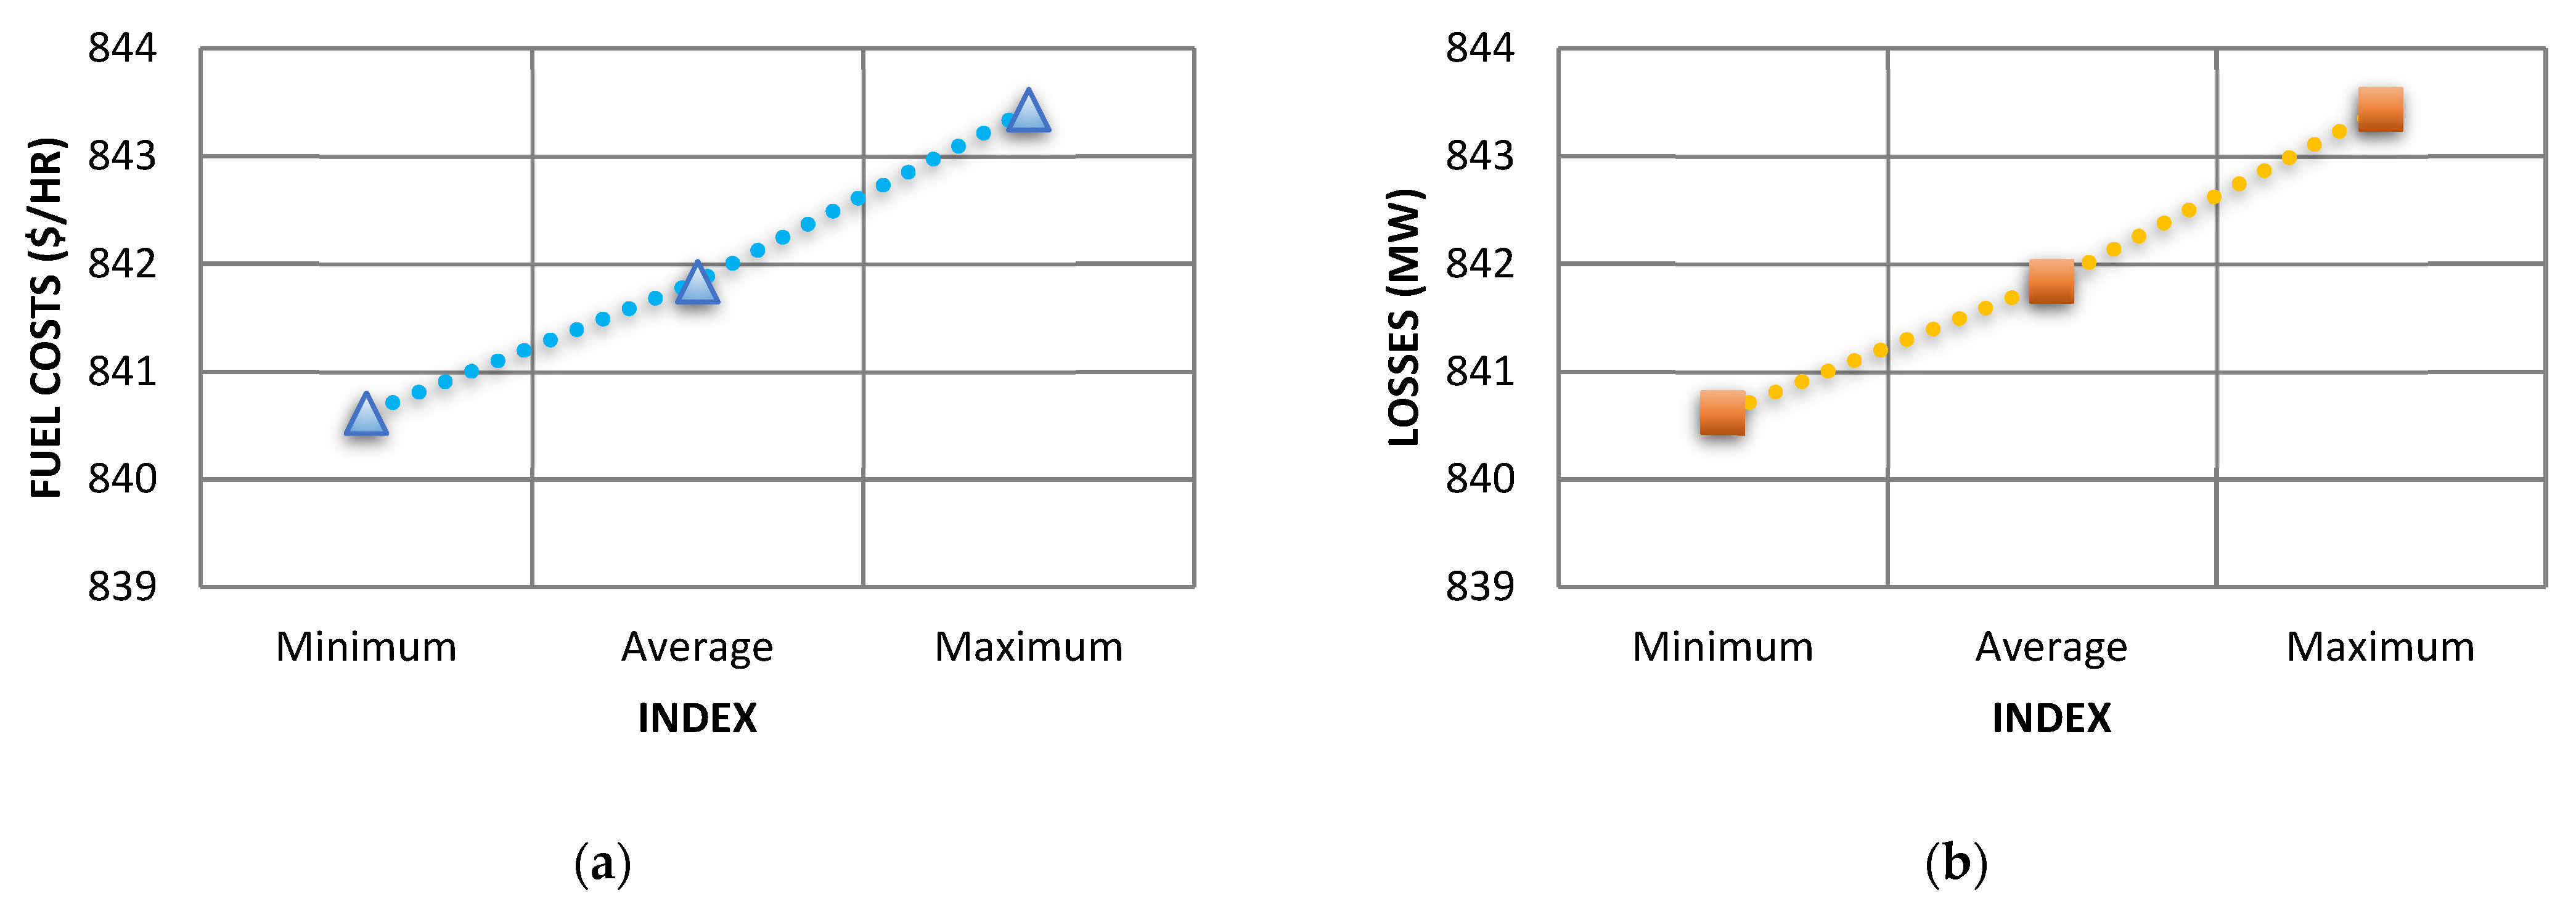
4.3. Statistical Analysis of the Proposed TLBA in Solving the OPF Problem

For the modified IEEE 30-bus AC-DC network, a statistical analysis is conducted by displaying the minimum, mean and maximum of the objectives obtained for the proposed TLBA as shown in Figure 7. As shown, the proposed TLBA has superior performance. For minimizing the TFCs, the proposed TLBA obtains small values of the indices of minimum, mean and maximum of the TFCs of 840.616, 841.838 and 843.433, respectively. For minimizing the ETLs, the proposed TLBA obtains small values of the indices of minimum, mean and maximum of the ETLs of 8.58, 8.635 and 8.771, respectively. For both studied cases, the proposed TLBA declares very small standard deviation of 0.8475 $/h and 0.04993 MW. This suggests significant robust performance of the enhanced TLBA.
For the modified IEEE 57-bus AC-DC network, the minimum, mean and maximum of the objectives obtained for the proposed TLBA are described in Figure 8. As shown, the proposed TLBA has superior performance. For minimizing the TFCs, the proposed TLBA obtains small values of the indices of minimum, mean and maximum of the TFCs of 41,894.89, 41,929.594 and 41,981.34, respectively. For minimizing the ETLs, the proposed TLBA obtains small values of the indices of minimum, mean and maximum of the ETLs of 15.6711, 16.0413 and 16.637, respectively. For both studied cases, the proposed TLBA showed very small standard deviation of 24.99 $/h and 0.3182 MW. This suggests a significantly robust performance of the enhanced TLBA.

5. Conclusions and Discussion

The TLBA algorithm is a powerful and effective optimization approach. TLBA mimics the teaching–learning process in a classroom, where TLBA’s iterative computing process is separated into two phases, unlike standard evolutionary algorithms and swarm intelligence algorithms, and each phase conducts an iterative learning operation. TLBA is used to various sorts of nonlinear and multimodal functioning of hybrid alternating current and multi-terminal direct current power grids. Advanced technologies of Voltage source converter enable greater active and reactive power regulation in these networks. Various goals for optimal energy management are presented, with the aim of achieving economic and technical benefits. The proposed TLBA is evaluated on modified IEEE 30-bus and 57-bus AC-DC networks and compared to other published methods in the literature. For the IEEE 30 bus system, huge reduction percentages of 13.84 and 28.01% in the overall fuel costs and transmission power losses are achieved utilizing the proposed TLBA compared to the initial case. The proposed TLBA obtains huge reductions in the costs and losses with 21.94 and 69.83%, also for the IEEE 57 bus system, compared to the initial case. For both systems, very high success rates are demonstrated for the proposed TLBA. Therefore, these numerical results demonstrate that the proposed TLBA has great effectiveness and robustness indices over the others. Nevertheless, TLBA has faster convergence, higher quality for the final optimal solution, and more power for escaping from convergence to local optima. Different success rates are achieved that correspond with two criteria the progress of iteration number and lowering the tolerance rates.
In this study, significant technical and economical improvements are achieved for different test systems. However, some limitations are important to consider, since the application of presented TLBA is dependent on the control parameter settings. Therefore, the main limitation of this study is the pre-specification requirement of the control parameter settings, which are the number of students and the maximum number of iterations. In order to appropriately adapt them for any test system, a parametric analysis should be assessed in order to optimally extract the control parameter settings. Also, the comparison is executed with different recent techniques, which are reported in the literature. However, there are several new algorithms which are created monthly with different characteristics. Therefore, applications of modern optimization algorithms such as equilibrium, slime mould [61] and tunicate [62] optimizers, etc., can also be considered as another trend of future studies, especially for the high number of objectives and constraints. Even with the previous benefits, the modelling of various renewable energy resources must be included in future work to show the merits of this study because the penetration of renewable energy resources can be considered as the need for hybrid AC-DC networks.

Author Contributions

Conceptualization, A.M.S.; Data curation, S.S.; Formal analysis, R.A.E.-S. and M.G.; Funding acquisition, S.S.; Investigation, M.G.; Methodology, A.M.S.; Resources, R.A.E.-S. and M.G.; Software, A.M.S.; Writing—review & editing, S.S., R.A.E.-S. and M.G. All authors have read and agreed to the published version of the manuscript.

Funding

This research received no external funding.

Institutional Review Board Statement

Not applicable.

Informed Consent Statement

Not applicable.

Data Availability Statement

All required data are involved in the article.

Conflicts of Interest

The authors declare no conflict of interest.

Abbreviations

ACAlternating Current
CSACrow Search Algorithm
DCDirect Current
ELDEconomic Load Dispatch
ETLEntire Transmission Loss
GAGenetic Approach
GWOGrey Wolf Optimizer
HVACHigh Voltage Alternating Current
HVDCHigh Voltage Direct Current
ICSAImproved Crow Search Algorithm
IMPOImproved Marine Predators Algorithm
MPOMarine Predators Algorithm
MRFOManta Ray Foraging Optimizer
MVOMulti-Verse Optimizer
NSMRFONon-Dominated Sorting Manta Ray Foraging Optimization
OPFOptimal Power Flow
PSOParticle Swarm Optimizer
PVPhotovoltaic
TFCTotal Fuel Cost
TLBATeaching Learning-Based Algorithm
VSCVoltage Source Converter

Appendix A

Table A1 tabulates the control parameter values used for TLBA, ICSA, PSO, CSA and GWO which are the methods established and reported in the comparisons.
Table A1. Parameter settings for the methods that were used.
AlgorithmSettings of the Control Parameters
TLBANumber of students is 50 and 100 for IEEE 30 and 57 bus systems
Maximum number of iterations is 300.
Learning changing factor (FT) = randi([1 2])
ICSANumber of crows is 50 and 100 for IEEE 30 and 57 bus systems
Maximum number of iterations is 300.
Awareness probability = 0.3
Flight length = 2
PSONumber of particles is 50 and 100 for IEEE 30 and 57 bus systems
Maximum number of iterations is 300.
cognitive coefficient (c1) = 2; social coefficient (c2) = 2
Constriction coefficient (chi) = 1
CSANumber of crows is 50 and 100 for IEEE 30 and 57 bus systems
Maximum number of iterations is 300.
Awareness probability = 0.3
Flight length = 2
GWONumber of grey wolves is 50 and 100 for IEEE 30 and 57 bus systems
Maximum number of iterations is 300. An adaptive parameter (a) which is decreased linearly from 2 to 0 as follows: a = 2-iter × ((2)/MaxIt)

References

  1. Ali, M.H.; Kamel, S.; Hassan, M.H.; Tostado-Véliz, M.; Zawbaa, H.M. An improved wild horse optimization algorithm for reliability based optimal DG planning of radial distribution networks. Energy Rep. 2022, 8, 582–604. [Google Scholar] [CrossRef]
  2. Khoa, T.H.; Vasant, P.M.; Singh, M.S.B.; Dieu, V.N. Swarm based mean-variance mapping optimization for convex and non-convex economic dispatch problems. Memetic Comput. 2017, 9, 91–108. [Google Scholar] [CrossRef]
  3. Kamboj, V.K.; Kumari, C.L.; Bath, S.K.; Prashar, D.; Rashid, M.; Alshamrani, S.S.; AlGhamdi, A.S. A Cost-Effective Solution for Non-Convex Economic Load Dispatch Problems in Power Systems Using Slime Mould Algorithm. Sustainability 2022, 14, 2586. [Google Scholar] [CrossRef]
  4. Wu, L.; Liu, Z.; Wei, H.L.; Wang, R. An efficient bilevel differential evolution algorithm with adaptation of lower level population size and search radius. Memetic Comput. 2021, 13, 227–247. [Google Scholar] [CrossRef]
  5. Daqaq, F.; Kamel, S.; Ouassaid, M.; Ellaia, R.; Agwa, A.M.; Sa, A.M.A. Non-Dominated Sorting Manta Ray Foraging Optimization for Multi-Objective Optimal Power Flow with Wind/Solar/Small-Hydro Energy Sources. Fractal Fract. 2022, 6, 194. [Google Scholar] [CrossRef]
  6. El-Sehiemy, R.; Elsayed, A.; Shaheen, A.; Elattar, E.; Ginidi, A. Scheduling of Generation Stations, OLTC Substation Transformers and VAR Sources for Sustainable Power System Operation Using SNS Optimizer. Sustainability 2021, 13, 11947. [Google Scholar] [CrossRef]
  7. Acharya, S.; Ganesan, S.; Kumar, D.V.; Subramanian, S. A multi-objective multi-verse optimization algorithm for dynamic load dispatch problems. Knowl. Based Syst. 2021, 231, 107411. [Google Scholar] [CrossRef]
  8. Korompili, A.; Wu, Q.; Zhao, H. Review of VSC HVDC connection for offshore wind power integration. Renew. Sustain. Energy Rev. 2016, 59, 1405–1414. [Google Scholar] [CrossRef] [Green Version]
  9. Renedo, J.; Ibrahim, A.A.; Kazemtabrizi, B.; Garcia-Cerrada, A.; Rouco, L.; Zhao, Q.; Garcia-Gonzalez, J. A simplified algorithm to solve optimal power flows in hybrid VSC-based AC/DC systems. Int. J. Electr. Power Energy Syst. 2019, 110, 781–794. [Google Scholar] [CrossRef] [Green Version]
  10. Sau-Bassols, J.; Zhao, Q.; García-González, J.; Prieto-Araujo, E.; Gomis-Bellmunt, O. Optimal power flow operation of an interline current flow controller in an hybrid AC/DC meshed grid. Electr. Power Syst. Res. 2019, 177, 105935. [Google Scholar] [CrossRef]
  11. Ma, Q.; Wei, W.; Chai, W.; Mei, S. Solvability region of AC–DC power systems with volatile renewable energy sources. Energy Rep. 2022, 8, 1463–1472. [Google Scholar] [CrossRef]
  12. El-Hawary, M.E.; Ibrahim, S.T. A new approach to AC-DC load flow analysis. Electr. Power Syst. Res. 1995, 33, 193–200. [Google Scholar] [CrossRef]
  13. Beerten, J.; Belmans, R. Development of an open source power flow software for high voltage direct current grids and hybrid AC/DC systems: MATACDC. IET Gener. Transm. Distrib. 2015, 9, 966–974. [Google Scholar] [CrossRef]
  14. Messalti, S.; Belkhiat, S.; Saadate, S.; Flieller, D. A new approach for load flow analysis of integrated AC-DC power systems using sequential modified Gauss-Seidel methods. Eur. Trans. Electr. Power 2012, 22, 421–432. [Google Scholar] [CrossRef]
  15. Shi, C.; Tang, A.; Yang, H.; Yan, H.; Lu, Z. Quasi-AC Optimal Power Flow for VSC-MTDC Systems. In Proceedings of the 2020 IEEE 4th Information Technology, Networking, Electronic and Automation Control Conference, ITNEC 2020, Chongqing, China, 12–14 June 2020. [Google Scholar] [CrossRef]
  16. Zhao, Y.; Liu, Y. A practical AC-DC load flow program based on sequential solution method. In Proceedings of the Proceedings. International Conference on Power System Technology, Kunming, China, 13–17 October 2002; Volume 2. [Google Scholar] [CrossRef]
  17. al Harthi, M.; Ghoneim, S.; Elsayed, A.; El-Sehiemy, R.; Shaheen, A.; Ginidi, A. A Multi-Objective Marine Predator Optimizer for Optimal Techno-Economic Operation of AC/DC Grids. Stud. Inf. Control 2021, 30, 89–99. [Google Scholar] [CrossRef]
  18. Zhao, Q.; García-González, J.; Gomis-Bellmunt, O.; Prieto-Araujo, E.; Echavarren, F.M. Impact of converter losses on the optimal power flow solution of hybrid networks based on VSC-MTDC. Electr. Power Syst. Res. 2017, 151, 395–403. [Google Scholar] [CrossRef] [Green Version]
  19. Beerten, J.; Cole, S.; Belmans, R. Modeling of multi-terminal vsc hvdc systems with distributed dc voltage control. IEEE Trans. Power Syst. 2014, 29, 34–42. [Google Scholar] [CrossRef] [Green Version]
  20. Baradar, M.; Ghandhari, M. A multi-option unified power flow approach for hybrid AC/DC grids incorporating multi-terminal VSC-HVDC. IEEE Trans. Power Syst. 2013, 28, 2376–2383. [Google Scholar] [CrossRef]
  21. Khan, M.O.; Wadood, A.; Abid, M.I.; Khurshaid, T.; Rhee, S.B. Minimization of network power losses in the ac-dc hybrid distribution network through network reconfiguration using soft open point. Electronics 2021, 10, 326. [Google Scholar] [CrossRef]
  22. Wang, S.; Zhu, J.; Trinh, L.; Pan, J. Economic assessment of HVDC project in deregulated energy markets. In Proceedings of the 3rd International Conference on Deregulation and Restructuring and Power Technologies, DRPT 2008, Nanjing, China, 6–9 April 2008. [Google Scholar] [CrossRef]
  23. Feng, W.; Tjernberg, L.B.; Mannikoff, A.; Bergman, A. A new approach for benefit evaluation of multiterminal VSC-HVDC using a proposed mixed AC/DC optimal power flow. IEEE Trans. Power Deliv. 2014, 29, 432–443. [Google Scholar] [CrossRef]
  24. Lotfjou, A.; Fu, Y.; Shahidehpour, M. Hybrid AC/DC transmission expansion planning. IEEE Trans. Power Deliv. 2012, 27, 579–591. [Google Scholar] [CrossRef]
  25. Hotz, M.; Member, S.; Utschick, W.; Member, S. hynet: An Optimal Power Flow Framework for Hybrid AC/DC Power Systems. IEEE Trans. Power Syst. 2020, 35, 1036–1047. [Google Scholar] [CrossRef] [Green Version]
  26. Maulik, A.; Das, D. Optimal power dispatch considering load and renewable generation uncertainties in an AC–DC hybrid microgrid. IET Gener. Transm. Distrib. 2019, 13, 1164–1176. [Google Scholar] [CrossRef]
  27. Baradar, M.; Hesamzadeh, M.R.; Ghandhari, M. Second-order cone programming for optimal power flow in VSC-type AC-DC grids. IEEE Trans. Power Syst. 2013, 28, 4282–4291. [Google Scholar] [CrossRef]
  28. Cao, J.; Du, W.; Wang, H.F.; Bu, S.Q. Minimization of transmission loss in meshed AC/DC grids with VSC-MTDC networks. IEEE Trans. Power Syst. 2013, 28, 3047–3055. [Google Scholar] [CrossRef]
  29. Shaheen, A.M.; Elsayed, A.M.; El-Sehiemy, R.A. Optimal Economic–Environmental Operation for AC-MTDC Grids by Improved Crow Search Algorithm. IEEE Syst. J. 2022, 16, 1270–1277. [Google Scholar] [CrossRef]
  30. Elattar, E.E.; Shaheen, A.M.; Elsayed, A.M.; El-Sehiemy, R.A. Optimal power flow with emerged technologies of voltage source converter stations in meshed power systems. IEEE Access 2020, 8, 166963–166979. [Google Scholar] [CrossRef]
  31. Pinto, R.T.; Rodrigues, S.F.; Wiggelinkhuizen, E.; Scherrer, R.; Bauer, P.; Pierik, J. Operation and power flow control of multi-terminal DC networks for grid integration of offshore wind farms using genetic algorithms. Energies 2013, 6, 1. [Google Scholar] [CrossRef] [Green Version]
  32. Sayah, S. Modified differential evolution approach for practical optimal reactive power dispatch of hybrid AC–DC power systems. Appl. Soft Comput. J. 2018, 73, 591–606. [Google Scholar] [CrossRef]
  33. Abdul-hamied, D.T.; Shaheen, A.M.; Salem, W.A.; Gabr, W.I.; El-sehiemy, R.A. Equilibrium optimizer based multi dimensions operation of hybrid AC/DC grids. Alexandria Eng. J. 2020, 59, 4787–4803. [Google Scholar] [CrossRef]
  34. Elsayed, A.M.; Shaheen, A.M.; Alharthi, M.M.; Ghoneim, S.S.M.; El-Sehiemy, R.A. Adequate operation of hybrid AC/MT-HVDC power systems using an improved multi- objective marine predators optimizer. IEEE Access 2021, 9, 51065–51087. [Google Scholar] [CrossRef]
  35. Rao, R.; Savsani, V.; Vakharia, D. Teaching–Learning-Based Optimization: An optimization method for continuous non-linear large scale problems. Inf. Sci. 2012, 183, 1–15. [Google Scholar] [CrossRef]
  36. Zou, F.; Chen, D.; Xu, Q. A survey of teaching–learning-based optimization. Neurocomputing 2018, 335, 366–383. [Google Scholar] [CrossRef]
  37. Xue, R.; Wu, Z. A Survey of Application and Classification on Teaching-Learning-Based Optimization Algorithm. IEEE Access 2019, 8, 1062–1079. [Google Scholar] [CrossRef]
  38. Mi, X.; Liao, Z.; Li, S.; Gu, Q. Adaptive teaching–learning-based optimization with experience learning to identify photovoltaic cell parameters. Energy Rep. 2021, 7, 4114–4125. [Google Scholar] [CrossRef]
  39. Li, L.; Xiong, G.; Yuan, X.; Zhang, J.; Chen, J. Parameter Extraction of Photovoltaic Models Using a Dynamic Self-Adaptive and Mutual- Comparison Teaching-Learning-Based Optimization. IEEE Access 2021, 9, 52425–52441. [Google Scholar] [CrossRef]
  40. Ashtiani, M.N.; Toopshekan, A.; Astaraei, F.R.; Yousefi, H.; Maleki, A. Techno-economic analysis of a grid-connected PV/battery system using the teaching-learning-based optimization algorithm. Sol. Energy 2020, 203, 69–82. [Google Scholar] [CrossRef]
  41. Yaqoob, M.T.; Rahmat, M.K.; Maharum, S.M.M. Modified teaching learning based optimization for selective harmonic elimination in multilevel inverters. Ain Shams Eng. J. 2022, 13, 101714. [Google Scholar] [CrossRef]
  42. Le, P.-N.; Kang, H.-J. Robot Manipulator Calibration Using a Model Based Identification Technique and a Neural Network With the Teaching Learning-Based Optimization. IEEE Access 2020, 8, 105447–105454. [Google Scholar] [CrossRef]
  43. Elshaboury, N.; Abdelkader, E.M.; Al-Sakkaf, A.; Alfalah, G. Teaching-Learning-Based Optimization of Neural Networks for Water Supply Pipe Condition Prediction. Water 2021, 13, 3546. [Google Scholar] [CrossRef]
  44. Safari, M.; de Sousa, R.J.A.; Rabiee, A.H.; Tahmasbi, V. Investigation of Dissimilar Resistance Spot Welding Process of AISI 304 and AISI 1060 Steels with TLBO-ANFIS and Sensitivity Analysis. Metals 2021, 11, 1324. [Google Scholar] [CrossRef]
  45. Yang, N.-C.; Liu, S.-W. Multi-Objective Teaching–Learning-Based Optimization with Pareto Front for Optimal Design of Passive Power Filters. Energies 2021, 14, 6408. [Google Scholar] [CrossRef]
  46. Jalalzad, S.H.; Yektamoghadam, H.; Haghighi, R.; Dehghani, M.; Nikoofard, A.; Khosravy, M.; Senjyu, T. A Game Theory Approach Using the TLBO Algorithm for Generation Expansion Planning by Applying Carbon Curtailment Policy. Energies 2022, 15, 1172. [Google Scholar] [CrossRef]
  47. Wu, D.; Jia, H.; Abualigah, L.; Xing, Z.; Zheng, R.; Wang, H.; Altalhi, M. Enhance Teaching-Learning-Based Optimization for Tsallis-Entropy-Based Feature Selection Classification Approach. Processes 2022, 10, 360. [Google Scholar] [CrossRef]
  48. Ayalew, M.; Khan, B.; Alaas, Z.M. Optimal Service Restoration Scheme for Radial Distribution Network Using Teaching Learning Based Optimization. Energies 2022, 15, 2505. [Google Scholar] [CrossRef]
  49. Alghamdi, A.S. A New Self-Adaptive Teaching–Learning-Based Optimization with Different Distributions for Optimal Reactive Power Control in Power Networks. Energies 2022, 15, 2759. [Google Scholar] [CrossRef]
  50. Bouchekara, H.; Chaib, A.; Abido, M.; El-Sehiemy, R. Optimal power flow using an Improved Colliding Bodies Optimization algorithm. Appl. Soft Comput. 2016, 42, 119–131. [Google Scholar] [CrossRef]
  51. Gupta, S.; Kumar, N.; Srivastava, L. Bat Search Algorithm for Solving Multi-objective Optimal Power Flow Problem. Autom. Wirel. Syst. Electr. Eng. 2019, 553, 347–362. [Google Scholar] [CrossRef]
  52. Shaheen, A.M.; Ginidi, A.R.; El-Sehiemy, R.A.; Elattar, E.E. Optimal economic power and heat dispatch in Cogeneration Systems including wind power. Energy 2021, 225, 120263. [Google Scholar] [CrossRef]
  53. Bentouati, B.; Khelifi, A.; Shaheen, A.M.; El-Sehiemy, R.A. An enhanced moth-swarm algorithm for efficient energy management based multi dimensions OPF problem. J. Ambient Intell. Humaniz. Comput. 2020, 12, 9499–9519. [Google Scholar] [CrossRef]
  54. El Sehiemy, R.A.; El Ela, A.A.A.; Shaheen, A. A Multi-Objective Fuzzy-Based Procedure for Reactive Power-Based Preventive Emergency Strategy. Int. J. Eng. Res. Afr. 2014, 13, 91–102. [Google Scholar] [CrossRef]
  55. Shaheen, A.M.; El-Sehiemy, R.A.; Alharthi, M.M.; Ghoneim, S.S.; Ginidi, A.R. Multi-objective jellyfish search optimizer for efficient power system operation based on multi-dimensional OPF framework. Energy 2021, 237, 121478. [Google Scholar] [CrossRef]
  56. Shaheen, A.M.; El-Sehiemy, R.A.; Elsayed, A.M.; Elattar, E.E. Multi-objective manta ray foraging algorithm for efficient operation of hybrid AC/DC power grids with emission minimisation. IET Gener. Transm. Distrib. 2020, 15, 1314–1336. [Google Scholar] [CrossRef]
  57. Beerten, J.; Cole, S.; Belmans, R. A sequential AC/DC power flow algorithm for networks containing multi-terminal VSC HVDC systems. In Proceedings of the IEEE PES General Meeting, PES 2010, Minneapolis, MN, USA, 25–29 July 2010. [Google Scholar] [CrossRef] [Green Version]
  58. Shaheen, A.M.; El-Sehiemy, R.A. Application of multi-verse optimizer for transmission network expansion planning in power systems. In Proceedings of the International Conference on Innovative Trends in Computer Engineering ITCE 2019, Aswan, Egypt, 2–4 February 2019; pp. 371–376. [Google Scholar] [CrossRef]
  59. Shaheen, A.M.; El-Sehiemy, R.A.; Elattar, E.E.; Abd-Elrazek, A.S. A Modified Crow Search Optimizer for Solving Non-Linear OPF Problem With Emissions. IEEE Access 2021, 9, 43107–43120. [Google Scholar] [CrossRef]
  60. Zimmerman, M.-S.C.R.D. Matpower [Software]. Available online: https://matpower.org (accessed on 1 August 2021).
  61. Sarhan, S.; Shaheen, A.M.; El-Sehiemy, R.A.; Gafar, M. An Enhanced Slime Mould Optimizer That Uses Chaotic Behavior and an Elitist Group for Solving Engineering Problems. Mathematics 2022, 10, 1991. [Google Scholar] [CrossRef]
  62. Kaur, S.; Awasthi, L.K.; Sangal, A.; Dhiman, G. Tunicate Swarm Algorithm: A new bio-inspired based metaheuristic paradigm for global optimization. Eng. Appl. Artif. Intell. 2020, 90, 103541. [Google Scholar] [CrossRef]
Figure 1. Proposed TLBA for solving the OPF problem in AC-DC grids.
Mathematics 10 02337 g001
Figure 2. Convergence curves of TLBA for the minimization of the TFCs of the IEEE 30-bus network.
Mathematics 10 02337 g002
Figure 3. Convergence curves of TLBA for the minimization of the ETLs of the IEEE 30-bus network.
Mathematics 10 02337 g003
Figure 4. IEEE 57-bus with AC-DC network.
Mathematics 10 02337 g004
Figure 5. Convergence curves of TLBA for the minimization of the TFCs of the IEEE 57-bus network.
Mathematics 10 02337 g005
Figure 6. Convergence curves of TLBA for the minimization of the ETLs of the IEEE 57-bus network.
Mathematics 10 02337 g006
Figure 7. Statistical analysis curves of TLBA for the first system. (a) Instance 1; (b) Instance 2.
Mathematics 10 02337 g007
Figure 8. Statistical analysis curves of TLBA for the second system. (a) Instance 1; (b) Instance 2.
Mathematics 10 02337 g008
Table 1. Simulation results of TLBA for the minimization of the TFCs of the IEEE 30-bus network.
VariablesInitialTLBAVariablesInitialTLBA
Vg11.051.057230475Pg28044.23301348
Vg21.041.038516219Pg55020.24856
Vg51.011.015932627Pg82010.00046
Vg81.011.023835298Pg112010
Vg111.051.046280787Pg132012.00001
Vg131.051.036847246Qs117.313.538584
T6–91.0780.900472851Qs4−17.450.391427
T6–101.0691.083855873Vc211.024533
T4–121.0321.009042356Vc310.97523
T28–271.0680.986765581Vc511.053674
Qc10190.176292937Vc611.051539
Qc12029.16232583Ps225.7414.35307
Qc1500.308572782Ps352.5333.43576
Qc1702.737558014Ps540.4441.01778
Qc2004.153172252Ps618.4517.98847
Qc2109.478169587Vdc,11.061.099989
Qc2300.825606456Vdc,41.061.09993
Qc244.39.310278385ECFs ($/h)975.64840.6166
Qc2900.002124205ETLs (MW)11.923613.32178
Pg1105.32199.935112
Table 2. Comparative results of the IEEE 30-bus network for the minimization of the TFCs.
MethodECFs ($/h)
Proposed TLBA840.6166
ICSA [29]842.34
PSO [29]846.25
CSA [29]848.93
GWO [29]854.43
Table 3. Success rate of the proposed TLBA for the minimization of the TFCs of the IEEE 30-bus network.
At 50% Convergence
Iterations = 150
At 66.67% Convergence
Iterations = 200
At 83.33% Convergence
Iterations = 250
At 100% Convergence
Iterations = 300
|Best-worst| ($/h)2.46292.55883.03423.9384
|Best-worst| (%)0.29270.30420.36100.4691
Success rateTolerance of 0.5%100%100%100%100%
Tolerance of 0.25%93.33%93.33%93.33%100%
Tolerance of 0.1%26.67%46.67%86.67%100%
Tolerance of 0.05%6.67%26.67%46.67%100%
Table 4. Simulation results of TLBA for the minimization of the ETLs of the IEEE 30-bus network.
VariablesInitialTLBAVariablesInitialTLBA
Vg11.050.988792Pg28080
Vg21.040.986402Pg55049.99999
Vg51.010.975554Pg82034.98962
Vg81.010.981124Pg112029.99579
Vg111.051.043618Pg132039.99997
Vg131.051.099908Qs117.316.661652
T6–91.0780.930013Qs4−17.455.704899
T6–101.0690.900445Vc210.981841
T4–121.0320.900137Vc310.90435
T28–271.0680.900415Vc511.087169
Qc101916.29461Vc611.08373
Qc1200.287574Ps225.746.568036
Qc1500.13763Ps352.5320.83097
Qc1707.530908Ps540.4415.98558
Qc2003.03858Ps618.4512.34799
Qc2109.415924Vdc,11.061.099742
Qc2301.233828Vdc,41.061.099997
Qc244.37.06592ECFs ($/h)975.641044.197
Qc2900.160811ETLs (MW)11.92368.582753
Pg1105.3256.99738243
Table 5. Comparative results of the IEEE 30-bus network for the minimization of the ETLs.
MethodETLs (MW)
Proposed TLBA8.5827
MRFO [30]8.5704
IMPO [34]8.66
MPO [56]8.75
MVO [34]9.005
PSO [56]9.078
CSA [30]9.57
Table 6. Success rate of the proposed TLBA for the minimization of the ETLs of the IEEE 30-bus network.
At 50% Convergence
Iterations = 150
At 66.67% Convergence
Iterations = 200
At 83.33% Convergence
Iterations = 250
At 100% Convergence
Iterations = 300
|Best-worst| (MW)0.22740.18650.19670.1880
|Best-worst| (%)2.63572.16702.28922.1910
Success rateTolerance of 1%53.33%100%100%100%
Tolerance of 0.75%33.33%86.67%100%100%
Tolerance of 0.5%6.67%53.33%100%100%
Tolerance of 0.25%0%6.67%60%100%
Table 7. Simulation results of TLBA for the minimization of the TFCs of the IEEE 57-bus network.
VariablesInitialTLBAVariablesInitialTLBA
Vg11.010.987674Tap 9–550.941.01373
Vg21.010.986699Qc181012.9268
Vg31.010.988601Qc255.97.510958
Vg61.011.006765Qc536.312.06029
Vg81.011.027091Pg1502.84141.9835
Vg91.010.992088Pg2085.46196
Vg121.010.982979Pg34045.14887
Tap 4–180.970.90711Pg6080.09542
Tap 4–180.9780.915543Pg8450455.9096
Tap 21–201.0430.968473Pg9099.83689
Tap 24–2510.950536Pg12310363.1258
Tap 24–2510.947538Qs117.315.636424
Tap 24–261.0431.1Vc210.96259
Tap 7–290.9671.040925Vc310.967439
Tap 34–320.9750.943351Vc410.975098
Tap 11–410.9550.90019Vc510.964904
Tap 15–450.9550.91526Ps225.474.062106
Tap 14–460.90.912562Ps352.53−5.37369
Tap 10–510.930.92415Ps4−59.91−43.1476
Tap 13–490.8950.900441Ps5−59.9116.62977
Tap 11–430.9580.900242Vdc,111.081541
Tap 40–560.9580.973081ECFs ($/h)53673.141894.89
Tap 39–570.980.952192ETLs (MW)52.0420.00579
Table 8. Comparative results for the minimization of the TFCs of the IEEE 57-bus network.
MethodECFs ($/h)
Proposed TLBA41,894.89
IMPO [17]41,920.67
MRFO [30]41,923.6
MPO [17]41,987.91
PSO [30]41,932.8
MVO [17]43,628.05
CSA [30]42,050.2
Table 9. Simulation results of TLBA for the minimization of the ETLs of the IEEE 57-bus network.
VariablesInitialTLBAVariablesInitialTLBA
Vg11.010.977438Tap 9–550.940.994384
Vg21.010.971793Qc181011.94515
Vg31.010.979725Qc255.915.53356
Vg61.010.978621Qc536.313.19981
Vg81.010.988716Pg1502.84185.6365
Vg91.010.966121Pg200.829644
Vg121.010.971125Pg340139.896
Tap 4–180.970.904931Pg6099.99999
Tap 4–180.9780.910205Pg8450322.511
Tap 21–201.0430.983688Pg9099.99899
Tap 24–2511.037482Pg12310409.9903
Tap 24–2510.936694Qs117.31−2.29511
Tap 24–261.0431.090701Vc210.955538
Tap 7–290.9671.002518Vc310.962063
Tap 34–320.9750.926401Vc410.969298
Tap 11–410.9550.900318Vc510.964268
Tap 15–450.9550.905755Ps225.474.210106
Tap 14–460.90.905533Ps352.53−3.32897
Tap 10–510.930.912182Ps4−59.91−41.8902
Tap 13–490.8950.900007Ps5−59.9117.64526
Tap 11–430.9580.900157Vdc,111.084429
Tap 40–560.9580.998685ECFs ($/h)53673.144894.97
Tap 39–570.980.977515ETLs (MW)52.0415.6711
Table 10. Comparative results for the minimization of the ETLs of the IEEE 57-bus network.
MethodETLs (MW)
Proposed TLBA15.6711
IMPO [17]16.10132
MRFO [30]16.82
MPO [17]16.20859
PSO [30]17.337
CSA [30]18.635
Publisher’s Note: MDPI stays neutral with regard to jurisdictional claims in published maps and institutional affiliations.

