
A Novel Tree Ensemble Model to Approximate the Generalized Extreme Value Distribution Parameters of the PM2.5 Maxima in the Mexico City Metropolitan Area

 and
and
Abstract
:1. Introduction
2. Materials and Methods
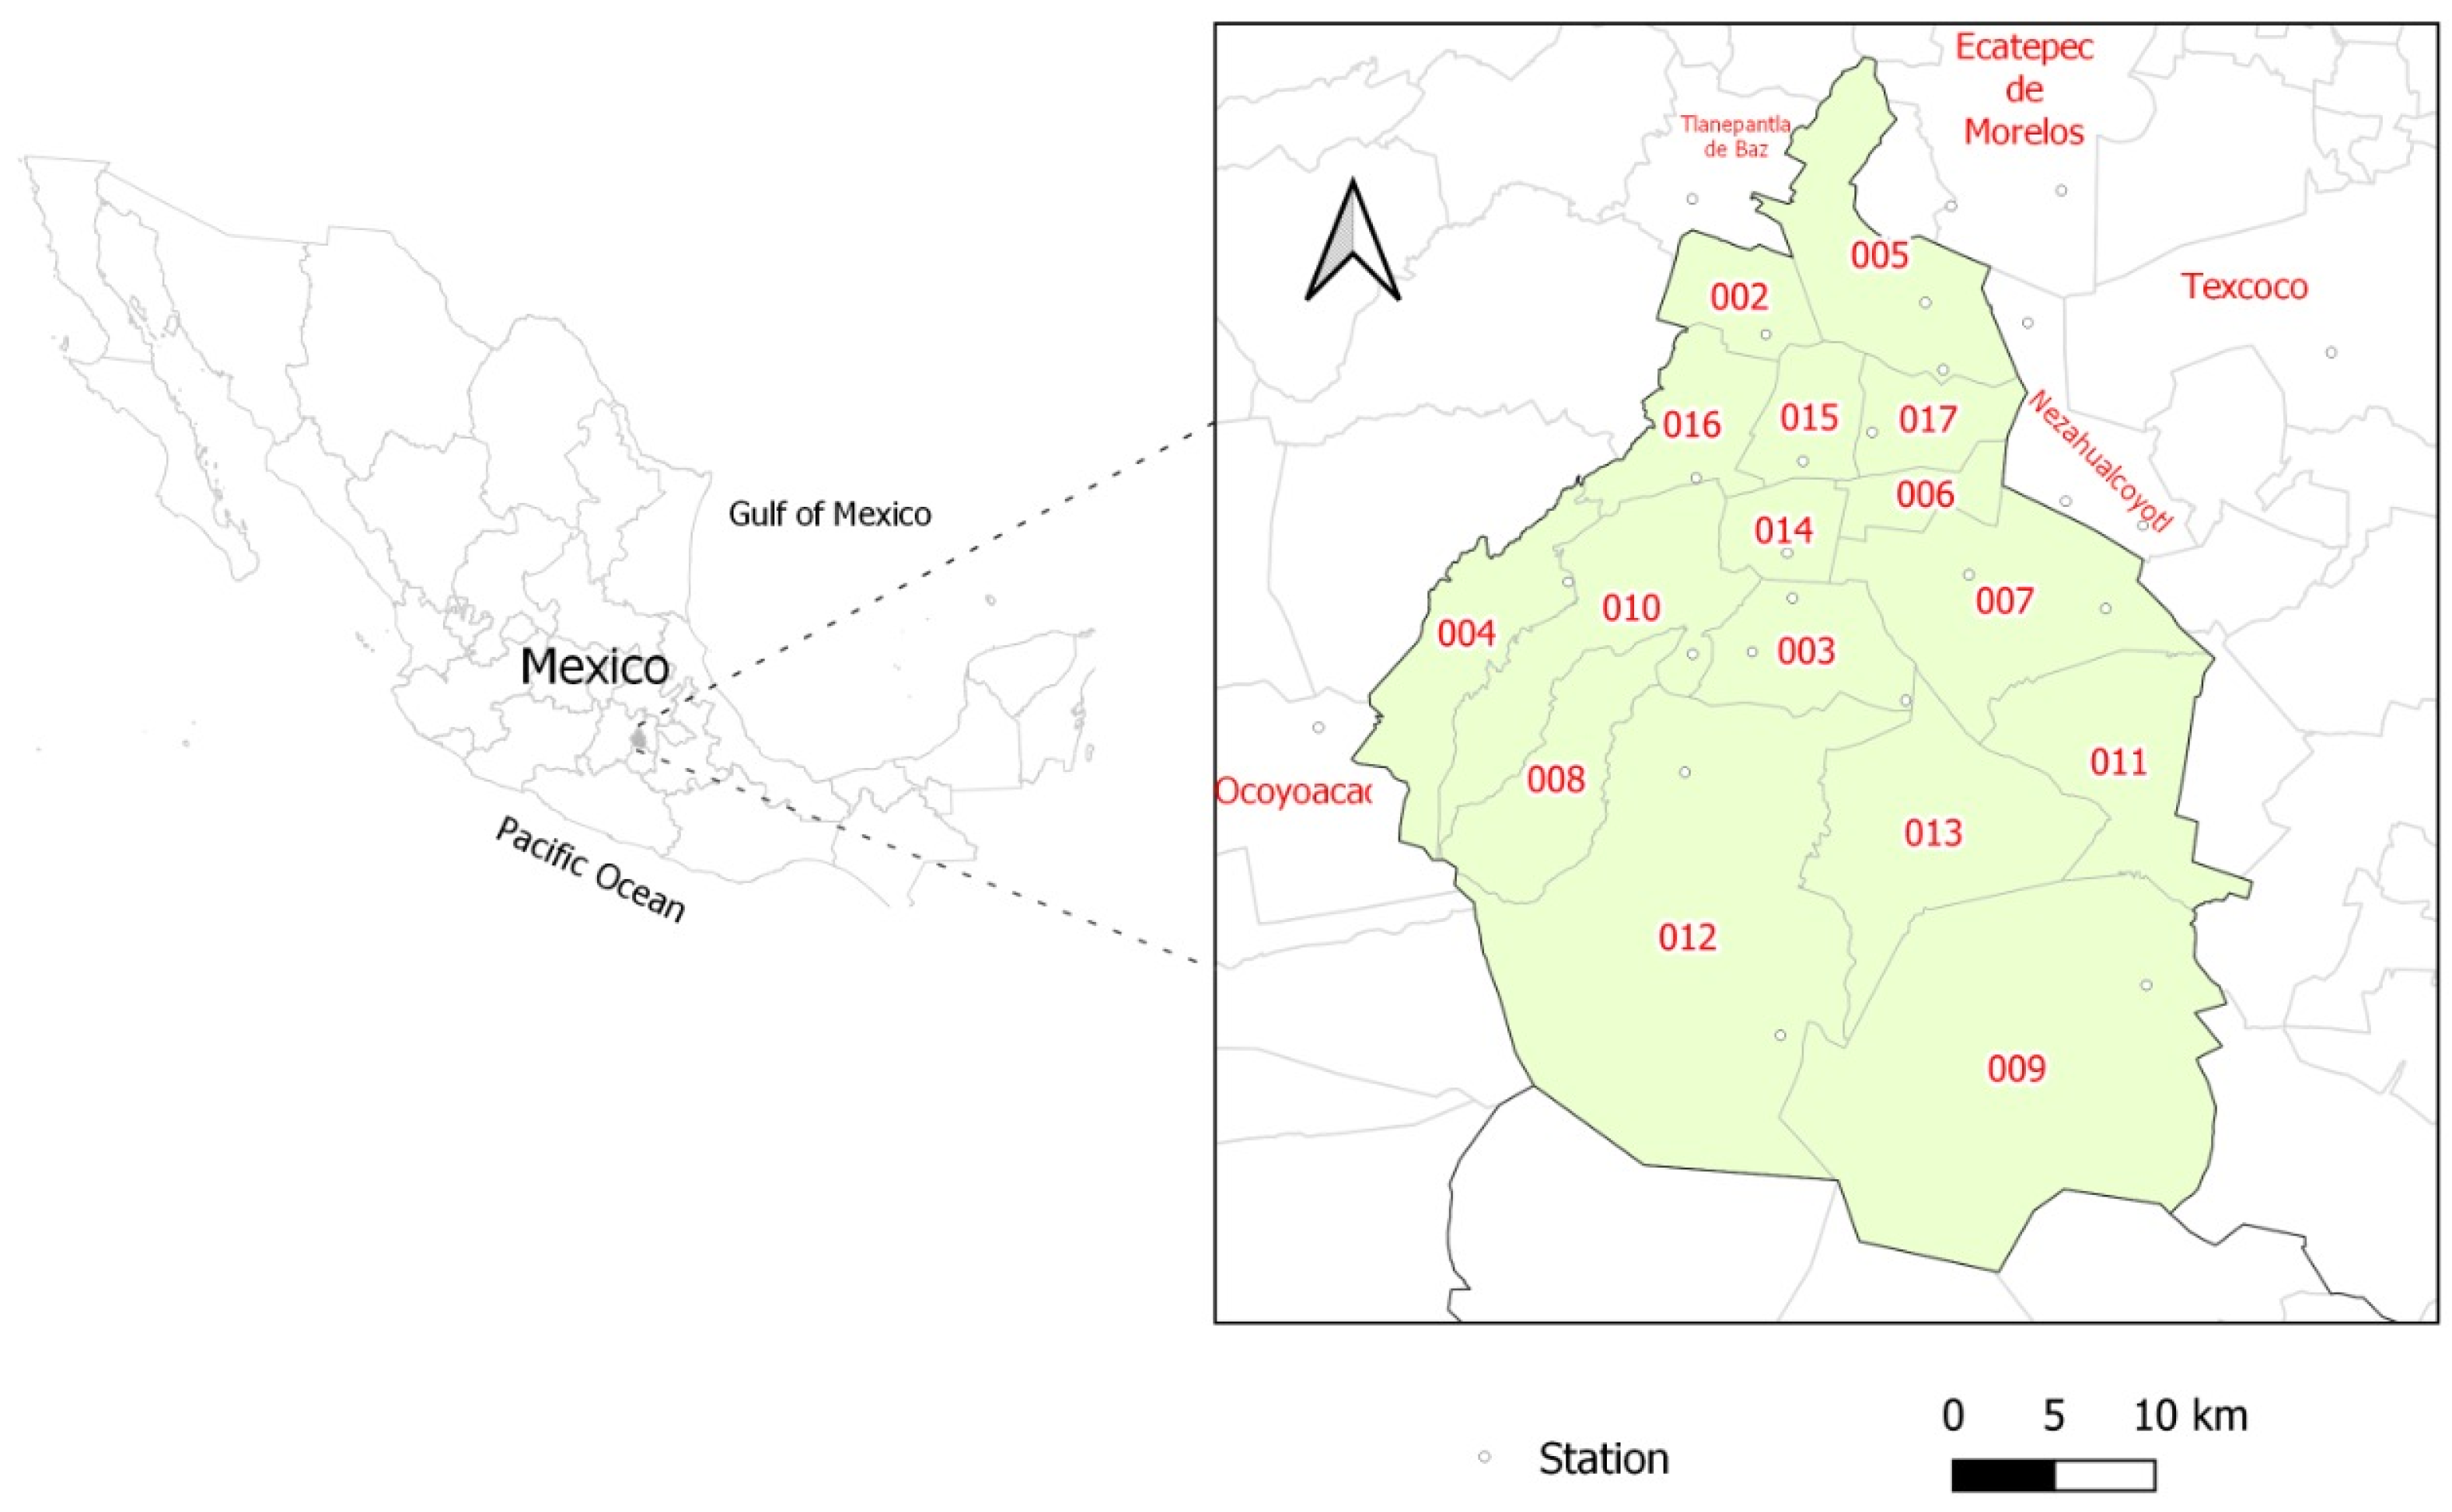
2.1. Study Area
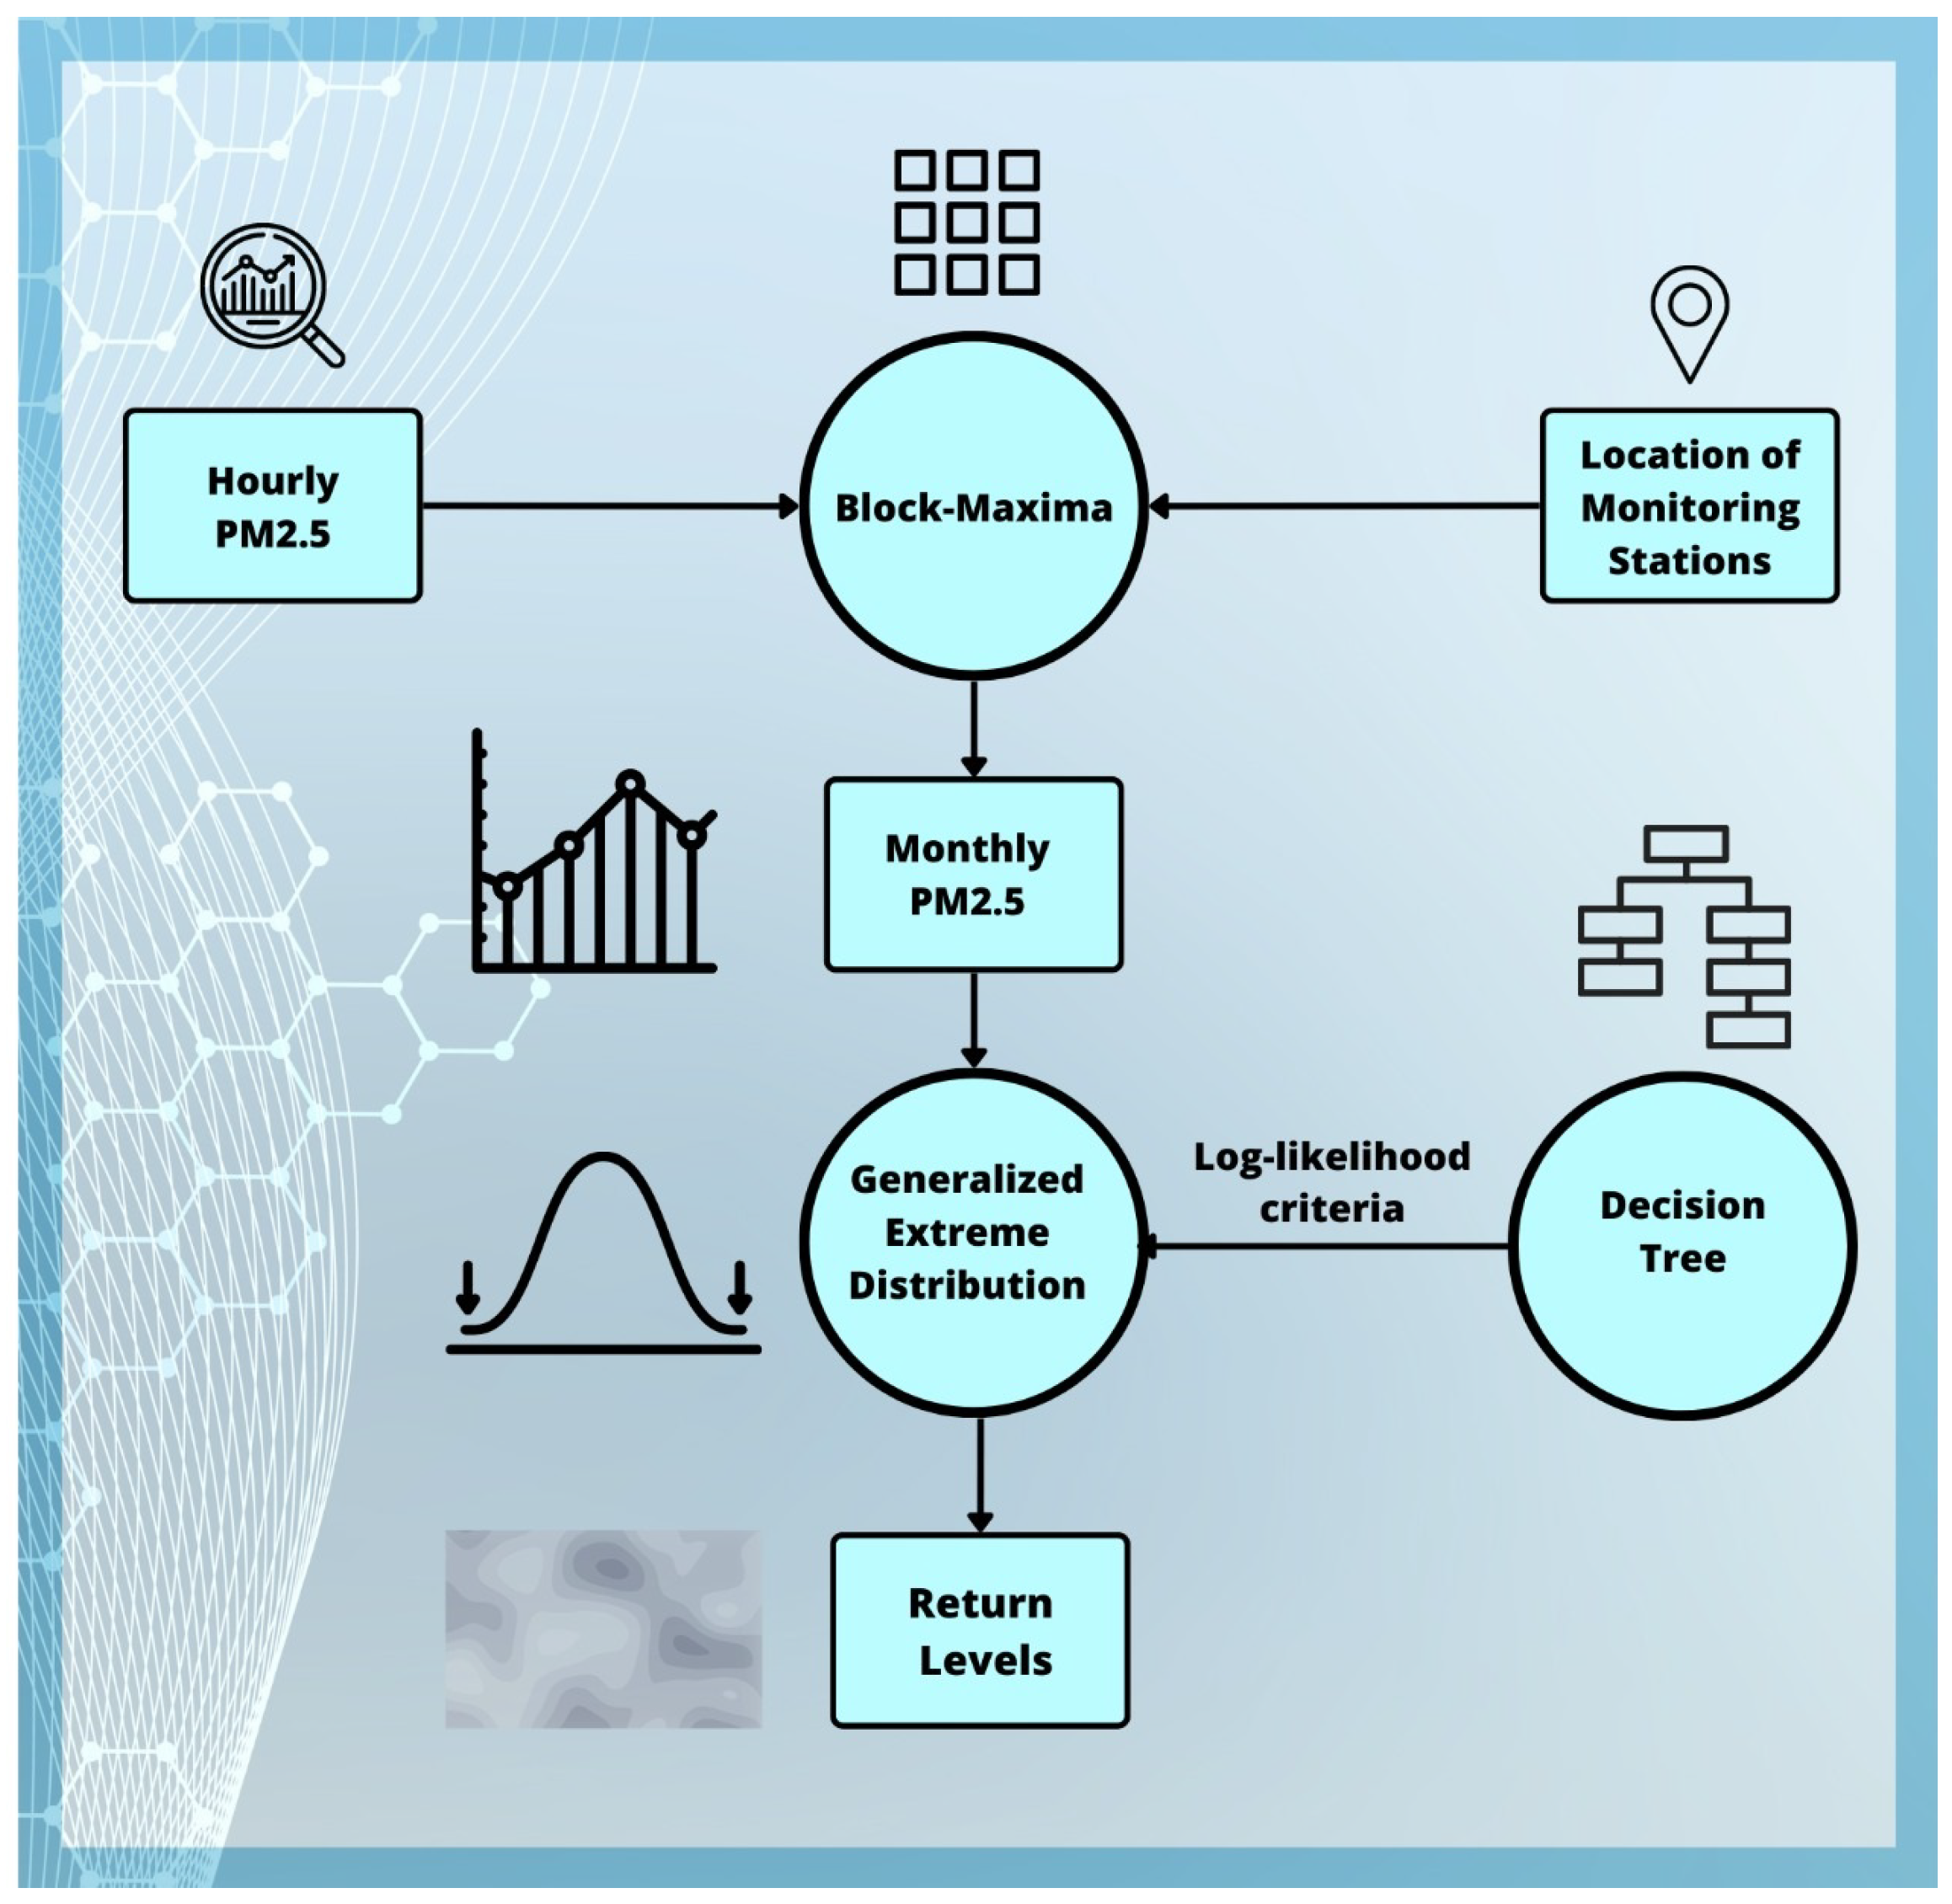
2.2. Methodology
The GEV Distribution
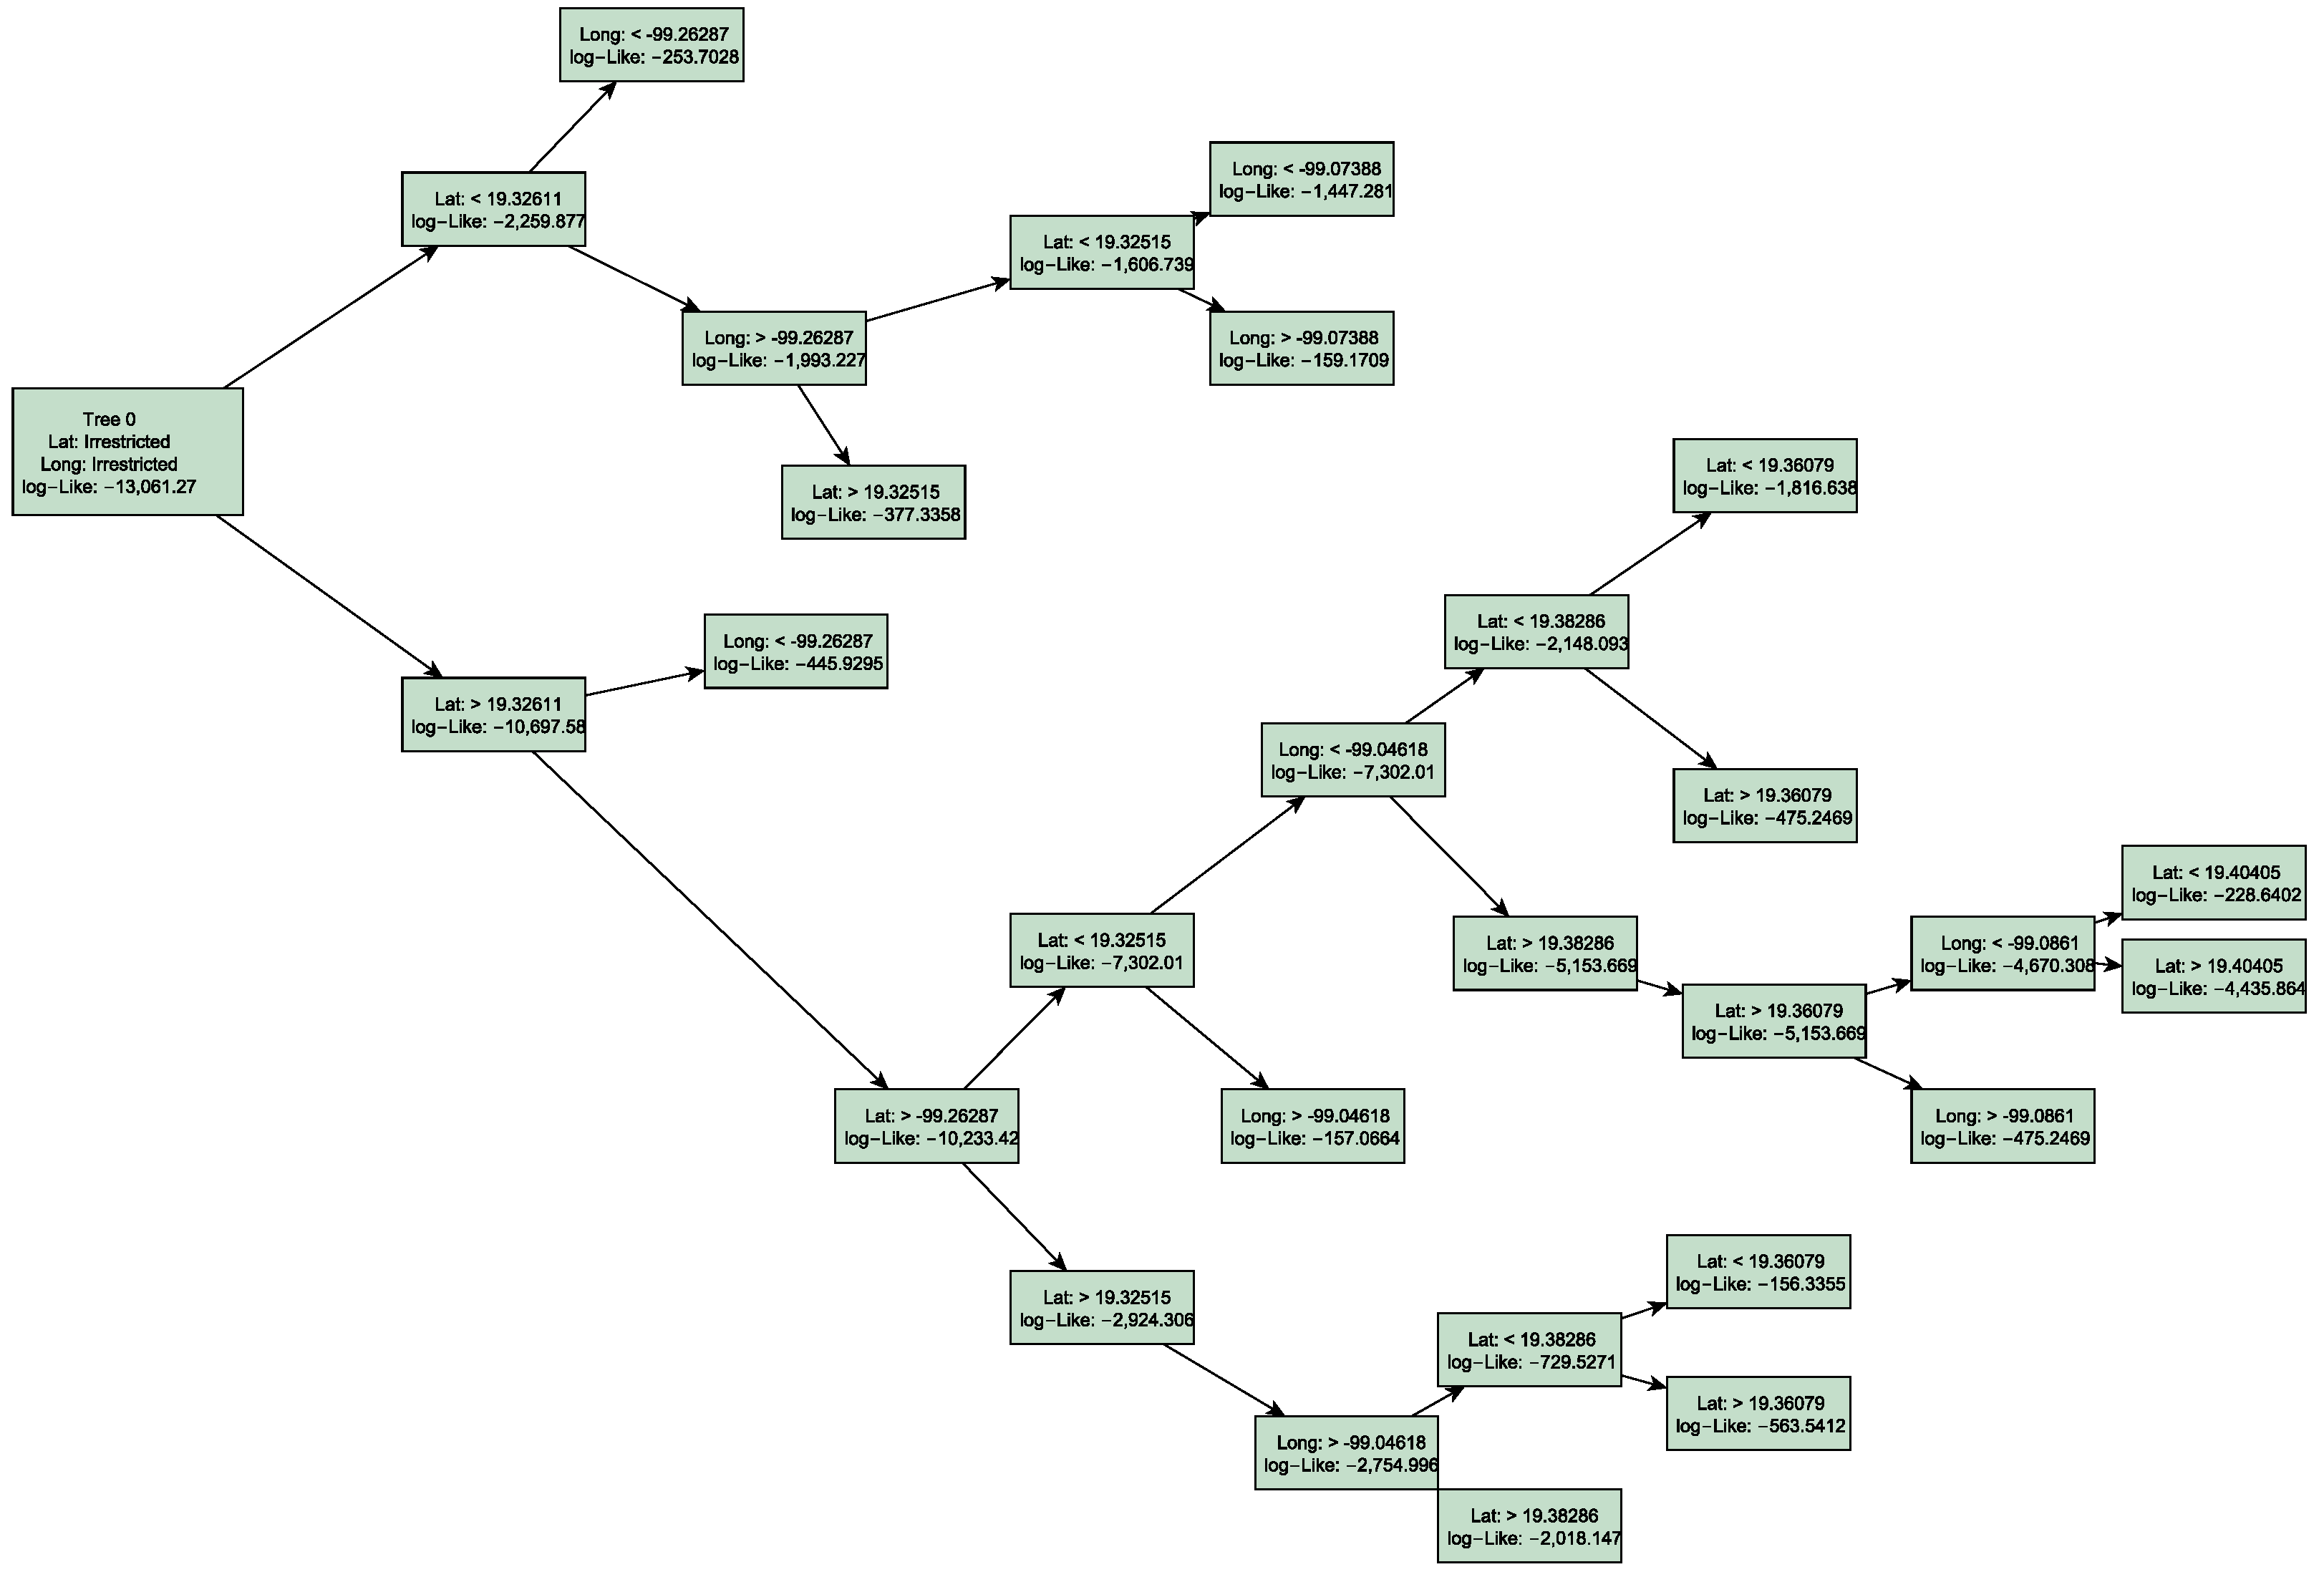
2.3. Proposed Approach
Likelihood Function
2.4. Data Analysis
2.5. Data Collection
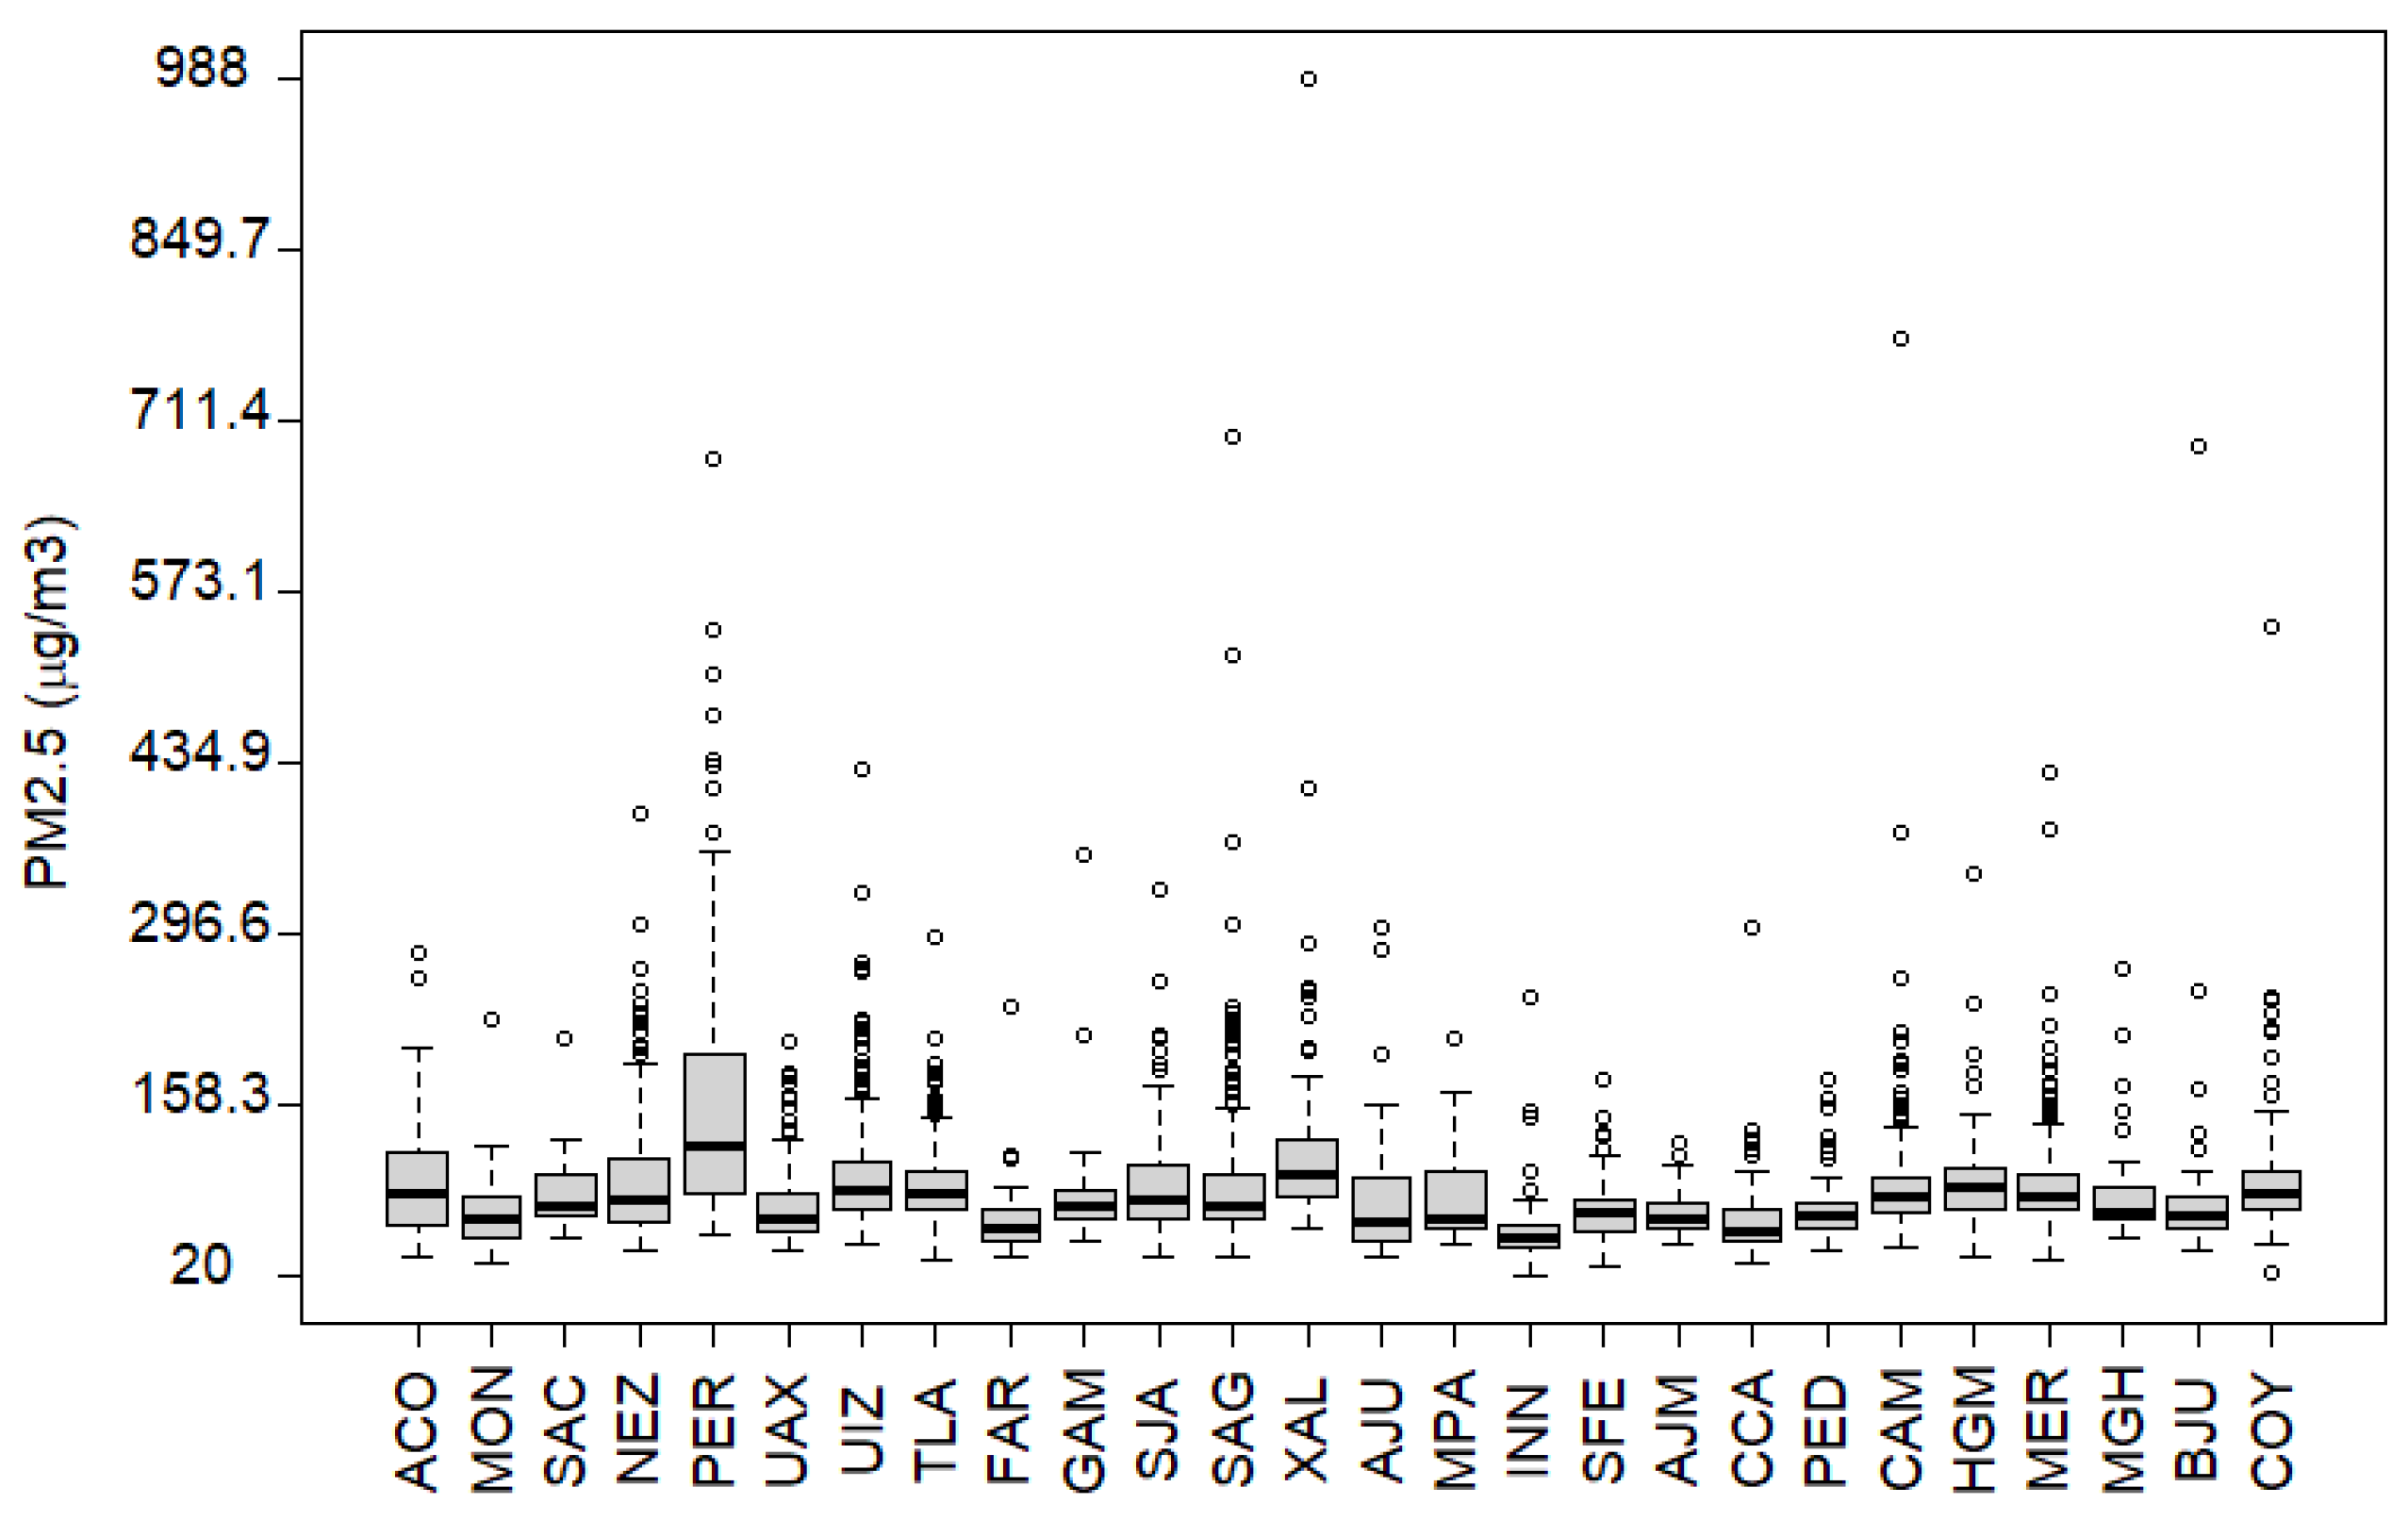
3. Results and Discussion
| Algorithm 1 Greedy stagewise algorithm for split finding |
| Input: I, initial instance set |
| 1: for i in I |
| 2: for j in J |
| 3: |
| 4: |
| 5: score ← L+R |
| 6: end for |
| 7: end for |
| Output: Split with max score |
4. Conclusions
Author Contributions
Funding
Institutional Review Board Statement
Informed Consent Statement
Data Availability Statement
Acknowledgments
Conflicts of Interest
Abbreviations
| AIC | Akaike’s information criterion |
| CDMX | Ciudad de México |
| EVT | Extreme value theory |
| GEV | Generalized extreme value |
| RAMA | Red Automática de Monitoreo Atmosférico |
| SIMAT | Sistema de Monitoreo Atmosférico |
| SEDEMA | Secretaría del Medio Ambiente |
References
- United States Environmental Protection Agency. The Particle Pollution Report: Current Understanding of Air Quality and Emissions through 2003. Report No. EPA 454-R-04-002. Office of Air Quality Planning and Standards Emissions, Monitoring, and Analysis Division Research Triangle Park, North Carolina. 2004. Available online: https://www.epa.gov/sites/default/files/2017-11/documents/pp_report_2003.pdf (accessed on 10 June 2022).
- Nemery, B.; Hoet, P.H.; Nemmar, A. The Meuse Valley fog of 1930: An air pollution disaster. Lancet 2001, 357, 704–708. [Google Scholar] [CrossRef]
- Orru, H.; Maasikmets, M.; Lai, T.; Tamm, T.; Kaasik, M.; Kimmel, V.; Orru, K.; Merisalu, E.; Forsberg, B. Health impacts of particulate matter in five major Estonian towns: Main sources of exposure and local differences. Air Qual. Atmos. Health 2010, 4, 247–258. [Google Scholar] [CrossRef]
- Xing, Y.F.; Xu, Y.H.; Shi, M.H.; Lian, Y.X. The impact of PM2.5 on the human respiratory system. J. Thorac. Dis. 2016, 8, E69–E74. [Google Scholar] [CrossRef] [PubMed]
- Huynh, M.; Woodruff, T.J.; Parker, J.D.; Schoendorf, K.C. Relationships between air pollution and preterm birth in California. Paediatr. Perinat. Epidemiol. 2006, 20, 454–461. [Google Scholar] [CrossRef] [PubMed]
- de Oliveira, B.F.A.; Ignotti, E.; Artaxo, P.; do Nascimento Saldiva, P.H.; Junger, W.L.; Hacon, S. Risk assessment of PM2.5 to child residents in Brazilian Amazon region with biofuel production. Environ. Health 2012, 11, 64. [Google Scholar] [CrossRef] [PubMed] [Green Version]
- Martinelli, N.; Girelli, D.; Cigolini, D.; Sandri, M.; Ricci, G.; Rocca, G.; Olivieri, O. Access Rate to the Emergency Department for Venous Thromboembolism in Relationship with Coarse and Fine Particulate Matter Air Pollution. PLoS ONE 2012, 7, e34831. [Google Scholar] [CrossRef] [Green Version]
- Pope, C.A., III; Burnett, R.T.; Thun, M.J.; Calle, E.E.; Krewski, D.; Ito, K.; Thurston, G.D. Lung Cancer, Cardiopulmonary Mortality, and Long-term Exposure to Fine Particulate Air Pollution. JAMA 2002, 287, 1132. [Google Scholar] [CrossRef] [PubMed] [Green Version]
- Turner, M.C.; Krewski, D.; Pope, C.A.; Chen, Y.; Gapstur, S.M.; Thun, M.J. Long-term Ambient Fine Particulate Matter Air Pollution and Lung Cancer in a Large Cohort of Never-Smokers. Am. J. Respir. Crit. Care Med. 2011, 184, 1374–1381. [Google Scholar] [CrossRef] [PubMed] [Green Version]
- Zanobetti, A.; Franklin, M.; Koutrakis, P.; Schwartz, J. Fine particulate air pollution and its components in association with cause-specific emergency admissions. Environ. Health 2009, 8, 58. [Google Scholar] [CrossRef] [PubMed] [Green Version]
- Hinojosa-Baliño, I.; Infante-Vázquez, O.; Vallejo, M. Distribution of PM2.5 Air Pollution in Mexico City: Spatial Analysis with Land-Use Regression Model. Appl. Sci. 2019, 9, 2936. [Google Scholar] [CrossRef] [Green Version]
- Aguirre-Salado, A.I.; Vaquera-Huerta, H.; Aguirre-Salado, C.A.; Reyes-Mora, S.; Olvera-Cervantes, A.D.; Lancho-Romero, G.A.; Soubervielle-Montalvo, C. Developing a Hierarchical Model for the Spatial Analysis of PM10 Pollution Extremes in the Mexico City Metropolitan Area. Int. J. Environ. Res. Public Health 2017, 14, 734. [Google Scholar] [CrossRef] [PubMed] [Green Version]
- Chiang, P.W.; Horng, S.J. Hybrid Time-Series Framework for Daily-Based PM2.5 Forecasting. IEEE Access 2021, 9, 104162–104176. [Google Scholar] [CrossRef]
- Geng, G.; Meng, X.; He, K.; Liu, Y. Random forest models for PM2.5 speciation concentrations using MISR fractional AODs. Environ. Res. Lett. 2020, 15, 034056. [Google Scholar] [CrossRef]
- Zhang, C.J.; Dai, L.J.; Ma, L.M. Rolling forecasting model of PM2.5 concentration based on support vector machine and particle swarm optimization. In Proceedings of the International Symposium on Optoelectronic Technology and Application, Beijing, China, 9–11 May 2016; Volume 10156, pp. 387–394. [Google Scholar] [CrossRef]
- Masinde, C.J.; Gitahi, J.; Hahn, M. Training recurrent neural networks for particulate matter concentration prediction. Int. Arch. Photogramm. Remote Sens. Spat. Inf. Sci. 2020, 43, 1575–1582. [Google Scholar] [CrossRef]
- Weissman, I. Estimation of parameters and large quantiles based on the k largest observations. J. Am. Stat. Assoc. 1978, 73, 812–815. [Google Scholar]
- Tawn, J. Bivariate extreme value theory: Models and estimation. Biometrika 1988, 75, 397–415. [Google Scholar] [CrossRef]
- Rosen, O.; Cohen, A. Extreme percentile regression. In Statistical Theory and Computational Aspects of Smoothing: Proceedings of the COMPSTAT ’94 Satellite Meeting, Semmering, Austria, 27–28 August 1994; Härdle, W., Schimek, M.G., Eds.; Physica: Heidelber, Germany, 1996; pp. 27–28. [Google Scholar]
- Yee, T.W.; Stephenson, A.G. Vector generalized linear and additive extreme value models. Extremes 2007, 10, 1–19. [Google Scholar] [CrossRef]
- Breiman, L.; Friedman, J.H.; Olshen, R.A.; Stone, C.J. Classification and Regression Trees; Routledge: London, UK, 2017. [Google Scholar] [CrossRef]
- Chen, T.; Guestrin, C. XGBoost. In Proceedings of the 22nd ACM SIGKDD International Conference on Knowledge Discovery and Data Mining, San Francisco, CA, USA, 13–17 August 2016. [Google Scholar] [CrossRef] [Green Version]
- Friedman, J.H. Greedy Function Approximation: A Gradient Boosting Machine. Ann. Stat. 1999, 29, 1189–1232. [Google Scholar] [CrossRef]
- Coles, S. An Introduction to Statistical Modeling of Extreme Values; Springer: Berlin/Heidelberg, Germany, 2001; Volume 208. [Google Scholar]
- Jenkinson, A.F. The frequency distribution of the annual maximum (or minimum) values of meteorological elements. Q. J. R. Meteorol. Soc. 1955, 81, 158–171. [Google Scholar] [CrossRef]
- Fisher, R.A.; Tippett, L.H.C. Limiting forms of the frequency distribution of the largest or smallest member of a sample. Proc. Camb. Philos. Soc. 1928, 24, 180–190. [Google Scholar] [CrossRef]
- Gumbel, E. Statistics of Extremes; Columbia University Press: New York, NY, USA, 1958. [Google Scholar]


| Block ID | Key | Long | Lat | Min. | 1st Qu. | Median | Mean | 3rd Qu. | Max. |
|---|---|---|---|---|---|---|---|---|---|
| 1 | ACO | −98.9 | 19.6 | 35 | 62.8 | 87 | 100.5 | 117.8 | 281 |
| 14 | AJU | −99.2 | 19.2 | 34 | 47 | 62 | 80.9 | 100 | 302 |
| 19 | CCA | −99.2 | 19.3 | 30 | 48 | 56 | 65.3 | 72 | 302 |
| 16 | INN | −99.4 | 19.3 | 20 | 42.2 | 51 | 58.8 | 59.5 | 246 |
| 18 | AJM | −99.2 | 19.3 | 44 | 57 | 66 | 69.9 | 77.8 | 127 |
| 24 | MGH | −99.2 | 19.4 | 51 | 64.5 | 71 | 86.1 | 90 | 267 |
| 25 | BJU | −99.2 | 19.4 | 41 | 59 | 67 | 83.4 | 83 | 690 |
| 23 | MER | −99.1 | 19.4 | 31 | 72.8 | 84.5 | 94.5 | 101 | 428 |
| 8 | TLA | −99.2 | 19.5 | 33 | 73.5 | 86 | 93 | 104 | 294 |
| 9 | FAR | −99 | 19.5 | 34 | 47.5 | 59 | 68.1 | 72.5 | 236 |
| 22 | HGM | −99.2 | 19.4 | 36 | 74 | 90 | 97.2 | 107 | 346 |
| 20 | PED | −99.2 | 19.3 | 41 | 59 | 69 | 73.8 | 78.5 | 179 |
| 26 | COY | −99.2 | 19.4 | 21 | 72 | 85 | 95.6 | 105 | 544 |
| 3 | SAC | −99 | 19.3 | 50 | 67 | 77 | 84.4 | 98 | 211 |
| 15 | MPA | −99 | 19.2 | 46 | 57 | 65.5 | 84.8 | 103.5 | 211 |
| 11 | SJA | −99.1 | 19.5 | 34 | 65.2 | 81.5 | 95.7 | 110 | 333 |
| 21 | CAM | −99.2 | 19.5 | 43 | 71 | 83 | 95.7 | 99.2 | 777 |
| 2 | MON | −98.9 | 19.5 | 29 | 50 | 65 | 73.3 | 83 | 227 |
| 6 | UAX | −99.1 | 19.3 | 40 | 55 | 66.5 | 78.5 | 86.8 | 209 |
| 17 | SFE | −99.3 | 19.4 | 28 | 56.5 | 70 | 72.9 | 81 | 179 |
| 5 | PER | −99 | 19.4 | 53 | 87 | 125 | 167.2 | 200 | 681 |
| 10 | GAM | −99.1 | 19.5 | 48 | 66 | 75 | 86.4 | 89 | 359 |
| 12 | SAG | −99 | 19.5 | 36 | 65 | 77 | 98.4 | 101.8 | 698 |
| 13 | XAL | −99.1 | 19.5 | 58 | 84 | 101 | 125.3 | 129 | 988 |
| 4 | NEZ | −99 | 19.4 | 39 | 63.2 | 81 | 100.9 | 114 | 393 |
| 7 | UIZ | −99.1 | 19.4 | 44 | 73 | 88 | 101.4 | 110.2 | 429 |
Publisher’s Note: MDPI stays neutral with regard to jurisdictional claims in published maps and institutional affiliations. |
© 2022 by the authors. Licensee MDPI, Basel, Switzerland. This article is an open access article distributed under the terms and conditions of the Creative Commons Attribution (CC BY) license (https://creativecommons.org/licenses/by/4.0/).
Share and Cite
Aguirre-Salado, A.I.; Venancio-Guzmán, S.; Aguirre-Salado, C.A.; Santiago-Santos, A. A Novel Tree Ensemble Model to Approximate the Generalized Extreme Value Distribution Parameters of the PM2.5 Maxima in the Mexico City Metropolitan Area. Mathematics 2022, 10, 2056. https://doi.org/10.3390/math10122056
Aguirre-Salado AI, Venancio-Guzmán S, Aguirre-Salado CA, Santiago-Santos A. A Novel Tree Ensemble Model to Approximate the Generalized Extreme Value Distribution Parameters of the PM2.5 Maxima in the Mexico City Metropolitan Area. Mathematics. 2022; 10(12):2056. https://doi.org/10.3390/math10122056
Chicago/Turabian StyleAguirre-Salado, Alejandro Ivan, Sonia Venancio-Guzmán, Carlos Arturo Aguirre-Salado, and Alicia Santiago-Santos. 2022. "A Novel Tree Ensemble Model to Approximate the Generalized Extreme Value Distribution Parameters of the PM2.5 Maxima in the Mexico City Metropolitan Area" Mathematics 10, no. 12: 2056. https://doi.org/10.3390/math10122056
APA StyleAguirre-Salado, A. I., Venancio-Guzmán, S., Aguirre-Salado, C. A., & Santiago-Santos, A. (2022). A Novel Tree Ensemble Model to Approximate the Generalized Extreme Value Distribution Parameters of the PM2.5 Maxima in the Mexico City Metropolitan Area. Mathematics, 10(12), 2056. https://doi.org/10.3390/math10122056