Alterations in Soluble Class III Peroxidases of Maize Shoots by Flooding Stress

Abstract
:
1. Introduction
2. Experimental
2.1. Plant Material
2.2. Determination of Chlorophyll Concentrations
2.3. Protein Extraction
2.4. Size Exclusion Chromatography
2.5. Gel Electrophoresis
2.6. Peroxidase Detection
2.7. Protein Digestion
2.8. Mass Spectrometry
3. Results and Discussion
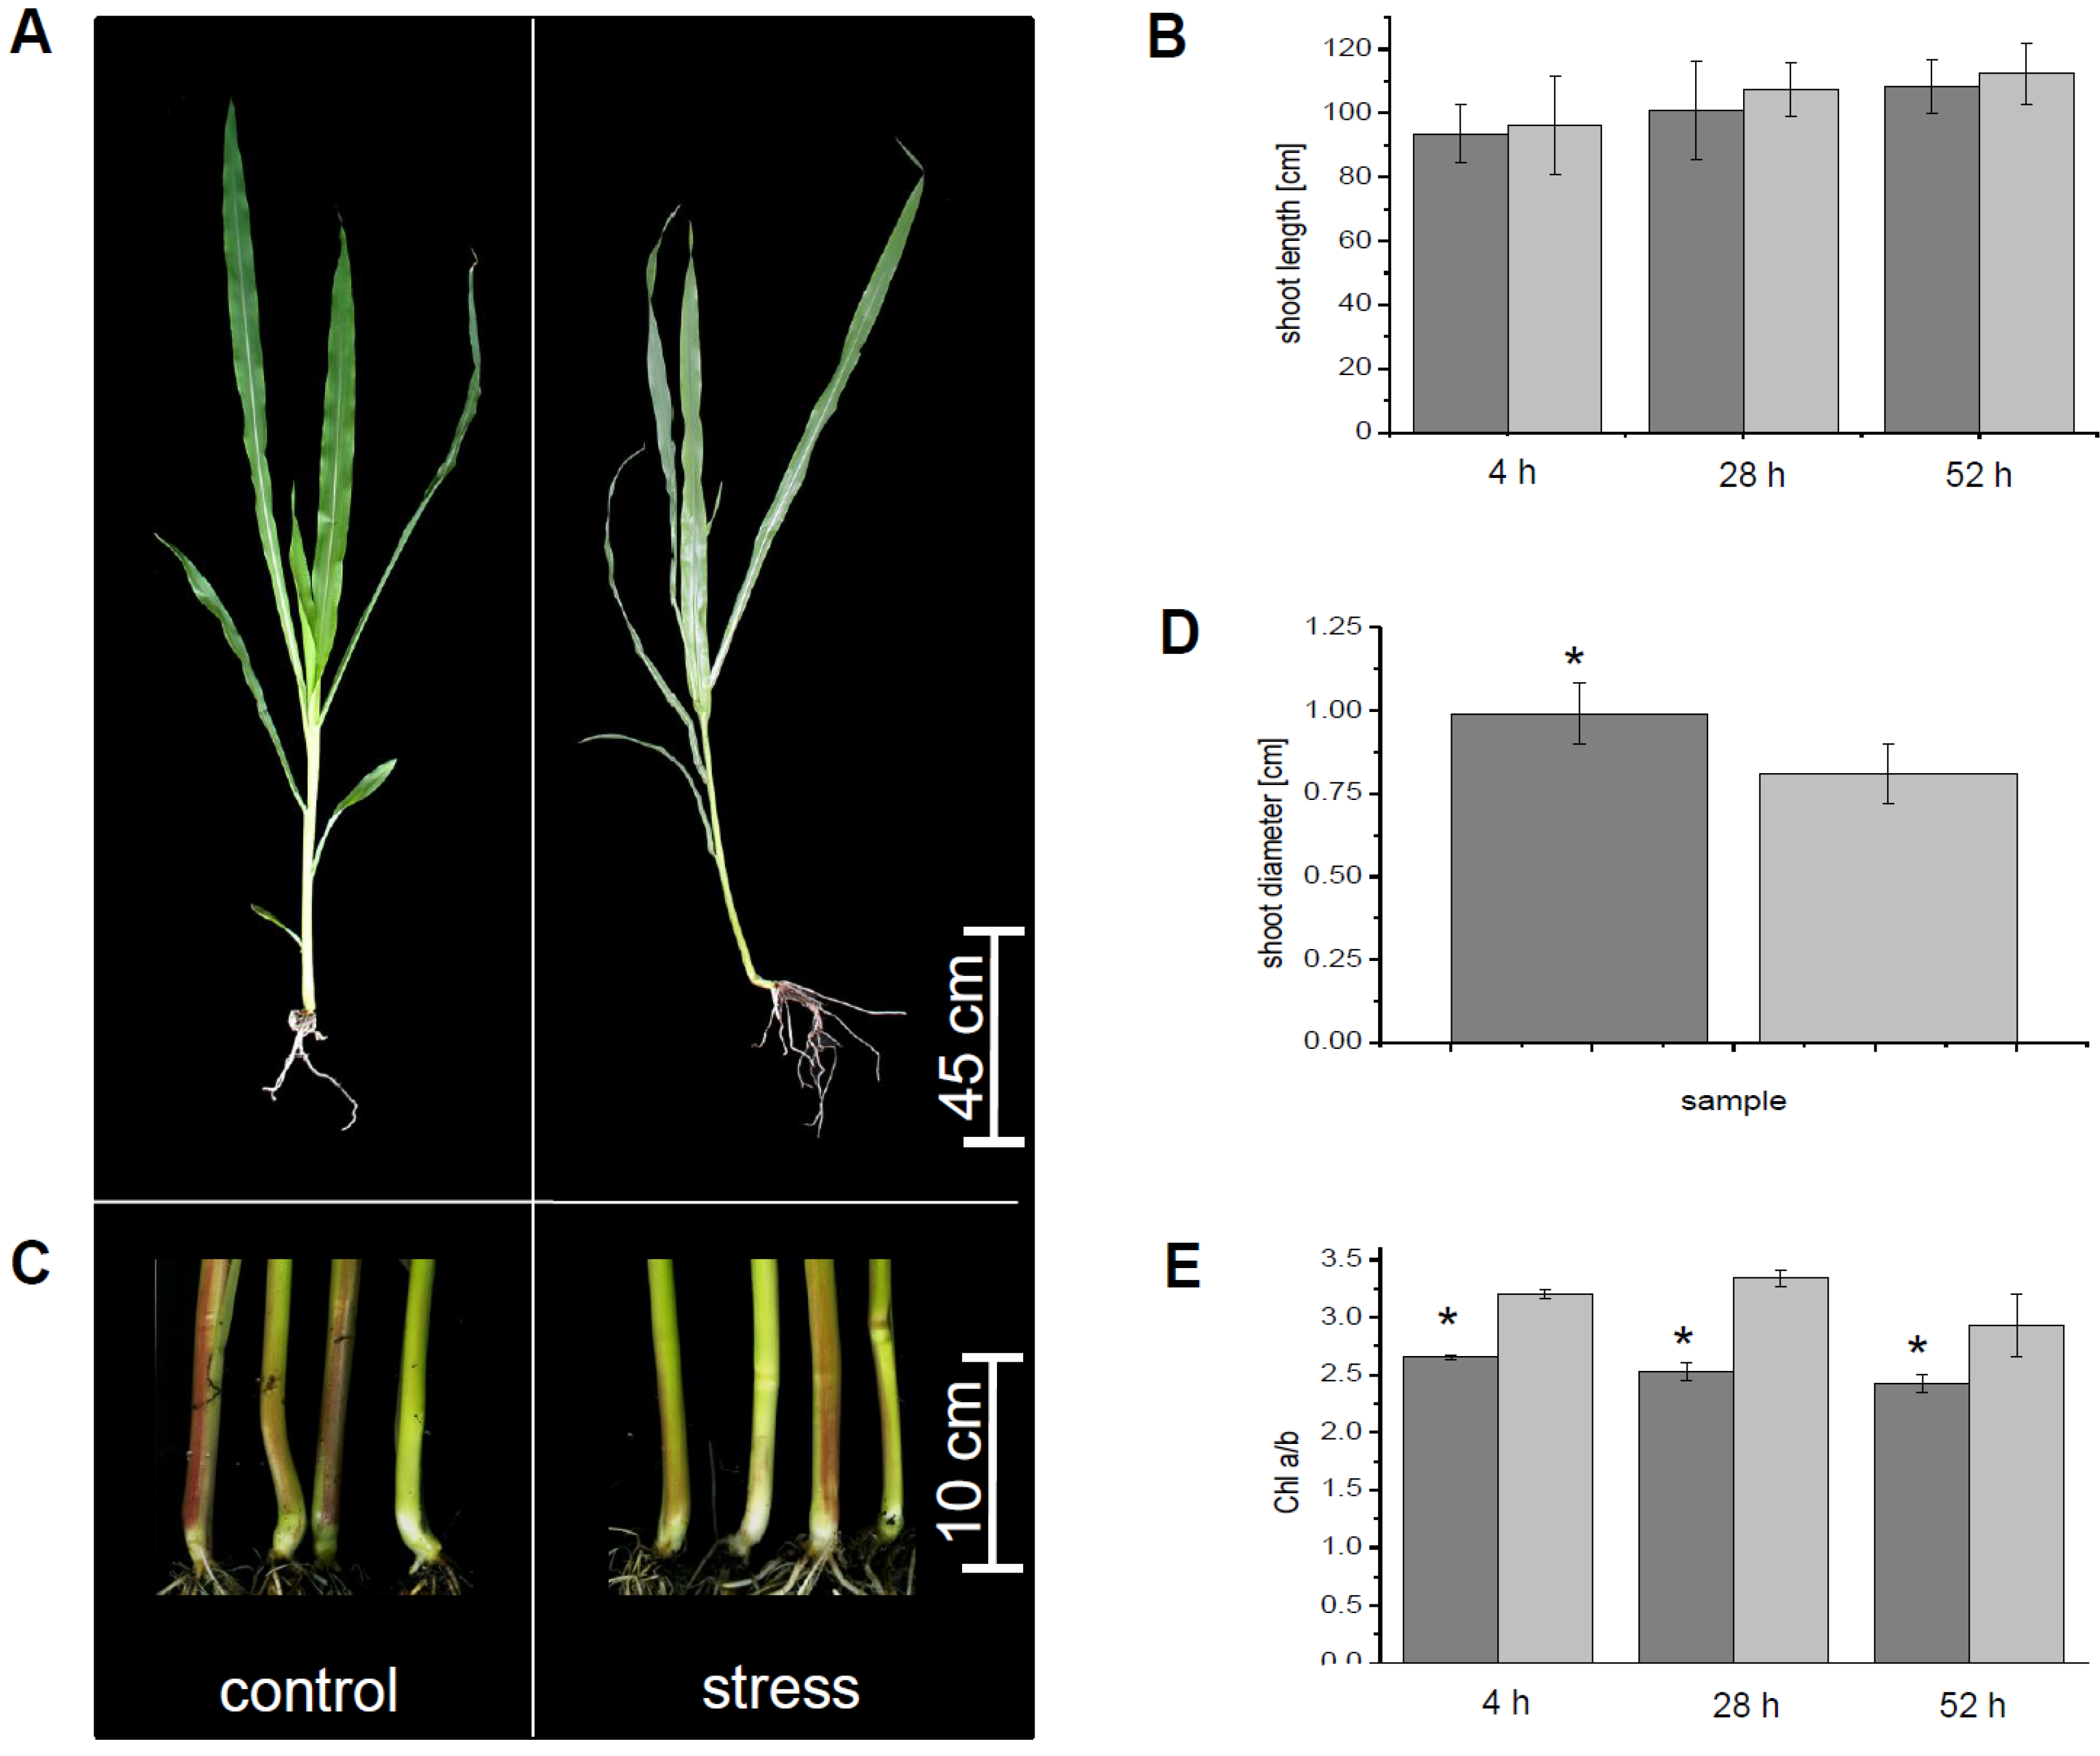
3.1. Physiological Parameters
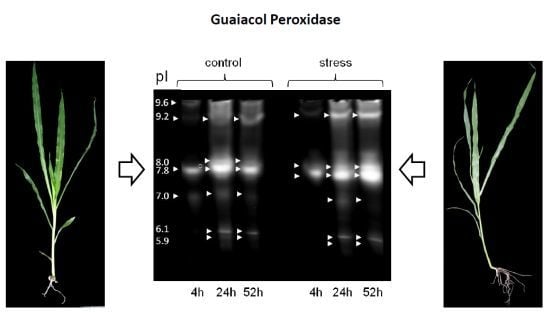
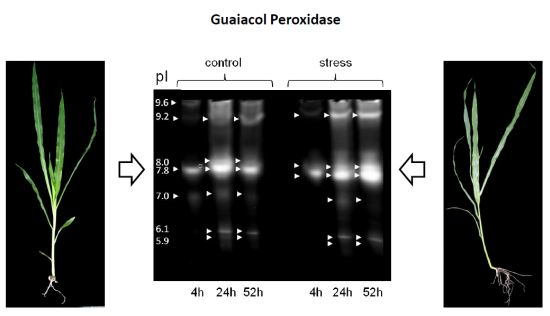
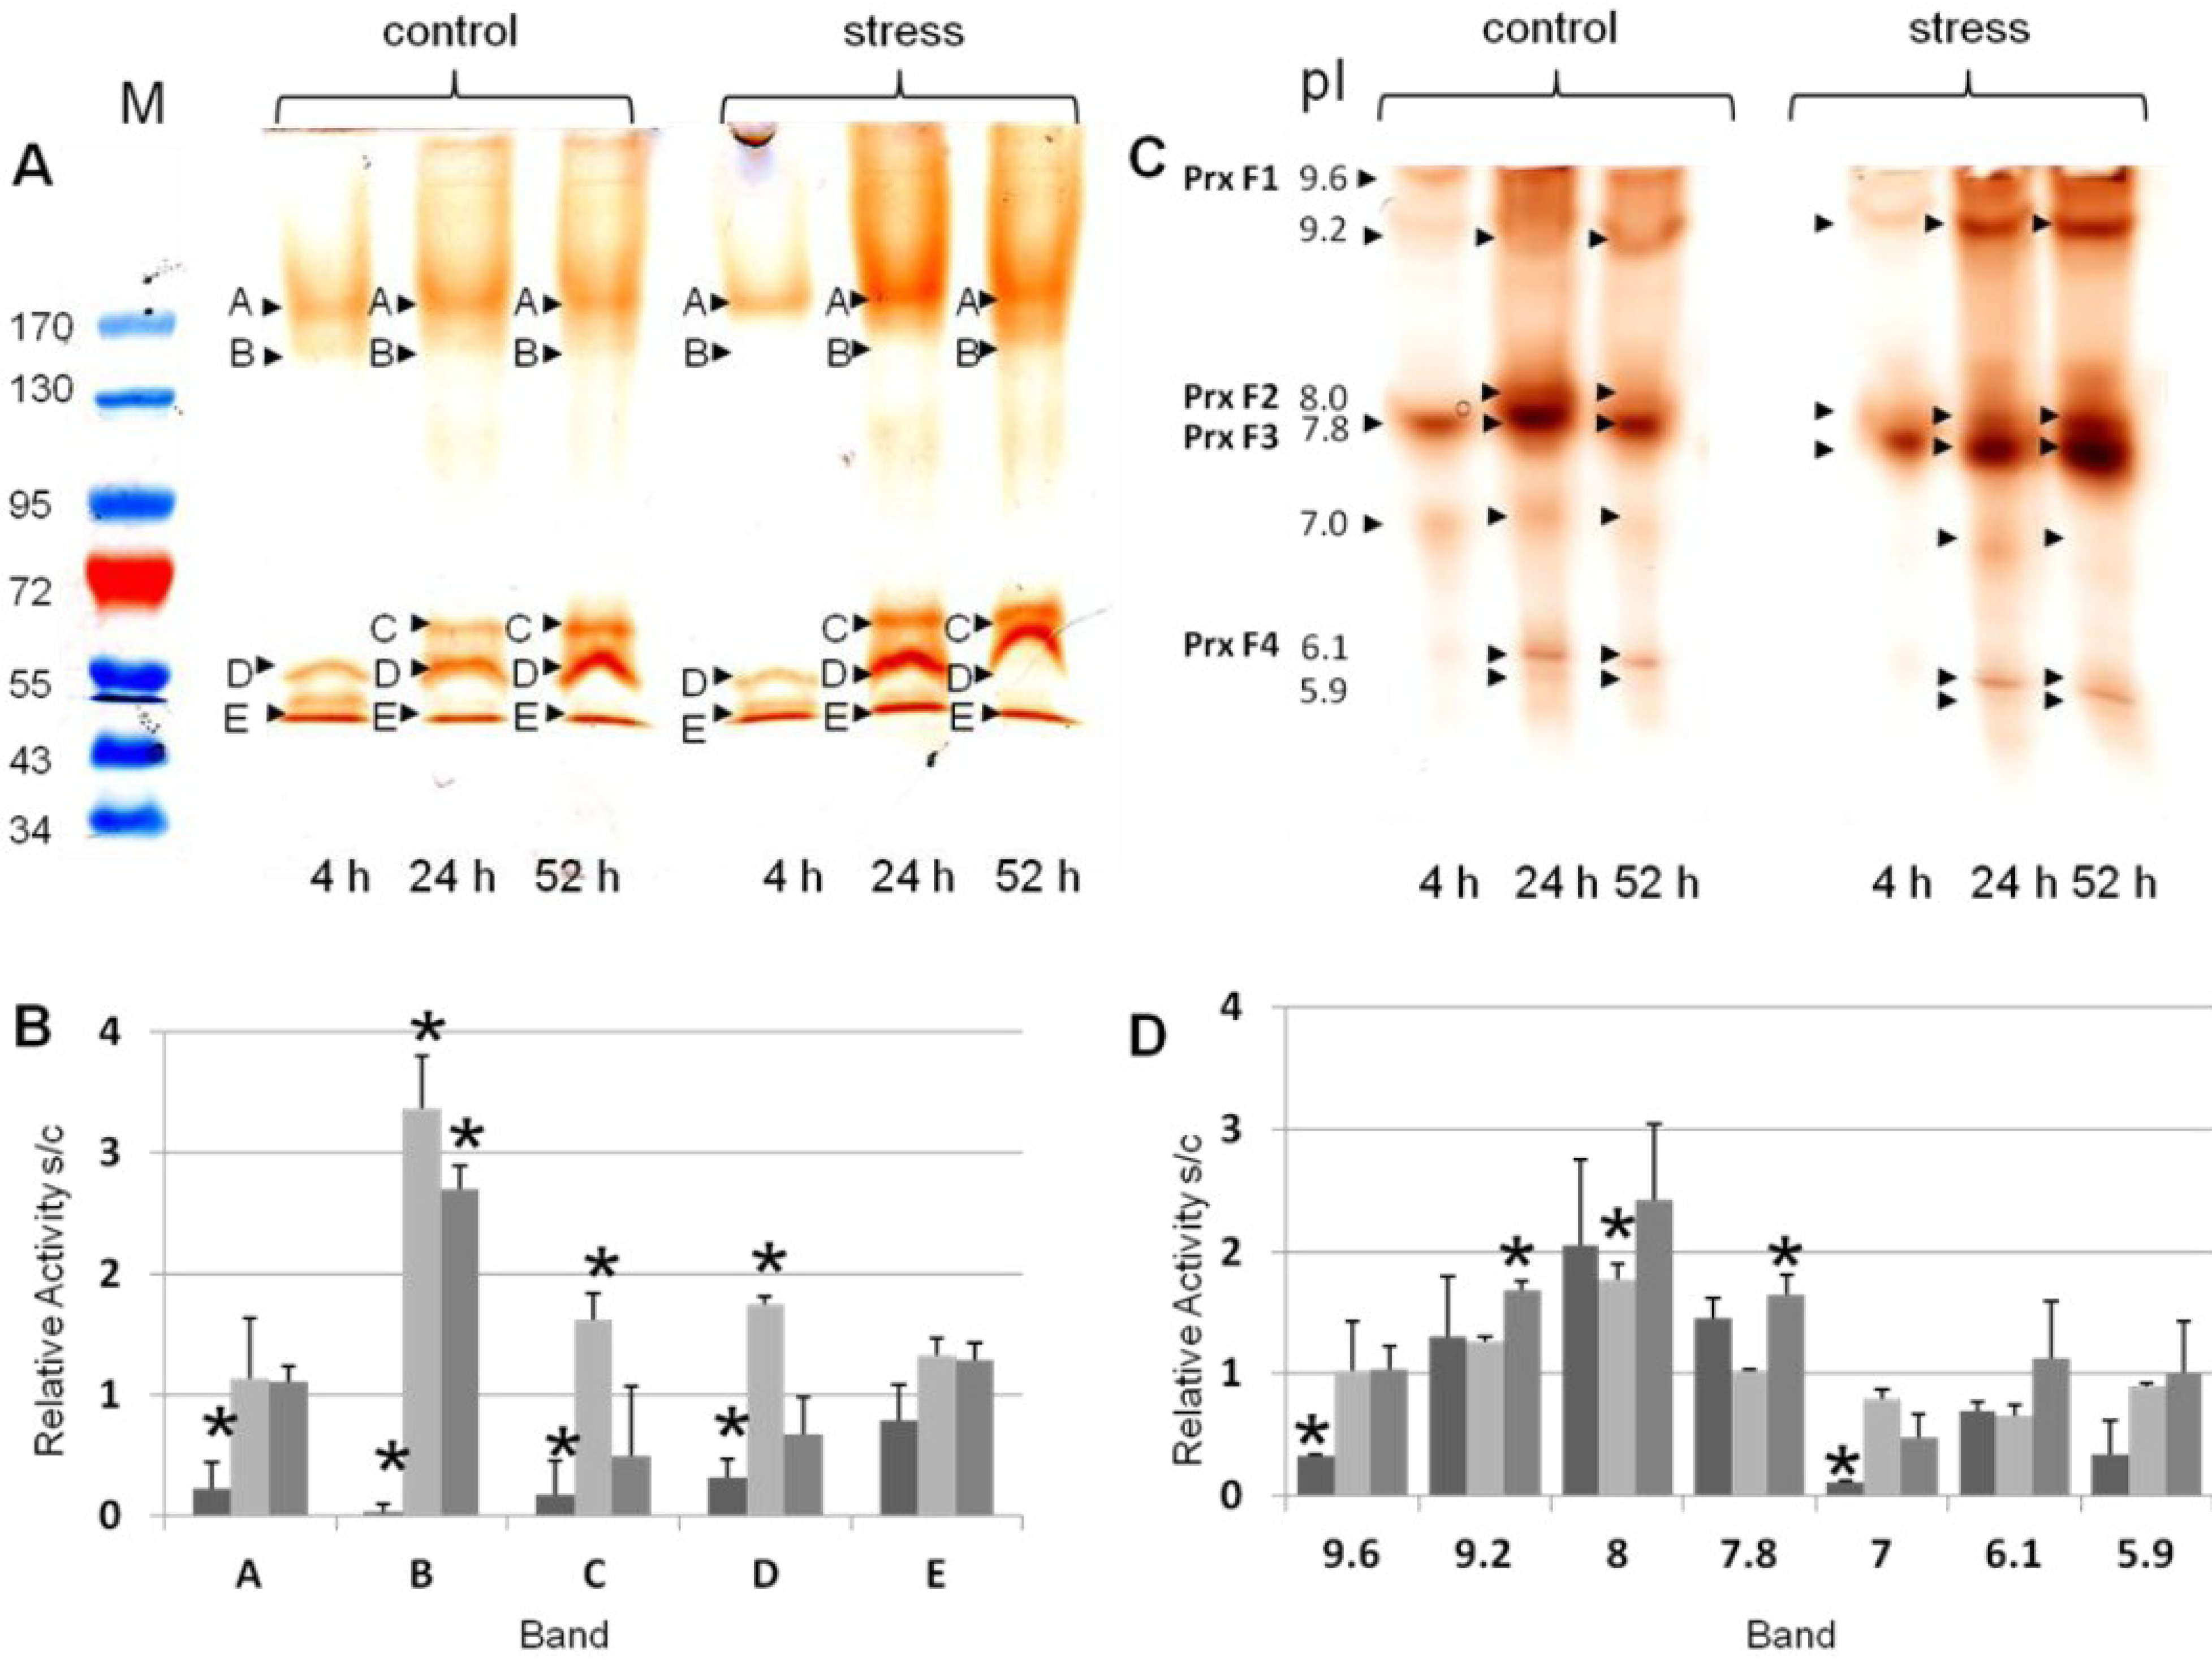
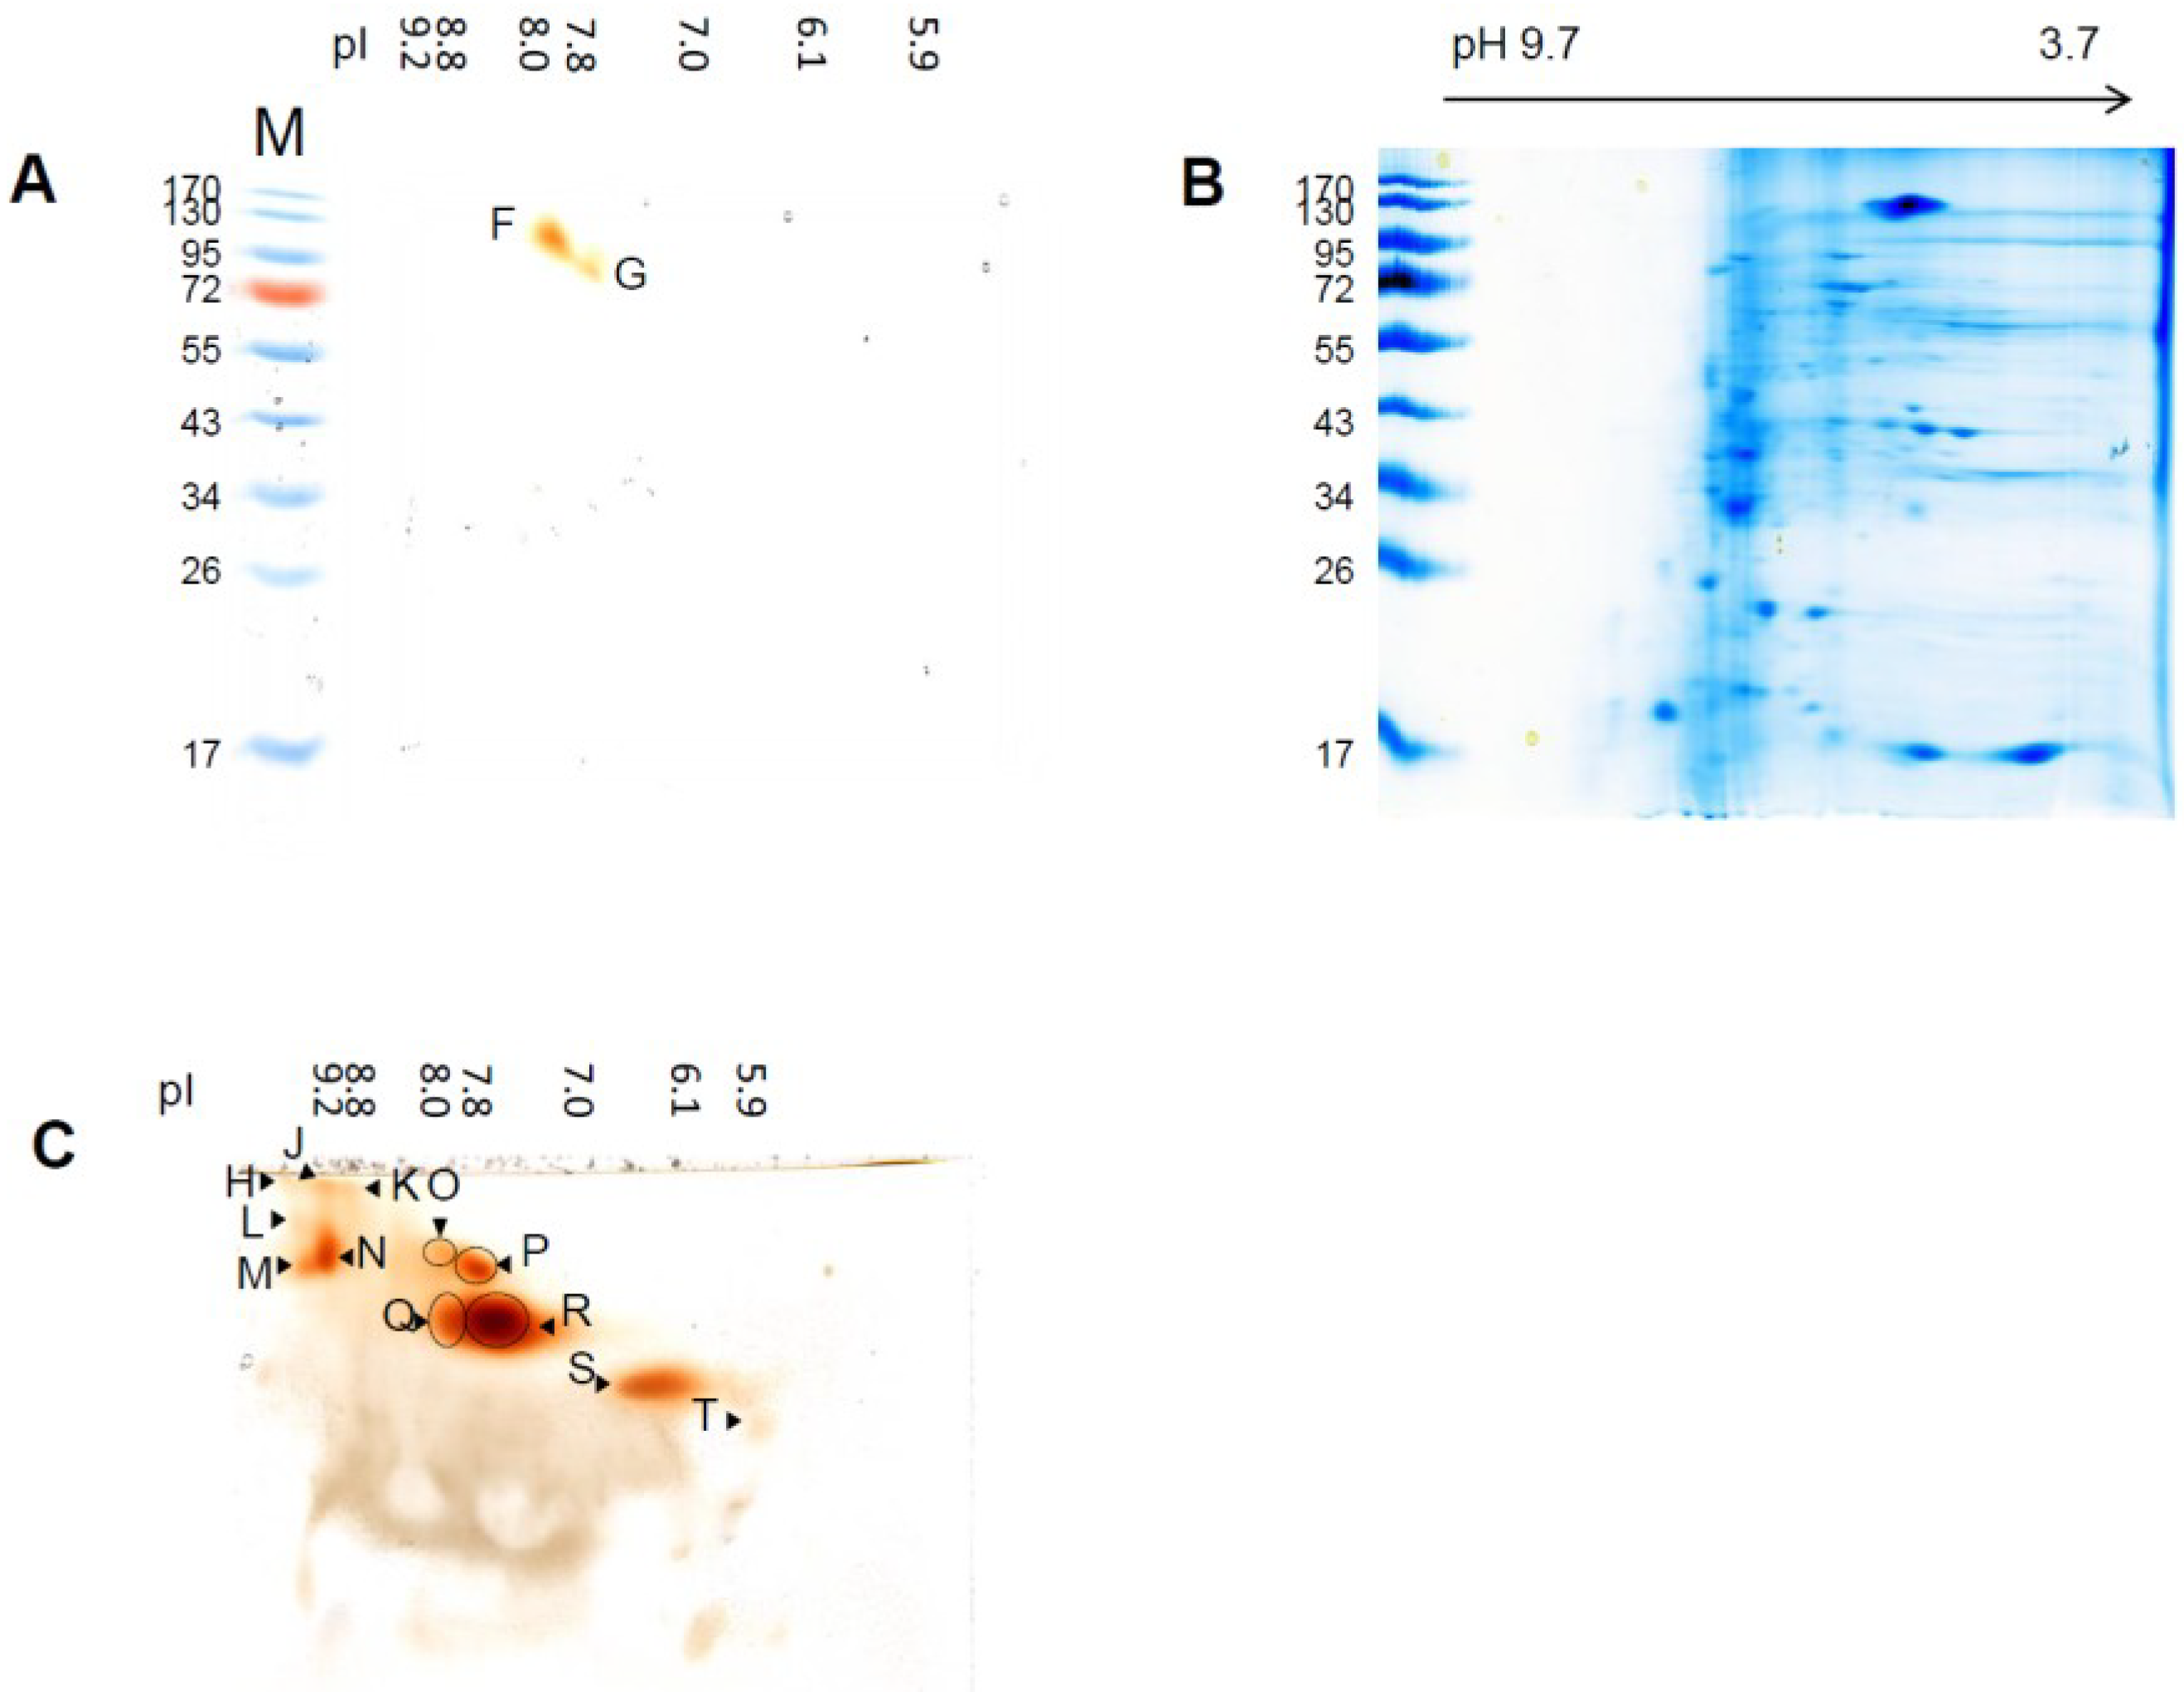
3.2. Differential Regulation of Soluble Peroxidases—1D and 2D PAGE Analysis


| pIex Native IEF | kDa Modified SDS-PAGE 1D | kDa hrCNE |
|---|---|---|
| 9.6 ± 0.3 | 183 ± 7 | 637 ± 7 |
| 9.2 ± 0.4 | 133 ± 5 | 330 ± 7 |
| 8.0 ± 0.2 | 68 ± 1 | 431 ± 8 |
| 7.8 ± 0.2 | 55 ± 1 | 219 ± 8 |
| 7.0 ± 0.1 | 47 ± 2 | 200 ± 9 |
| 6.1 ± 0.1 | 162 ± 8 | |
| 136 ± 0.6 | ||
| 125 ± 2 | ||
| 117 ± 1.7 | ||
| 32 ± 1.7 |
| Spot Name | pIex Native IEF | kDa Modified SDS-PAGE | kDa hrCNE |
|---|---|---|---|
| H | 9.8 ± 0.2 | n.d. | 637 ± 10 |
| J | 9.2 ± 0.1 | n.d. | 637 ± 6 |
| K | 8.8 ± 0.2 | n.d. | 637 ± 5 |
| L | 9.6 ± 0.2 | n.d. | 440 ± 5 |
| M | 9.6 ± 0.2 | n.d. | 330 ± 8 |
| N | 9.2 ± 0.1 | n.d. | 370 ± 7 |
| O | 8.0 ± 0.3 | n.d. | 370 ± 7 |
| P | 7.8 ± 0.3 | n.d. | 330 ± 8 |
| F SDS−PAGE/Q hrCNE | 8.0 ± 0.3 | 133 ± 8 | 200 ± 4 |
| G SDS−PAGE/R hrCNE | 7.8 ± 0.3 | 85 ± 4 | 200 ± 6 |
| S | 6.1 ± 0.1 | n.d. | 139 ± 5 |
| T | 5.9 ± 0.2 | n.d. | 115 ± 2 |

3.3. Sensitivity of Soluble Shoot Peroxidases against SDS
3.4. SEC and Identification of Peroxidases by LC-MS
| Band | pI exp | MW exp | Accession | Database | pI th | MW th | Peptides | Class | Localisation | Inducers/Repressors |
|---|---|---|---|---|---|---|---|---|---|---|
| Prx F1 | 9.6 | 34–51 | ZmPrx06 | Peroxibase | 6.2 | 33 | 6 | III | - | induced by cyst nematode infection, pathogen interaction |
| ZmPrx118 | 5.5 | 37 | 10 | III | - | - | ||||
| ZmPrx97 | 6.6 | 38 | 12 | III | - | induced by salt stress | ||||
| ZmPrx124 | 4.7 | 37 | 15 | III | - | - | ||||
| ZmPrx125 | 8.6 | 34 | 10 | III | - | - | ||||
| Prx F2 | 8.0 | 34–58 | ZmPrx66 | UniProt | 8.0 | 33 | 2 | III | PM | induced by drought, elicitors, salicylic acid, wounding and H2O2 |
| ZmPrx42 | Peroxibase | 5.3 | 33 | 9 | III | PM | - | |||
| ZmPrx07 | Peroxibase | 8.0 | 34 | 12 | III | - | - | |||
| ZmAPx01 | UniProt | 5.7 | 27 | 27 | I | cytosolic | - | |||
| ZmAPx02 | UniProt | 5.7 | 28 | 9 | I | cytosolic | - | |||
| Prx F3 | 7.8 | 34–58 | ZmAPx01 | UniProt/Peroxibase | 5.7 | 27 | 8 | I | cytosolic | - |
| ZmPrx38 | Peroxibase | 9.2 | 38 | 10 | III | - | - | |||
| ZmPrx07 | Peroxibase | 8.0 | 34 | 12 | III | - | - | |||
| Prx F4 | 6.1 | 45 | ZmPrx106 | Peroxibase | 8.4 | 34 | 40 | III | - | - |
4. Conclusions
Supplementary Materials
Supplementary File 1Acknowledgments
Author Contributions
Conflicts of Interest
References
- Number of flood events by continent and decade since 1950. Available online: http://www.grida.no/graphicslib/detail/number-of-flood-events-by-continent-and-decade-since-1950_10c2 (accessed on 28 March 2014).
- Bailey-Serres, J.; Fukao, T.; Gibbs, D.J.; Holdsworth, M.J.; Leem, S.C.; Licausi, F.; Perata, P.; Voesenek, L.A.; van Dongen, J.T. Making sense of low oxygen sensing. Trends Plant Sci. 2012, 17, 129–138. [Google Scholar] [CrossRef]
- Ahmed, F.; Rafii, M.Y.; Ismail, M.R.; Juraimi, A.S.; Rahim, H.A.; Asfaliza, R.; Latif, M.A. Waterlogging tolerance of crops: Breeding, mechanism of tolerance, molecular approaches, and future prospects. Biomed. Res. Int. 2013. [Google Scholar] [CrossRef]
- Sairam, R.K.; Dharmar, K.; Chinnusamy, V.; Meena, R.C. Waterlogging-induced increase in sugar mobilization, fermentation, and related gene expression in the roots of mung bean (Vigna radiata). J. Plant Physiol. 2009, 166, 602–616. [Google Scholar] [CrossRef]
- Watanabe, K.; Nishiuchi, S.; Kulichikhin, K.; Nakazono, M. Does suberin accumulation in plant roots contribute to waterlogging tolerance? Front. Plant Sci. 2013, 4. [Google Scholar] [CrossRef]
- Colmer, T.D.; Voesenek, L.A.C.J. Flooding tolerance: Suites of plants traits in variable environments. Funct. Plant Biol. 2009, 36, 665–681. [Google Scholar] [CrossRef]
- Hattori, Y.; Nagai, K.; Furukawa, S.; Song, X.J.; Kawano, R.; Sakakibara, H.; Wu, J.; Matsumoto, T.; Yoshimura, A.; Kitano, H.; et al. The ethylene response factors SNORKEL1 and SNOKEL2 allow rice to adapt to deep water. Nature 2009, 460, 1026–1030. [Google Scholar] [CrossRef]
- Bailey-Serres, J.; Voesenek, L.A.C.J. Flooding stress: Acclimations and genetic diversity. Annu. Rev. Plant Biol. 2008, 59, 313–336. [Google Scholar]
- Bailey-Serres, J.; Voesenek, L.A.C.J. Life in the balance: A signaling network controlling survival of flooding. Curr. Opin. Plant Biol. 2010, 13, 489–494. [Google Scholar] [CrossRef]
- Fukao, T.; Bailey-Serres, J. Submergence tolerance conferred by Sub1A is mediated by SLR1 and SLRL1 restriction of gibberellin responses in rice. Proc. Natl. Acad. Sci. USA 2008, 105, 16814–16819. [Google Scholar] [CrossRef]
- Gomes, A.R.; Kozlowski, T.T. Growth responses and adaptations of Fraxinus pennsylvanica seedlings to flooding. Plant Physiol. 1980, 66, 267–271. [Google Scholar] [CrossRef]
- Gonzáles, J.A.; Gallardo, M.; Hilal, M.; Rosa, M.; Prado, F.E. Physiological responses of quinoa (Chenopodium quinoa Willd.) to drought and waterlogging stresses: Dry matter partitioning. Bot. Stud. 2009, 50, 35–42. [Google Scholar]
- Pereira, E.G.; Oliva, M.A.; Rosado-Souza, L.; Mendes, G.C.; Colares, D.S.; Stopato, C.H.; Almeida, A.M. Iron excess affects rice photosynthesis through stomatal and non-stomatal limitations. Plant Sci. 2013, 201–202, 81–92. [Google Scholar] [CrossRef]
- Steffens, B.; Steffen-Heins, A.; Sauter, M. Reactive oxygen species mediates growth in submerged plants. Front Plant Sci. 2013, 4. [Google Scholar] [CrossRef]
- Farmer, E.E.; Müller, M.J. ROS-mediated lipid peroxidation and RES-activated signaling. Ann. Rev. Plant Biol. 2013, 64, 429–450. [Google Scholar] [CrossRef]
- Asada, K. Production and scavenging of reactive oxygen species in chloroplasts and their functions. Plant Physiol. 2006, 141, 391–396. [Google Scholar] [CrossRef]
- De Gara, L. Class III peroxidases and ascorbate metabolism in plants. Phytochem. Rev. 2004, 3, 195–205. [Google Scholar] [CrossRef]
- Kawano, T. Roles of the reactive oxygen species-generating peroxidase reactions in plant defense and growth induction. Plant Cell Rep. 2003, 21, 829–837. [Google Scholar]
- Passardi, F.; Cosio, C.; Penel, C.; Dunand, C. Peroxidases have more functions than a Swiss army knife. Plant Cell Rep. 2005, 24, 255–265. [Google Scholar] [CrossRef]
- Lüthje, S.; Meisrimler, C.N.; Hopff, D.; Möller, B. Phylogeny, topology, structure and functions of membrane-bound class III peroxidases in vascular plants. Phytochemistry 2011, 72, 1124–1135. [Google Scholar] [CrossRef]
- Lüthje, S.; Möller, B.; Perrineau, F.C.; Wöltje, K. Plasma membrane electron pathways and oxidative stress. Antioxid. Redox Signal. 2013, 18, 2163–2183. [Google Scholar] [CrossRef]
- Shi, F.; Yamamoto, R.; Shimamura, S.; Hiraga, S.; Nakayama, N.; Nakamura, T.; Yukawa, K.; Hachinohe, M.; Matsumot, H.; Komatsu, S. Cytosolic ascorbate peroxidase 2 (cAPX2) is involved in the soybean response to flooding. Phythochemistry 2008, 69, 1295–1303. [Google Scholar] [CrossRef]
- Kausar, R.; Hossain, Z.; Makino, T.; Komatsu, S. Characterization of ascorbate peroxidase in soybean under flooding and drought stress. Mol. Biol. Rep. 2012, 39, 10573–10579. [Google Scholar] [CrossRef]
- Simova-Stoilova, L.; Demirevska, K.; Kingston-Smith, A.; Feller, U. Involvement of the leaf antioxidant system in the response to soil flooding in two Trifolium genotypes differing in their tolerance to waterlogging. Plant Sci. 2012, 183, 43–49. [Google Scholar] [CrossRef]
- Mika, A.; Boenisch, M.J.; Hopff, D.; Lüthje, S. Membrane-bound guaiacol peroxidases areregulated by methyl jasmonate, salicylic acid, and pathogen elicitors. J. Exp. Bot. 2010, 61, 831–841. [Google Scholar] [CrossRef]
- Meisrimler, C.N.; Planchon, S.; Renaut, J.; Sergeant, K.; Lüthje, S. Alteration of plasma membrane-bound redox systems of iron deficient pea roots by chitosan. J. Proteomics 2011, 74, 1437–1449. [Google Scholar] [CrossRef]
- Komatsu, S.; Hiraga, S.; Yanagawa, Y. Proteomics techniques for development of flood tolerant crops. J. Proteome Res. 2012, 11, 68–78. [Google Scholar] [CrossRef]
- Lüthje, S.; Meisrimler, C.N.; Hopff, D.; Schütze, T.; Köppe, J.; Heino, K. Class III peroxidases. Methods Mol. Biol. 2014, 1072, 687–706. [Google Scholar] [CrossRef]
- Porra, R.J.; Thompson, W.A.; Kriedemann, P.E. Determination of accurate extinction coefficients and simultaneous equation for assaying chlorophylls a and b extracted with four different solvents: Verification of the concentration of chlorophyll standards by atomic absorption spectroscopy. Biochim. Biophys. Acta 1989, 975, 384–394. [Google Scholar] [CrossRef]
- Lüthje, S.; van Gestelen, P.; Córdoba-Pedregosa, M.C.; González-Reyes, J.A.; Asard, H.; Villalba, J.M.; Böttger, M. Quinones in plant plasma membranes—A missing link? Protoplasma 1998, 205, 43–51. [Google Scholar] [CrossRef]
- Bradford, M.M. A rapid and sensitive method for the quantification of microgram quantities of protein dye binding. Anal. Biochem. 1976, 72, 248–254. [Google Scholar] [CrossRef]
- Silva, J.C.; Denny, R.; Dorschel, C.A.; Gorenstein, M.; Kass, I.J.; Li, G.Z.; McKenna, T.; Nold, M.J.; Richardson, K.; Young, P.; et al. Quantitative proteomic analysis by accurate mass retention time pairs. Anal. Chem. 2005, 77, 2187–2200. [Google Scholar] [CrossRef]
- Li, G.Z.; Vissers, J.P.; Silva, J.C.; Golick, D.; Gorenstein, M.V.; Geromanos, S.J. Database searching and accounting of multiplexed precursor and product ion spectra from the data independent analysis of simple and complex peptide mixtures. Proteomics 2009, 9, 1696–1719. [Google Scholar] [CrossRef]
- Striker, G.G. Flooding Stress on Plants: Anatomical, Morphological and Physiological Responses. Botany 2012, 1, 3–28. [Google Scholar]
- Asada, K.; Takahashi, M. Production and scavenging of active oxygen in chloroplasts. In Photoinhibition; Kyle, D.J., Osmond, C.B., Arntzen, C.J., Eds.; Elsevier: Amsterdam, The Netherlands, 1987; pp. 227–287. [Google Scholar]
- Pourabdal, L.; Heidary, R.; Farboodnia, T.T. Effects of three different flooding periods on some anatomical, morphological and biochemical changings in maize (Zea mays L.) seedlings. Asian J. Plant Sci. 2008, 7, 90–94. [Google Scholar] [CrossRef]
- Luo, F.L.; Thiele, B.; Janzik, I.; Zeng, B.; Schurr, U.; Matsubara, S. De-submergence responses of antioxidative defense systems in two wetland plants having escape and quiescence strategies. J. Plant Physiol. 2012, 169, 1680–1689. [Google Scholar] [CrossRef]
- Greenbaum, D.; Colangelo, C.; Williams, K.; Gerstein, M. Comparing protein abundance and mRNA expression levels on a genomic scale. Genome Biol. 2003, 4. [Google Scholar] [CrossRef]
- Führs, H.; Götze, S.; Specht, A.; Erban, A.; Gallien, S.; Heintz, D.; van Dorsselaer, A.; Kopka, J.; Braun, H.P.; Horst, W.J. Characterization of leaf apoplastic peroxidases and metabolites in Vigna unguiculata in response to toxic manganese supply and silicon. J. Exp. Bot. 2009, 60, 1663–1678. [Google Scholar] [CrossRef]
- Lüthje, S.; Hopff, D.; Schmitt, A.; Meisrimler, C.N.; Menckhoff, L. Hunting for low abundant redox proteins in plant plasma membranes. J. Proteomics 2009, 72, 475–483. [Google Scholar] [CrossRef]
- Minibayeva, F.; Kolesnikov, O.; Chasov, A.; Beckett, R.; Lüthje, S.; Vylegzhanina, N.; Buck, F.; Böttger, M. Wound-induced apoplastic peroxidase activities: Their roles in the production and detoxification of reactive oxygen species. Plant Cell Environ. 2009, 32, 497–508. [Google Scholar] [CrossRef]
- Mika, A.; Buck, F.; Lüthje, S. Membrane-bound class III peroxidases: Identification, biochemical properties and sequence analysis of isoenzymes purified from maize (Zea mays L.) roots. J. Proteomics 2008, 71, 412–424. [Google Scholar] [CrossRef]
- Koussevitzky, S.; Suzuki, N.; Huntington, S.; Armijo, L.; Sha, W.; Cortes, D.; Shulaev, V.; Mittler, R. Ascorbate peroxidase 1 plays a key role in the response of Arabidopsis thaliana to stress combination. J. Biol. Chem. 2008, 283, 34197–34203. [Google Scholar] [CrossRef]
- Schnable, P.S.; Ware, D.; Fulton, R.S.; Stein, J.C.; Wei, F.; Pasternak, S.; Liang, C.; Zhang, J.; Fulton, L.; Graves, T.A.; et al. The B73 maize genome: Complexity, diversity, and dynamics. Science 2009, 326, 1112–1115. [Google Scholar] [CrossRef]
- Soderlund, C.; Descour, A.; Kudrna, D.; Bomhoff, M.; Boyd, L.; Currie, J.; Angelova, A.; Collura, K.; Wissotski, M.; Ashley, E.; et al. Sequencing, mapping, and analysis of 27,455 maize full-length cDNAs. PLoS Genet. 2009, 5, e1000740. [Google Scholar] [CrossRef]
- Alexandrov, N.N.; Brover, V.V.; Freidin, S.; Troukhan, M.E.; Tatarinova, T.V.; Zhang, H.; Swaller, T.J.; Lu, Y.P.; Bouk, J.; Flavell, R.B.; et al. Insights into corn genes derived from large-scale cDNA sequencing. Plant Mol. Biol. 2009, 69, 179–194. [Google Scholar] [CrossRef]
- Phenylpropanoid biosynthesis—Zea mays (maize). Available online: http://www.kegg.jp/pathway/zma00940 (accessed on 28 March 2014).
- Lignin biosynthesis, cinnamate => lignin. Available online: http://www.kegg.jp/module/zma_M00039 (accessed on 28 March 2014).
- Lignin biosynthesis, cinnamate => lignin. Available online: http://www.kegg.jp/pathway/zma00360 (accessed on 28 March 2014).
- Pourabdal, L.; Heidary, R.; Farboodnia, T. The effects of flooding stress on induction of oxidative stress and antioxidant enzymes activity in Zea mays L. seedlings. Res. J. Biol. Sci. 2008, 3, 391–394. [Google Scholar]
- Kukavica, B.M.; Veljovic-Jovanovic, S.D.; Menckhoff, L.; Lüthje, S. Cell wall-bound cationic and anionic class III isoperoxidases of pea root: Biochemical characterization and function in root growth. J. Exp. Bot. 2012, 63, 4631–4645. [Google Scholar] [CrossRef]
- Kukavica, B.; Mojovic, M.; Vucinic, Z.; Maksimovic, V.; Takahama, U.; Veljovic Janovic, S. Generation of hydroxyl radical in isolated pea root cell wall, and the role of cell wall-bound peroxidase, Mn-SOD and phenoloics in their production. Plant Cell Physiol. 2009, 50, 304–317. [Google Scholar]
- Foreman, J.; Demidichik, V.; Bothwell, J.H.F.; Mylona, P.; Miedema, H.; Torres, M.A.; Linstead, P.; Costa, S.; Brownlee, C.; Jones, J.D.; et al. Reactive oxygen species produced by NADPH oxidase regulate plant cell growth. Nature 2003, 422, 442–446. [Google Scholar] [CrossRef]
- The Peroxidases Database. Available online: http://peroxibase.toulouse.inra.fr/index.php (accessed on 28 March 2014).
© 2014 by the authors; licensee MDPI, Basel, Switzerland. This article is an open access article distributed under the terms and conditions of the Creative Commons Attribution license (http://creativecommons.org/licenses/by/3.0/).
Share and Cite
Meisrimler, C.-N.; Buck, F.; Lüthje, S. Alterations in Soluble Class III Peroxidases of Maize Shoots by Flooding Stress. Proteomes 2014, 2, 303-322. https://doi.org/10.3390/proteomes2030303
Meisrimler C-N, Buck F, Lüthje S. Alterations in Soluble Class III Peroxidases of Maize Shoots by Flooding Stress. Proteomes. 2014; 2(3):303-322. https://doi.org/10.3390/proteomes2030303
Chicago/Turabian StyleMeisrimler, Claudia-Nicole, Friedrich Buck, and Sabine Lüthje. 2014. "Alterations in Soluble Class III Peroxidases of Maize Shoots by Flooding Stress" Proteomes 2, no. 3: 303-322. https://doi.org/10.3390/proteomes2030303
APA StyleMeisrimler, C.-N., Buck, F., & Lüthje, S. (2014). Alterations in Soluble Class III Peroxidases of Maize Shoots by Flooding Stress. Proteomes, 2(3), 303-322. https://doi.org/10.3390/proteomes2030303