Testing Models and Measurement Invariance of the Learning Gains Scale


Abstract
:1. Introduction
- Practical skills—participation in higher-order forms of thinking;
- General Learning Outcomes—development of general competencies;
- General Development Outcomes—general forms of individual and social development;
- Career Readiness—preparation for participation in the professional workforce;
- Average Overall Grade—average overall grade so far in courses;
- Departure Intention—non-graduating students’ intentions on not returning to study in the following year; and
- Overall Satisfaction—students’ overall satisfaction with their educational experience.
- Does the variable in the Student Learning Gains Scale of the data collected from a university in Ethiopia represent construct validity (substantive or content validity)?
- Does a 3-factor Student Learning Gains Scale model fit to the data that were collected? If not, what factor structure can be suggested as fitting well with the data?
- Does the Student Learning Gains Scale factor predict important student behaviors and outcomes?
- Does the Student Learning Gains Scale, as applied in an Ethiopian higher education context, demonstrate measurement invariance across college type and class year?
2. Materials and Methods
2.1. Study Design
2.2. Study Participants
2.3. Measures
2.4. Data Analysis
2.5. Missing Values and Internal Consistency
3. Results
3.1. Factor Structure and Reliability Analyses
3.2. Evaluating Model Goodness-of-Fit
3.3. Measurement Invariance
4. Discussion
5. Conclusions
6. Implications to Research in the Quality of Higher Education
Authors Contributions
Funding
Acknowledgments
Conflicts of Interest
References
- Tadesse, T.; Gillies, R.M.; Campbell, C. Assessing the dimensionality and educational impacts of integrated ICT literacy in the higher education context. Aust. J. Educ. Technol. 2018, 34, 88–101. [Google Scholar] [CrossRef]
- Tadesse, T.; Manathunga, C.E.; Gillies, R.M. Making sense of quality teaching and learning in higher education in Ethiopia: Unfolding existing realities for future promises. J. Univ. Teach. Learn. Pract. 2018, 15, 4. [Google Scholar]
- Gordon, J.; Ludlum, J.; Hoey, J.J. Validating nsse against student outcomes: Are they related? Res. High. Educ. 2008, 49, 19–39. [Google Scholar] [CrossRef]
- Randles, R.; Cotgrave, A. Measuring student learning gain: A review of transatlantic measurements of assessments in higher education. Innov. Pract. 2017, 11, 50–59. [Google Scholar]
- Hagel, P.; Carr, R.; Devlin, M. Conceptualising and measuring student engagement through the australasian survey of student engagement (ausse): A critique. Assess. Eval. High. Educ. 2012, 37, 475–486. [Google Scholar] [CrossRef]
- Amaury, N.; Gloria, C.; Cissy, M. A reconceptualization of ccsse’s benchmarks of student engagement. Rev. High. Educ. 2011, 35, 105–130. [Google Scholar]
- Tendhar, C.; Culver, S.M.; Burge, P.L. Validating the national survey of student engagement (nsse) at a research-intensive university. J. Educ. Train. Stud. 2013, 1, 182–193. [Google Scholar] [CrossRef]
- Tadesse, T.; Manathunga, C.E.; Gillies, R.M. The development and validation of the student engagement scale in an Ethiopian university context. High. Educ. Res. Dev. 2018, 37, 188–205. [Google Scholar] [CrossRef]
- Tadesse, T.; Gillies, R.M. Testing robustness, model fit, and measurement invariance of the student engagement scale in an African university context. Aust. J. Career Dev. 2017, 26, 92–102. [Google Scholar] [CrossRef]
- Hernandez, E.; Mobley, M.; Coryell, G.; Yu, E.; Martinez, G. Examining the cultural validity of a college student engagement survey for latinos. J. Hisp. High. Educ. 2013, 12, 153–173. [Google Scholar] [CrossRef]
- LaNasa, S.M.; Cabrera, A.F.; Trangsrud, H. The construct validity of student engagement: A confirmatory factor analysis approach. Res. High. Educ. 2009, 50, 315–332. [Google Scholar] [CrossRef]
- Byrne, B. Testing for multigroup equivalence of a measuring instrument: A walk through the process. Psicothema 2008, 20, 872. [Google Scholar] [PubMed]
- McGrath, C.H.; Guerin, B.; Harte, E.; Frearson, M.; Manville, C. Learning Gain in Higher Education. Available online: https://www.rand.org/pubs/research_reports/RR996.html (accessed on 23 October 2018).
- Coates, H. Development of the Australasian survey of student engagement (ausse). High. Educ. 2010, 60, 1–17. [Google Scholar] [CrossRef]
- Gonyea, R.; Miller, A. Clearing the air about the use of self-reported gains in institutional research. New Dir. Inst. Res. 2011, 2011, 99–111. [Google Scholar] [CrossRef]
- Fukami, C.V.; Armstrong, S.J. Self-assessment of knowledge: A cognitive learning or affective measure? Perspectives from the management learning and education community. Acad. Manag. Learn. Educ. 2010, 9, 335–341. [Google Scholar]
- Yorke, M. Employability in the undergraduate curriculum: Some student perspectives. Eur. J. Educ. 2004, 39, 409–427. [Google Scholar] [CrossRef]
- Joseph, P.M. Validity of the student interest and engagement scales: Associations with student learning outcomes. Commun. Stud. 2013, 64, 125. [Google Scholar]
- Coates, H. Australasian Survey of Student Engagement: Institution Report. Available online: https://research.acer.edu.au/cgi/viewcontent.cgi?article=1016&context=ausse (accessed on 23 October 2018).
- Ahlfeldt, S.; Mehta, S.; Sellnow, T. Measurement and analysis of student engagement in university classes where varying levels of pbl methods of instruction are in use. High. Educ. Res. Dev. 2005, 24, 5–20. [Google Scholar] [CrossRef]
- Coates, H. Student Engagement in Campus-Based qnd Online Education: University Connections; Routledge: New York, NY, USA, 2006. [Google Scholar]
- Griffin, P.; Coates, H.; McInnis, C.; James, R. The development of an extended course experience questionnaire. Qual. High. Educ. 2003, 9, 259–266. [Google Scholar] [CrossRef]
- Byrne, B.; Shavelson, R.; Muthén, B. Testing for the equivalence of factor covariance and mean structures: The issue of partial measurement invariance. Psychol. Bull. 1989, 105, 456–466. [Google Scholar] [CrossRef]
- Little, T.D. Mean and covariance structures (macs) analyses of cross-cultural data: Practical and theoretical issues. Multivar. Behav. Res. 1997, 32, 53–76. [Google Scholar] [CrossRef] [PubMed]
- Meredith, W. Measurement invariance, factor analysis and factorial invariance. Psychometrika 1993, 58, 525–543. [Google Scholar] [CrossRef]
- Widaman, K.F. Common Factor Analysis Versus Principal Components Analysis: Differential Bias in Representing Model Parameters? Available online: https://www.ncbi.nlm.nih.gov/pubmed/26776890 (accessed on 23 October 2018).
- Schreiber, J.B.; Nora, A.; Stage, F.K.; Barlow, E.A.; King, J. Reporting structural equation modeling and confirmatory factor analysis results: A review. J. Educ. Res. 2006, 99, 323–337. [Google Scholar] [CrossRef]
- Cleves, M.A. An Introduction to Survival Analysis Using Stata; Stata Press: College Station, TX, USA, 2008. [Google Scholar]
- Joreskog, K.; Sorbom, D. Lisrel 8: User’s Reference Guide; Scientific Software: Chicago, IL, USA, 1993. [Google Scholar]
- Bollen, K.A. Latent variables in psychology and the social sciences. Annu. Rev. Psychol. 2002, 53, 605–634. [Google Scholar] [CrossRef] [PubMed]
- Stevens, J. Applied Multivariate Statistics for the Social Sciences; Lawrence Erlbaum Associates: Mahwah, NJ, USA, 2002. [Google Scholar]
- Kline, R. Principles and Practice of Structural Equation Modeling; Guilford Press: New York, NY, USA, 1998. [Google Scholar]
- Cochran, W.G. The χ2 test of goodness of fit. Ann. Math. Stat. 1952, 23, 315–345. [Google Scholar] [CrossRef]
- Marsh, H.W.; Hocevar, D. Application of confirmatory factor analysis to the study of self-concept: First-and higher order factor models and their invariance across groups. Psychol. Bull. 1985, 97, 562–582. [Google Scholar] [CrossRef]
- Kuh, G.; Kinzie, J.; Buckley, J.; Hayek, J. What Matters to Student Success: A Review of the Literature. Available online: https://nces.ed.gov/npec/pdf/kuh_team_report.pdf (accessed on 23 October 2018).
- Nunally, J.; Bernstein, I. Psychometric Theory, 3rd ed.; McGraw Hill: New York, NY, USA, 1994. [Google Scholar]
- Chen, F.F.; Sousa, K.H.; West, S.G. Teacher’s corner: Testing measurement invariance of second-order factor models. Struct. Equ. Model. 2005, 12, 471–492. [Google Scholar] [CrossRef]
- Cheung, G.W.; Rensvold, R.B. Evaluating goodness-of-fit indexes for testing measurement invariance. Struct. Equ. Model. 2002, 9, 233–255. [Google Scholar] [CrossRef]
- van de Schoot, R.; Lugtig, P.; Hox, J. A checklist for testing measurement invariance. Eur. J. Dev. Psychol. 2012, 9, 486–492. [Google Scholar] [CrossRef]
- Donnelly, J.P.; Trochim, W.M.K. Research Methods Knowledge Base. Available online: https://trove.nla.gov.au/work/17158592 (accessed on 29 October 2018).
- Cohen, L. Statistical Power Analysis for the Behavioral Sciences, 2nd ed.; Lawrence Erlbaum: Mahwah, NJ, USA, 1988. [Google Scholar]
- Carle, A.C.; Jaffee, D.; Vaughan, N.W.; Eder, D. Psychometric properties of three new national survey of student engagement based engagement scales: An item response theory analysis. Res. High. Educ. 2009, 50, 775–794. [Google Scholar] [CrossRef]
- Kuh, G. The national survey of student engagement: Conceptual and empirical foundations. New Dir. Inst. Res. 2009, 2009, 5–20. [Google Scholar] [CrossRef]
- Fredricks, J.A.; McColskey, W. The Measurement of Student Engagement: A Comparative Analysis of Various Methods and Student Self-Report Instruments; Springer: Boston, MA, USA, 2012; pp. 763–782. [Google Scholar]
- Hu, L.-T.; Bentler, P.M. Cutoff criteria for fit indexes in covariance structure analysis: Conventional criteria versus new alternatives. Struct. Equ. Model. Multidiscip. J. 1999, 6, 1–55. [Google Scholar] [CrossRef]


| Characteristic | College | College |
|---|---|---|
| Natural Sciences | Social Sciences and Law | |
| 206 (38.4%) | 330 (61.6%) | |
| Gender | ||
| Women | 37 (18%) | 70 (21%) |
| Men | 165 (82%) | 260 (81%) |
| Classification | ||
| Year II | 111 (54%) | 115 (35%) |
| Year III | 95 (46%) | 176 (53%) |
| Year IV & V | 0 | 39 (12%) |
| Age | M = 21.33 (SD 1.35) | M = 21.51 (SD 1.35) |
| CGPA 1 | M = 2.90 (SD 0.46) | M = 3.05 (SD 0.47) |
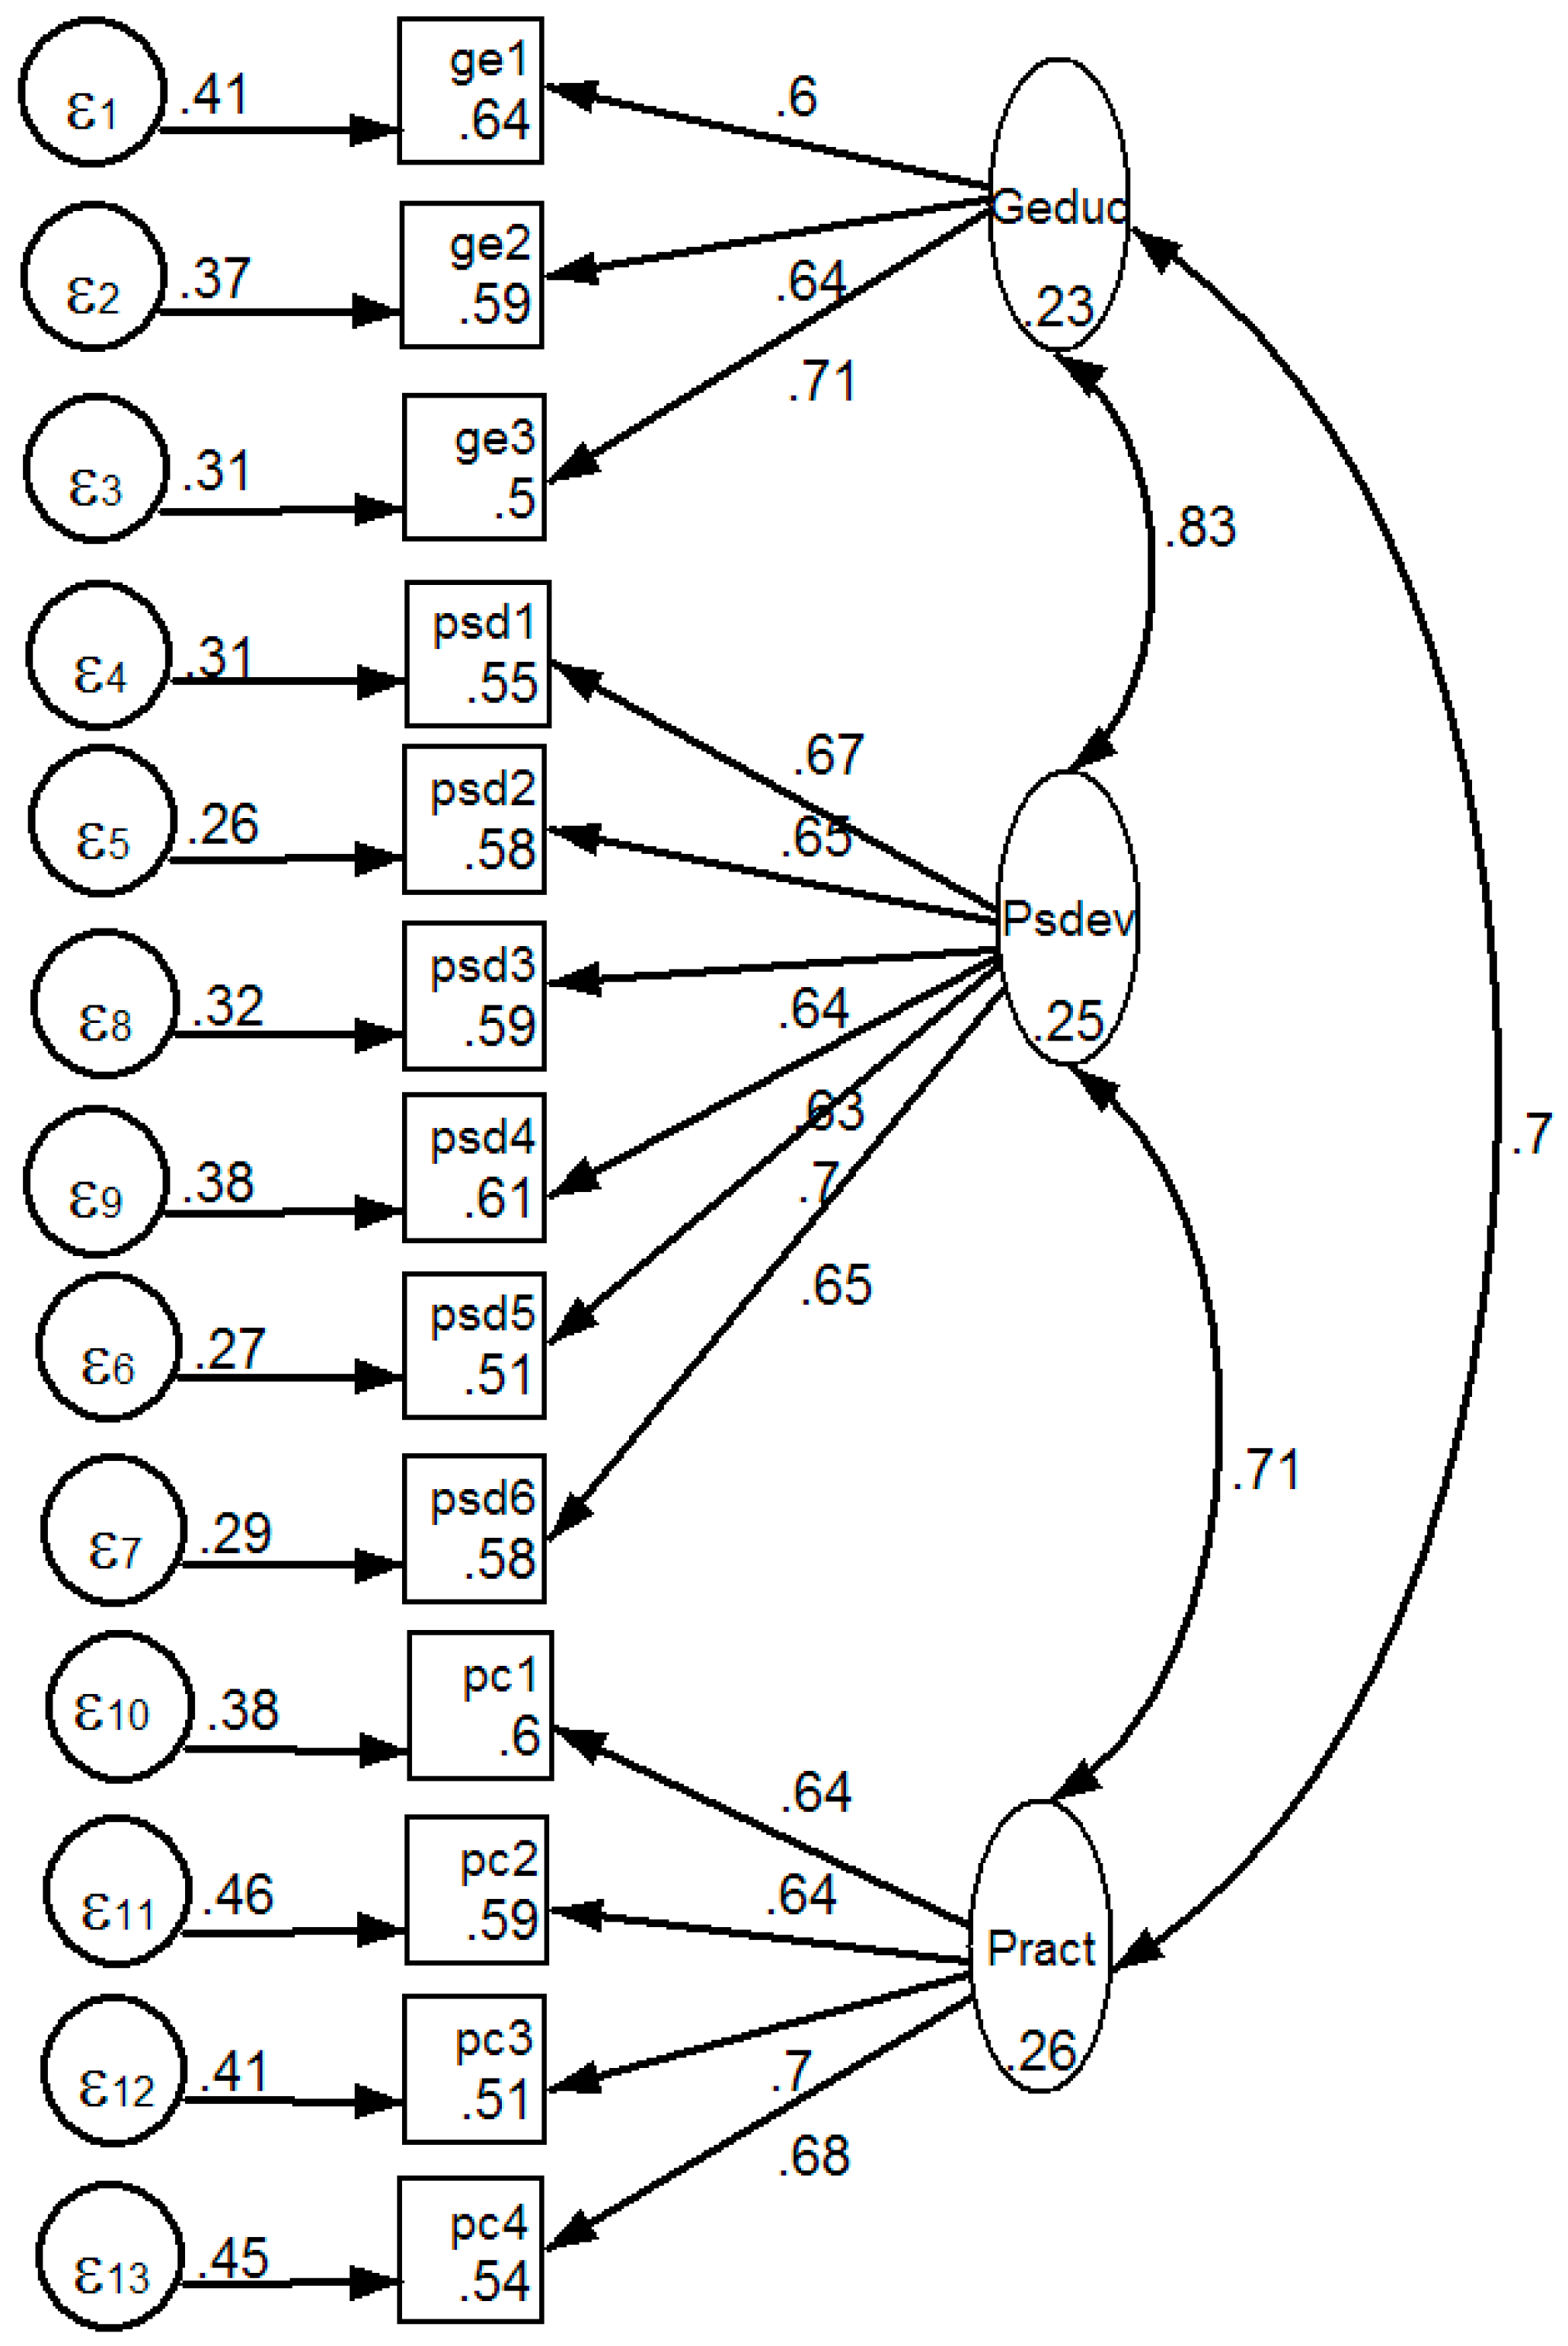
| Observed Variable | Latent Factors | ||
|---|---|---|---|
| General Education (α = 0.71) | Personal and Social Development (α = 0.83) | Practical Skill (α = 0.77) | |
| gen1 | 0.60 | 0 | 0 |
| gen2 | 0.64 | 0 | 0 |
| gen3 | 0.71 | 0 | 0 |
| psd1 | 0 | 0.67 | 0 |
| psd2 | 0 | 0.65 | 0 |
| psd3 | 0 | 0.64 | 0 |
| psd4 | 0 | 0.63 | 0 |
| psd5 | 0 | 0.70 | 0 |
| psd6 | 0 | 0.65 | 0 |
| pc1 | 0 | 0 | 0.64 |
| pc2 | 0 | 0 | 0.64 |
| pc3 | 0 | 0 | 0.70 |
| pc4 | 0 | 0 | 0.68 |
| Validity Variable | General Education | Personal Development | Higher Order Thinking |
|---|---|---|---|
| Learning self-efficacy (0.82) | 0.52 | 0.51 | 0.48 |
| Time and study management (0.76) | 0.41 | 0.41 | 0.44 |
| Overall satisfaction | 0.53 | 0.51 | 0.46 |
| Future intention | 0.32 | 0.32 | 0.31 |
| Model | χ2 | df | χ2/df | TLI/NNFI | CFI | RMSEA | SRMR | CD | AIC | Δχ2 | Δdf |
|---|---|---|---|---|---|---|---|---|---|---|---|
| 1-factor model | 331.60 *** | 65 | 5.1 | 0.85 | 0.88 | 0.088 | 0.056 | 0.88 | 14264 | ||
| 2-factor model | 119.43 *** | 64 | 3.1 | 0.92 | 0.94 | 0.063 | 0.042 | 0.95 | 14134 | 212 | 1 |
| 3-factor model | 162.62 *** | 62 | 2.6 | 0.94 | 0.95 | 0.056 | 0.038 | 0.97 | 14101 | 43 | 2 |
N.B: The one factor model comprised of the 13 items used to measure self-reported gain scale
| |||||||||||
| Factor | Natural Science | Alpha (α) | Social Science | Alpha (α) | Year 2 | Alpha (α) | Year 3 | Alpha (α) | ||||
|---|---|---|---|---|---|---|---|---|---|---|---|---|
| n | Mean (SD) | n | Mean (SD) | n | Mean (SD) | n | Mean (SD) | |||||
| General education | 206 | 3.12 (0.61) | 0.69 | 330 | 3.07 (0.63) | 0.69 | 226 | 3.04 (0.67) | 0.74 | 310 | 3.12 (0.58) | 0.64 |
| Personal development | 205 | 3.37 (0.51) | 0.81 | 324 | 3.31 (0.55) | 0.83 | 225 | 3.29 (0.55) | 0.83 | 304 | 3.37 (0.52) | 0.81 |
| Higher-order thinking | 204 | 3.00 (0.63) | 0.77 | 329 | 2.72 (0.66) | 0.74 | 225 | 2.74 (0.69) | 0.79 | 308 | 2.89 (0.64) | 0.72 |
| Invariance Tests Based on College Attended | ||||||||||
| Model | χ2 (df) | χ2/df | ∆χ2 (∆df) | RMSEA | SRMR | CFI | TLI | CD | Comparison | Decision |
| Reference Model | 162.619 (62) *** | 2.623 | 0.056 | 0.38 | 0.95 | 0.94 | 0.97 | |||
| Model 1: Configural invariance | 115.163 (62) *** | 1.858 | −47.456 (0) | 0.052 | 0.044 | 0.96 | 0.95 | 0.96 | Reference model vs. Model 1 | Accept |
| Model 2: Metric invariance | 274.868 (144) *** | 1.909 | 159.705 (82) | 0.059 | 0.056 | 0.94 | 0.94 | 0.97 | Model 1 vs. Model 2 | Accept |
| Invariance Tests Based on Class Year | ||||||||||
| Model | χ2 (df) | χ2/df | ∆χ2 (∆df) | RMSEA | SRMR | CFI | TLI | CD | Comparison | Decision |
| Reference Model | 162.619 (62) *** | 2.623 | 0.056 | 00.38 | 0.95 | 0.94 | 0.97 | |||
| Model 1: Configural invariance | 120.970 (62) *** | 1.951 | −41.649 (0) | 0.061 | 0.047 | 0.95 | 0.93 | 0.97 | Reference model vs. Model 1 | Accept |
| Model 2: Metric invariance | 261.547 (144) *** | 1.816 | 140.577 (82) | 0.056 | 0.056 | 0.95 | 0.94 | 0.96 | Model 1 vs. Model 2 | Accept |
© 2018 by the authors. Licensee MDPI, Basel, Switzerland. This article is an open access article distributed under the terms and conditions of the Creative Commons Attribution (CC BY) license (http://creativecommons.org/licenses/by/4.0/).
Share and Cite
Tadesse, T.; Gillies, R.M.; Campbell, C. Testing Models and Measurement Invariance of the Learning Gains Scale. Educ. Sci. 2018, 8, 192. https://doi.org/10.3390/educsci8040192
Tadesse T, Gillies RM, Campbell C. Testing Models and Measurement Invariance of the Learning Gains Scale. Education Sciences. 2018; 8(4):192. https://doi.org/10.3390/educsci8040192
Chicago/Turabian StyleTadesse, Tefera, Robyn M. Gillies, and Chris Campbell. 2018. "Testing Models and Measurement Invariance of the Learning Gains Scale" Education Sciences 8, no. 4: 192. https://doi.org/10.3390/educsci8040192
APA StyleTadesse, T., Gillies, R. M., & Campbell, C. (2018). Testing Models and Measurement Invariance of the Learning Gains Scale. Education Sciences, 8(4), 192. https://doi.org/10.3390/educsci8040192