1. Introduction
By the year 2018, almost two-thirds of jobs created in the United States will require some form of postsecondary education [
1]. Research has indicated that a rigorous high school curriculum is a strong predictor of college success. Thus, it is positively related to standardized test scores, college enrollment rates, and four-year graduation rates, and negatively related to remediation rates [
2]. Additionally, students taking college preparatory coursework receive several benefits in their postsecondary careers as college students. These benefits include demonstrating to universities they have the capacity to succeed in college preparatory courses, improvement of writing skills and problem-solving skills, the development of study habits necessary for college, and the possibility of earning college credit while in high school. This research investigated the effects of participation in several college preparatory courses.
To keep the American workforce competitive, it is the charge of the education system to ensure that students are prepared with the skills needed. Although the United States is on par with many industrialized nations in terms of the number of adults with a postsecondary credential, the country lags behind many notable competitors in numerous areas. For example, although the US is second in the proportion of the population that holds a four-year degree (32 percent), the ranking drops to eleventh place for the percentage of young adults between the ages of 25 and 34 years old (33 percent) holding a four-year degree [
3]. Furthermore, employers report that there is a significant skill gap among job seekers [
4]. Executives, for example, reported that job seekers lack soft skills like communication and critical thinking. Beyond a lack of applicants and experience, employers reported that job seekers’ lack of technical skill and workplace competencies are major contributors to the current situation where almost half of the employers find it difficult to fill positions [
5].
Additionally, high school graduates are not prepared for postsecondary education. Only 28% of the students who took the college entrance exam administered by the American College Testing (ACT) corporation in 2015, were college ready [
6]. Likewise, only 43% of those who took the 2013 Scholastic Aptitude Test (SAT) administered by the College Board were college ready [
7]. According to the National Assessment of Educational Progress, only 38% of 12th graders were college ready [
8]. Further evidence of the problem with college readiness is that 19.9% of students entering four-year institutions take remedial courses while 51.7% of students entering two-year colleges take remedial courses. Astoundingly, only 9.5% of two-year college students who take remedial classes graduate and 35.1% of four-year students graduate within the projected timeframe [
8]. The remediation trap disproportionately impacts African American, Hispanic, and low-income students to a greater degree than their European American counterparts [
9].
The challenge is to prepare students to be successful in a range of postsecondary settings, including certificate programs, apprenticeships, two- and four-year degrees, military, and career training. This research examined the impact of curricular approaches that support postsecondary and workforce readiness including honors, advanced placement, concurrent enrollment and career, and technical education.
The present research sought to extend the findings of previous studies by examining the relationships between students’ high school experiences and postsecondary outcomes. The purpose of this study was to explore and determine if there was a relationship between high school students’ enrollment in college preparation courses and increased postsecondary outcomes. In order to achieve those objectives, this quantitative investigation focused on the following research questions:
Do students who participate in college preparation coursework increase their odds of enrolling in college immediately after high school?
Do students who participate in college preparation coursework increase their odds of persisting in college through the second year?
Do students who participate in college preparation coursework increase their odds of graduating from college in six years?
2. Background
For many years, there has been a steady gap in the achievements of European American and minoritized students. With the advent of legislation such as No Child Left Behind [
10], educators became more aware of how widespread the problem was, and there was a call to action to mitigate the factors that exacerbate these issues. Although the disparities have been slightly reduced, there remains a considerable amount of work to be done in closing the opportunity gap [
11]. Among the pre-college variables that are related to postsecondary success, student characteristics, performance, and intensive coursework are the most potent predictors.
On average, being female places a student in a position to be more likely to graduate from college within six years [
12]. After controlling for academic performance, Buchmann and DiPrete [
13] found that the gender advantage disappeared. Additionally, race and ethnicity have been shown to play a role in postsecondary outcomes [
14]. Although Hispanics/Latinos are the largest minoritized group on college campuses, they have the lowest proportion of any minoritized group to attain a postsecondary degree [
15,
16]. Likewise, Black students have lower rates of postsecondary graduation [
17]. However, when controlling for academic preparation and socioeconomic status, being Black or Hispanic has been shown to be a positive predictor of postsecondary completion [
18].
High school coursework that includes increased academic intensity and quality has been found to be positively related to postsecondary outcomes for students [
19,
20,
21,
22,
23]. Additionally, rigorous high school coursework has been found to reduce the remediation rates of students while increasing college graduation rates [
24]. A United States General Accounting Office study found that students with a rigorous high school curriculum were more likely to complete college [
25]. In general, students who perform at or above an established threshold in college preparatory coursework are more likely to be prepared for their college and career pursuits [
26].
The following sections looks at the literature on types of courses that have been widely accepted to have a higher level of rigor and are positively associated with postsecondary outcomes.
2.1. Career and Technical Education
Career and Technical Education (CTE), along with many other high school postsecondary and workforce readiness programs, has several benefits to students. Students have the opportunity to receive college credit for courses completed in the high school setting. It also provides more course variety for students, which in turn leads to higher retention and high school matriculation. Students who gain technical expertise in high school have the opportunity to move into higher paying careers than their non-CTE peers and have a better chance of procuring gainful employment [
27]. Given that most jobs require some type of formalized education beyond that which is offered in the traditional high school setting. CTE provides students with earlier access to training in areas such as healthcare, business and marketing, computer science, engineering and architectural sciences, personal and consumer services, and trade and industry [
28].
Additionally, for those choosing to attend college, students gain the benefit of reduced cost of tuition given that several courses have been completed in high school. Students also have a more natural transition from high school to college because of the exposure gained in the CTE program, and they are better prepared for the rigor of college coursework [
29]. Finally, the Office of Planning, Evaluation, and Policy Development [
30] found that students participating in a CTE program have higher graduation rates: 10 percentage points or higher than all graduating students.
CTE programs also offer benefits to employers and the community, since employers have access to a higher number of skilled workers at the same time as realizing reduced costs of employee onboarding. When high school leaders support implementation of CTE programs, there is the opportunity to solve the issue brought up by employers who claim that young adults are not adequately equipped to succeed in the workforce [
31]. The community also has the potential of having a healthier financial economy as members earn higher wages sooner.
2.2. Advanced Placement
The College Board developed the Advanced Placement (AP) program with the expressed purpose of allowing students to stand out during the college admission process, earn college credits, skip introductory college classes, and build skills needed to succeed in college. AP is considered equivalent to college-level work, but students must take and perform well on a standardized exam in order to receive college credit. Future postsecondary success is determined by AP exam performance more so than AP course participation [
32,
33,
34]. For example, a study based on a national sample that was carried out by Mattern, Marini, and Shaw found that 58% of exam takers graduated college within four years as opposed to 38% of non-AP students [
32]. Additionally, 73% of students who had a high level of performance on the exam graduated in four years as compared to 37% of low performers [
32].
Although the majority of American high schools (58%) offer AP coursework, there are persistent problems with equitable access and performance on the exam [
35]. When investigating the rates of participation by race, it is notable that although African American students represent 13.6% of the high school student population, they represented only 6.9% of exam takers [
35]. Conversely, Asian students represent 5.5% of the population but 10.8% of test takers [
36]. This disparity is also shown by the fact that 94% of Asian students attend high schools offering AP coursework compared to 81% of African American students. Furthermore, across the board, only 40% of students who demonstrate the aptitude for AP math actually enroll in an AP math course on a yearly basis [
36]. Although the match between potential and enrollment has improved for Hispanic students, it has been stagnant for African American students with only three out of ten high-potential African American students enrolling in the matched course [
35,
37]. To date, only Hawaii has eliminated the disparity between African-American students and their peers regarding the rate of participation and rate of success on the exam [
37].
Another problem with the AP program is that the rate of students scoring a 3 or above on the exam remains at approximately 20% of exam takers [
38]. This means that the remaining 80% do not receive the college credit that is integral to the program. Furthermore, of the 85% of American students who currently attend high schools that offer AP, only 2% receive a score that merits college credit [
38]. However, data does show that even when a student from a low socioeconomic status background scores less than the target 3 or higher, they will still benefit from postsecondary outcomes associated with the AP program [
39]. Low-SES students had higher four-year college enrollment and retention rates and higher first-year grade point averages than their non-AP peers [
39]. Overall, despite the severe issues with equitable access, the AP program remains a significant factor in preparing students for postsecondary readiness.
2.3. Concurrent Enrollment
Concurrent enrollment (CE) courses allow students to take college-credit bearing courses taught by college-approved high school teachers [
40]. Because the courses are transcripted, they not only provide early access to college-level work, but also give credit that has a bearing on a student’s eventual high school grade point average (HSGPA) while also reducing the cost of college [
41]. One of the main differences between CE and the credit by exam options such as advanced placement is that students demonstrate knowledge over time, rather than on a high-stakes test at the end of the course. The two main types of CE programs are the within program and the outside program. In the within program, students take classes on the high school campus and are taught by either college instructors or approved high school teachers. The outside program is where students take classes on the college campus and are treated like traditional college students [
42].
Participation in CE for students is based on a combination of several factors including minimum HSGPA, passing score on the placement test, minimum standardized test score, and letters of recommendation [
42]. Of the institutions granting CE credit, 46% of them report that the eligibility requirements are the same as regular college students. Additionally, 86% report that the course content is the same for high school and traditional college students [
42].
Research has demonstrated that students have benefited from participating in a CE program. Students generally have increased levels of college readiness, higher college grade point averages, and higher persistence rates after CE enrollment [
43,
44]. Although research confirms that CE has a positive effect on postsecondary outcomes, there is very little research that seeks to understand the specific mechanisms that garner these benefits [
45].
Like other college readiness programs, CE has both positive and negative implications for students of color and student from low-SES households. On the positive side, CE has been found to benefit students across all SES spectrums [
46]. Although 71% of high schools in the US offer CE, the access is not equitable for all students. For example, 78% of schools with less than 20% of students of color offer the program, yet only 58% of schools with more than half of their enrolled students being of color offer the program [
46].
2.4. Honors
Honors courses offer a more intense, faster-paced curriculum and cover material at a deeper level. The content of the courses may vary from school to school and many colleges do not consider them as equivalent to college-level work. Honors courses are meant to allow students to have more in-depth interaction with the curriculum and complete more complex assignments. Honors can be defined as “an advanced level course designed for students who have earned honors status according to educational requirements. These courses typically include additional content not found in general courses and are formally designated as honors courses” [
47].
The definition of an honors course is also problematic in that honors may be inclusive of several other advanced classes such as AP, CE, and CTE. Even in the seminal study, The Tool Box Revisited: Paths to Degree Completion from High School Through College, Adelman failed to provide a clear definition of honors coursework [
24]. Given this, it is challenging to measure the impact of honors courses across schools, districts, or states.
2.5. College and Career Readiness
For all the negative connotations associated with the No Child Left Behind Act, the focus on the disaggregation of data allowed us to observe that in many cases sub groups were not doing as well as their European American counterparts. As a result, there have been several efforts to increase all students’ access to postsecondary options. A common method of reform is to take what is known to work and apply it en masse to all students so that all student can receive the associated benefits. Two such educational reforms include college preparatory curriculum for all and algebra for all. Although these types of reforms serve to reduce inequities in race and ethnicity, and special education status, the same reforms have dubious effects in changing long-term outcomes for students. In a study of the Chicago mandatory college preparatory curriculum, the results indicated that students’ test scores did not improve, and they were no more likely to take advanced math classes beyond Algebra II [
48]. The researchers also found that the college preparatory requirement made it more difficult for students to obtain the credits needed to graduate and graduation rates declined [
48].
Another for all intervention to provide broad access to programs that have shown proclivity to increase college access is the Algebra for all movement. Although research has established the benefit of students taking algebra in 9th grade, there has been mixed results when it applied to all students [
49]. In Chicago, failure rates increased, grades dropped slightly, test scores did not improve, and students were no more likely to attend college [
50]. In Arkansas and Texas, taking Algebra II did not help students to become more college and career ready by the end of high school. A study of the policy in North Carolina found that students who took 8th grade algebra were more likely to repeat the course and they performed less well in subsequent math courses [
51]. These results are similar to the results found in an analysis of the California program to provide algebra for all students [
52]. Even in the instances where student do well under the Algebra for all systems, there is also a tendency for school to de-track students of color but keep the same stratified systems of inequality by allowing European American students to track up through taking more advanced courses in math [
53]. In the wake of the trends in educational attainment, there have been mixed responses from state education agencies. For example, while Virginia and Arizona increased their graduation requirements, Texas and Florida have removed Algebra II from graduation requirements [
54].
Given that the for-all approach to school reform has had spurious results, the Obama administration made it a priority to target underperforming schools for reform. This was largely supported through an influx of competitive funds [
55]. The largest ever federal investment in school reform encouraged school leaders to adopt internationally benchmarked standards and assessment that would prepare students for success in college and the workplace [
55]. Despite the
$4.35 billion investment to support the lowest performing schools, the implementation of School Improvement Grants models of reform did not produce any significant impact on high school graduation or college enrollment [
55].
As it stands, although there has been considerable focus on college and career readiness, the proportion of college enrollment by race has not significantly changed from 2000 to 2016, which means that the gap between European American and minoritized populations remains the same [
56]. Likewise, there are significant gaps in educational attainment by socio-economic status. While bachelor degree attainment amongst the classes are relatively the same, more than half of the students from the wealthiest families attained an advanced degree, whereas 30 percent of middle SES and 22% of low SES persons had the same outcomes [
57]. The trend across the United States it that the majority of states saw a five percent decrease in overall enrollment from 2010 to 2015. Even if the proportion of Hispanic, Asian/Pacific Islander, and Black students have increased from fall 1976 to fall 2015, the percentage of black students enrolled in degree-granting postsecondary institutions has declined since 2011 [
58]. Finally, Black students attend for-profit colleges at twice the rate of the overall average [
56].
Given that there has been such a push to increase postsecondary outcomes and that there has been so little progress, it is imperative to continue to understand how access in high school can better translate to success in postsecondary outcomes. While college and career readiness is prevalent in national and local policy, the reality is that the equity gap is persistent among minoritized and economically disadvantaged students. Therefore, although we know that access to a rigorous curriculum matters, the definition of a rigorous curriculum that prepares a student for postsecondary success is debatable. Additionally, although we know that access to rigorous curriculum works, context is so crucially important that it demands that we continue research on the impact of rigorous high school curricula in several contexts to better understand how the reform that we understand to be efficacious actually works. As such, this study investigates both the types of coursework and the content of coursework in pursuit of understanding the nuanced manner in which high school curriculum impacts postsecondary success.
3. Methodology
3.1. Sample Characteristics
The data for this study were supplied by a suburban school district in a western state and National Student Clearinghouse (NSC). The study dataset spanned six years from 2008/2009 through 2013/2014 and contained demographic characteristics, course enrollment, and college outcomes including enrollment, persistence, and graduation. This dataset contained information on 1464 students. The number of students’ data included in the models ranged from 445 to 954. This difference in the number of students’ data included is related to the availability of information from NSC. The number of students’ data included in each model is provided in the results section. These data allow for the examination of immediate enrollment, persistence, and graduation from a postsecondary institution.
The students included in this study were predominately European American (59.2%) and Hispanic (29.7%), economically disadvantaged (40.2%), and engaged in a variety of college preparatory courses prior to graduating from high school. Of the total sample, 5.8% were in special education, 19.1% were identified as English Language Learners (ELL), 5.3% were identified as homeless, and 0.5% were identified as gifted and talented. Within the data set, five college preparation courses were identified for analysis, including participation in Advancement Via Individual Determination (AVID) courses (10%), CE courses (24%), CTE courses (53%), honors courses (20%), and AP courses (18%). Characteristics of the sample studied regarding ethnicity, gender, economic status and grade point average, shown as percentages, are in
Table 1.
3.2. Measures
College Pathway Coursework. Courses included in the college pathway coursework are AP courses, CTE courses, and CE courses. College pathway courses cover five academic areas including language arts, mathematics, science, social studies, and foreign language. College pathway coursework is a continuous variable and measured the number of courses taken in each of the pathway types. The College pathway variable measures the extent to which a student accessed pathway courses.
College Gateway Courses. Gateway courses are restricted to courses that are an avenue for college credit and included AP courses, CTE, and CE courses. Gateway courses are grouped into five academic areas including language arts, mathematics, science, social studies, and foreign language. Only three academic areas were considered for analysis: language arts, mathematics, and science. Students who took at least one gateway course were coded as 1, whereas students who did not take any gateway courses were coded as 0. The college gate variable measures participation in college level coursework.
Honors Courses. Honors courses are generally not considered to be equivalent to college level work in the same manner as gateway courses but are intended to offer a higher degree of rigor than the general course requirements. The academic areas considered for analysis within the honors category include language arts, mathematics, and science. Students who took at least one honors course were coded as 1, whereas students who did not take any gateway courses were coded as 0.
High School Grade Point Average (HSGPA). The HSGPA calculation in this research is based on an unweighted HSGPA. The unweighted HSGPA is the average of all class grades based on a 4.0 scale. Because weights attached to accelerated classes vary, the use of the unweighted HSGPA allows the analysis to investigate all students on the same scale. HSGPA is a continuous variable.
Free Application for Federal Student Aid (FAFSA) Completion. The FAFSA is a form that is prepared annually by current and prospective college students in the United States to determine their eligibility for student financial aid. FAFSA completion is considered to be an indicator of immediate college enrollment and persistence. A value of 1 indicated that the student completed the FAFSA and a value of 0 indicated that the student did not complete the FAFSA.
Gender. Gender was obtained from the student management system data. Gender does not account for students who have a gender identity or gender expression that differs from their assigned sex. A value of 1 indicated that the student was male. A value of 0 indicated that the student was female.
Socioeconomic Status (SES). Socioeconomic status is a measure of the student’s economic position in relation to others. A value of 1 indicated that the student received the most government benefit and thus was included in the low-SES group. A value of 2 indicated that a student received partial governmental benefit and thus was included in the medium-SES group. A value of 3 indicated that the student did not receive any government assistance and thus was a member of the high SES group. The categories were obtained by multiplying the years’ Federal income poverty guideline by 1.30 to account for students receiving free lunch and 1.85 to account for students receiving reduced-price lunch.
Under-Represented Minority Status. Students race/ethnicity was indicated in the student management system dataset. The categories comprise (1) Native American or Alaska Native; (2) Asian (3) Black or African American; (4) Hispanic; (5) European American; (6) Native Hawaiian Islander or Other Pacific Islander; (7) Multiple Races; and (8) No Data. Based on the data, a dichotomous variable was created to indicate under-represented minority status. A value of 0 indicated that the student was not a member of an under-represented minority group and this included Asian and European American students. A value of 1 indicated that the student was a member of an under-represented minoritized group which included African American, Hispanic, and Native American students. Students whose race/ethnicity did not have data were excluded.
Immediate College Enrollment. Immediate college enrollment data were provided by the National Student Clearinghouse data. Immediate college enrollees are defined as high school completers (including GED recipients) ages 16 to 24 who enroll in 2- or 4-year colleges in the fall immediately following high school. Students who enrolled in the fall were coded as 1, whereas students who did not enroll in any institution were coded as 0.
College Persistence. College persistence data were provided by the National Student Clearinghouse data. College persistence measures whether students return to college for their second year. It includes students who may have transferred or re-enrolled at a different institution from the one where they started. Students who persisted into the second year were coded as 1, whereas students who did not return to any institution were coded as 0.
College Graduation. Graduation data were provided by the National Student Clearinghouse (NSC) data. Students who graduated from any postsecondary institution in six years or fewer were coded as 1. Students who had not graduated by the end of the sixth year were coded as 0. Thus, the sample is based on students who graduated in six years or less compared with those students who did not graduate by their sixth year, which excludes those who remained for a seventh year and those who dropped out in their first, second, third, fourth or fifth year.
3.3. Ethics Review
All research questions used secondary data from the school district data archives and data accessed through the National Student Clearinghouse data repository. The school district reviewed and approved this study. Additionally, the University of Northern Colorado Institutional Review Board reviewed and approved this study. The data utilized for the study had all identifying information removed to ensure anonymity. Variables in the study were linked through a ten-digit identifier and all reports are aggregate data.
3.4. Analyses
Statistical analyses were performed using the statistical software SPSS 22. Archival data included 13 pre-college independent variables to explore how they were related, either individually or in combination, to each of the dependent variables. Descriptive analyses were conducted to examine student demographics, course participation rates, graduation rates, and postsecondary outcomes. Binary logistic regression models were then constructed to examine how the pre-college indicators were associated with postsecondary outcomes. In all analyses, variables were deemed statistically significant if they had p values of 0.05 or less. To analyze the relationship between postsecondary outcomes and student course participation, a series of models were estimated that consider the probability that a student will enroll in college the year following graduation from high school, with controls for student characteristics of SES, minoritization, and gender.
Postsecondary Outcomes
Three binary dependent variables were created from NSC data (0 = no, 1 = yes). These indicated whether the students (a) immediately enrolled in college the fall after high school matriculation, (b) persisted in college enrollment into the second year, and (c) graduated from college within six years from any postsecondary institution. For the gateway course participation analyses, a dichotomous variable that identifies whether or not a student took one or more gateway courses in language arts, mathematics, and science was the predictor of interest. For the college pathway coursework, the number of pathway courses taken in each category was the predictor of interest. For both analyses, the outcomes remained the same—immediate college enrollment, college persistence, and graduating from any postsecondary college within six years versus those who do not graduate within six years. Because these are dichotomous outcomes (i.e., 1 = graduated; 0 = did not graduate), a logistic regression model was employed.
4. Results
4.1. Regression Analyses
The purpose of this study was to explore and determine if a relationship exists between high school students’ enrollment in college preparation courses and increased postsecondary outcomes. The following section explains the findings of this study regarding the three research questions.
Logistic regressions were performed to ascertain the effects of student demographics and postsecondary success indicators on the likelihood that a student would enroll in college the fall following matriculation from high school. We used the data from student cohorts who matriculated from high school in years 2009, 2010, 2011, 2012, 2013, and 2014. The combined cohorts represent 953 students that were included in the immediate college enrollment and college persistence analysis. For college enrollment and persistence, two models were created to test the effect of gateway courses and pathway coursework. All models included the participant’s SES, gender, under-represented minority status, AVID involvement, HSGPA, and completion of the FAFSA. Models one and three include gateway math, gateway science, gateway language arts, whereas models two and four include the pathway coursework of CTE, CE, AP, and honors courses. For the college graduation analysis, we used the data from student cohorts who matriculated from high school in 2009, 2010, and 2011, representing 445 students.
4.2. Immediate College Enrollment
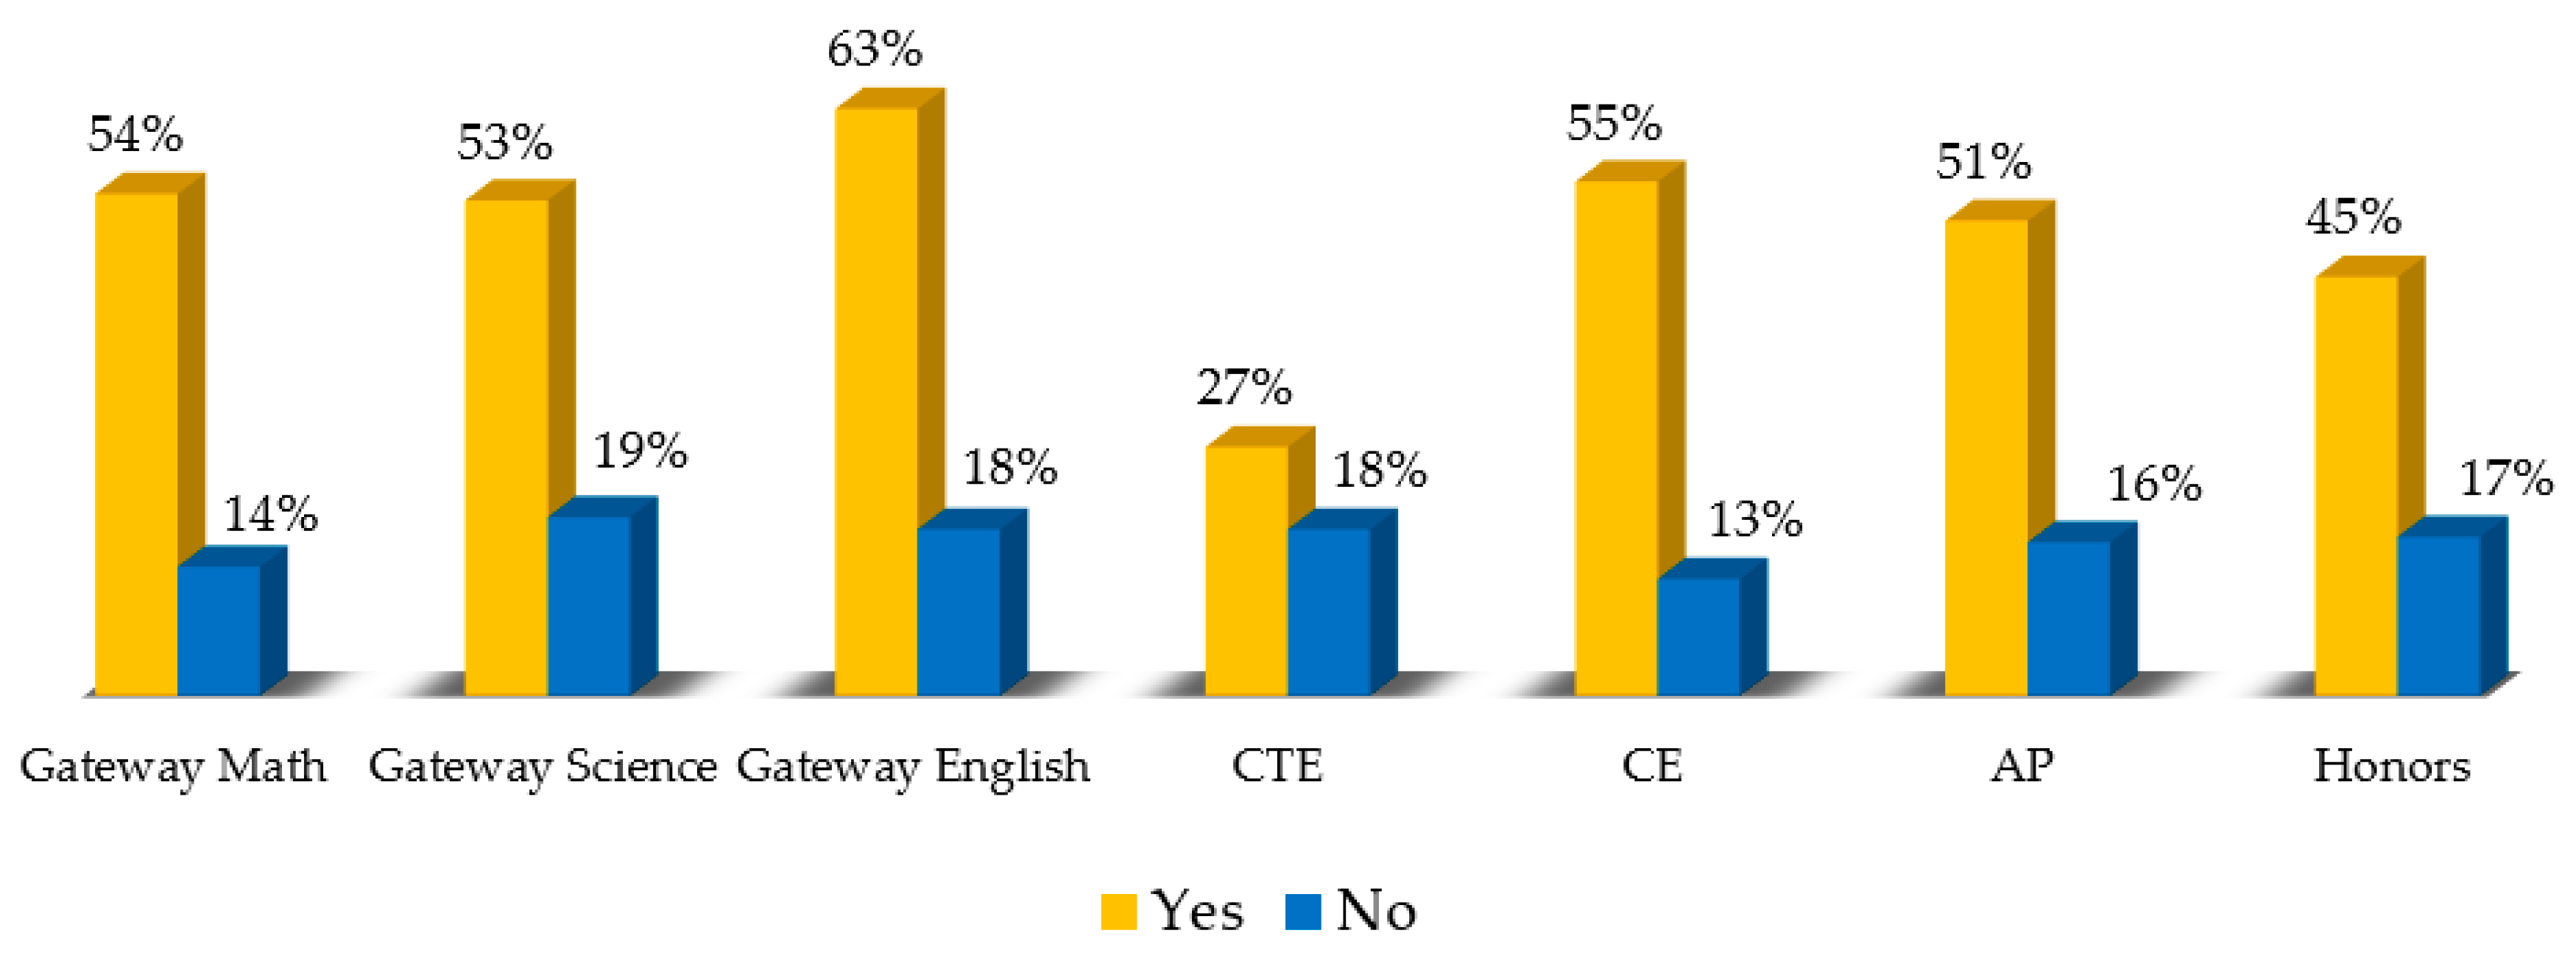
Regarding the students who were enrolled in college immediately after high school, 61% of them took CTE courses, 58% took CE, 36% took AP, 40% took honors, and 18% were involved in AVID.
Figure 1 represents a comparison of students participating in types of coursework and the proportion of the group that immediately enrolled in college following high graduation. Model 1, as shown in
Table 2, investigated the relationship between college gateway coursework and immediate college enrollment. The odds ratio for gateway math indicates that when holding all other variables constant, a student who took one gateway math course was 1.82 times more likely to enroll in college than a student who took no gateway math coursework. Likewise, a student who took one gateway language arts course was 1.86 times more likely to enroll in college than was a student who did not take gateway language arts coursework. Additionally, the effect of HSGPA was relatively equal to that of gateway math participation, with a one-point increase on the four-point HSGPA scale being associated with the odds of enrolling in college increasing by a multiplicative factor of 2.41. The variable with the most significant impact on college enrollment was FAFSA completion which increased a student’s likelihood of immediate college enrollment by 4.04 times as compared to students who do not complete the FAFSA. Finally, gateway science participation was not a significant determinant of a students’ likelihood to immediately enroll in college.
Model 2, as shown in
Table 3 investigated the relationship between college pathway coursework and immediate college enrollment. Completion of the FAFSA had the highest impact on immediate college enrollment, indicating that students who completed the FAFSA were 4.21 times more like to immediately enroll than those who did not complete the FAFSA. Although significant, the effect of HSGPA was much smaller than that of FAFSA completion, with a one-point increase on the four-point HSGPA scale being associated with the odds of enrolling in college increasing by a multiplicative factor of 2.16. Every course that a student took that was categorized as CE and AP was associated with the odds of enrolling in college increasing by a multiplicative factor of 1.25 and 1.17 respectively. The number of CTE and honors courses that a student took were not significant determinants of a students’ likelihood to graduate from college.
4.3. College Persistence
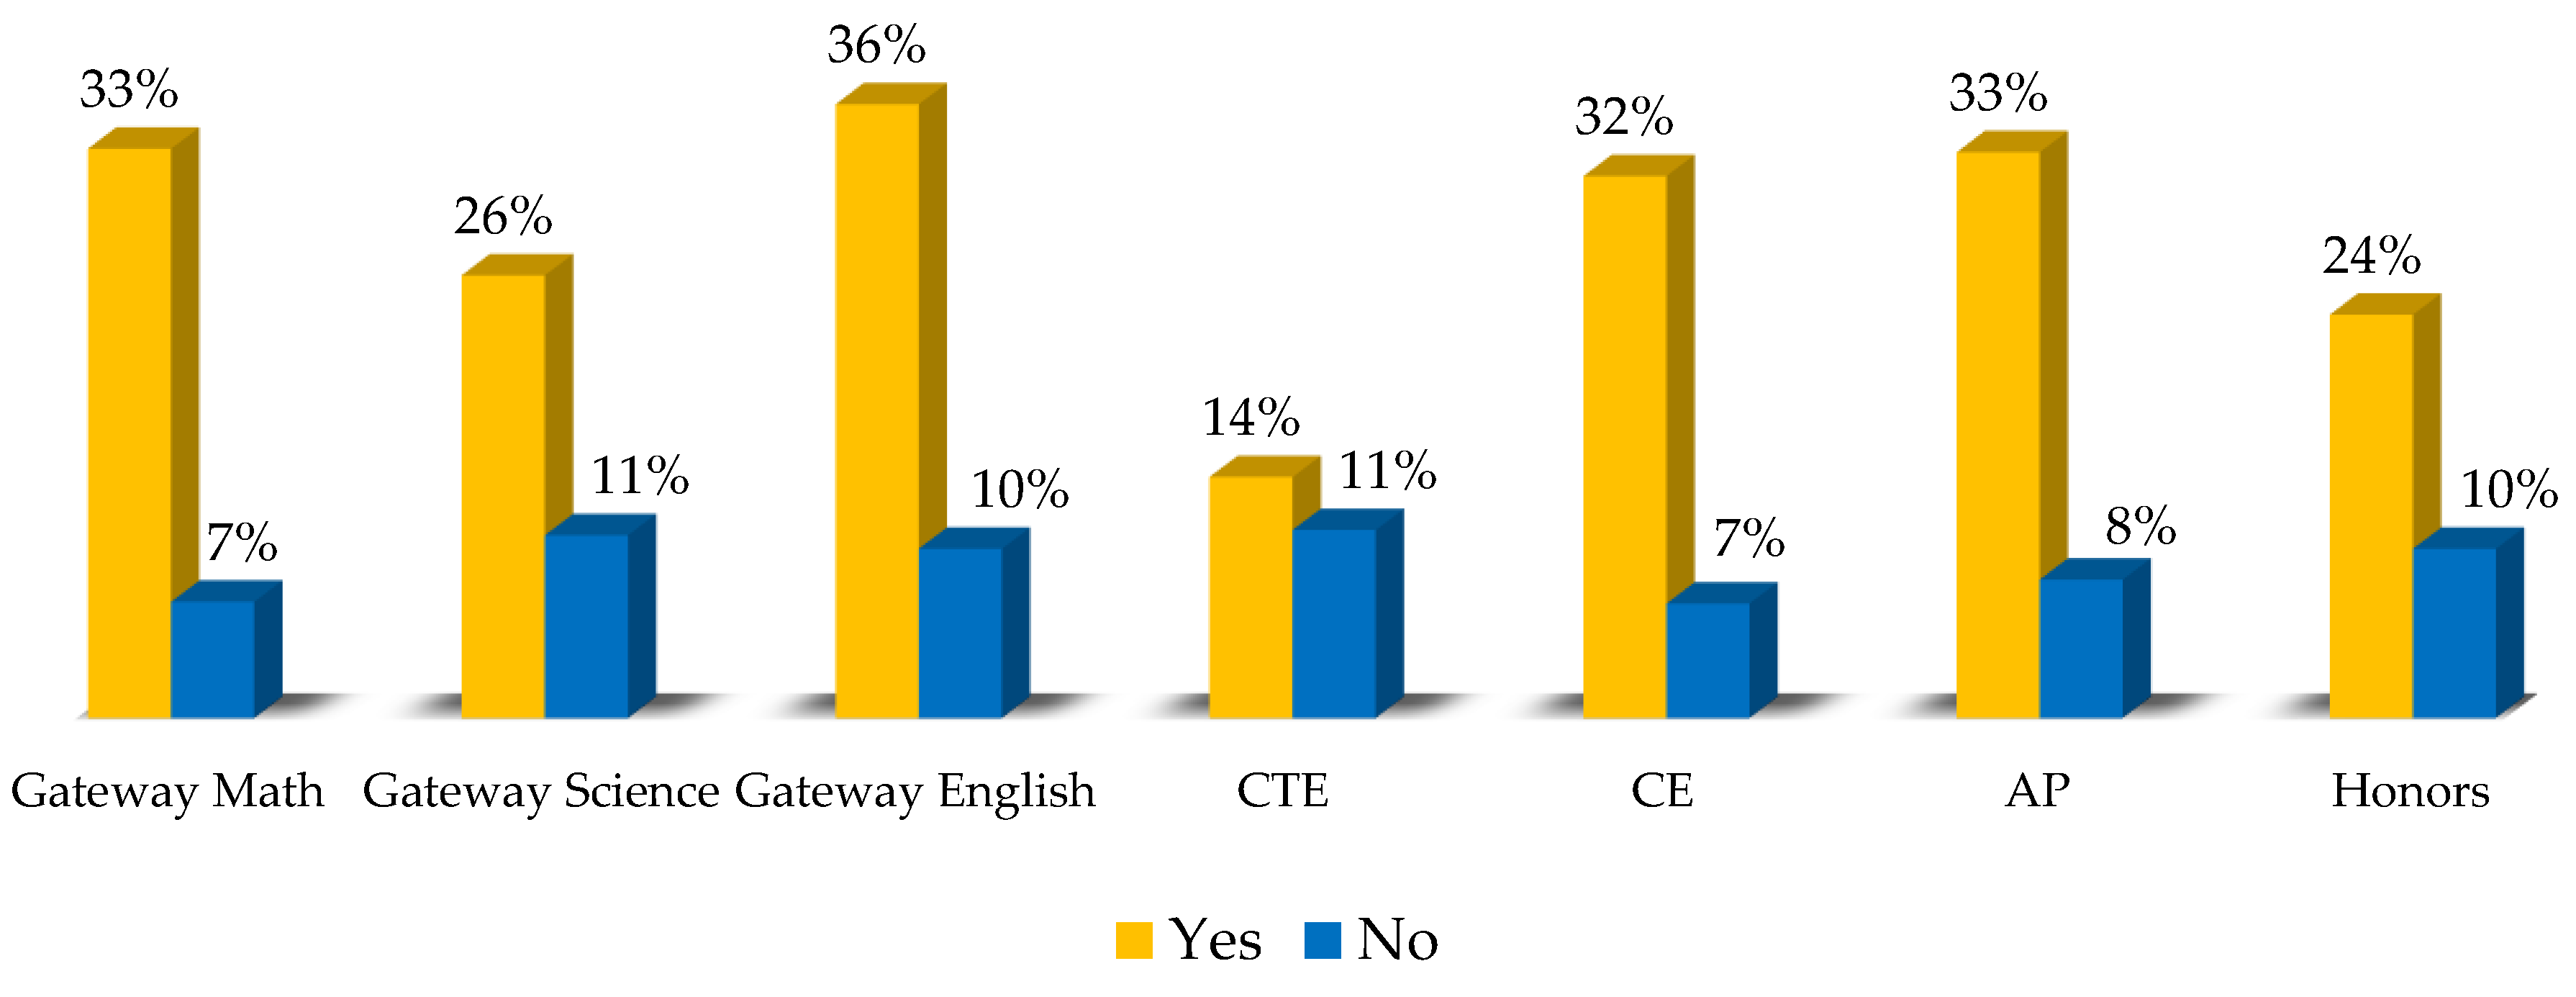
Regarding the students who persisted in college after high school, 56% of them took CTE courses, 60% took CE, 41% took AP, 37% took honors, and 18% were involved in AVID.
Figure 2 represents a comparison of students participating in types of coursework and the proportion of the group that persisted to enroll in college the second year after high school graduation. Model 3, as shown in
Table 3, included the predictor variables of participant’s SES, gender, under-represented minority status, AVID involvement, HSGPA, gateway math, gateway science, gateway language arts, and FAFSA completion. Students who took one gateway math course were 1.78 times more likely to persist in college than a student who took no gateway math coursework. Additionally, the effect of HSGPA was relatively equal to that of gateway math participation, with a one-point increase on the four-point HSGPA scale increasing the odds of persisting in college by a multiplicative factor of 3.18. Gateway science, gateway language arts participation, and FAFSA completion were not significant determinants of a students’ likelihood to graduate from college.
Furthermore, Model 4, shown in
Table 4, investigated the relationship between college pathway coursework and college persistence. The predictor variables were participant’s SES, gender, under-represented minority status, AVID involvement, HSGPA, pathway coursework of CTE, CE, AP, and honors courses, and FAFSA completion. The effect of HSGPA had the most significant impact on college persistence with a one-point increase on the four-point HSGPA scale improving the odds of college persistence by a multiplicative factor of 2.95. Additionally, for every course that a student took that was categorized as CE or AP, the odds of persisting in college increased by a multiplicative factor of 1.16 and 1.17 respectively. FAFSA completion, the amount of CTE, and the number of honors courses that a student took were not significant determinants of a student’s likelihood to persist in college.
4.4. College Graduation
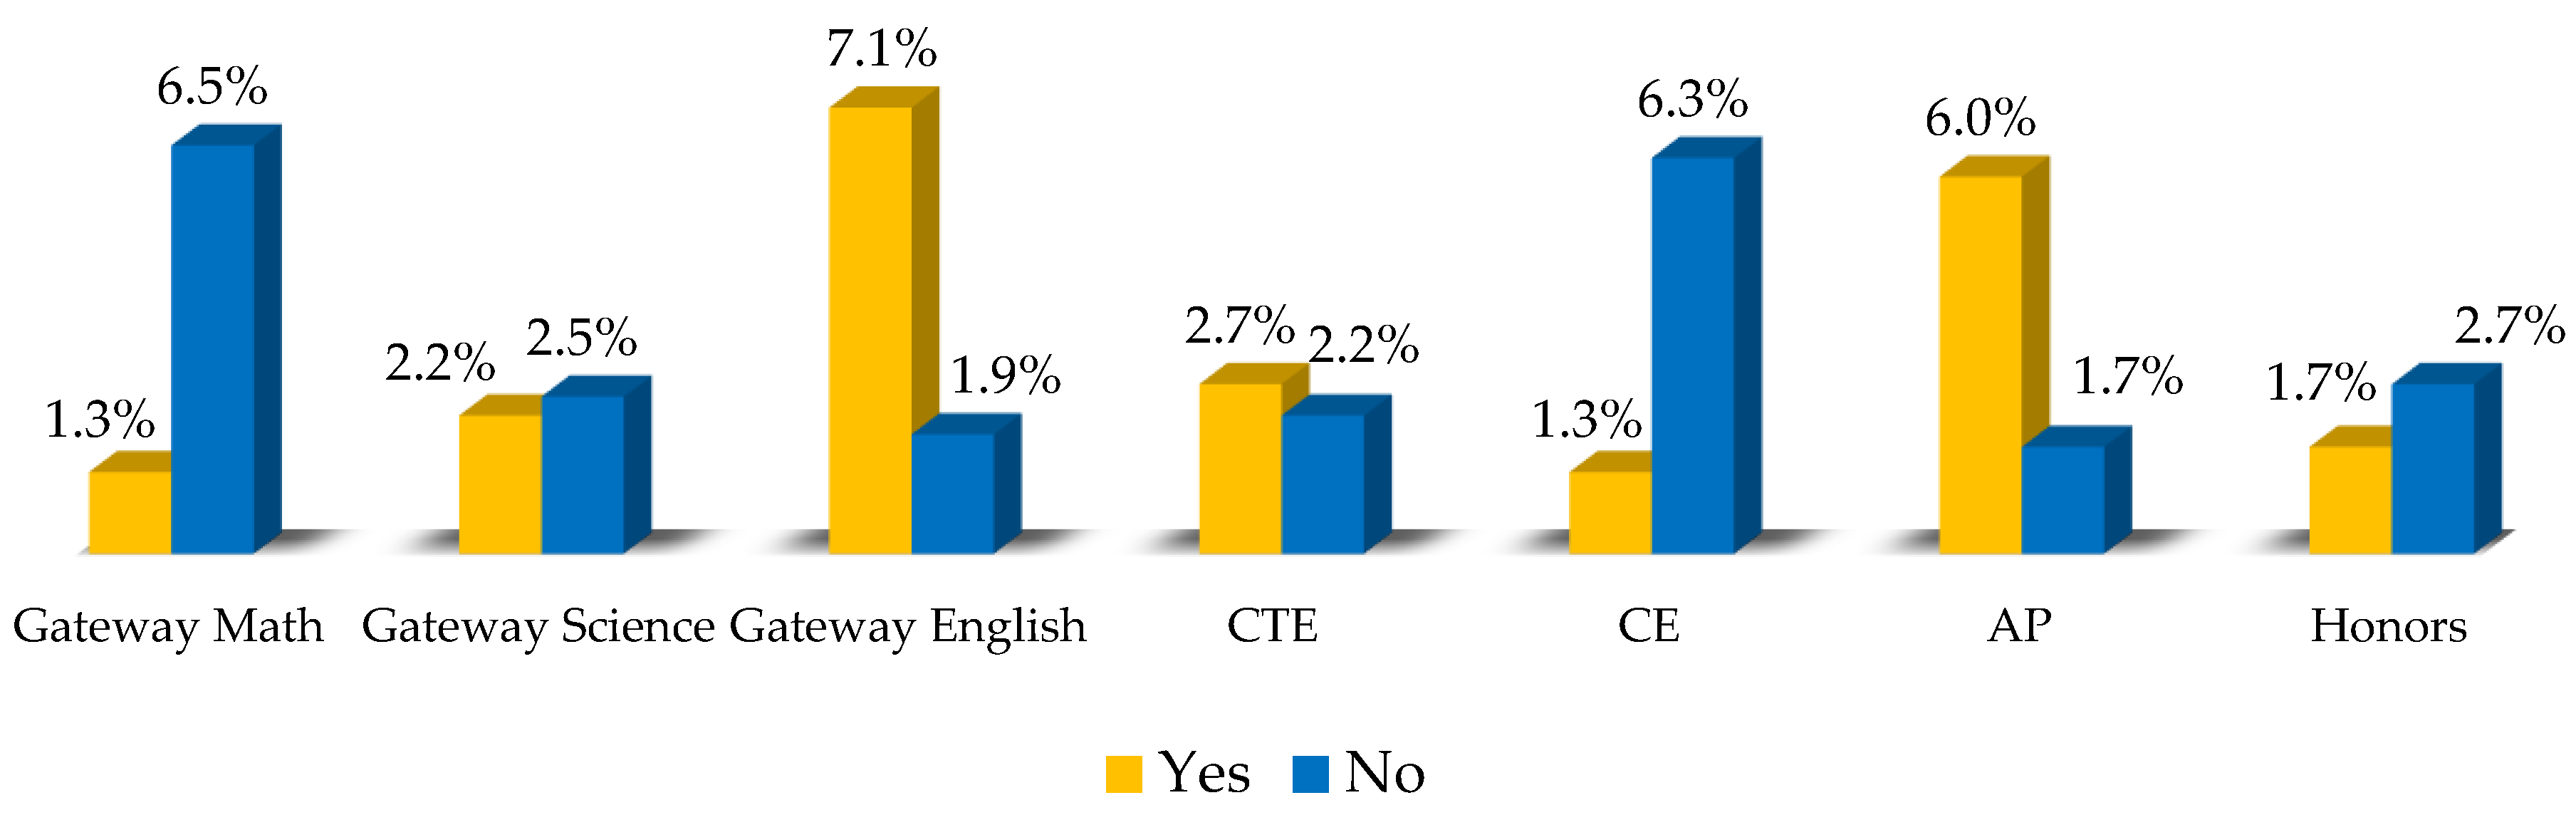
Regarding the students who were enrolled in college the second year after high school, 58% of them took CTE courses, 61% took CE, 42% took AP, 14% took honors, and 11% were involved in AVID.
Figure 3 represents a comparison of students participating in types of coursework and the proportion of the group that graduated from college with six years of graduating from college. Logistic regression was performed to ascertain the effects of student demographics and postsecondary success indicators on the likelihood that a student would graduate within six years of finishing high school. For the college graduation analysis, we used the data from student cohorts who matriculated from high school in 2009, 2010, and 2011, which represented 445 students.
Models 5, 6, and 7 as shown in
Table 5 investigated the relationship between college gateway coursework and graduation within six years. Model 5 examines only the gateway courses, while Model 6 and 7 added immediate enrollment and college persistence, respectively. The predictor variables that were constant across all three models include participant’s SES, gender, under-represented minority status, AVID involvement, HSGPA, gateway math, gateway science, and gateway language arts. The results indicate that a student who took at least one gateway math course was 3.2 times more likely to graduate from college in six years than a student who did not take gateway math coursework. Additionally, the effect of HSGPA was relatively equal to that of gateway math participation, with a one-point increase on the four-point HSGPA scale increasing the odds of graduating from college within six years by a multiplicative factor of 2.81. Gateway language arts and gateway science participation were not significant determinants of a student’s likelihood to graduate from college.
When accounting for immediate college enrollment, the impact of HSGPA was reduced to 2.24 times while gateway math lost value as a significant predictor of graduation. Immediate enrollment becomes the largest contributor to the model indicating that a student was 12.07 times more likely to graduate than peers who do not immediately enroll in college. Model 7 suggests that a student who persists was 12.57 time more likely to graduate and the other predictors in the model were mediated.
Model 8, 9, and 10, as shown in
Table 6, investigated the relationship between college pathway coursework and graduation within six years. Model 8 only examined the pathway courses, while Model 9 and 10 added immediate enrollment and college persistence, respectively. The effect of HSGPA had the most significant impact on six-year college graduation with a one-point increase on the four-point HSGPA scale increasing the odds of graduating from college within six years by a multiplicative factor of 2.34. For every course that a student took that was categorized as CE and AP, the odds of graduating from college within six years increased by a multiplicative factor of 1.26 and 1.23, respectively. The number of CTE and honors courses that a student took were not significant determinants of a student’s likelihood to graduate from college.
Immediate college enrollment indicates that a student who enrolls in college the fall after graduating from high school was 16.5 times more likely to graduate from college in six years than a student who did not immediately enroll. When the model investigated the impact of college persistence, the effect of immediate enrollment was mediated. The odds ratio for college persistence indicates that when holding all other variables constant, a student who persists in college was 16.5 times more likely to graduate from college in six years than a student who did not immediately enroll.
In summary, HSGPA was a predictor of postsecondary success in most models that were developed to investigate the relationship between gateway and pathway coursework, College gateway courses and college pathway courses had varying levels of effect on postsecondary outcomes. When considering the impact of immediate enrollment and persistence, they have a cascading effect on college graduation. In all models, students’ socioeconomic status, under-represented minoritized group membership, and gender did not have an impact on postsecondary outcomes.
5. Discussion
Our results are significant because they provide a nuanced understanding of how the factors associated with participation in college preparatory coursework contribute to postsecondary outcomes. This study found a positive relationship between college preparatory coursework and postsecondary outcomes after controlling for relevant student characteristics known to be associated with postsecondary outcomes. Although previous studies have investigated the performance in specific classes, this study found that participation in college preparatory coursework makes a difference in both proximal and distal postsecondary outcomes. These findings are not meant to indicate that performance in courses does not matter, but that participation also matters. As such, high school courses that are considered college level can assume the additional role of being college preparatory as well [
59]. These findings are also not meant to indicate that college preparatory courses can replace supportive structures that directly teach students skills such as how to study, time management, stress management, and self-care, but that it does give a student the opportunity to apply such skills. Finally, the results do not indicate the reason for the increased college outcomes. As with similar studies, we cannot be sure college pathway courses are linked to the view that students receiving credits in high school enter college with more credits and are thus more likely to enroll, persist and graduate than their peers. Additionally, it could be that having been exposed to college-level work, that these students are more able to manage the increased expectations of college.
The HSGPA was a significant predictor of postsecondary success in models that were created to investigate the data that did not include immediate college enrollment or college persistence. These findings substantiate previous research that indicates that academic preparation as represented by cumulative grade point average was positively related to college graduation [
20,
21,
22,
50,
51,
52,
53,
54,
55,
56,
57,
58,
59,
60,
61,
62]. Counter to the findings of DesJardins et al. but in keeping with more recent findings of Pike et al., the impact of high school performance stays relatively constant for all benchmarks of postsecondary success [
20,
23].
School leaders can work to mitigate the factors that positively advantage students of highly educated parents by influencing the coursework trajectory in a manner that leads to increased postsecondary outcomes for all students, especially for traditionally under-represented students. In doing so, school leaders become agents of change that allow the high school experience to reduce social stratification by providing students with more admission enhancement strategies, which in turn create mechanisms that increase access. Failure to do so will most likely enable micro-events that allow coursework tracks to effect student outcomes and have a deleterious and disparate impact on under-represented students [
63].
Our findings support a distinction in postsecondary outcomes between students that did and did not participate in college preparatory coursework during high school. Because the differences in student demographics such as gender, socioeconomic status, and race/ethnicity were not significant, the data further supports the determination that college preparatory coursework is effective in diminishing disparate and adverse outcomes for students who are traditionally under-represented in postsecondary educational settings. In a longitudinal study of 8000 students, it was found that first-generation students participating in concurrent enrollment programs gained greater benefit than their more affluent peers [
64]. Although there is a longstanding understanding that race, gender, and socioeconomic status account for the majority of the variation in postsecondary success, there is also research that indicates that after controlling for academic performance, the impact of gender is reduced [
13,
65,
66]. The results of the present study are in contrast to the findings of Wilbur and Roscigno that found that low SES was associated with lower college enrollment and college completion, and indicate that access to college preparatory coursework in high school has the ability to meditate student factors that have historically disadvantaged them in postsecondary outcomes. [
67].
Moreover, our results support the notion that when immediate college enrollment is considered, the impact of high school experiences is reduced. Specifically, immediate college enrollment mediated the effect of taking AP, CE, and gateway math coursework. Given that immediately enrolling in college meant that a student was 17 times more likely to graduate, school leaders have put systems in place that are associated with enrollment that are within the control of the school [
68]. According to Rowan-Kenyon, students who delayed enrollment had lower levels of math coursework, parental involvement in high school, and high school support [
66]. Additionally, Pedro, Baker, Bowers, and Heffernan found that in addition to the findings of Rowan-Kenyon, lower student affect and lower engagement in class are negatively related to immediate college enrollment [
69,
70]. As a result, even when students do not have the same level of access to college preparatory coursework, there is still an opportunity for them increase social mobility through college completion through the mechanism of immediate enrollment.
The analysis shows that the factors associated with postsecondary success have a cascading effect on other factors. Students who complete the FAFSA have a greater chance of being immediately enrolled after high school. This is likely due to the partial removal of the financial stress associated with students attending college and is especially the case for first-generation college students who do not have the benefit of family members previously navigating the financial process for attending college. Students immediately enrolled after high school increased their probability of persisting in college through the second year. Students who persist through the second year increase their probability of graduating. Previous research has shown that high school counselors find that helping students plan for and prepare for postsecondary education is a top priority, yet the issue of time is the biggest inhibitor in the follow-through [
71].
Given the tremendous impact of completing the FAFSA on immediate college enrollment, it is not enough to provide information, but rather it is imperative to help students and families navigate the complex college entrance process. Robust school counseling will help to eliminate the limited and incomplete information that students and caregivers often have available when making decisions about postsecondary options [
72,
73]. Bettinger et al. found that individual guidance increased FAFSA completion rates along with college enrollment and persistence [
74]. Likewise, Oreopoulos and Dunn found that increased access to information increased student interest and thus was positively associated with students seeking information about enrollment and financial aid [
75].
5.1. Future Research
The following recommendations were developed for future research on the same topic to provide further direction in preparing students for postsecondary success. First, it is recommended that there is further research on the postsecondary options beyond traditional college settings. Options to be considered in these investigations include military enlistment, certification programs, trades and vocational school, and gap year volunteer opportunities such as AmeriCorps and Peace Corps, and entrepreneurship. Second, it is recommended that there is further research on the differing types of educational options that students pursue. This would include looking at private, public, and for-profit college enrollment, as well as community college, four-year college, and online programs. Third, it is recommended that data about college remediation be examined to determine if college preparatory coursework reduces the need for remediation. Since most remediation courses are non-credit bearing, reducing the amount of remediation needed has an impact on reducing the barriers that are associated with financing higher education.
5.2. Limitations
As with all research studies, some limitations should be mentioned. First, the research contained extant data from just one suburban district in a western state. Second, although there was a robust dataset, some variables of potential pertinence to the study were not available. For example, in the dataset, there was no information on postsecondary alternatives or college remediation.
Additionally, there was no information about outcomes of factors such as AP exams, college course placement scores such as Accuplacer, or ACT scores. These types of data would allow for a more robust analysis of the indicators and outcomes. Another potential limitation was the predictor variables utilized—gateway course participation. By dichotomizing the variables, meaningful information across students may be lost. For example, one student may have had a greater amount of college preparatory high school credits but appear the same according to the definition of participation used for the study. The analysis does not account for variance in performance in those courses either.
5.3. Conclusions
The current study found a positive relationship between college preparatory coursework participation in high school and college enrollment, persistence, and graduation. It is encouraging that this relationship held, even after controlling for relevant student factors associated with postsecondary success and failure. With the majority of students moving on to some form of postsecondary education, it is essential to understand the factors that account for the differences in postsecondary success that may be responsive to intervention [
46].
Our findings support continued advocacy for increased access to a high school curriculum that has the impact of preparing students for college as a mechanism for intervention. Although sweeping interventions such as college prep for all and algebra for all produce questionable results, there is still much room for increased access, especially for students from under-represented groups. Low SES and minoritized students generally attend high schools with fewer options that will mitigate the impact of their life circumstances. Furthermore, even when opportunities are expanded in these schools, we see a pattern of opportunity hoarding occurring when students from privileged backgrounds disproportionally fill the seats in advanced classes [
76].
The results from this study add a nuanced understanding of existing theories about indicators of postsecondary success. As previously mentioned, our results imply there is not a causal effect based on student demographic factors of socioeconomic status, race/ethnicity, and gender, meaning that most groups will similarly benefit from participation in college preparatory coursework in high school. Thus, the results present implications for translation into policy and practice. When school leaders consider strategies for expanding college preparation programs and the subsequent access to those programs, maximizing proportionate participation will help mitigate the school’s traditional role in exacerbating social stratification. It is also vital to ensure that advanced coursework is college preparatory in nature rather than being exclusively college level. Finally, for students who have not benefitted from access, school leaders can still intervene by providing support for immediate enrollment in college.


