An Adaptation Study of Measurement Properties for the Characteristics of Resilience in Sports Team Inventory


Abstract
1. Introduction
2. Study 1
2.1. Method
2.1.1. Participants
2.1.2. Measures
2.1.3. Translation-Back Translation
2.1.4. Procedure
2.1.5. Analysis
2.2. Results
2.3. Discussion
3. Study 2
3.1. Method
3.1.1. Participants
3.1.2. Measures
The Characteristics of Resilience in Sport Teams Inventory (CREST)
Negative Affectivity (NA)
Team Cohesion (TC)
3.1.3. Procedure
3.1.4. Analysis
3.2. Results
3.2.1. Construct Validity
3.2.2. Criterion-Related Validity
3.2.3. Concurrent Validity
3.2.4. Predictive Validity
3.3. Discussion
4. Study 3
4.1. Method
4.1.1. Participants
4.1.2. Measures
The Characteristics of Resilience in Sports Teams Inventory (CREST)
Collective Efficacy in Sports Questionnaire (CESQ)
4.1.3. Procedure
4.1.4. Analysis
4.2. Results
4.3. Discussion
5. General Discussion
6. Conclusions
Author Contributions
Funding
Conflicts of Interest
Ethical Approval
Informed Consent
References
- Badau, D.; Badau, A. The motric, educational, recreational and satisfaction impact of adventure education activities in the urban tourism environment. Sustainability 2018, 10, 2106. [Google Scholar] [CrossRef]
- Woodman, T.; Barlow, M.; Gorgulu, R. Don’t miss, don’t miss, d’oh! Performance when anxious suffers specifically where least desired. Sport Psychol. 2015, 29, 213–223. [Google Scholar] [CrossRef]
- Fraser-Thomas, J.; Côté, J. Understanding adolescents’ positive and negative developmental experiences in sport. Sport Psychol. 2009, 23, 3–23. [Google Scholar] [CrossRef]
- Theokas, C. Youth sport participation—A view of the issues: Introduction to the special section. Dev. Psychol. 2009, 45, 303–306. [Google Scholar] [CrossRef] [PubMed]
- Barlow, M.; Woodman, T.; Gorgulu, R.; Voyzey, R. Ironic effects of performance are worse for neurotics. Psychol. Sport Exerc. 2016, 24, 27–37. [Google Scholar] [CrossRef]
- Mummery, W.K.; Schofield, G.; Perry, C. Bouncing back: The role of coping style, social support and self-concept in resilience of sport performance. Athl. Insight 2004, 6, 1–18. [Google Scholar]
- Fletcher, D.; Sarkar, M. A grounded theory of psychological resilience in Olympic champions. Psychol. Sport Exerc. 2012, 13, 669–678. [Google Scholar] [CrossRef]
- Gould, D.; Dieffenbach, K.; Moffatt, A. Psychological characteristics and their development in Olympic champions. J. Appl. Sport Psychol. 2002, 14, 172–204. [Google Scholar] [CrossRef]
- McKay, J.; Niven, A.G.; Lavelle, D.; White, A. Sources of strain among elite UK track athletes. Sport Psychol. 2008, 22, 143–163. [Google Scholar] [CrossRef]
- Scanlan, T.K.; Ravizza, K.; Stein, G.L. An in-depth study of former elite figure skaters: I. Introduction to the project. J. Sport Exerc. Psychol. 1989, 11, 54–64. [Google Scholar] [CrossRef]
- MacNamara, Á.; Button, A.; Collins, D. The role of psychological characteristics in facilitating the pathway to elite performance. Part 1: Identifying mental skills and behaviours. Sport Psychol. 2010, 24, 52–73. [Google Scholar] [CrossRef]
- MacNamara, Á.; Button, A.; Collins, D. The role of psychological characteristics in facilitating the pathway to elite performance. Part 2: Examining environmental and stage related differences in skills and behaviours. Sport Psychol. 2010, 24, 74–96. [Google Scholar] [CrossRef]
- Fletcher, D.; Sarkar, M. Psychological resilience: A review and critique of definitions, concepts and theory. Eur. Psychol. 2013, 18, 12–23. [Google Scholar] [CrossRef]
- Decroos, S.; Lines, R.L.; Morgan, P.B.; Fletcher, D.; Sarkar, M.; Fransen, K.; Vande Broek, G. Development and validation of the Characteristics of Resilience in Sports Teams Inventory. Sport Exerc. Perform. Psychol. 2017, 6, 158–178. [Google Scholar] [CrossRef]
- Hosseini, A.S.; Besharat, A.M. Relation of resilience with sport achievement and mental health in a sample of athletes. Proc.-Soc. Behav. Sci. 2010, 5, 633–638. [Google Scholar] [CrossRef]
- Galli, N.; Vealey, R.S. “Bouncing back” from adversity: Athletes’ experiences of resilience. Sport Psychol. 2008, 22, 316–335. [Google Scholar] [CrossRef]
- Sarkar, M.; Fletcher, D. Ordinary magic, extraordinary performance: Psychological resilience and thriving in high achievers. Sport Exerc. Perform. Psychol. 2014, 3, 46–60. [Google Scholar] [CrossRef]
- Sarkar, M.; Fletcher, D. Psychological resilience in sport performers: A review of stressors and protective factors. J. Sports Sci. 2014, 32, 1419–1434. [Google Scholar] [CrossRef] [PubMed]
- Galli, N. Team resilience. In Routledge International Handbook of Sport Psychology; Schinke, R.J., McGannon, K.R., Smith, B., Eds.; Routledge: New York, NY, USA, 2016; pp. 378–386. [Google Scholar]
- Yukelson, D.; Weinberg, R. Team resiliency in sport: Research to practice. In Routledge International Handbook of Sport Psychology; Schinke, R.J., McGannon, K.R., Smith, B., Eds.; Routledge: New York, NY, USA, 2016; pp. 547–558. [Google Scholar]
- Morgan, P.B.; Fletcher, D.; Sarkar, M. Defining and characterizing team resilience in elite sport. Psychol. Sport Exerc. 2013, 14, 549–559. [Google Scholar] [CrossRef]
- Aora, S. Achievement Motivation and Resilience among Student Athletes. Ph.D. Thesis, Delhi University, Delhi, India, 2015. [Google Scholar]
- Morgan, P.B.; Fletcher, D.; Sarkar, M. Understanding team resilience in the world’s best athletes: A case study of a rugby union World Cup winning team. Psychol. Sport Exerc. 2015, 16, 91–100. [Google Scholar] [CrossRef]
- MacKenzie, S.B.; Podsakoff, P.M.; Podsakoff, N.P. Construct measurement and validation procedures in MIS and behavioral research: Integrating new and existing techniques. Manag. Inf. Syst. Q. 2001, 35, 293–334. [Google Scholar] [CrossRef]
- Adiloğulları, İ.; Görgülü, R. The adaptation study of emotional intelligence inventory in sport. Int. J. Sports Exerc. Train. Sci. 2015, 1, 83–94. [Google Scholar]
- Beaton, D.E.; Bombardier, C.; Guillemin, F.; Ferraz, M.B. Guidelines for the process of cross-cultural adaptation of self-report measures. Spine 2000, 25, 3186–3191. [Google Scholar] [CrossRef] [PubMed]
- Polit, D.F.; Beck, C.T. Nursing Research: Principles and Methods, 7th ed.; Lippincott Williams & Wilkins: Philadelphia, PA, USA, 2003. [Google Scholar]
- Polit, D.F.; Beck, C.T. The content validity index: Are you sure you know what’s being reported? Critique and recommendations. Res. Nurs. Health 2006, 29, 489–497. [Google Scholar] [CrossRef] [PubMed]
- Dunn, J.G.; Bouffard, M.; Rogers, W.T. Assessing item content-relevance in sport psychology scale-construction research: Issues and recommendations. Meas. Phys. Educ. Exerc. Sci. 1999, 3, 15–36. [Google Scholar] [CrossRef]
- Lynn, M.R. Determination and quantification of content validity. Nurs. Res. 1986, 35, 382–385. [Google Scholar] [CrossRef] [PubMed]
- Waltz, C.F.; Bausell, R.B. Nursing Research: Design, Statistics, and Computer Analysis; F. A. Davis: Philadelphia, FA, USA, 1981. [Google Scholar]
- Davis, L.L. Instrument review: Getting the most from your panel of experts. Appl. Nurs. Res. 1992, 5, 194–197. [Google Scholar] [CrossRef]
- Denollet, J. DS14: Standard assessment of negative affectivity, social inhibition, and Type D personality. Psychosom Med. 2005, 67, 89–97. [Google Scholar] [CrossRef] [PubMed]
- Alçelik, A.; Yildirim, O.; Canan, F.; Eroglu, M.; Aktas, G.; Savli, H. A preliminary psychometric evaluation of the type D personality construct in Turkish hemodialysis patients. J. Mood Disord. 2012, 2. [Google Scholar] [CrossRef]
- Carron, A.V.; Widmeyer, W.N.; Brawley, L.R. The development of an instrument to assess cohesion in sport teams: The group environment questionnaire. J. Sport Psychol. 1985, 7, 244–266. [Google Scholar] [CrossRef]
- Morali, S. Takım Sporlarında Takım Birlikteliğinin ve Dayanışmasının Ölçülmesi. Ph.D. Thesis, Ege University, İzmir, Turkey, 1994. (In Turkish). [Google Scholar]
- Osborne, J.W.; Banjanovic, E.S. Exploratory Factor Analysis with SAS; SAS Institute Inc.: Cary, NC, USA, 2016. [Google Scholar]
- Thompson, B. Exploratory and Confirmatory Factor Analysis: Understanding Concepts and Applications; American Psychological Association: Washington, DC, USA, 2004. [Google Scholar] [CrossRef]
- Fabrigar, L.R.; Wegener, D.T. Exploratory Factor Analysis; Oxford University Press: New York, NY, USA, 2012. [Google Scholar]
- Vidal, R.; Ma, Y.; Sastry, S. Generalized principal component analysis. Interdiscip. Appl. Math. 2016, 40, 22–23. [Google Scholar]
- West, B.J.; Patera, J.L.; Carsten, M.K. Team Level Positivity: Investigating positive psychological capacities and team level outcomes. J. Organ. Behav. 2009, 30, 249–267. [Google Scholar] [CrossRef]
- Meneghel, I.; Salanova, M.; Martínez, I.M. Feeling good makes us stronger: How team resilience mediates the effect of positive emotions on team performance. J. Happiness Stud. 2016, 17, 239–255. [Google Scholar] [CrossRef]
- Aktürk, Z.; Acemoğlu, H. Reliability and validity in medical research. Dicle Med. J. 2012, 39, 316–319. [Google Scholar] [CrossRef]
- Gaur, A.S.; Gaur, S.S. Statistical Methods for Practice and Research: A Guide to Data Analysis Using SPSS; Sage: Los Angeles, CA, USA; London, UK; New Delhi, India; Singapore; Washington, DC, USA, 2009. [Google Scholar]
- Bryman, A.; Cramer, D. Quantitative Data Analysis with SPSS 12 and 13: A Guide for Social Scientists; Routledge: London, UK; New York, NY, USA, 2005. [Google Scholar]
- Field, A. Discovering Statistics Using IBM SPSS Statistics, 4th ed.; Sage: London, UK, 2013. [Google Scholar]
- Kaiser, H.F. An index of factorial simplicity. Psychometrika 1974, 39, 31–36. [Google Scholar] [CrossRef]
- Korkmaz, Ö.; Şahin, A.; Yeşil, R. Study of validity and reliability of scale of attitude towards scientific research. Elem. Educ. Online 2011, 10, 961–973. [Google Scholar]
- Short, S.E.; Sullivan, P.; Feltz, D.L. Development and preliminary validation of the collective efficacy questionnaire for sports. Meas. Phys. Educ. Exerc. Sci. 2005, 9, 181–202. [Google Scholar] [CrossRef]
- Öncü, E.; Feltz, D.L.; Lirgg, C.D.; Gürbüz, B. Psychometric properties of the Turkish version of the Collective Efficacy Questionnaire for Sports. In Proceedings of the 14th International Sport Sciences Congress, Antalya, Turkey, 24–25 April 2016. [Google Scholar]
- Iacobucci, D. Structural equations modeling: Fit indices, sample size, and advanced topics. J. Consum. Psychol. 2010, 20, 90–98. [Google Scholar] [CrossRef]
- Hair, J.F., Jr.; Black, W.C.; Babin, B.J.; Anderson, R.E.; Tatham, R.L. SEM: An introduction. In Multivariate Data Analysis: A Global Perspective, 7th ed.; Pearson Education: Upper Saddle River, NJ, USA, 2010; pp. 629–686. [Google Scholar]
- Hu, L.-T.; Bentler, P. Cutoff criteria for fit indexes in covariance structure analysis: Conventional criteria versus new alternatives. Struct. Equat. Model. 1999, 6, 1–55. [Google Scholar] [CrossRef]
- Jöreskog, K.G.; Sörbom, D. LISREL VI: Analysis of Linear Structural Relationships by Maximum Likelihood, Instrumental Variables, and Least Squares Methods; Scientific Software: Upsala, Sweden, 1986. [Google Scholar]
- Bentler, P.M. EQS Structural Equations Program Manual; Multivariate Software, Inc.: Encino, CA, USA, 1995. [Google Scholar]
- Steiger, H.J. Notes on the Steiger-Lind (1980) Handout. Struct. Equ. Model. 2016, 23, 777–781. [Google Scholar] [CrossRef]
- Kline, R.B. Principles and Practice of Structural Equation Modelling, 4th ed.; The Guilford Press: New York, NY, USA, 2016. [Google Scholar]
- Bagozzi, R.P. Issues in the application of covariance structure analysis: A further comment. J. Consum. Res. 1983, 9, 449–450. [Google Scholar] [CrossRef]
- Cozby, P.C.; Bates, S.C. Methods in Behavioral Research, 11th ed.; McGraw Hill: New York, NY, USA, 2011. [Google Scholar]
- Yaghmaie, F. Content validity and its estimation. J. Med. Educ. 2003, 3, 25–27. [Google Scholar]


| Item | Expert 1 | Expert 2 | Expert 3 | Expert 4 | Expert 5 | Expert 6 | Number of Agreement | I-CVI |
|---|---|---|---|---|---|---|---|---|
| 1 | 4 | 4 | 4 | 4 | 4 | 4 | 6 | 1 |
| 2 | 4 | 3 | 4 | 3 | 4 | 4 | 6 | 1 |
| 3 | 2 | 4 | 3 | 4 | 4 | 3 | 5 | 0.83 |
| 4 | 4 | 3 | 2 | 3 | 4 | 4 | 5 | 0.83 |
| 5 | 3 | 4 | 4 | 4 | 4 | 4 | 6 | 1 |
| 6 | 3 | 2 | 3 | 3 | 4 | 3 | 5 | 0.83 |
| 7 | 3 | 3 | 4 | 3 | 4 | 3 | 6 | 1 |
| 8 | 4 | 4 | 3 | 4 | 3 | 3 | 6 | 1 |
| 9 | 4 | 3 | 3 | 3 | 3 | 3 | 6 | 1 |
| 10 | 4 | 4 | 4 | 4 | 3 | 4 | 6 | 1 |
| 11 | 3 | 3 | 4 | 3 | 4 | 4 | 6 | 1 |
| 12 | 4 | 3 | 4 | 3 | 2 | 4 | 5 | 0.83 |
| 13 | 3 | 4 | 4 | 4 | 4 | 4 | 6 | 1 |
| 14 | 4 | 2 | 4 | 3 | 4 | 4 | 5 | 0.83 |
| 15 | 3 | 4 | 3 | 4 | 3 | 3 | 6 | 1 |
| 16 | 4 | 4 | 4 | 4 | 4 | 4 | 6 | 1 |
| 17 | 4 | 2 | 4 | 3 | 4 | 4 | 5 | 0.83 |
| 18 | 3 | 4 | 4 | 4 | 2 | 4 | 5 | 0.83 |
| 19 | 4 | 4 | 3 | 4 | 3 | 3 | 6 | 1 |
| 20 | 2 | 4 | 3 | 4 | 3 | 3 | 5 | 0.83 |
| S-CVI | 0.93 | |||||||
| Total Agreement | 12 | |||||||
| Proportion relevant | 0.90 | 0.85 | 0.95 | 1.0 | 0.90 | 1.0 | S-CVI/UA | 0.6 |
| Factor Structure | ||||||||||
| Items | Factor Loadings | |||||||||
| DRC | VSP | |||||||||
| item 1 | 0.67 | |||||||||
| item 2 | 0.73 | |||||||||
| item 3 | 0.80 | |||||||||
| item 4 | 0.81 | |||||||||
| item 5 | 0.84 | |||||||||
| item 6 | 0.78 | |||||||||
| item 7 | 0.71 | |||||||||
| item 8 | 0.68 | |||||||||
| item 9 | 0.76 | |||||||||
| item 10 | 0.86 | |||||||||
| item 11 | 0.78 | |||||||||
| item 12 | 0.81 | |||||||||
| item 13 | 0.65 | |||||||||
| item 14 | 0.86 | |||||||||
| item 15 | 0.71 | |||||||||
| item 16 | 0.68 | |||||||||
| item 17 | 0.77 | |||||||||
| item 18 | 0.73 | |||||||||
| item 19 | 0.63 | |||||||||
| item 20 | 0.68 | |||||||||
| Cronbach’s Alpha | ||||||||||
| DRC | 0.94 | |||||||||
| VSP | 0.90 | |||||||||
| Criterion-Related Validity | ||||||||||
| DRC | −0.676 ** | |||||||||
| NA | −0.188 * | 0.317 ** | ||||||||
| ATGT | 0.482 ** | −0.550 ** | ||||||||
| ATGS | 0.487 ** | −500 ** | ||||||||
| GIT | 0.681 ** | −0.573 ** | ||||||||
| GIS | 0.366 ** | −0.443 ** | ||||||||
| Predictive Validity | ||||||||||
| β | t | p | R2 | Adjusted R2 | F | |||||
| Regression Coefficient | 5.296 | 9.179 | 0.000 | 0.449 | 0.443 | 73.657 | 0.000 | |||
| DRC | 0.329 | 4.228 | 0.000 | |||||||
| VSP | −0.409 | −5.518 | 0.000 | |||||||
| Eigenvalues | ||||||||||
| Total | Total variance explained (%) | Cumulative % | KMO | Bartlett’s Test of Sphericity | ||||||
| 10.710 | 53.552 | 53.552 | 0.94 | 0.000 | ||||||
| 1.959 | 9.795 | 63.347 | ||||||||
| Items | Error Variance | Factors | |||||||
| DRC | VSP | ||||||||
| Factor Loadings | |||||||||
| Item 1 | 0.37 | 0.79 | |||||||
| Item 3 | 0.34 | 0.81 | |||||||
| Item 5 | 0.32 | 0.82 | |||||||
| Item 7 | 0.49 | 0.71 | |||||||
| Item 9 | 0.34 | 0.81 | |||||||
| Item 10 | 0.43 | 0.75 | |||||||
| Item 12 | 0.49 | 0.71 | |||||||
| Item 14 | 0.43 | 0.75 | |||||||
| Item 16 | 0.55 | 0.67 | |||||||
| Item 17 | 0.68 | 0.56 | |||||||
| Item 18 | 0.48 | 0.72 | |||||||
| Item 20 | 0.75 | 0.50 | |||||||
| Item 2 | 0.56 | 0.66 | |||||||
| Item 4 | 0.42 | 0.76 | |||||||
| Item 6 | 0.42 | 0.76 | |||||||
| Item 8 | 0.36 | 0.80 | |||||||
| Item 11 | 0.46 | 0.73 | |||||||
| Item 13 | 0.57 | 0.65 | |||||||
| Item 15 | 0.52 | 0.69 | |||||||
| Item 19 | 0.51 | 0.70 | |||||||
| Factors | Ort. | S.S. | Skew. | Kur. | Factor-Factor Correlation | ||||
| DRC | 5.37 | 1.22 | −0.75 | 0.143 | 1 | −0.80 * | |||
| VSP | 2.63 | 1.45 | 0.57 | −0.87 | −0.80 * | 1 | |||
| CESQ *** | 4.08 | 0.76 | −1.19 | 1.97 | 0.729 * | −0.589 * | |||
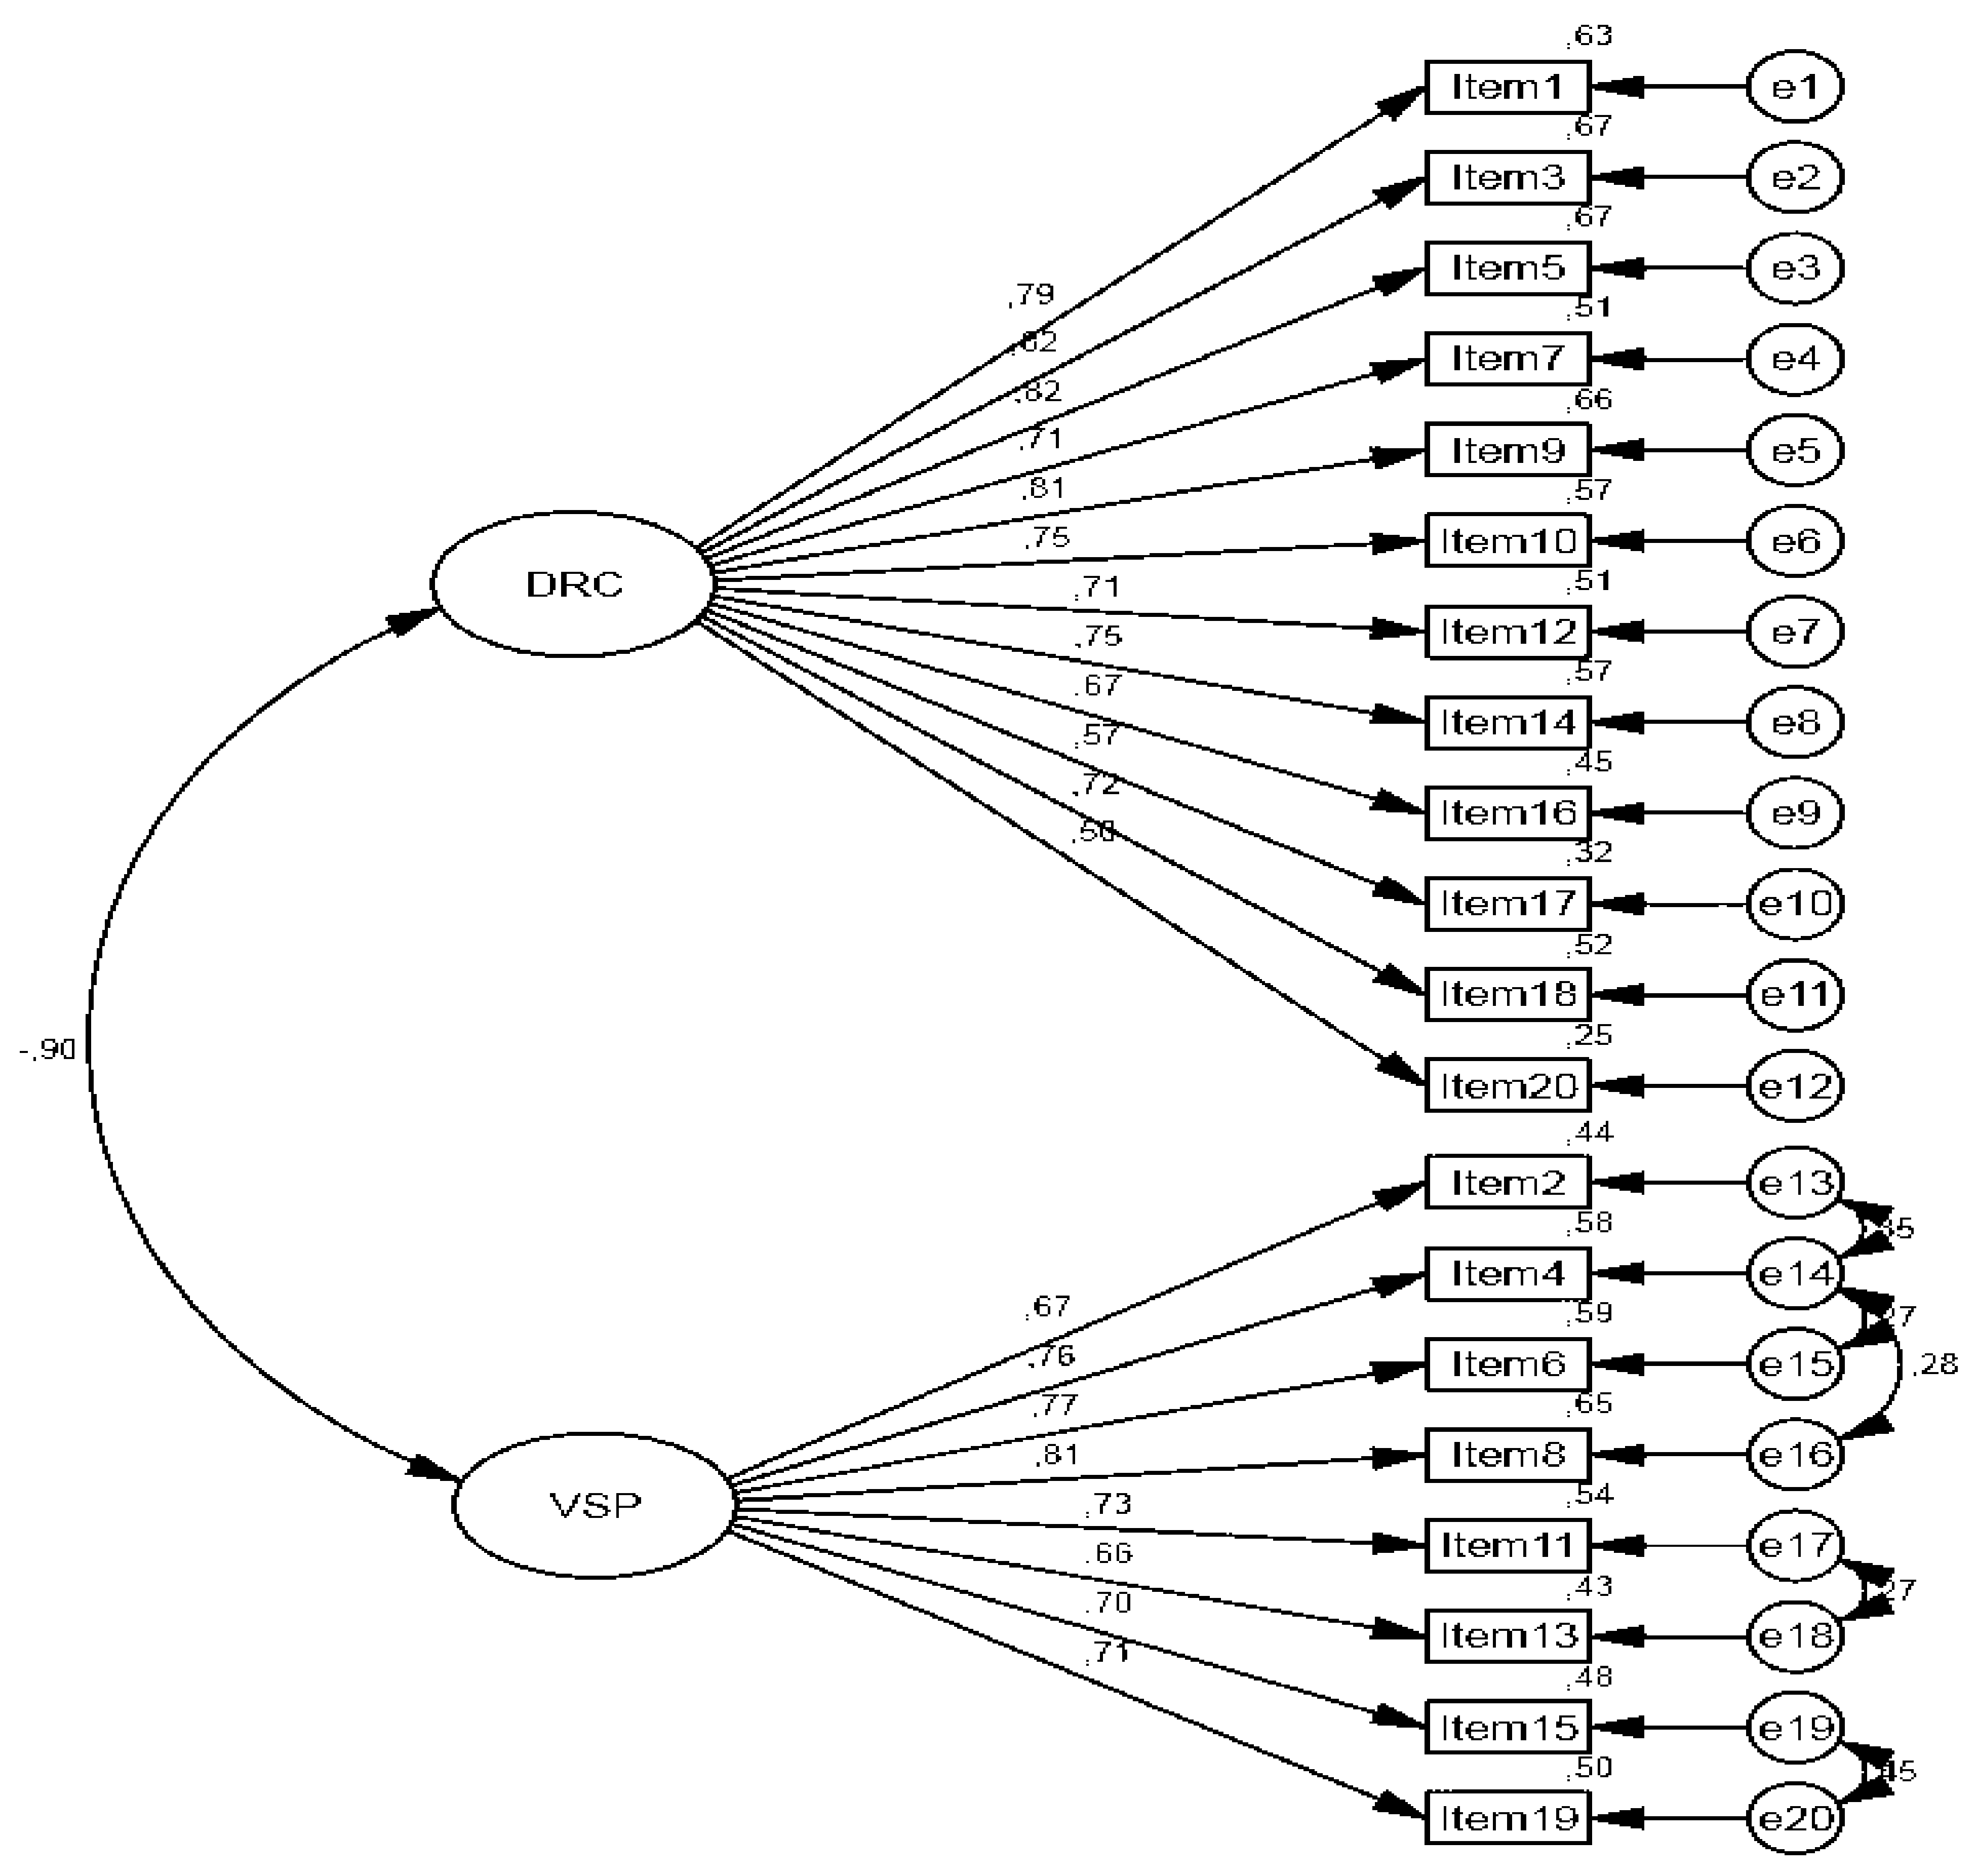
| Study 3 | x2 | df | x2/df * | IFI | TLI | CFI | RMSEA | SRMR | |
| 2-Factor model | 363.66 | 164 | 2.21 | 0.92 | 0.91 | 0.92 | 0.07 | 0.05 | |
© 2018 by the authors. Licensee MDPI, Basel, Switzerland. This article is an open access article distributed under the terms and conditions of the Creative Commons Attribution (CC BY) license (http://creativecommons.org/licenses/by/4.0/).
Share and Cite
Gorgulu, R.; Senel, E.; Adilogulları, İ.; Yildiz, M. An Adaptation Study of Measurement Properties for the Characteristics of Resilience in Sports Team Inventory. Educ. Sci. 2018, 8, 139. https://doi.org/10.3390/educsci8030139
Gorgulu R, Senel E, Adilogulları İ, Yildiz M. An Adaptation Study of Measurement Properties for the Characteristics of Resilience in Sports Team Inventory. Education Sciences. 2018; 8(3):139. https://doi.org/10.3390/educsci8030139
Chicago/Turabian StyleGorgulu, Recep, Ender Senel, İlhan Adilogulları, and Mevlut Yildiz. 2018. "An Adaptation Study of Measurement Properties for the Characteristics of Resilience in Sports Team Inventory" Education Sciences 8, no. 3: 139. https://doi.org/10.3390/educsci8030139
APA StyleGorgulu, R., Senel, E., Adilogulları, İ., & Yildiz, M. (2018). An Adaptation Study of Measurement Properties for the Characteristics of Resilience in Sports Team Inventory. Education Sciences, 8(3), 139. https://doi.org/10.3390/educsci8030139