4.1. The Extent of CT and Creativity in Participants’ Writing
To answer the first two research questions of this study, the participants’ scores based on the CT rubric and creativity scale were analyzed using SPSS (version 29).
Table 1 shows the results of the descriptive analysis for both the variables of CT and creativity of Group A (n = 85) in the study. It provides an initial understanding of the participants’ levels of creativity and CT skills.
The descriptive analysis of the CT variable shows that the mean score was calculated as 56.72. It indicates that the participants displayed an average level of CT skills. The standard deviation value, which is 10.76, demonstrates a moderate degree of variability in the CT scores. The minimum CT score found was 26.67. It represents the lowest score observed in the data. The first quartile (Q1) value is 53.33. It indicates that 25% of the participants had CT scores below this threshold. The median value of 57.78 represents the middle value of the distribution. It indicates that 50% of the participants had CT scores above this point. The third quartile (Q3) value is 60.00. It indicates that 75% of the participants had CT scores below this point. It reflects a range of CT abilities within the sample. The maximum CT score is 82.22. It represents the highest score observed in the data. It suggests that some participants demonstrated advanced levels of CT skills.
Similarly, the mean score for creativity was found to be 57.209. It indicates the high average level of creativity by the participants. A standard deviation value of 9.158 was observed. It suggests that there is a moderate value of variability in the creativity scores. Some of the participants exhibited higher or lower levels of creativity. The 30.556 value for creativity was the minimum value. It represents the lowest score observed in the data. The 52.778 value of the first quartile (Q1) indicates that 25% of participants had creativity scores below this threshold. The median value of 55.556 represents the middle value of the distribution. The 62.111 value of the third quartile (Q3) shows that 75% of the participants had creativity scores below this point. This indicates the range of creativity expressed by the participants. The highest observed creativity score is signified by the maximum value of 87.111. It suggests exceptional levels of creativity by some of the participants.
Moreover,
Table 2 shows the results of the descriptive analysis of data from Group B (n = 82). The descriptive statistics were computed for both variables. First comes the description of the CT variable. The mean score for CT was 46.72, and the value of the standard deviation was 13.81. The minimum score observed was 0. It indicates that some participants had the lowest level of CT skills. The maximum score was observed as 77.78. It suggests that some participants demonstrated higher levels of CT. The value of 42.22 in the first quartile (Q1) shows that 25% of participants had CT scores below this value. The middle value is represented by the median score, which was 44.44. The value of 55.56 in the third quartile (Q3) shows that 75% of participants had CT scores below this value.
The descriptive analysis of the creativity variable showed strikingly similar results. The mean score of 44.35 indicates the average level of creativity of Group B participants. The moderate degree of variability of creativity is indicated by the value of standard deviation, which is 11.63. The minimum level is displayed by the minimum score, which is 10.11. The maximum score of 70.78 demonstrated the higher levels of creativity by some participants. The first quartile (Q1) value of 32.11 shows that 25% of scorers reached below this score. The median value observed was 45.22. The third quartile (Q3) value of 50.56 shows that 75% of scorers reached below this score.
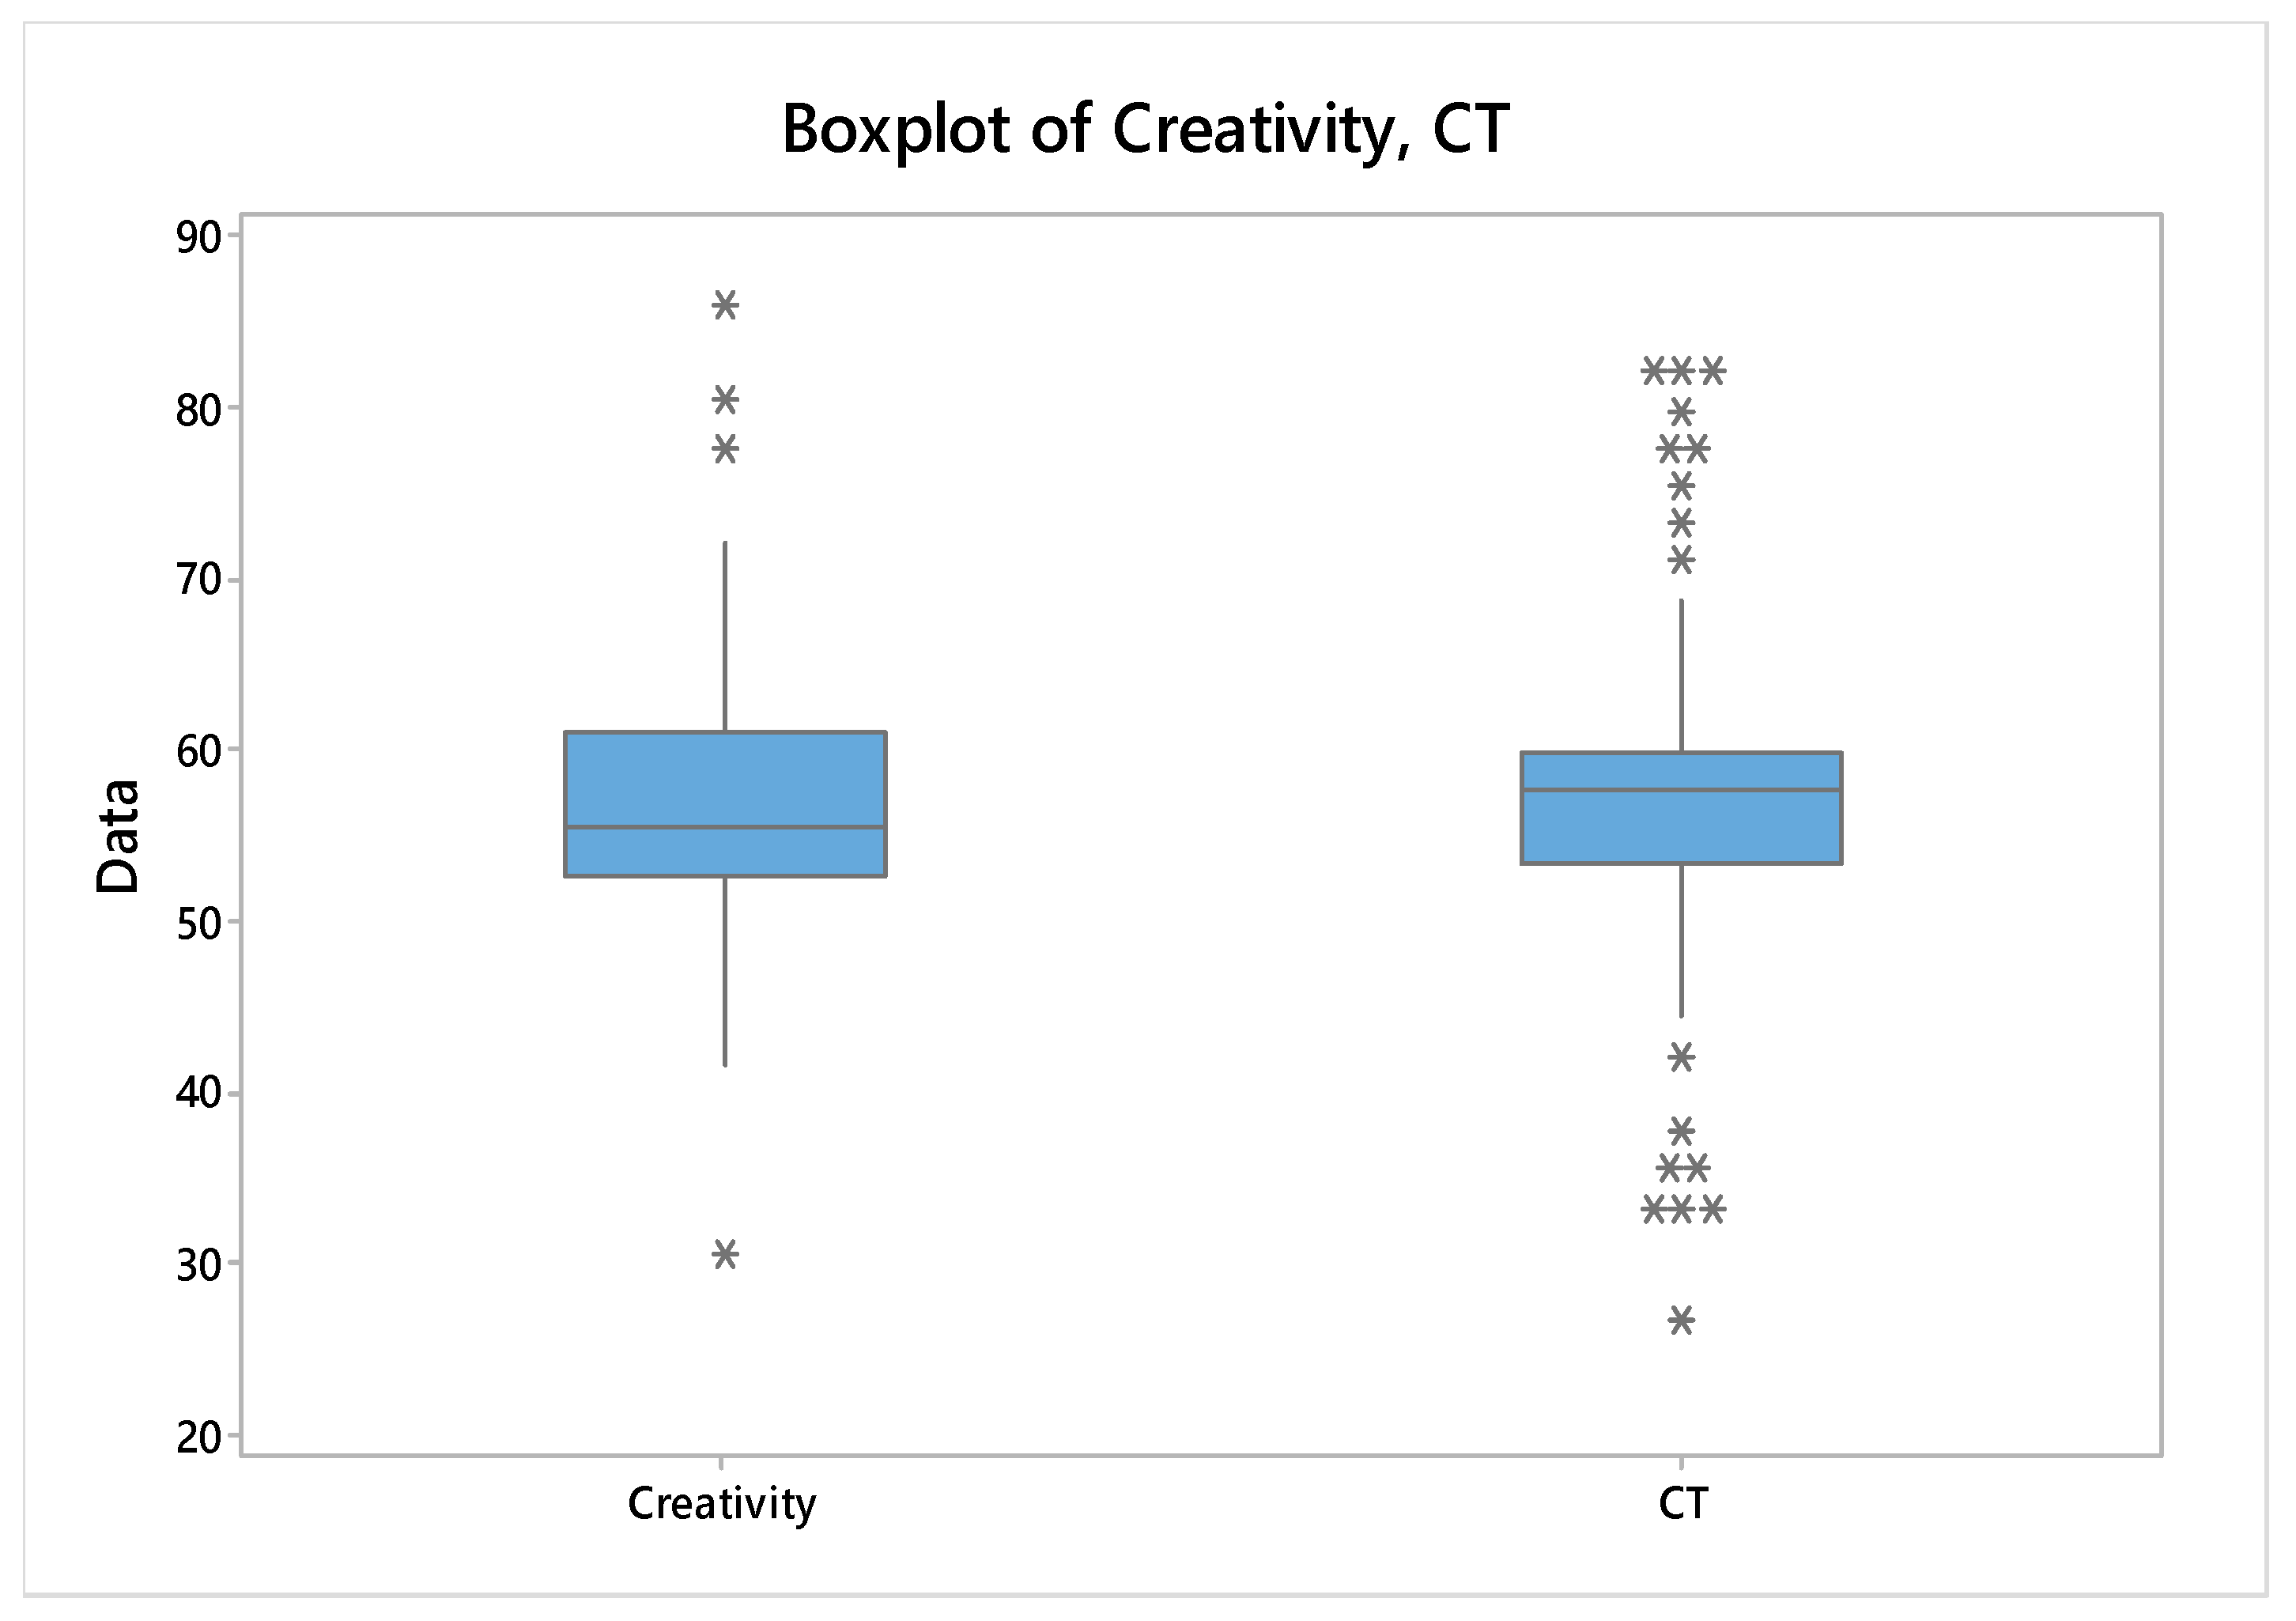
The researchers also produced boxplots for the data of each group. The boxplots provide, as shown in
Figure 3, visual representations of the distribution of scores for CT and creativity and identify the spread of the scores of these variables through the data. The CT and creativity scores for Group A are displayed in the boxplot in
Figure 3. The creativity scores on the boxplot reveal that the median value is 55.556. The interquartile range (IQR) spans from 52.778 to 61.111. The whiskers extend to the minimum and maximum scores of 30.556 and 86.111, respectively. The distribution shows that the majority of scores in Group A are in the middle range, and there are some outliers on both ends of the distribution. The boxplot displays the CT scores of Group A as well. The median value displayed is 57.78. The IQR spans from 53.33 to 60.00. The extension of the whiskers shows the minimum and maximum scores of 26.67 and 82.22, respectively. Most of the CT scorers in Group A fall within the middle range, like those of creativity. Nevertheless, the outliers are comparatively more in number on both ends.
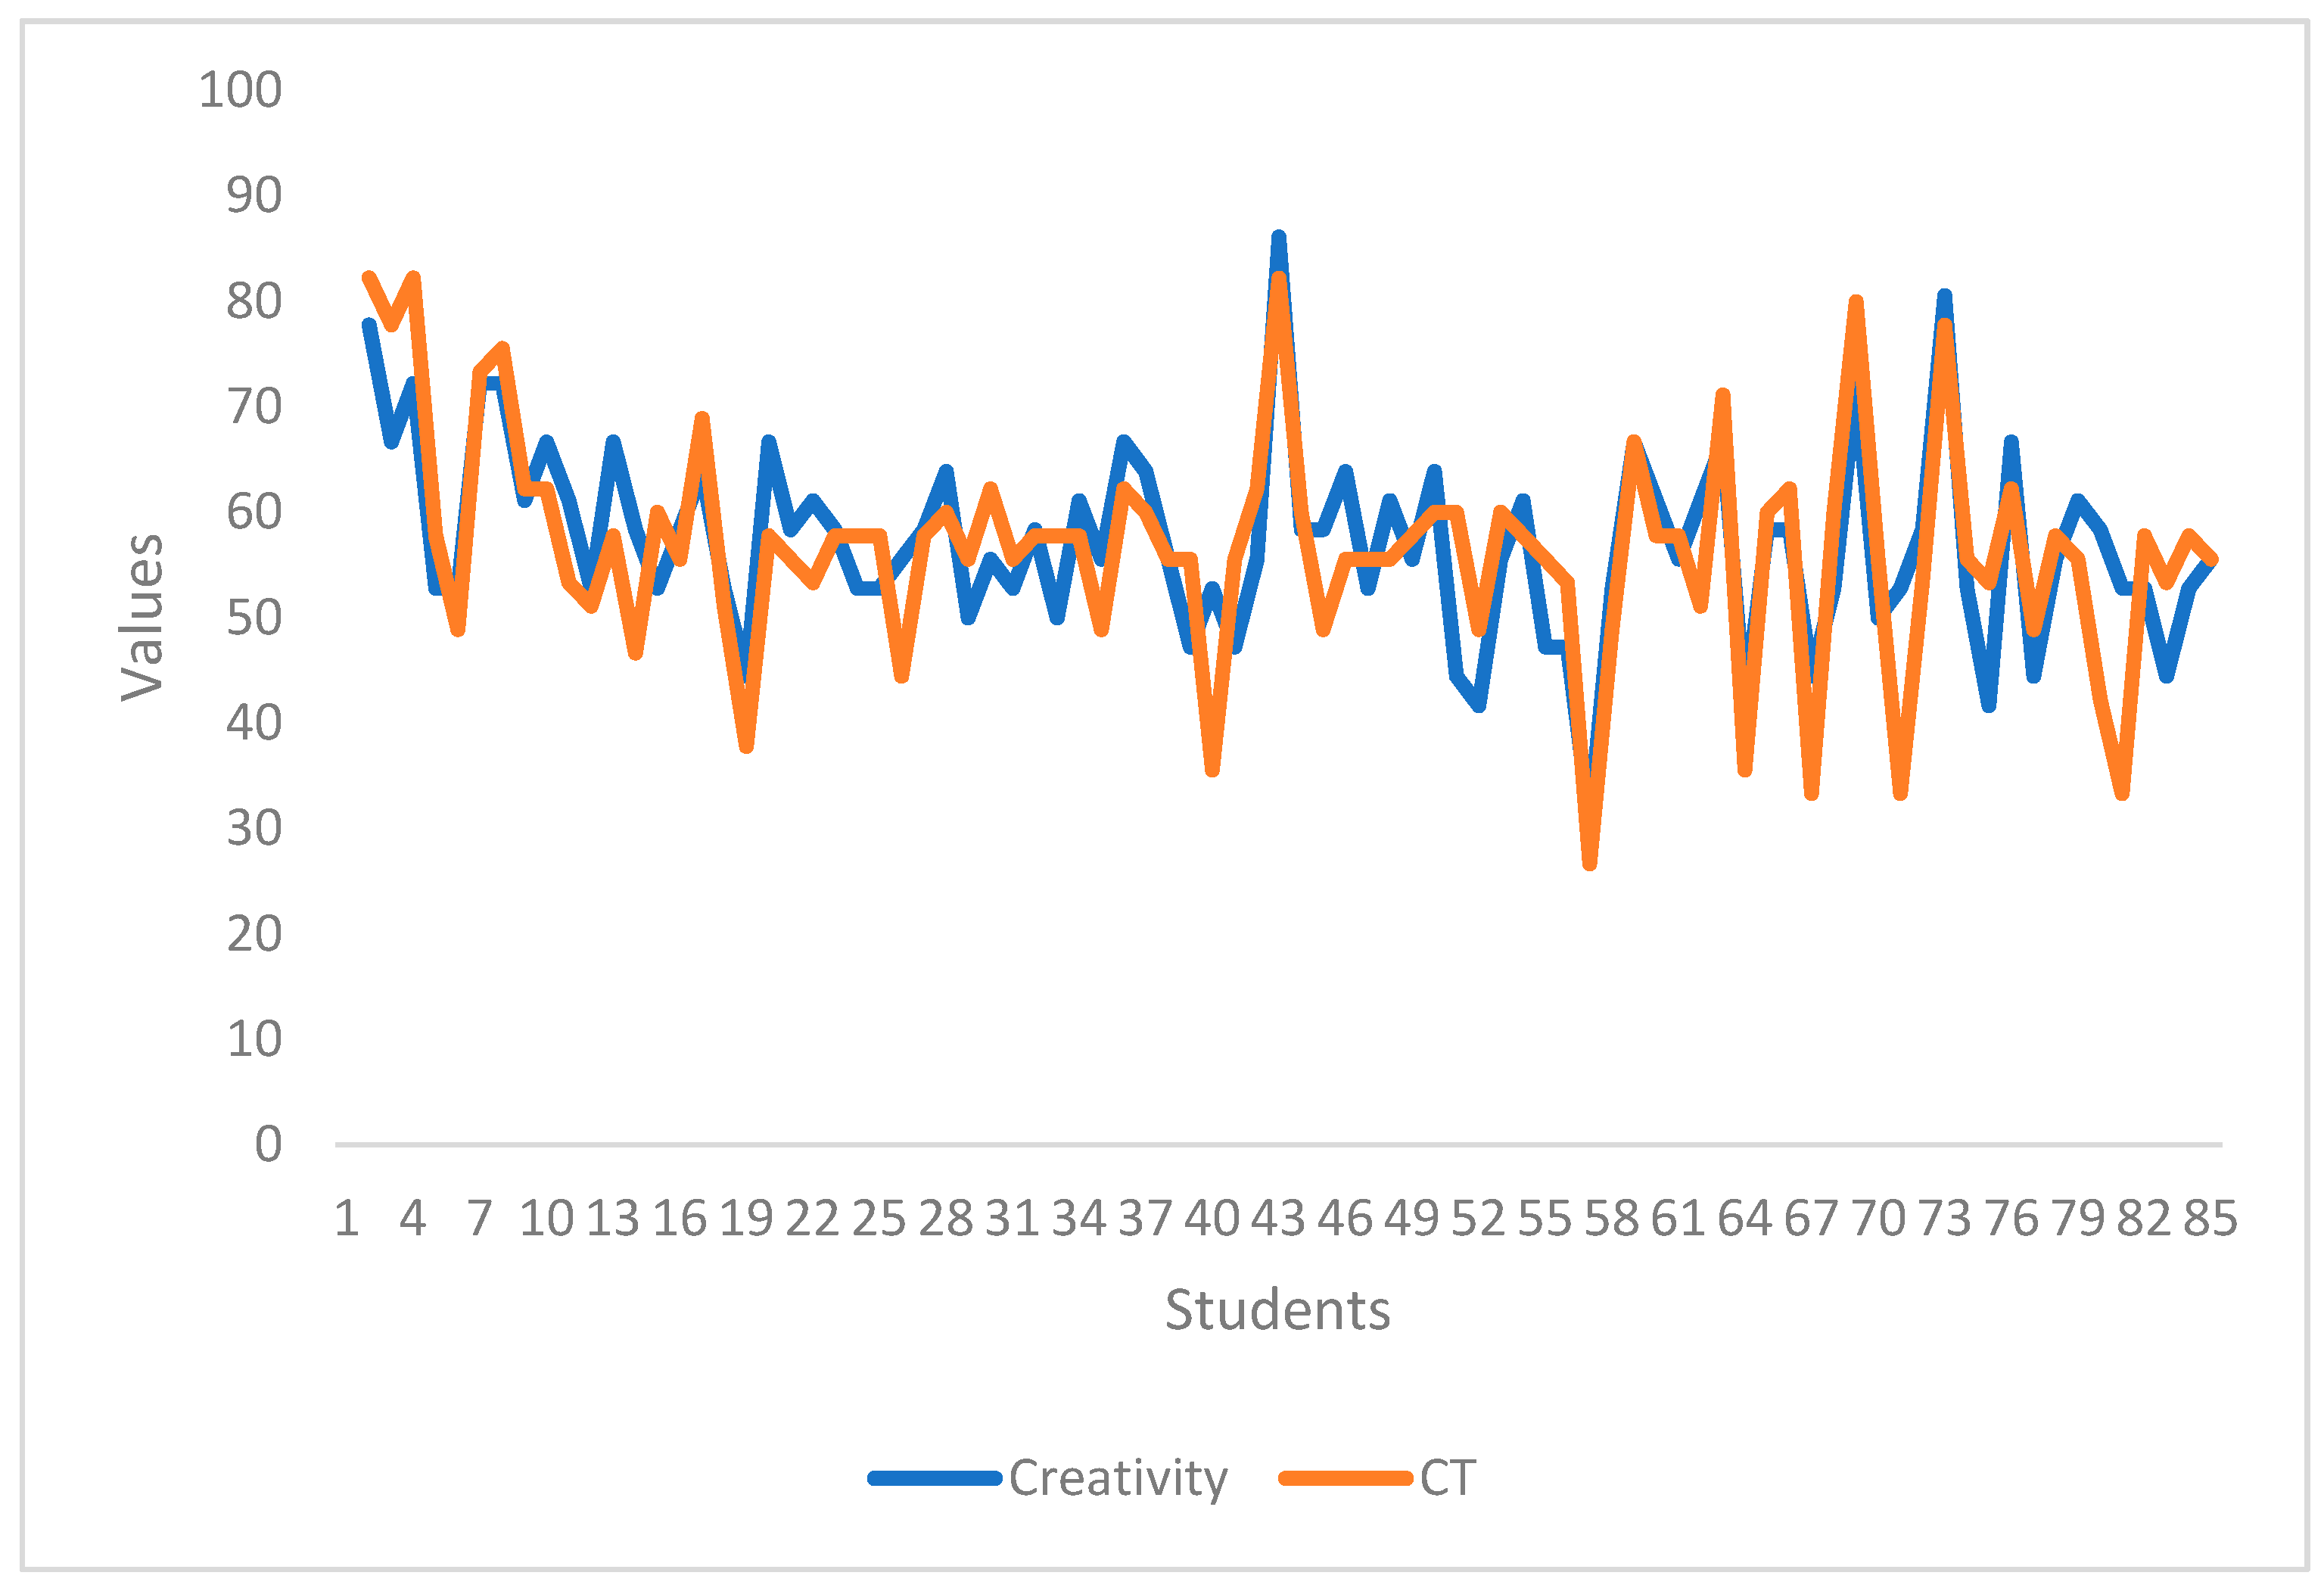
The line chart of Group A in
Figure 4 indicates the points of variation in the CT and creativity scores observed in the data. The CT scores show variations that range from 26.67 to 82.22. The creativity scores also fluctuate throughout the data. They range from 30.56 to 86.11. Fluctuations are shown in the line chart through the higher peaks and lower points of both variables. The range of variability is approximately similar for both variables.
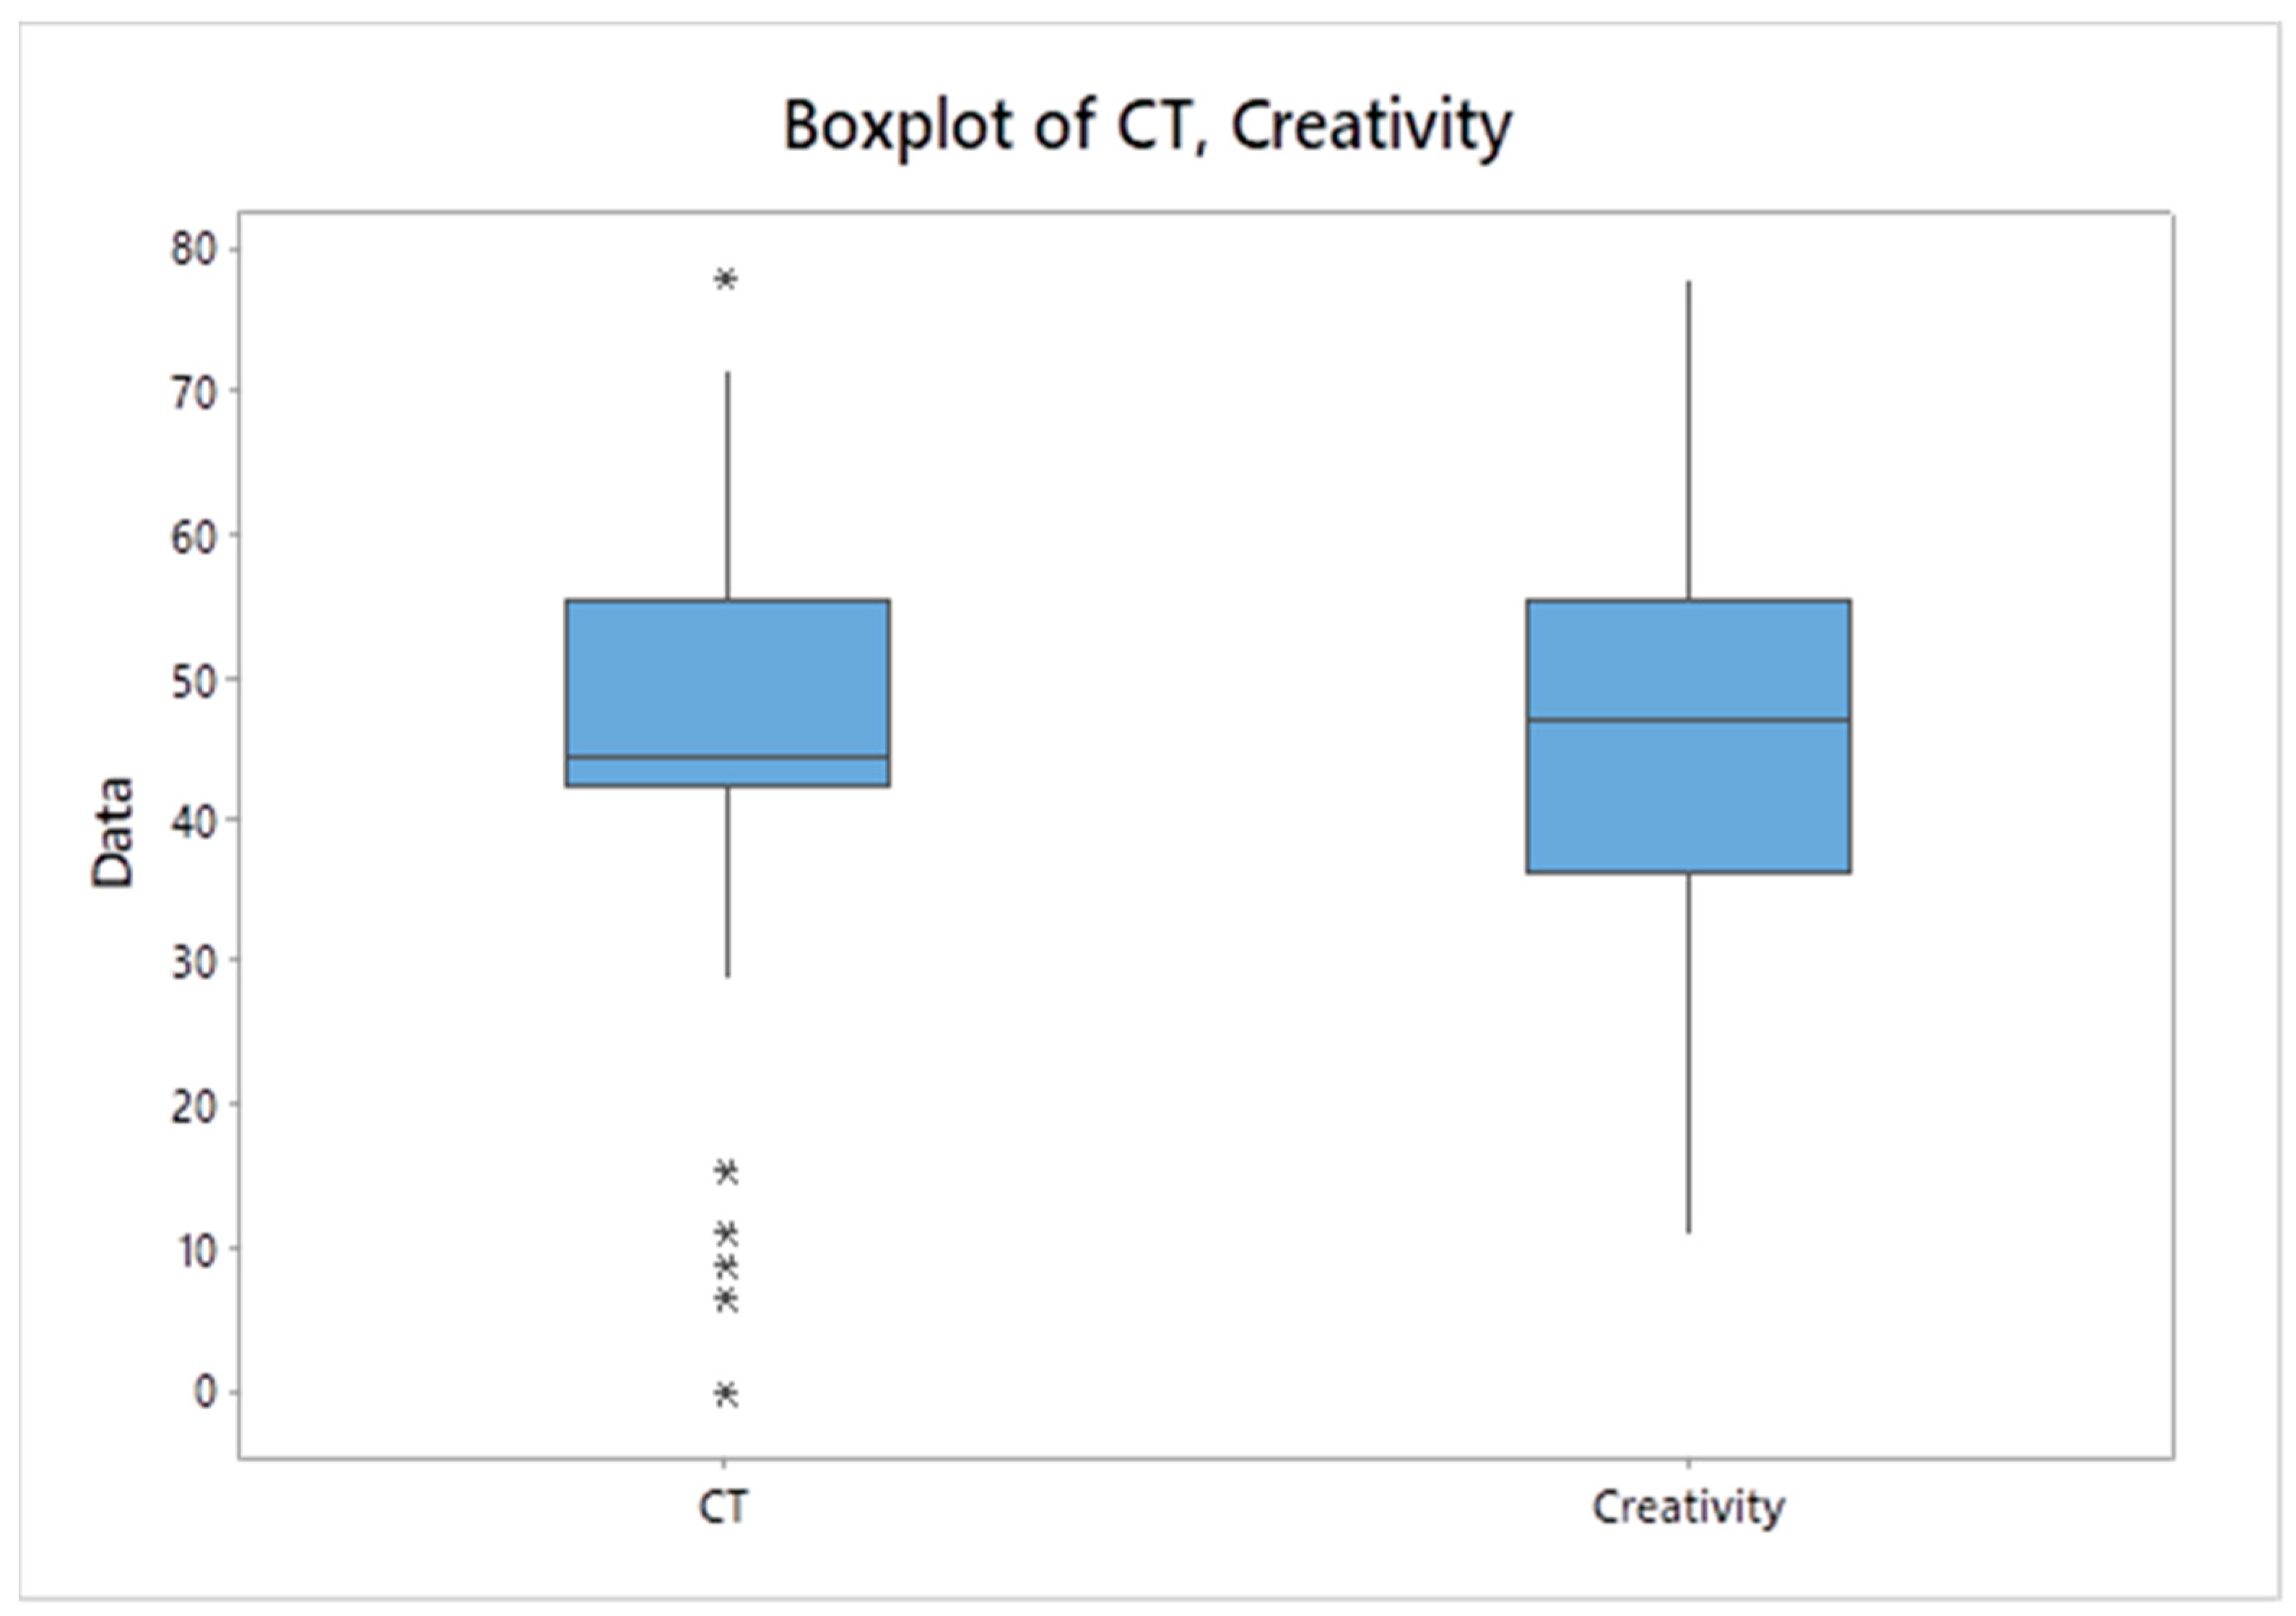
The boxplot of Group B in
Figure 5 displays the values of CT and creativity of the Group B scores. The boxplot shows that the median value of creativity is 47.22. Its IQR spans from 36.11 to 55.56. The extension of the whiskers shows the minimum and maximum scores of 11.11 and 77.78, respectively. This indicates that the score of creativity of Group B is lower as compared to that of Group A. It also suggests that Group B has a narrow spread of values and has fewer outliers. The boxplot of the CT scores of Group B shows that the median value is 44.44. The IQR is from 42.22 to 55.56. The extension of the whiskers reveals the minimum and maximum scores of 0.00 and 70.78, respectively. The boxplot shows that the scores for CT in Group B are also lower as compared to those of Group A. Group B also has a narrower distribution and fewer outliers. These outliers were kept because their impact on the overall conclusions was minimal, and they did not substantially influence the key findings of this study.
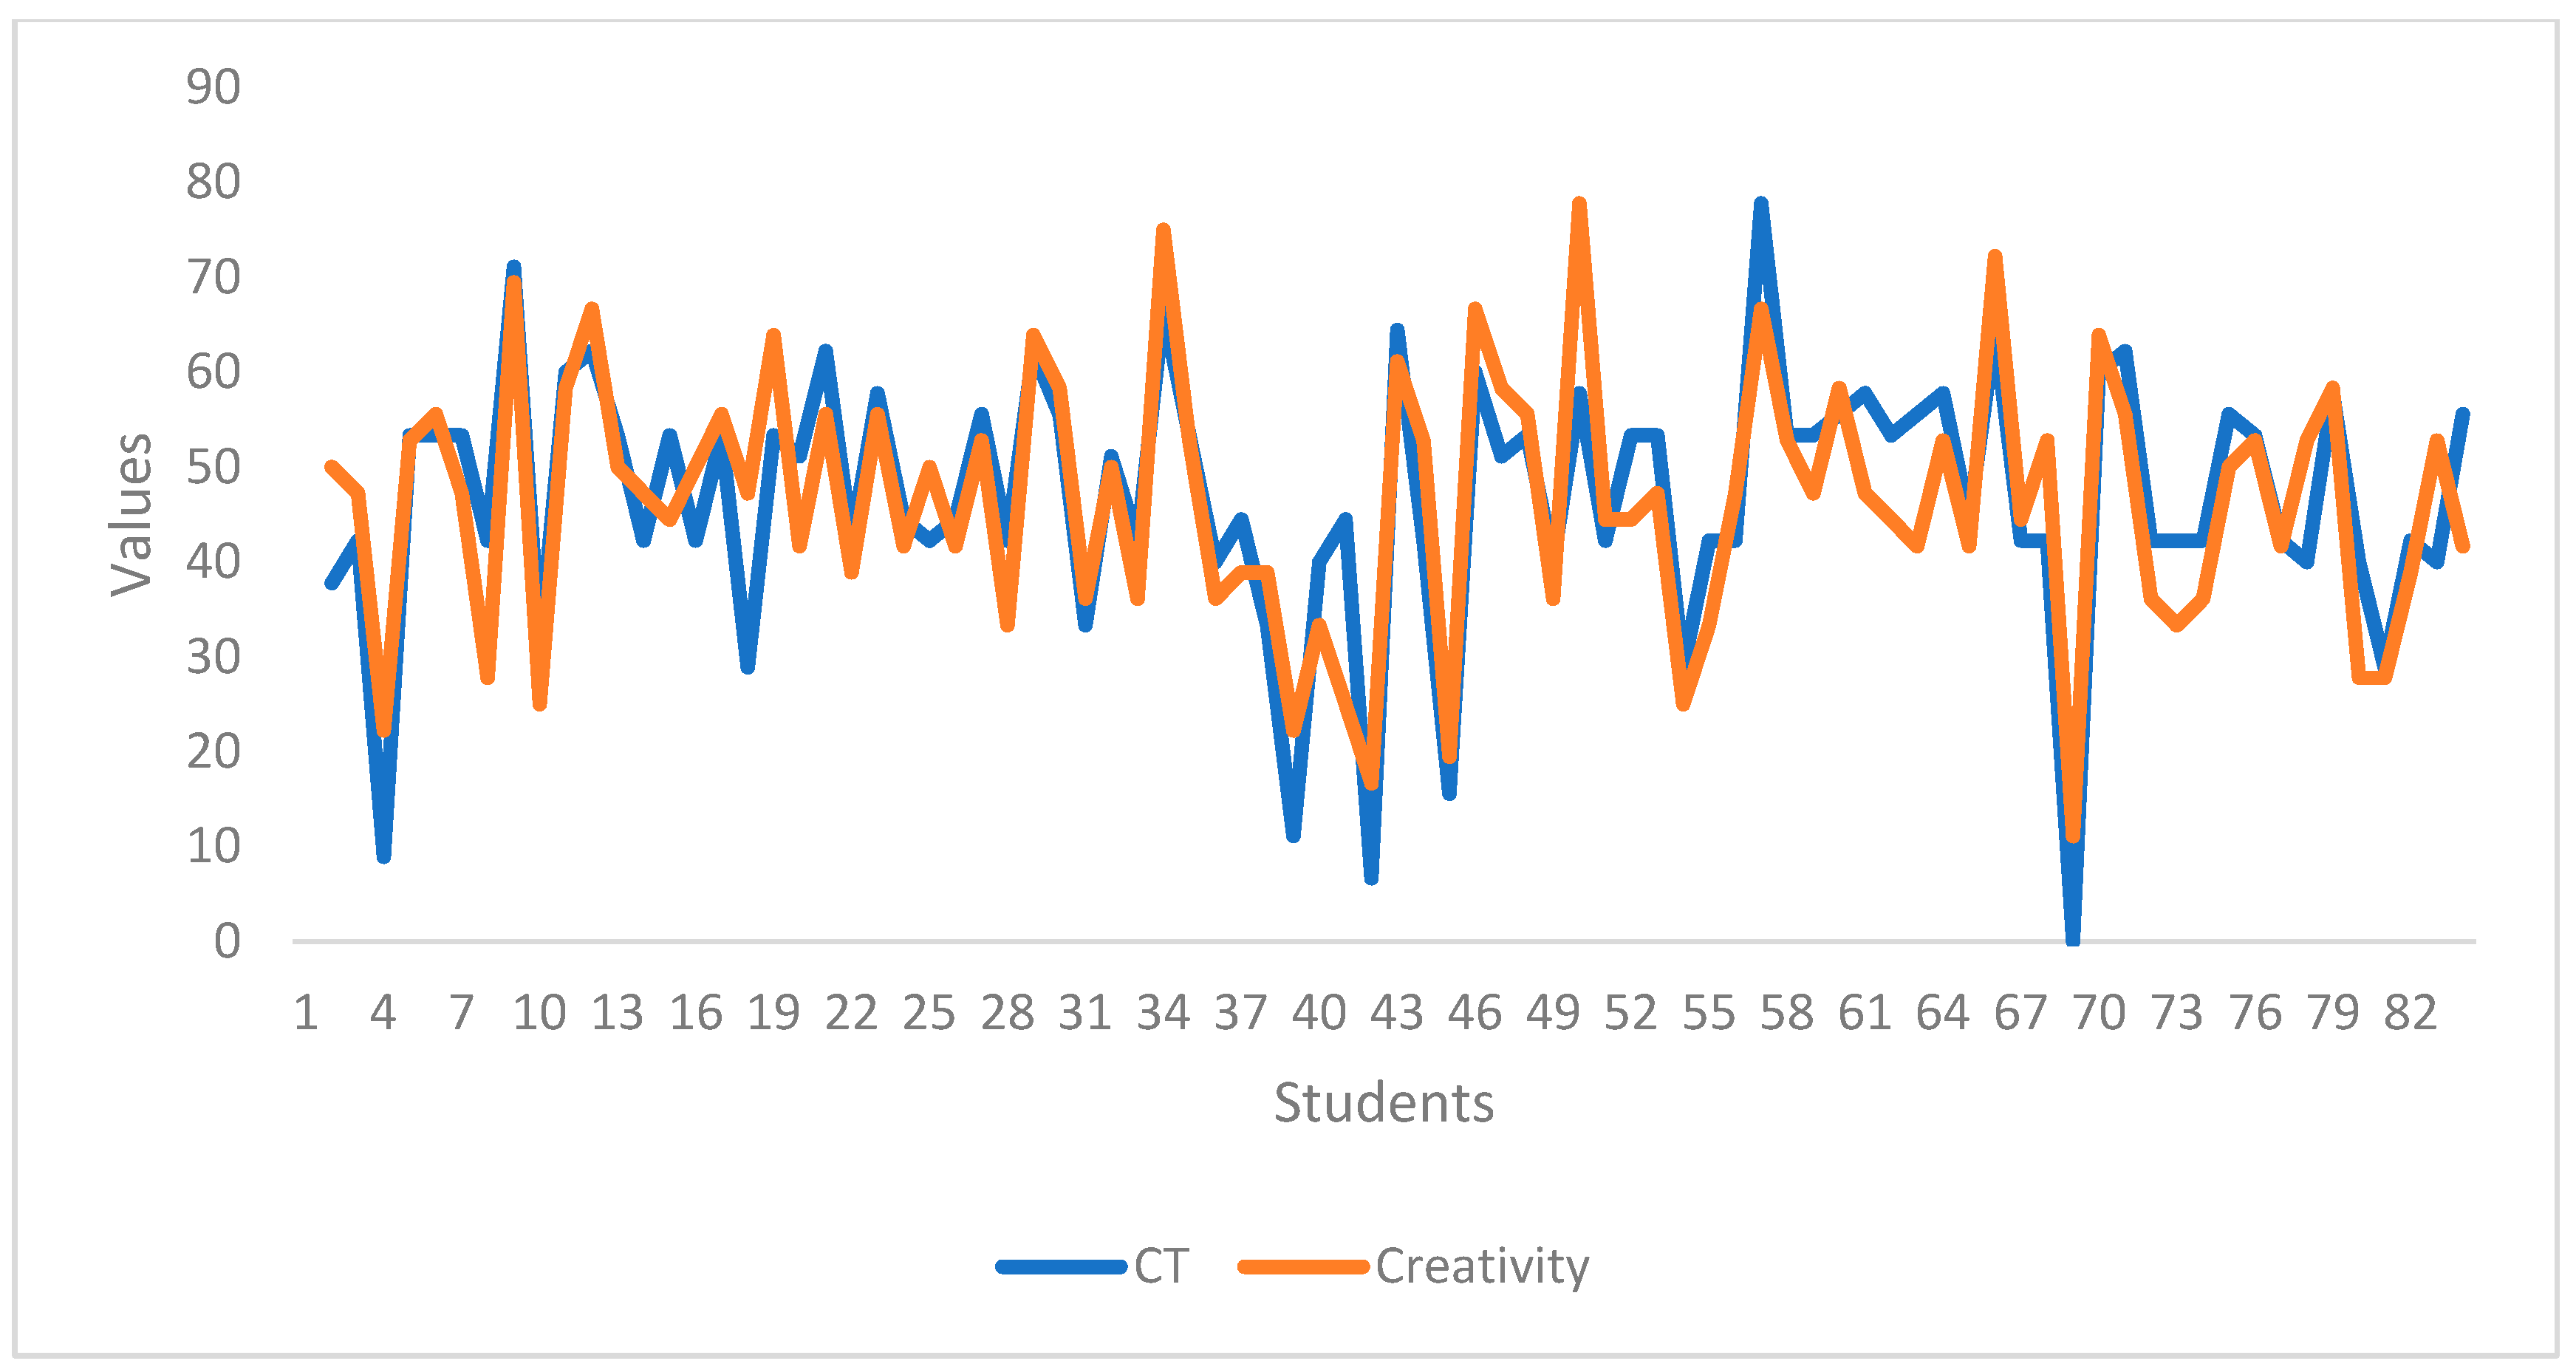
The line chart, as shown in
Figure 6, of Group B also illustrates the fluctuations in the scores for CT and creativity. The following chart shows the variability of the CT scores, ranging from 0 to 77.78. The noticeable peaks and valleys in the scores indicate maximum and minimum scores. Similarly, the variation in the creativity scores ranges from 11.11 to 77.78. The fluctuations in the scores of both CT and creativity are displayed by the line chart.
The comparison of the values showed striking similarities between the scores for CT and creativity. The scores for all the values are very close, indicating similarities in the participants’ CT and creativity levels. Though Group A demonstrates higher scores for both CT and creativity, both groups generally displayed moderate and average levels of CT and creativity in the data.
This study’s findings about the level of creativity are consistent with
Rababah et al.’s (
2013) study, which used the same tool to assess participants’ level of creativity.
Rababah et al. (
2013) follow the following criteria (see
Figure 7) to assess the level of creativity of EFL learners. The current study’s results also align with these criteria. Most of the participants fall under the category of an average or moderate level of creativity.
Figure 7 illustrates that most participants demonstrate an average or moderate level of creativity, aligning with prior research findings
The current research findings about the participants’ CT levels are also aligned with previous studies (
Dong, 2015,
2017) that used the same tool to assess CT, except
Dong (
2015). The studies observed that the L2 learners’ level of CT is average or moderate, but they suggest through their studies that the level could be polished after employing different teaching strategies.
4.3. Gender Differences in the Manifestation of CT and Creativity in Students’ Writing
The fourth question of this study deals with the similarities and differences in the level of CT and creativity based on the gender of the participants. To answer the fourth question of this research, the two groups are further divided into female and male sub-groups (Group AF: n = 61; Group AM: n = 24) (Group BF: n = 39; Group BM: n = 43). The relationship between gender and creativity was explored through a descriptive analysis. The results demonstrate much distinction in the patterns of creativity in males and females. According to
Table 5, in Group A, the mean score of creativity for males was 51.18. The standard deviation value for males was 7.25. The males’ minimum score value was 30.50. The value of the first quartile (Q1) was 47.22. It indicates that 25% of males had a creativity score below this point. The median for the male score was 52.70, which shows the middle value. The third quartile (Q3) value was 55.50. It indicates that 75% of males had a lower creativity score than this value. The maximum creativity score by males in Group A was 63.88. Their mean score was 59.58. Females showed a higher standard deviation value than males, which is 8.96. The female scorers’ minimum value was 41.60. Their first quartile (Q1) was 52.70, which indicates that 25% of females had creativity scores below this level. The females’ median score was 58.30. Their third quartile (Q3) value was 66.60. It shows that 75% of females scored below this point. Their maximum creativity score was 86.10. The comparison of these results of Group A favors the superiority of females over males in the manifestation of creativity.
Moreover, a vertical bar chart in
Figure 8 visually represents the comparison of creativity scores by gender. The left bar shows the mean score of males’ creativity, and the right bar represents the mean score of female participants’ creativity level. The mean score of creativity by the males, which was 51.18, indicates the average level of creativity. The chart shows a wider range of creativity scores by the female participants. The mean score of creativity by females is 59.58. Though both display the average level of creativity through their scores, the values indicate that females exhibit a comparatively higher level of creativity than males.
The descriptive analysis to investigate the association of gender with creativity in Group B also revealed similar results as displayed by Group B, as described in
Table 6. The mean score for creativity by the males of Group B was 44.14. Their value of standard deviation was 14.14. The range of their creativity scores varied from a minimum value of 11.10 to a maximum value of 66.60. It can also be observed that 25% of males scored below 34.00 (Q1), and 75% of males scored below 57.7 (Q3). The median score was 47.20. On the other hand, the females of Group B, like the females of Group A, exhibited higher levels of creativity than males. Their mean score value was 49.25. The females’ creativity scores ranged from a minimum point of 25.00 to a maximum of 77.70. It was also observed that 25% of females scored below 38.80 (Q1), and 75% of females scored below 58.30. The median creativity score by females was 47.20. The results agree with the findings of Group A, that though the level of creativity for both genders is moderate/average, the female participants are more creative than the male participants in their writing.
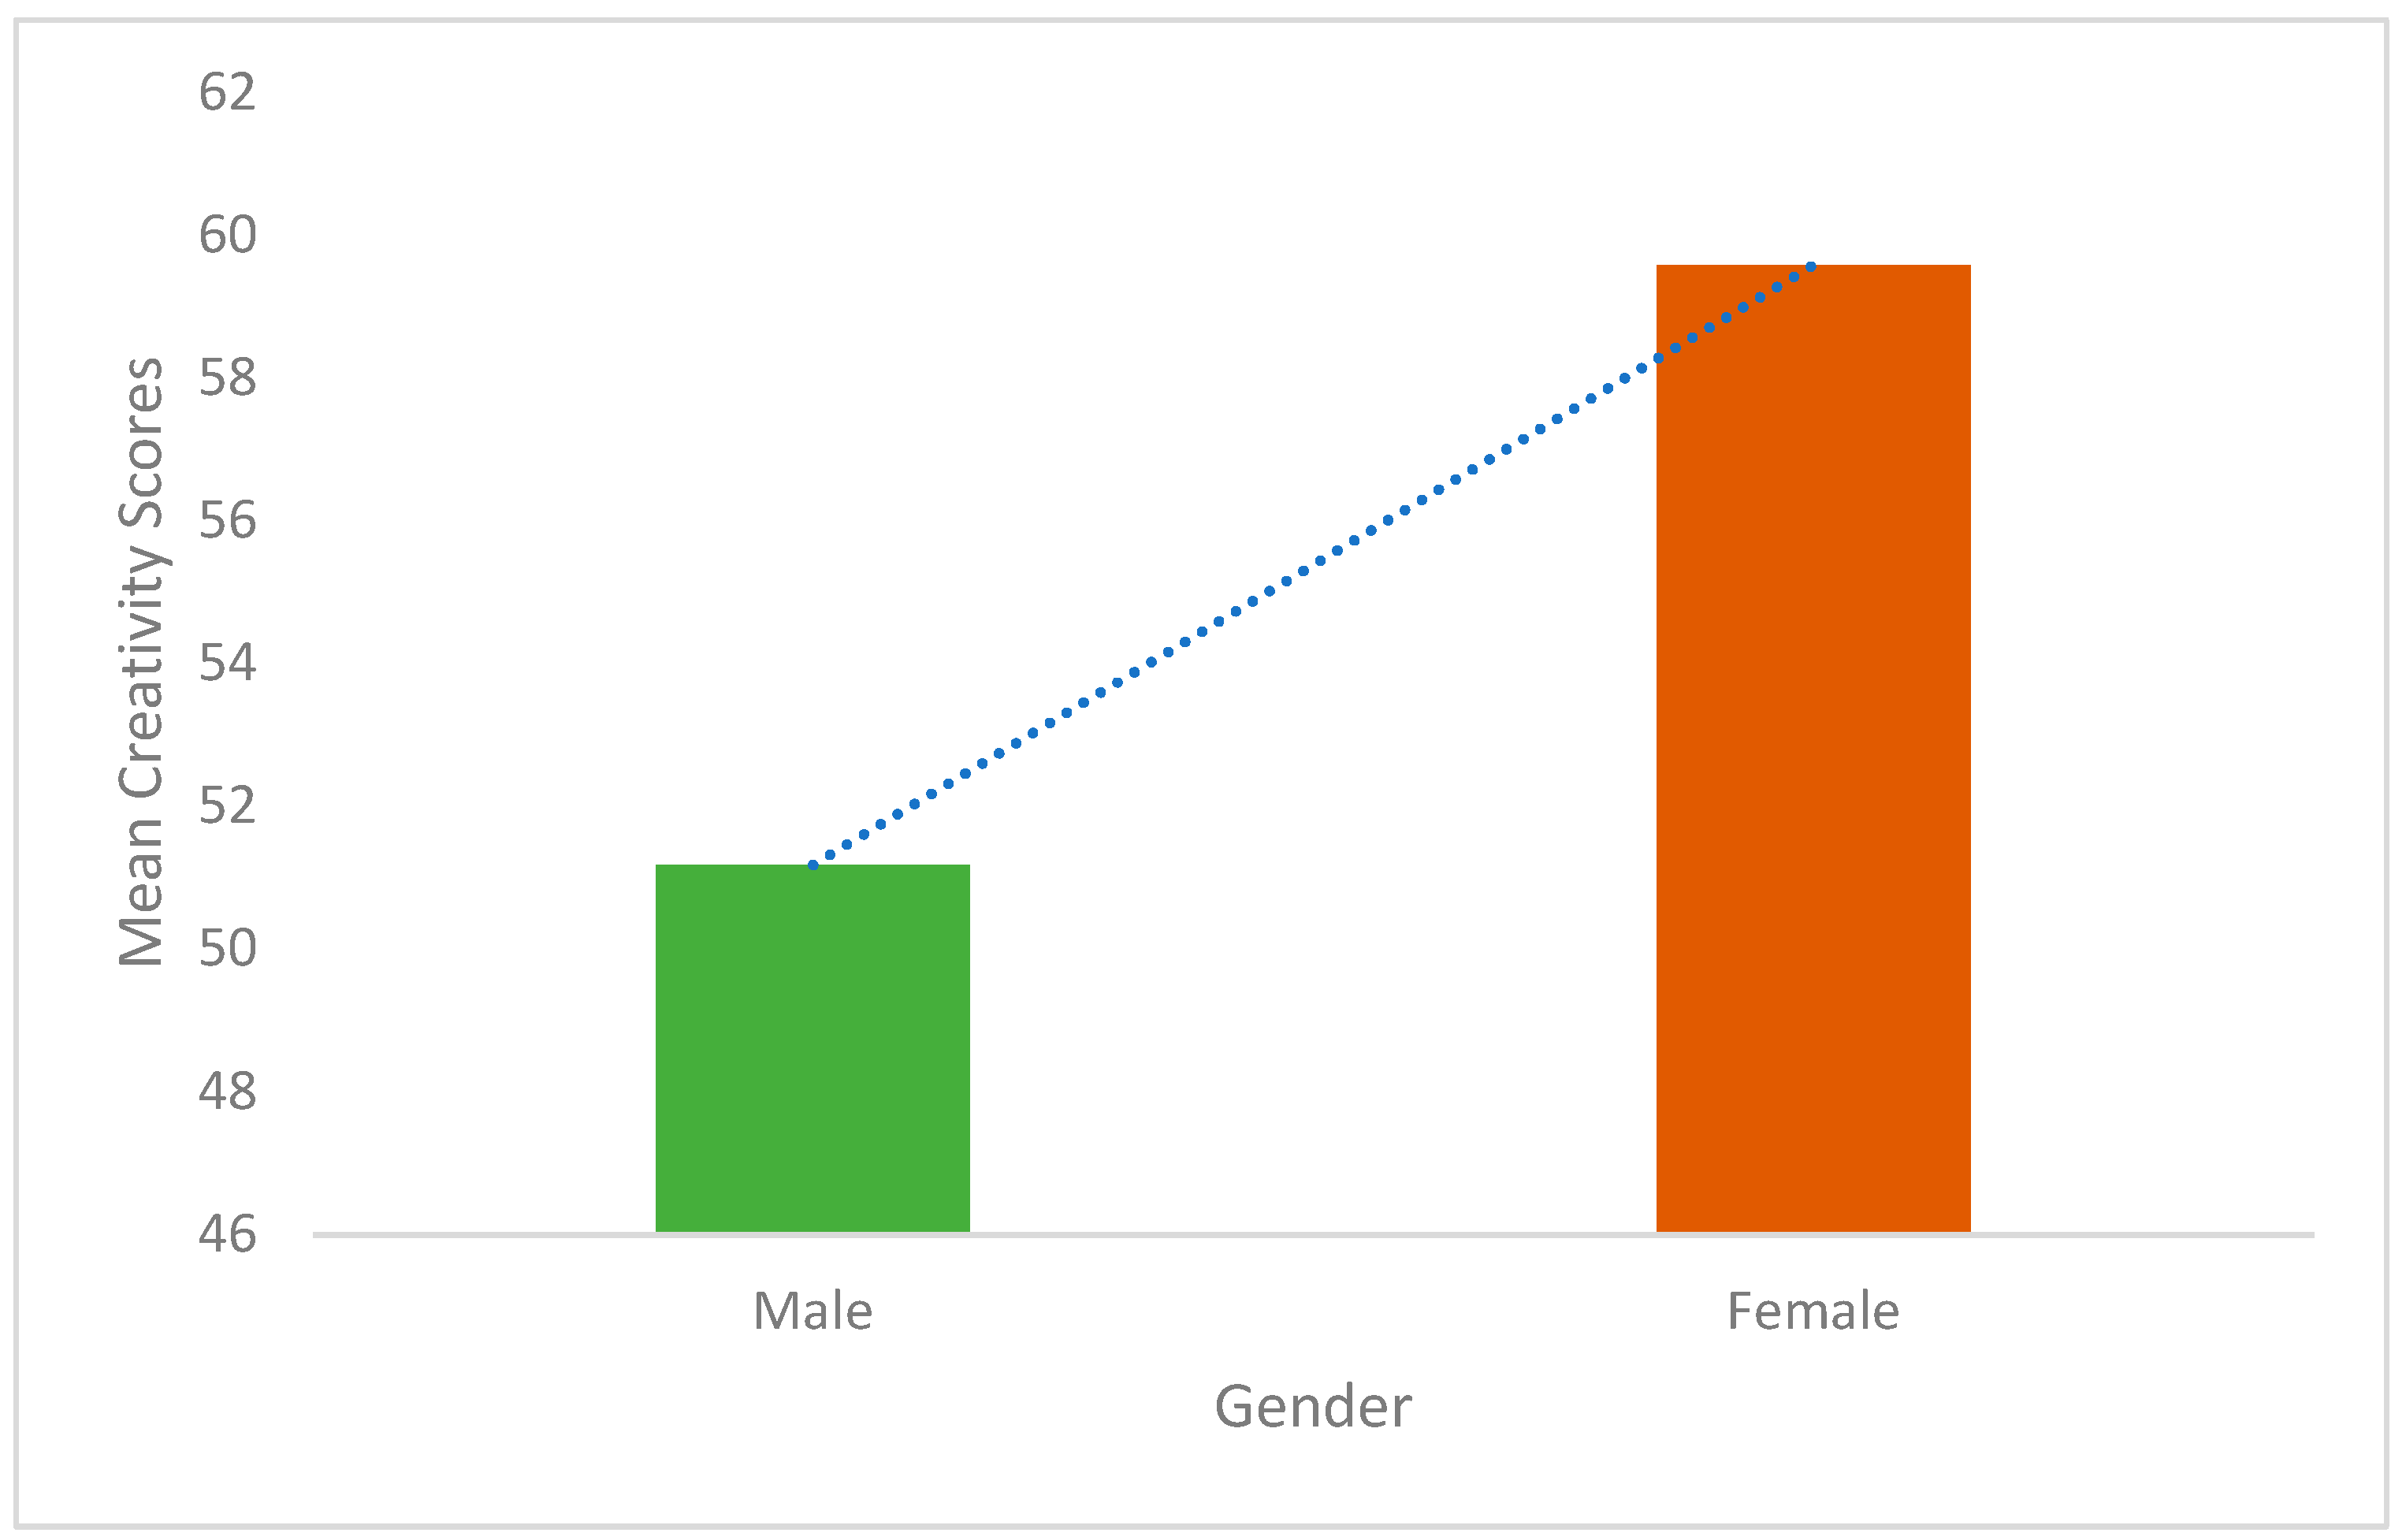
Almost similar results are found in the descriptive analysis of creativity for Group B. A vertical bar chart in
Figure 9 compares the creativity scores by males and females of group B. The left bar shows the mean score of males’ creativity, and the right bar represents the mean score of female participants’ creativity level. The mean score of creativity by the males, which was 44.114, indicates the average level of creativity. The chart shows a wider range of creativity scores by the female participants. The mean score of creativity by females is 49.25. Though both display the average level of creativity through their scores, the values indicate that females exhibit a comparatively higher level of creativity than males. The males and females of Group A comparatively show higher levels of creativity than the males and females of Group B.
To answer the second part of the fourth research question, a descriptive analysis was conducted to explore the relationship between gender and CT skills. The values given in
Table 7 show the results of the analysis of Group A. Males were observed to have a CT score of 48.23. The standard deviation value was 13.14. The range of the CT scores of males was a minimum of 5.55 to a maximum of 62.22. The median score by the males was observed to be 51.11. The first quartile (Q1) scored 44.44, and the third quartile (Q3) scored 57.70. However, the data from females showed a higher mean score for CT, which was 59.11. However, the standard observed was a little lower, which was 10.49. The females’ lowest score in CT was 33.30, which shows a wide difference from the males’ lowest score, which was 5.55. A total of 25% of female participants scored below 55.50, as indicated by the first quartile (Q1), and 75% of female participants achieved the target below 62.20, as shown by the third quartile (Q3). The median score for females was 57.70. The highest CT score by females was 82.20.
In Group A, notable gender differences can be observed by comparing the descriptive analysis of CT scores. The females manifested higher CT scores as compared to those of the males. The evidence is provided by the higher mean and median scores. The standard deviation value for female participants’ CT scores was lower, indicating that female participants were more consistent in their CT performance.
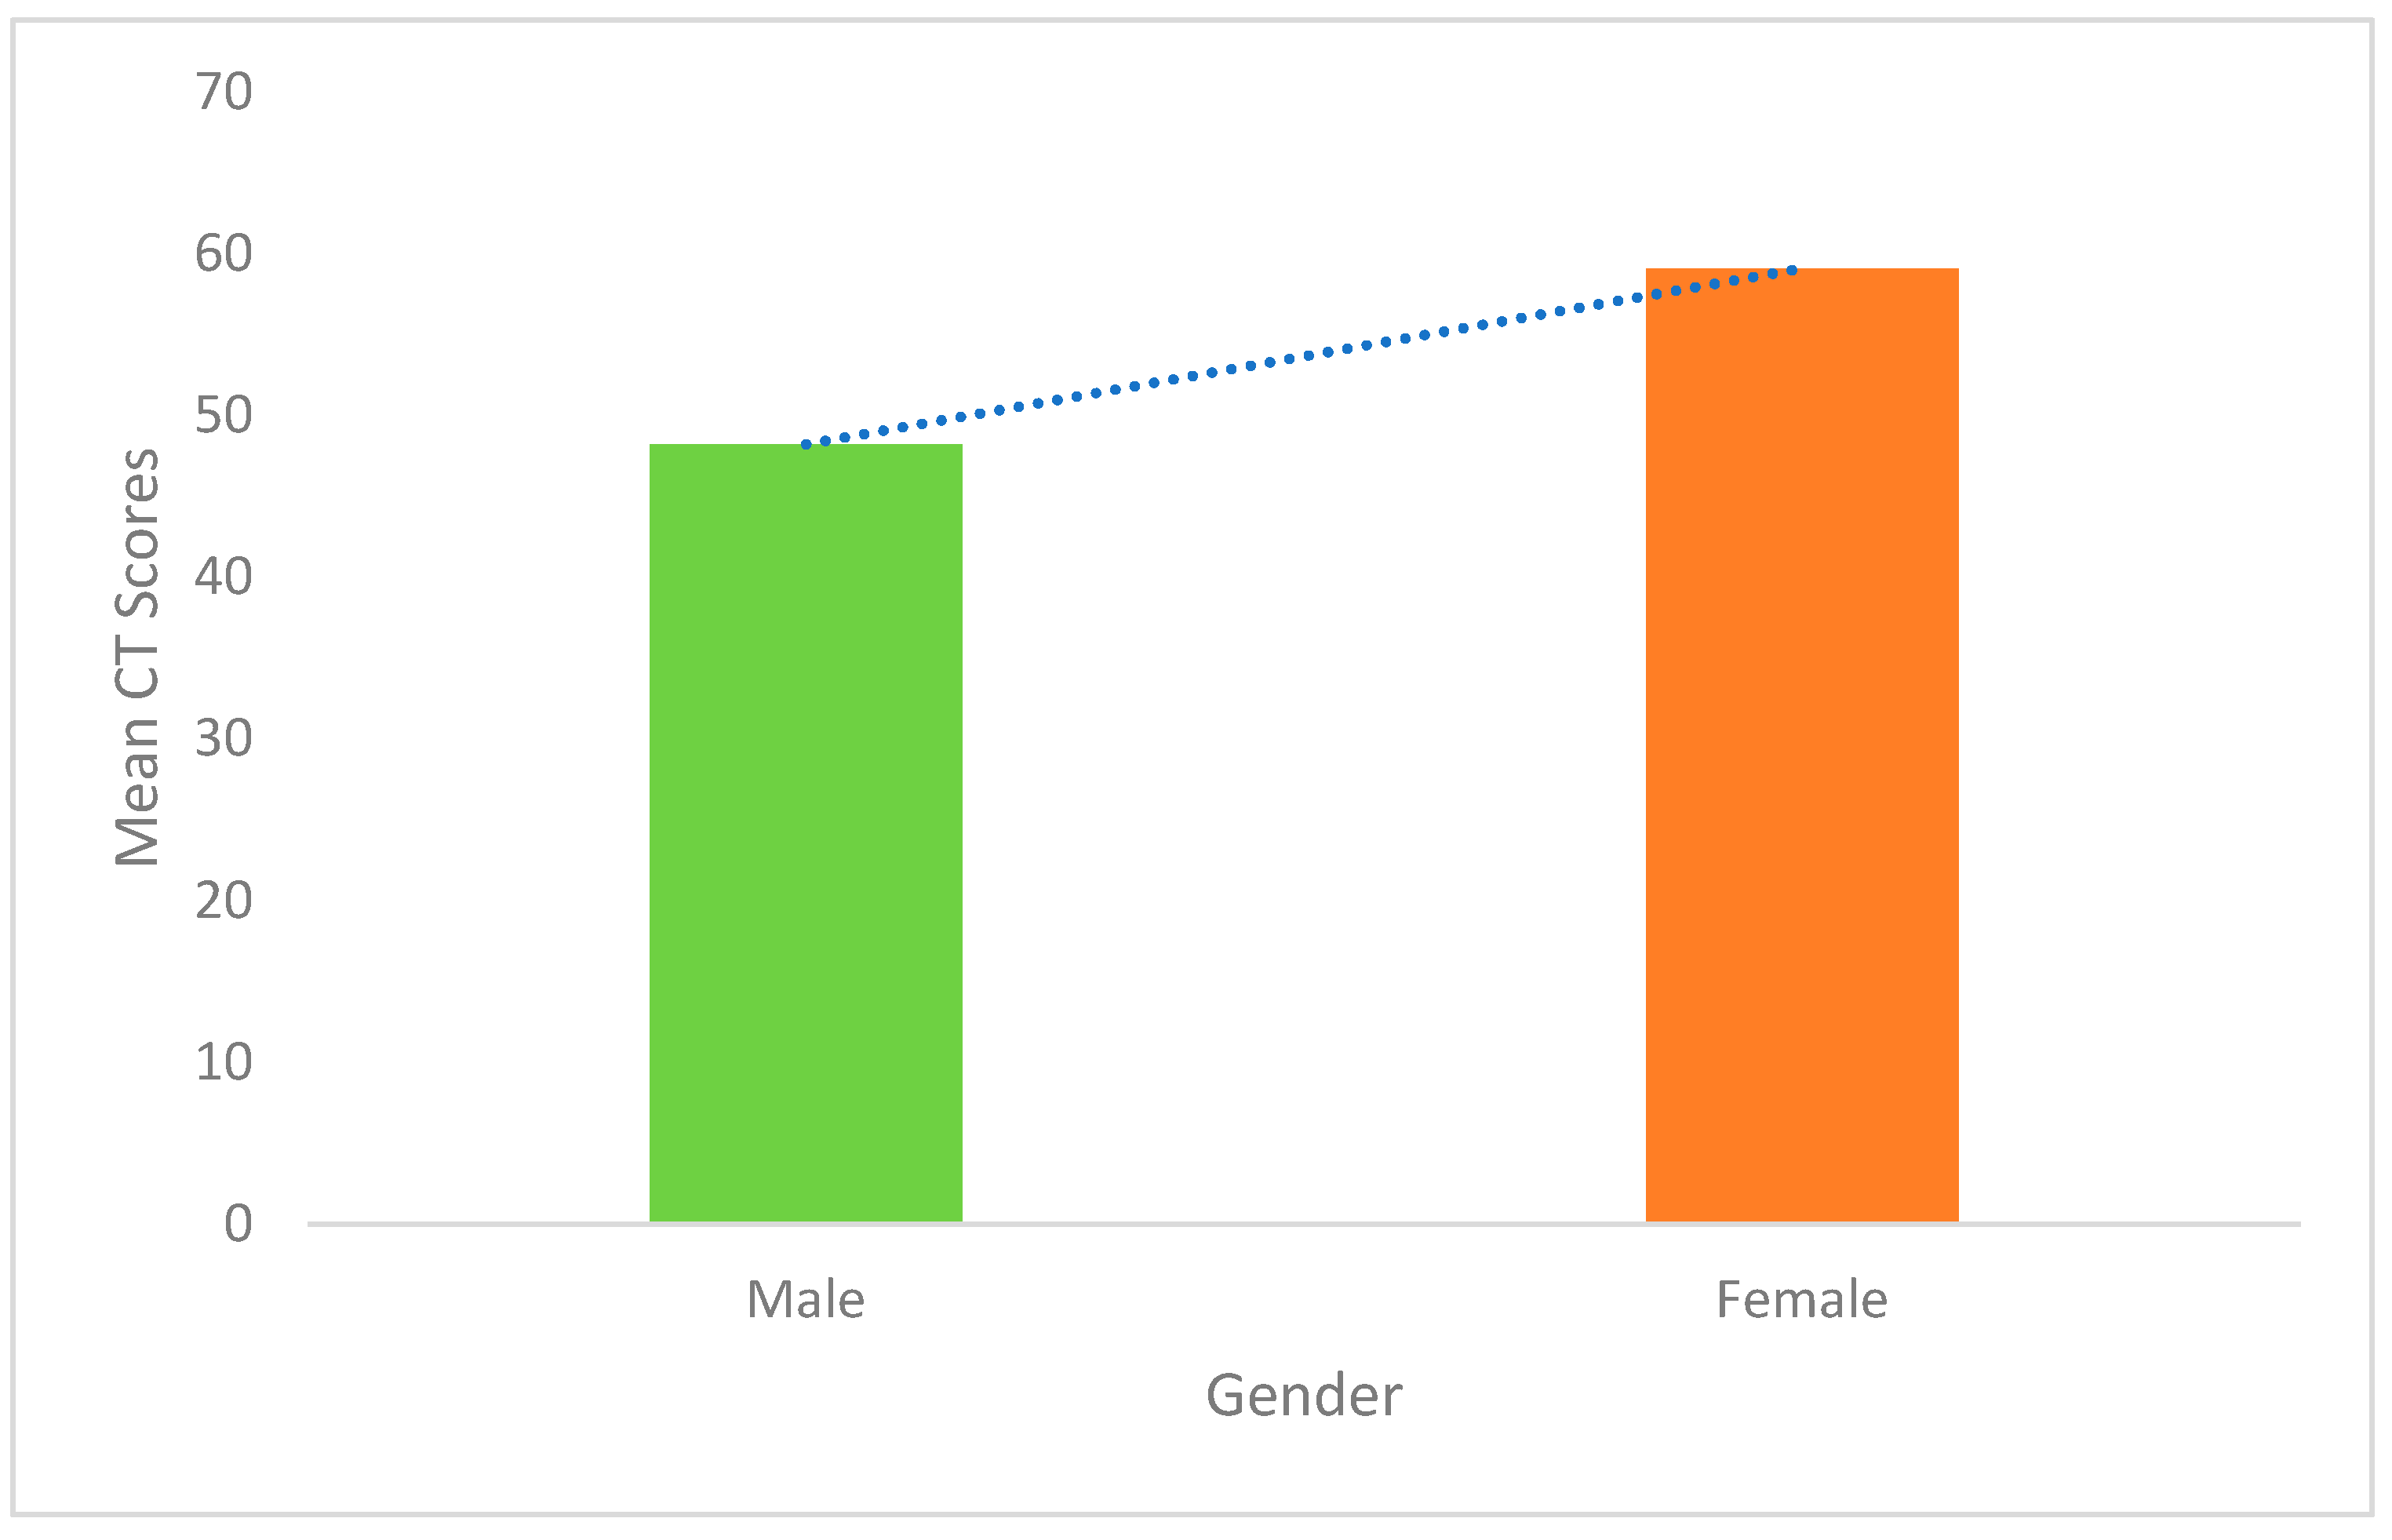
The bar graph in
Figure 10 presents a graphical and visual demonstration of the mean scores of the CT skills by both male and female participants. The
x-axis represents the gender categories, while the
y-axis represents the mean scores of CT skills. The bar graph displays the noticeable difference in the achievement of male and female students. The bar representing the mean CT score for female participants is placed higher than that of males. The left bar representing the male students’ mean CT score shows a lower achievement. The contrast in the higher position of the female graph and the lower position of the male graph shows the difference in the CT performance by different genders.
The descriptive analysis of the scores from the data of Group B showed the values of CT skills of male and female participants that are displayed in
Table 8. The findings show that the mean CT score of the males was 43.25. Its standard deviation value was 15.58, which shows a moderate value of variability by male students in their CT skills. The minimum score observed by males was 0.00, and the maximum score observed was 62.20. A total of 25% of males scored below the value of 40, as indicated by the first quartile (Q1), and 75% of males scored below the value of 53.3, as indicated by the third quartile (Q3). The median CT score for males was 43.3. On the other hand, the mean score for the females was 50.56, with a standard deviation of 10.39. This standard deviation value is comparatively lower than that of males, which indicates that females displayed a narrow range of CT scores. The minimum CT score observed by females was 33.30, which is also much higher than that of males. A total of 25% of female participants scored below the value of 42.20, and 75% of females scored below the value of 57.70. The median CT score by females was 53.3. The maximum score female participants achieved was 77.70. This value showed the highest level of CT achieved by the participants of this group, which was achieved by a female participant. Similarly to the results of Group A.
The findings mentioned in
Table 8 show that there is a significant difference in CT scores based on the gender of the participants. The female participants achieved considerably higher scores than the males, as indicated by their higher mean and median scores. Moreover, the lower standard deviation in the female data shows their consistent performance and narrow spread of scores.
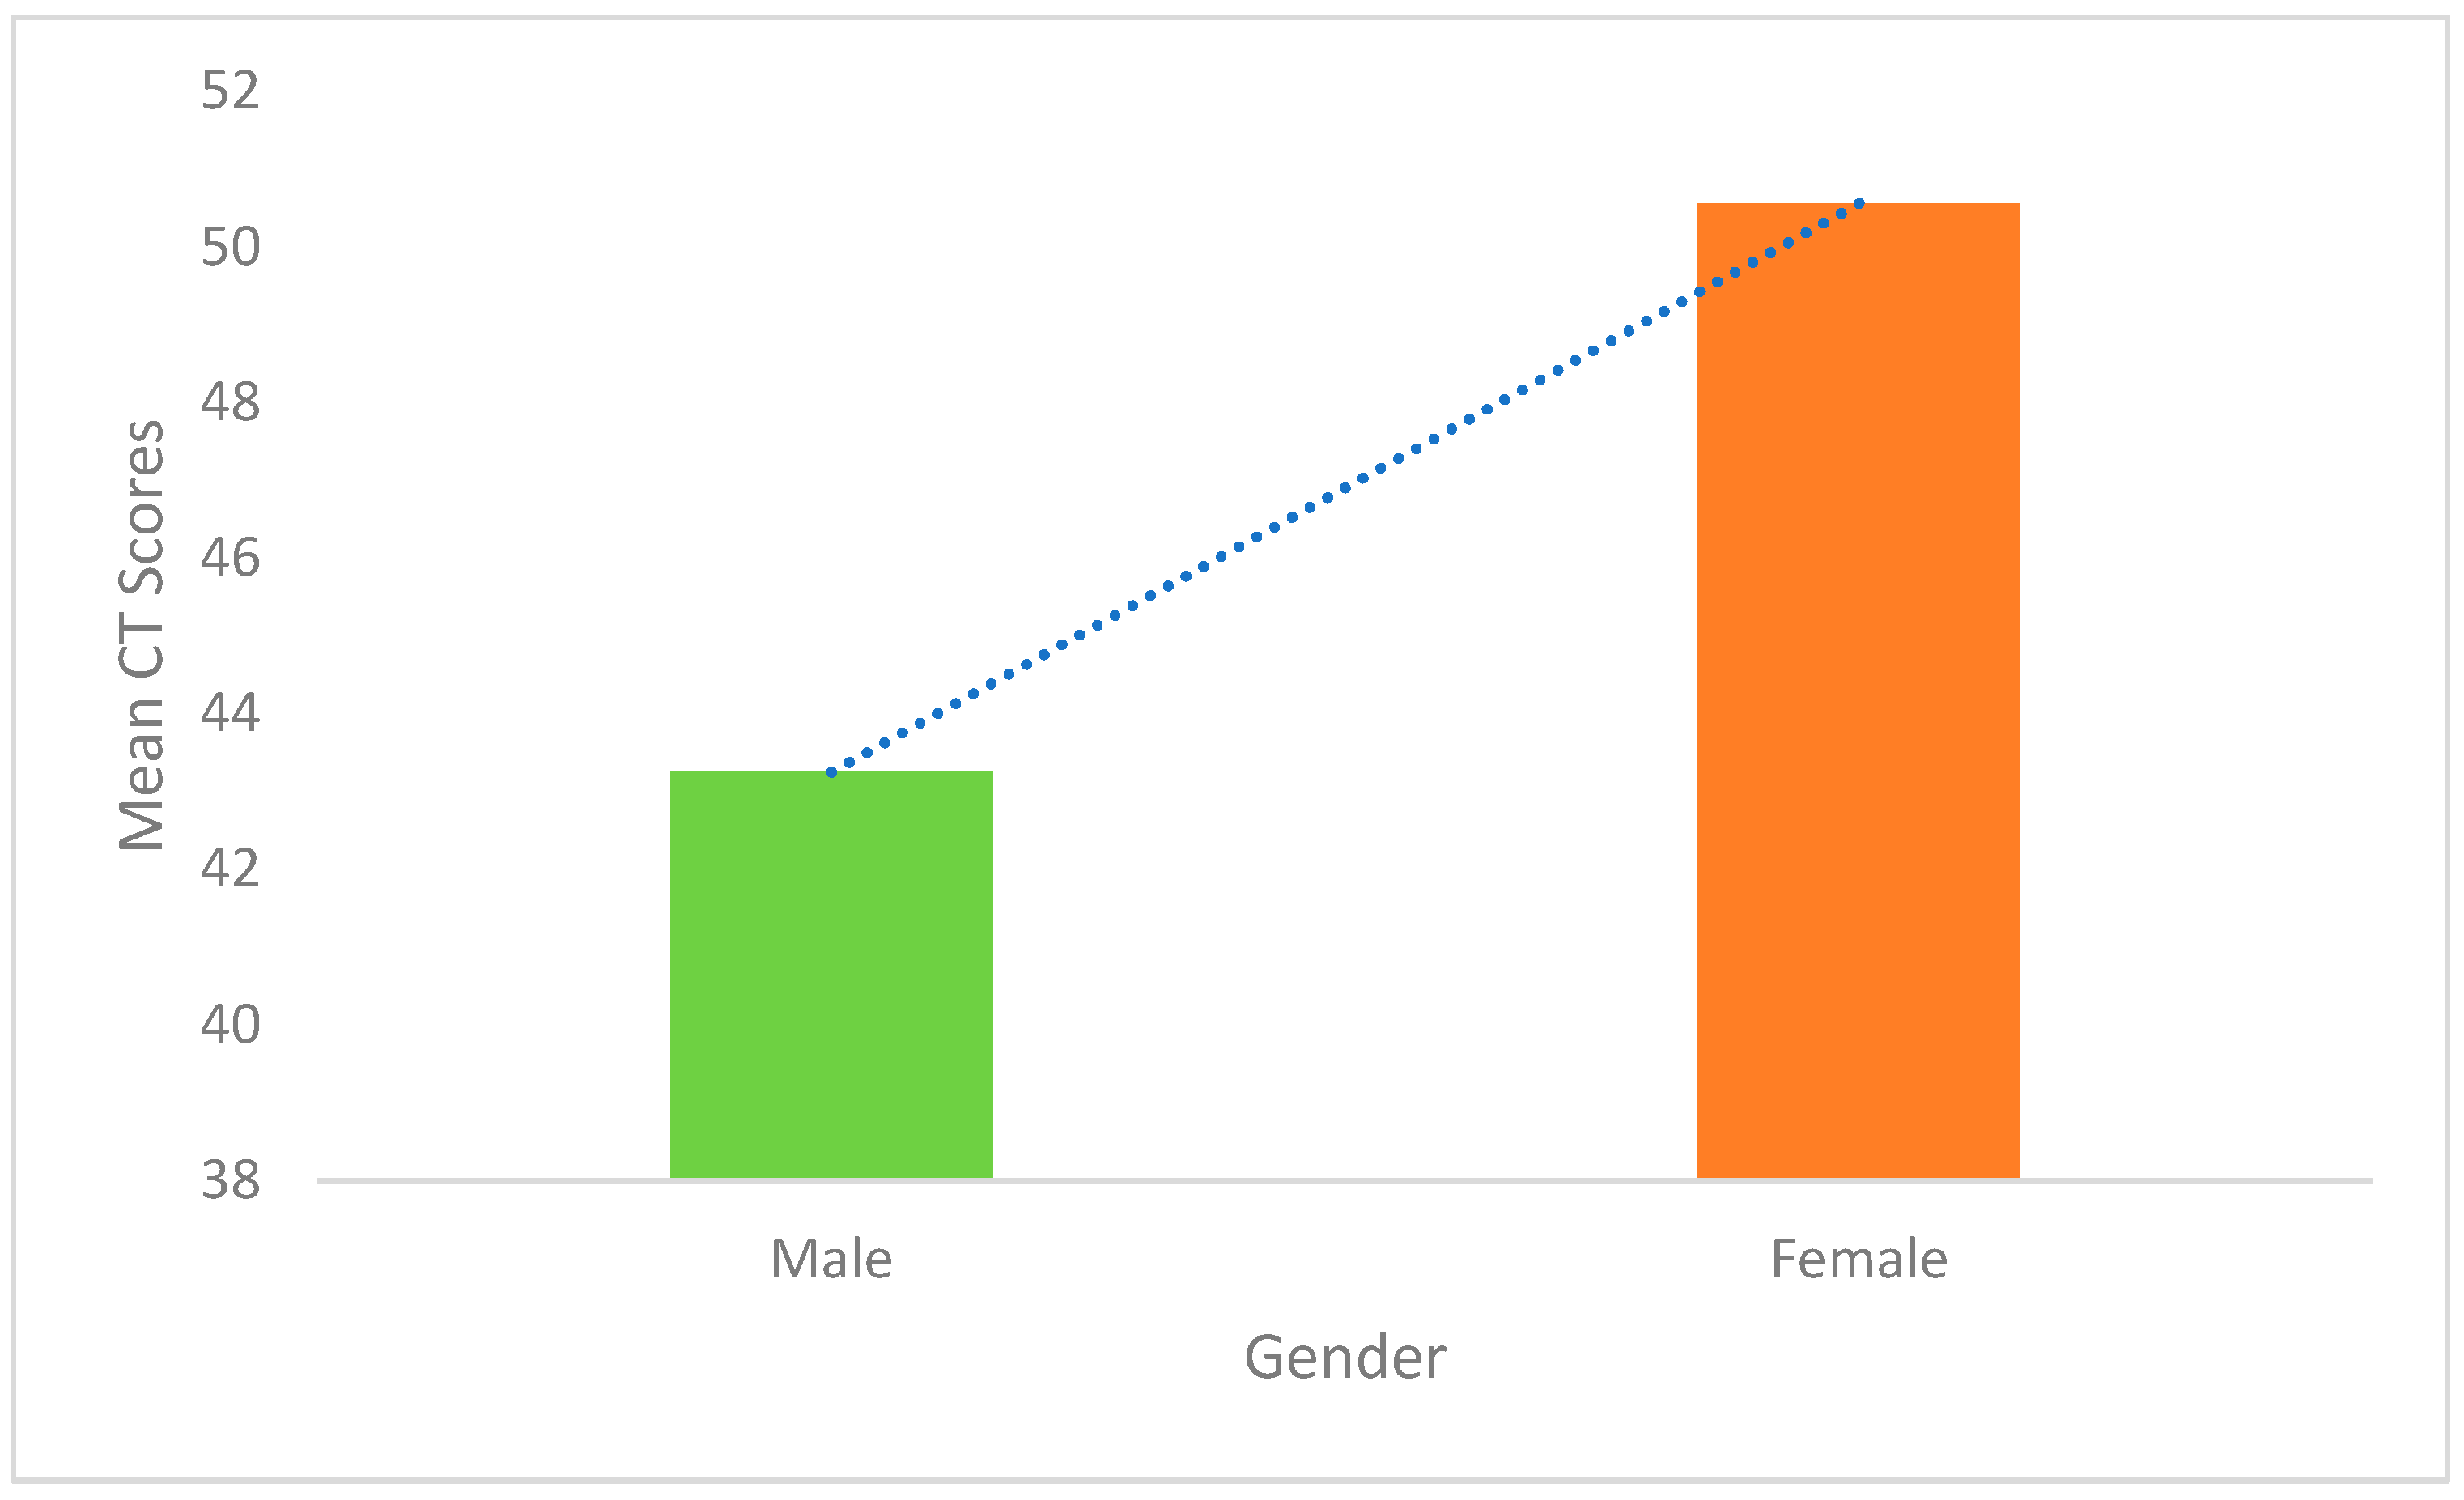
The bar graph in
Figure 11 represents the mean scores of CT for males and females from Group B. The graph makes it clear that the bar indicating the females’ mean score of CT is positioned much higher than that of the bar displaying the mean CT score of the males in Group B, which is positioned lower. The graphical representation also supports the findings of Group A, that, on average, the female participants possess a higher level of CT in their writing. After the comparison of the findings of both groups, it becomes clear that females consistently demonstrated higher mean scores for their CT skills than the males. This consistency indicates that there are considerable gender-based differences in the manifestation of CT skills in both groups.
A striking finding revealed by the graph in
Figure 11 shows that the males in Group B displayed a noticeable difference in their CT scores as compared to the males in Group A. This discrepancy indicates that the males in Group B have lower mean CT skill scores than the males in Group A. It suggests a lower level of CT abilities in the males of Group B. The descriptive statistics of the males’ data revealed a higher value of standard deviation for males in Group B. It suggests a wider range of scores and variability of CT skills among males, with some participants scoring lower than their Group A counterparts. Thus, the comparison between the two groups reveals a nuanced difference in the CT performance of males, while it shows the consistency in the CT performance of the females.
There are several studies that explored the role of gender differences in the manifestation of creativity and CT skills (
Sari et al., 2021;
Ramdani et al., 2021;
Arifah et al., 2021). The findings of the prior research showed mixed results. The findings of the CT superiority of females in the current study align with the studies (e.g.,
Perdana, 2019;
Shubina & Kulakli, 2019;
Saryanto et al., 2021) that claimed females to be superior in CT skills and are partially consistent with the findings of
Ramdani et al. (
2021) that supported females’ superiority over males in some dimension of a single construct. Some other studies favored the superiority of men over women, but many researchers found no significant gender difference in possessing these abilities, like CT.
Azizi et al. (
2022) found no significant difference and suggested that both fluctuate in the possession of these skills for mastering different components.
The findings of the current study align with the findings of some previous researchers (
Arifani & Suryanti, 2019) and are partially consistent with the findings of
Ülger (
2016) and
Betancourt et al. (
2022) that discovered the superiority of females in some aspects of creativity. This study’s results are also consistent with a few findings of prior research that have explored the relationship between gender and creativity (e.g.,
Baer & Kaufman, 2008;
Runco et al., 2010;
Stoltzfus et al., 2011;
Abraham, 2016) and observed mixed results. The current study’s findings do not align with some studies that support the superiority of males over females in possessing creativity (e.g.,
Perdana, 2019;
Shubina & Kulakli, 2019;
He & Wong, 2021). The results of this study are also supported by
Abraham (
2016) and
Nakano et al. (
2021), who presented their review of the literature on gender and creativity. Though they reported mixed results regarding the relationship between gender and creativity,
Nakano et al. (
2021) reported that 45.11% of studies showed no difference in creativity based on gender, 54.88% of studies showed the existence of a difference in gender, among which 45.2% of studies favored the superiority of women over men while 23.28% of studies showed the superiority of men over women.


