Article

Exploring the Influence of Vicarious Experiences in Teaching with Digital Technology on Pre-Service Science Teachers’ Digitalization-Related Affective-Motivational Dispositions

1
Department of Biology Education, University of Education Weingarten, 88250 Weingarten, Germany
2
Department of Psychology, University of Education Weingarten, 88250 Weingarten, Germany
*
Author to whom correspondence should be addressed.
Educ. Sci. 2025, 15(1), 15; https://doi.org/10.3390/educsci15010015
Submission received: 30 September 2024 / Revised: 18 December 2024 / Accepted: 18 December 2024 / Published: 26 December 2024
(This article belongs to the Special Issue Empowering Teacher Professionalization with Digital Competences)

Abstract

:
The integration of digital media in German classrooms remains limited, partly due to teachers’ low motivation, self-efficacy, and negative attitudes toward these tools. This study investigates how vicarious experiences influence pre-service teachers’ digital media self-efficacy and attitudes toward digital media and how these dispositions influence their motivational orientation toward using digital media in teaching. Beyond this, personal experiences were implemented via an ecologically valid intervention, and their influence on the respective constructs was examined. This study employed a longitudinal design involving 43 pre-service science teachers over an internship semester, combining a theoretical workshop at the university with lesson planning, implementation, and reflection. Data were collected pre- and post-intervention and analyzed using Bayesian Path Analysis to examine the relationships between the constructs. T-tests were applied to investigate the impact of structured mastery experiences. The results imply that vicarious experiences influence attitudes but have no significant influence on self-efficacy. Motivational orientation is primarily influenced by attitudes but not by self-efficacy and has a positive effect on the frequency of media use. Self-efficacy, on the other hand, was most strongly influenced by mastery experiences, whereas attitudes received the least support in this regard.

1. Introduction

Teaching science is challenging since science content often requires students to comprehend complex systems involving a high level of abstraction (Goldstone & Sakamoto, 2003). Digital media show new ways of dealing with these challenges and thus have the potential to transform teaching and learning (Becker et al., 2020; Hillmayr et al., 2020). This can be attributed to the inherent characteristics of digital media, which enable a more flexible adaptation to students’ prior knowledge and promote cognitive activation as well as explorative learning (Hillmayr et al., 2020). To achieve this transformation, science teachers must implement digital media in a targeted and meaningful way. However, the implementation of digital media remains limited in German classrooms (Eickelmann et al., 2019). Furthermore, science teachers use digital media primarily for administrative tasks and to augment traditional teaching methods rather than fundamentally enhancing instructional quality (DeCoito & Richardson, 2018; Kramer et al., 2019; Pringle et al., 2015; Szeto & Cheng, 2017). To optimize the use of digital media in class, teachers need digitalization-related professional knowledge. Alongside professional knowledge, affective-motivational factors represent central elements of professional teaching behavior (Baumert & Kunter, 2013; Weinert, 2001). This also applies to implementing digital media in the classroom (Backfisch et al., 2021; Pozas et al., 2022; Vogelsang et al., 2023). Affective-motivational dispositions toward digital media are even considered more critical for the (effective) use of digital media than external factors such as school characteristics or available infrastructure (Drossel et al., 2017; Lee & Lee, 2014). In other words, promoting motivational orientation to use digital media in class—defined as teachers’ general inclination or drive to incorporate digital media into their (future) practices—has become a central challenge in teacher education (McGarr & McDonagh, 2020; Schleicher, 2020; Vogelsang et al., 2019). Studies indicate that (pre-service) teachers’ motivational orientations toward the use of digital media in teaching are influenced by corresponding attitudes and self-efficacy (Kindermann & Pohlmann-Rother, 2022; Kreijns et al., 2013; Vogelsang et al., 2019, 2023). Additionally, teachers’ attitudes and self-efficacy beliefs toward digital media have been shown to significantly impact the frequency of technology use in teaching (Drossel et al., 2017) as well as students’ learning achievements in digitally enhanced teaching situations (Cheng & Weng, 2017; Eldaou, 2016). Consequently, the comparatively low frequency and poor quality of digital media integration in German classrooms may be partially attributed to teachers’ comparatively low affective-motivational dispositions toward using digital media in teaching. In turn, both teachers’ attitudes and self-efficacy toward the use of digital media have been shown to be affected by personal and vicarious experiences (Kreijns et al., 2013). Ultimately, one way to foster pre-service teachers’ motivational orientations toward using digital media is through personal as well as vicarious experiences, such as observations during school placements. To date, there has been little research on the role of vicarious experiences in developing pre-service science teachers’ motivational orientations toward digital media. Moreover, research is rare on how self-efficacy and attitudes interact regarding the development of pre-service teachers’ motivational orientations and to what extent these actually influence pre-service teachers’ behavioral measures. Our study aims to add to the body of research on these aspects (see Research Objectives and Hypotheses). To this end, we will first discuss the constructs of technology-related self-efficacy and attitudes toward digital media in teaching and review the state of research on ways to promote these constructs.

1.1. Technology-Related Self-Efficacy as an Aspect of Teachers’ Profession

According to Bandura’s Social Cognitive Theory of Learning, self-efficacy represents a key factor affecting individuals’ motivation and persistence in challenging tasks (Bandura, 1977, 1997). Self-efficacy is an individual’s belief in their ability to execute actions necessary to produce desired outcomes successfully. Higher self-efficacy leads to more effort and perseverance, while lower self-efficacy results in avoidance behavior and reduced motivation (Caprara et al., 2006; Klassen et al., 2009). Accordingly, pre-service teachers with high self-efficacy toward digital media are more likely to engage with digital tools (Li et al., 2019), try innovative methods (Joo et al., 2018), use technology more effectively for teaching purposes (Hoy et al., 2009), and persist despite external challenges (Heath, 2017; Li et al., 2019). In line with this, teachers’ self-efficacy is furthermore associated with instructional quality (Holzberger et al., 2013; Klassen & Tze, 2014), students’ learning processes, and learning outcomes (Klassen & Tze, 2014). Thus, it can be considered an aspect of teachers’ profession. Self-efficacy is considered highly domain-specific and depends on the context of its application (Straub, 2009), including the individual digital media used (Holden & Rada, 2011).
Consequently, numerous instruments have been developed to measure self-efficacy in using digital media, such as Computer Self-Efficacy (Murphy et al., 1989), Internet Self-Efficacy (Hsu & Chiu, 2004), and digital -media self-efficacy (Pumptow, 2020). However, Zeng et al. (2022) found no significant moderating effect of different instruments on the relationship between self-efficacy in teaching with digital media and constructs like the Technological Pedagogical And Content Knowledge (TPACK), leading to the assumption that they measure very similar latent constructs. Kiili et al. (2016) also demonstrated that teachers’ self-efficacy in using digital media strongly correlates with self-efficacy in integrating digital media in teaching and accordingly emphasizes the relevance of promoting all levels of teachers’ technology-related self-efficacy.

1.2. Positive Attitudes Toward Digital Media as an Aspect of Teachers’ Profession

The Theory of Planned Behavior (Ajzen, 1991) posits that humans’ behavioral intention is jointly influenced by three kinds of factors, which in turn predict actual behavior: (i) attitudes toward the behavior, (ii) subjective norms, and (iii) perceived behavioral control. Attitudes reflect the favorable or unfavorable evaluation of a behavior, indicating how positively or negatively individual judges or appraises that behavior (Ajzen, 1991). In line with the Theory of Planned Behavior, some studies identified positive attitudes as the strongest predictor of teachers’ intentions (Anderson et al., 2011; Teo et al., 2016) or motivational orientation (Vogelsang et al., 2019) to use digital media and the frequency of technology usage in teaching (Anderson et al., 2011). In this context, attitudes—encompassing teachers’ beliefs about the benefits of integrating digital media in teaching for students’ learning and preparation for professional life—occasionally outperformed self-efficacy as a predictor of intentions (Anderson et al., 2011; Vogelsang et al., 2019). The impact of subjective norms has been relatively low on the other side (Kreijns et al., 2013; Vogelsang et al., 2019). Finally, perceived behavioral control, closely related to Bandura’s concept of self-efficacy (Ajzen, 1991), is also proven to impact pre- and in-service teachers’ motivational orientation toward using digital media (Vogelsang et al., 2019) and the effective use of technology in teaching (Pozas et al., 2022).
However, German pre-service teachers often report cautious or negative attitudes toward using digital media for teaching, often due to fears of being overwhelmed, doubts about the competences to be promoted, and concerns about health risks associated with digital media (Braun et al., 2022). These attitudes are unfavorable concerning a change in the use of digital media. Moreover, teacher beliefs are noted for their high stability as individuals actively seek confirmation of their existing belief system and reject contradictory information (Gregoire, 2003). The stability of teachers’ belief system accordingly increases with ongoing professional experiences as beliefs become less accessible to teachers’ awareness the more they integrate into everyday interpretation patterns (Reusser & Pauli, 2014). Conversely, it could be assumed that dispositions such as motivational attitudes and self-efficacy are not as firmly established in pre-service teachers and are more malleable than those of in-service teachers (De La Torre Cruz & Casanova Arias, 2007)—one reason to promote positive attitudes toward using digital media for teaching in pre-service teacher education.
So far, this appears not to be considered in German teacher education. German in-service teachers state that they acquired technology-related teaching skills rather incidentally than through systematic instruction (Eickelmann et al., 2022). Yet, only a small proportion participate in technology-related professional development courses (Gerick et al., 2019), which could be attributed to inadequate training programs (Diepolder et al., 2021). This underscores the need for targeted as well as structured interventions in early teacher education to disseminate knowledge and foster positive attitudes toward digital media in teaching and digital media self-efficacy.

1.3. Fostering Pre-Service Teachers’ Digital Media Self-Efficacy and Positive Attitudes Toward Digital Media

Bandura (1997) identifies four primary sources of self-efficacy: (i) personal mastery experiences, (ii) vicarious mastery experiences, (iii) verbal persuasion, and (iv) physiological or emotional states. Personal mastery experiences involve successful task completion, reinforcing one’s capability beliefs. Vicarious mastery experiences occur through observing others’ successes, influencing self-efficacy based on perceived similarity. Verbal persuasion includes encouragement from others, potentially bolstering confidence when credibility is perceived. Lastly, physiological and emotional states, such as anxiety or stress, affect self-efficacy perceptions.
Consequently, it can be assumed that integrating personal and vicarious mastery experiences with digital media in teaching, for example during internship semesters, may have the power to foster pre-service teachers’ digital media self-efficacy (Pozas et al., 2022; Tondeur et al., 2012). Numerous empirical studies have reported the influence of personal (mastery) hands-on teaching experiences on digital media or technology-related self-efficacy (Al-Awidi & Alghazo, 2012; Anderson et al., 2011; Aumann & Weitzel, 2023; Bautista, 2011; Han et al., 2017; Paetsch et al., 2023; Kiili et al., 2016; Li et al., 2019; Pfitzner-Eden, 2016; Vogelsang et al., 2023). For example, Vogelsang et al. (2023) addressed the development of pre-service science teachers’ attitudes, self-efficacy and motivational orientations toward digital media. In this study, the use of digital media in remote teaching during the second COVID-19 lockdown had a slightly negative effect on the pre-service science teachers’ attitudes toward digital media, while their self-efficacy and motivational orientations toward digital media increased.
Though there is evidence on the importance of vicarious experiences in using digital media in teaching on teachers’ affective-motivational dispositions (Wang et al., 2004), little is known about the relevance of vicarious experiences compared to personal experiences. Nevertheless, especially in the early stages of teacher education, observing role models seems to be of great importance (Pfitzner-Eden, 2016). Moreover, research rarely moves beyond the motivational level to examine the effects of technology-related self-efficacy on actual behavioral measures, such as the use of digital technologies in teaching (Wang et al., 2004).
With a focus on positive attitudes toward the use of digital media in the classroom, previous research has shown that these have to be assumed as more stable dispositions (Valtonen et al., 2021; Vogelsang et al., 2019, 2023). For example, while lesson planning positively impacted technology-related self-efficacy, no significant changes were found in technology-related attitudes (Lee & Lee, 2014). Lee and Lee (2014) suggest that lesson planning alone is insufficient to change the motivational attitudes of pre-service teachers and recommend carrying out activities that comprehensively represent real classroom practice. There is also evidence that experiences need to be sufficiently subject-specific to be transformed into attitudes (Blömeke, 2007). As attitudes toward digital media are seen as a result of reflecting on past experiences (Ajzen, 1991), vicarious experiences through observing role models successfully using digital media in teaching are also considered an influencing factor (Anderson et al., 2011). The results of a study conducted by Meagher et al. (2011) suggest that pre-service teachers who completed their internship in technology-rich school environments developed more positive attitudes toward the use of technology in the classroom than those who completed their internship in schools with minimal use of technology. This is also supported by research, indicating that observed media-related teaching from one’s own school years influence pre-service teachers’ technology-related attitudes (Blömeke, 2007).

1.4. Research Objectives and Hypotheses

The aim of the study is to contribute to the understanding on how motivational beliefs, attitudes, and orientations toward using digital media in teaching can be fostered. So, this study focused on changes in using digital media in teaching and related (motivational) beliefs, attitudes, and orientations of pre-service science teachers (instead of their characterization). In detail, based on the assumptions of the Theory of Planned Behavior (Ajzen, 1991), we assume that the use of digital media increases when pre-service science teachers’ motivational orientation grows, which in turn is based on increased digital media self-efficacy and increased positive attitudes toward digital media. Furthermore, based on the Social Cognitive Theory of Learning (Bandura, 1977), we assume that both digital media self-efficacy and positive attitudes toward digital media are fostered by vicarious experiences (observed behavior) in using digital media. Specifically, the study aims to investigate the following three hypotheses:
H1. 
Pre-service science teachers’ use of digital media in teaching increases when their motivational orientation toward using digital media in teaching grows.
H2a. 
Pre-service science teachers’ motivational orientation in using digital media in teaching grows when their digital media self-efficacy increases.
H2b. 
Pre-service science teachers’ motivational orientation in using digital media in teaching grows when their positive attitudes toward digital media in teaching increase.
H3a. 
Pre-service science teachers’ digital media self-efficacy increases when there are increasing vicarious experiences (observed behavior) in using digital media in teaching.
H3b. 
Pre-service science teachers’ motivational orientation in using digital media in teaching increases when there are increasing vicarious experiences (observed behavior) in using digital media in teaching.

2. Materials and Methods

2.1. Study Design and Sample

The present study involved a longitudinal design to assess changes in the constructs of interest due to a specific intervention and practical experiences during the school internship. In this regard, all pre-service biology teachers at the university were accompanied during their internship semester over 3 consecutive semesters. This involved 61 pre-service science teachers in their master’s studies. Complete pre–post datasets (n = 43) were collected over the course of the study. In summary, the intervention consisted of a preparatory workshop offered at the beginning of the internship semester in the accompanying seminar and the subsequent implementation of a technology-supported lesson in class. The preparatory workshop and the following implementation focused on a specific use of digital media in science teaching (student-generated explainer videos). The intervention’s development (see, Aumann & Weitzel, 2022) included empirical evidence regarding student-generated explainer videos in science teaching and considered the criteria of Tondeur et al. (2012) while building on the Transformation Model of Lesson Planning (Stender et al., 2017). In the preparatory workshop (180 min.), the pre-service science teachers (1) acquired theoretical knowledge on the use of digital media in science teaching via online materials, (2) developed lesson plans and discussed exemplary lesson plans in peer collaboration, and (3) gained experience in creating explainer videos themselves to learn about different video production methods. Following the preparatory workshop, the students moved on to their school internship of 14 weeks. As part of the internship, they (4) planned a lesson in which explainer videos were used to contribute to a deeper understanding of the science content. The lesson was then (5) carried out and (6) reflected on with the support of the first author. Participants were surveyed via pre–post tests using validated scales to measure the constructs of interest (see Instruments, Section 2.2). Pre tests were collected after the workshop at the university, while the post tests were collected approximately one week after the pre-service teachers’ lesson reflection. Using this approach, the intervention was firmly grounded in empirical research and ecologically valid in its implementation in the context of an internship semester in Germany. In addition to attending their own scheduled classes, the pre-service teachers were allowed to observe and learn from experienced teachers in several other lessons. These in-service teachers at the internship schools served as role models, providing the pre-service teachers with the chance to gain vicarious experiences through observation.

2.2. Instruments

Validated survey instruments were used to assess the latent constructs. The majority of the scales were already available and validated in German language. Only the scale measuring vicarious experiences had to be translated into German. All scales showed good internal consistencies (see Table 1). The constructs were standardized using items on a 6-point Likert scale from “1 = I don’t agree at all” to “6 = I completely agree”. An exception to this was the single item scale for surveying the frequency of use of digital media in teaching. All scales are therefore based on the participants’ self-reports. Accordingly, the quality of the role models in this study is not based on a normative measure but on the subjective assessments of the participants themselves.
Table 1 provides an overview of the scales used and their internal consistencies among the samples. In addition, the frequency of use of digital media in the classroom was surveyed. In Appendix A, all items of the different scales are presented.

2.3. Data Analysis

At first, to test for the interventions’ impact regarding the pre-service science teachers’ affective-motivational dispositions, changes in central tendencies of the constructs were assessed using paired t-tests to compare pre- and post-intervention scores.
To test the hypothesized relationships among the variables, Bayesian Path Analysis was conducted using R (version 4.4.1) and the blavaan software package (version 0.5.6). Bayesian methods offer particular advantages for small sample sizes by enabling the inclusion of prior knowledge in the estimations (König & Van De Schoot, 2018). The capabilities of this methodological framework have increasingly led to its application in data analysis within educational research (Kaplan & Harra, 2024). In particular, using weakly informative or informative priors is recommended in the context of small sample sizes (Smid & Rosseel, 2020), as this allows for better model fits (Muthén & Asparouhov, 2012).

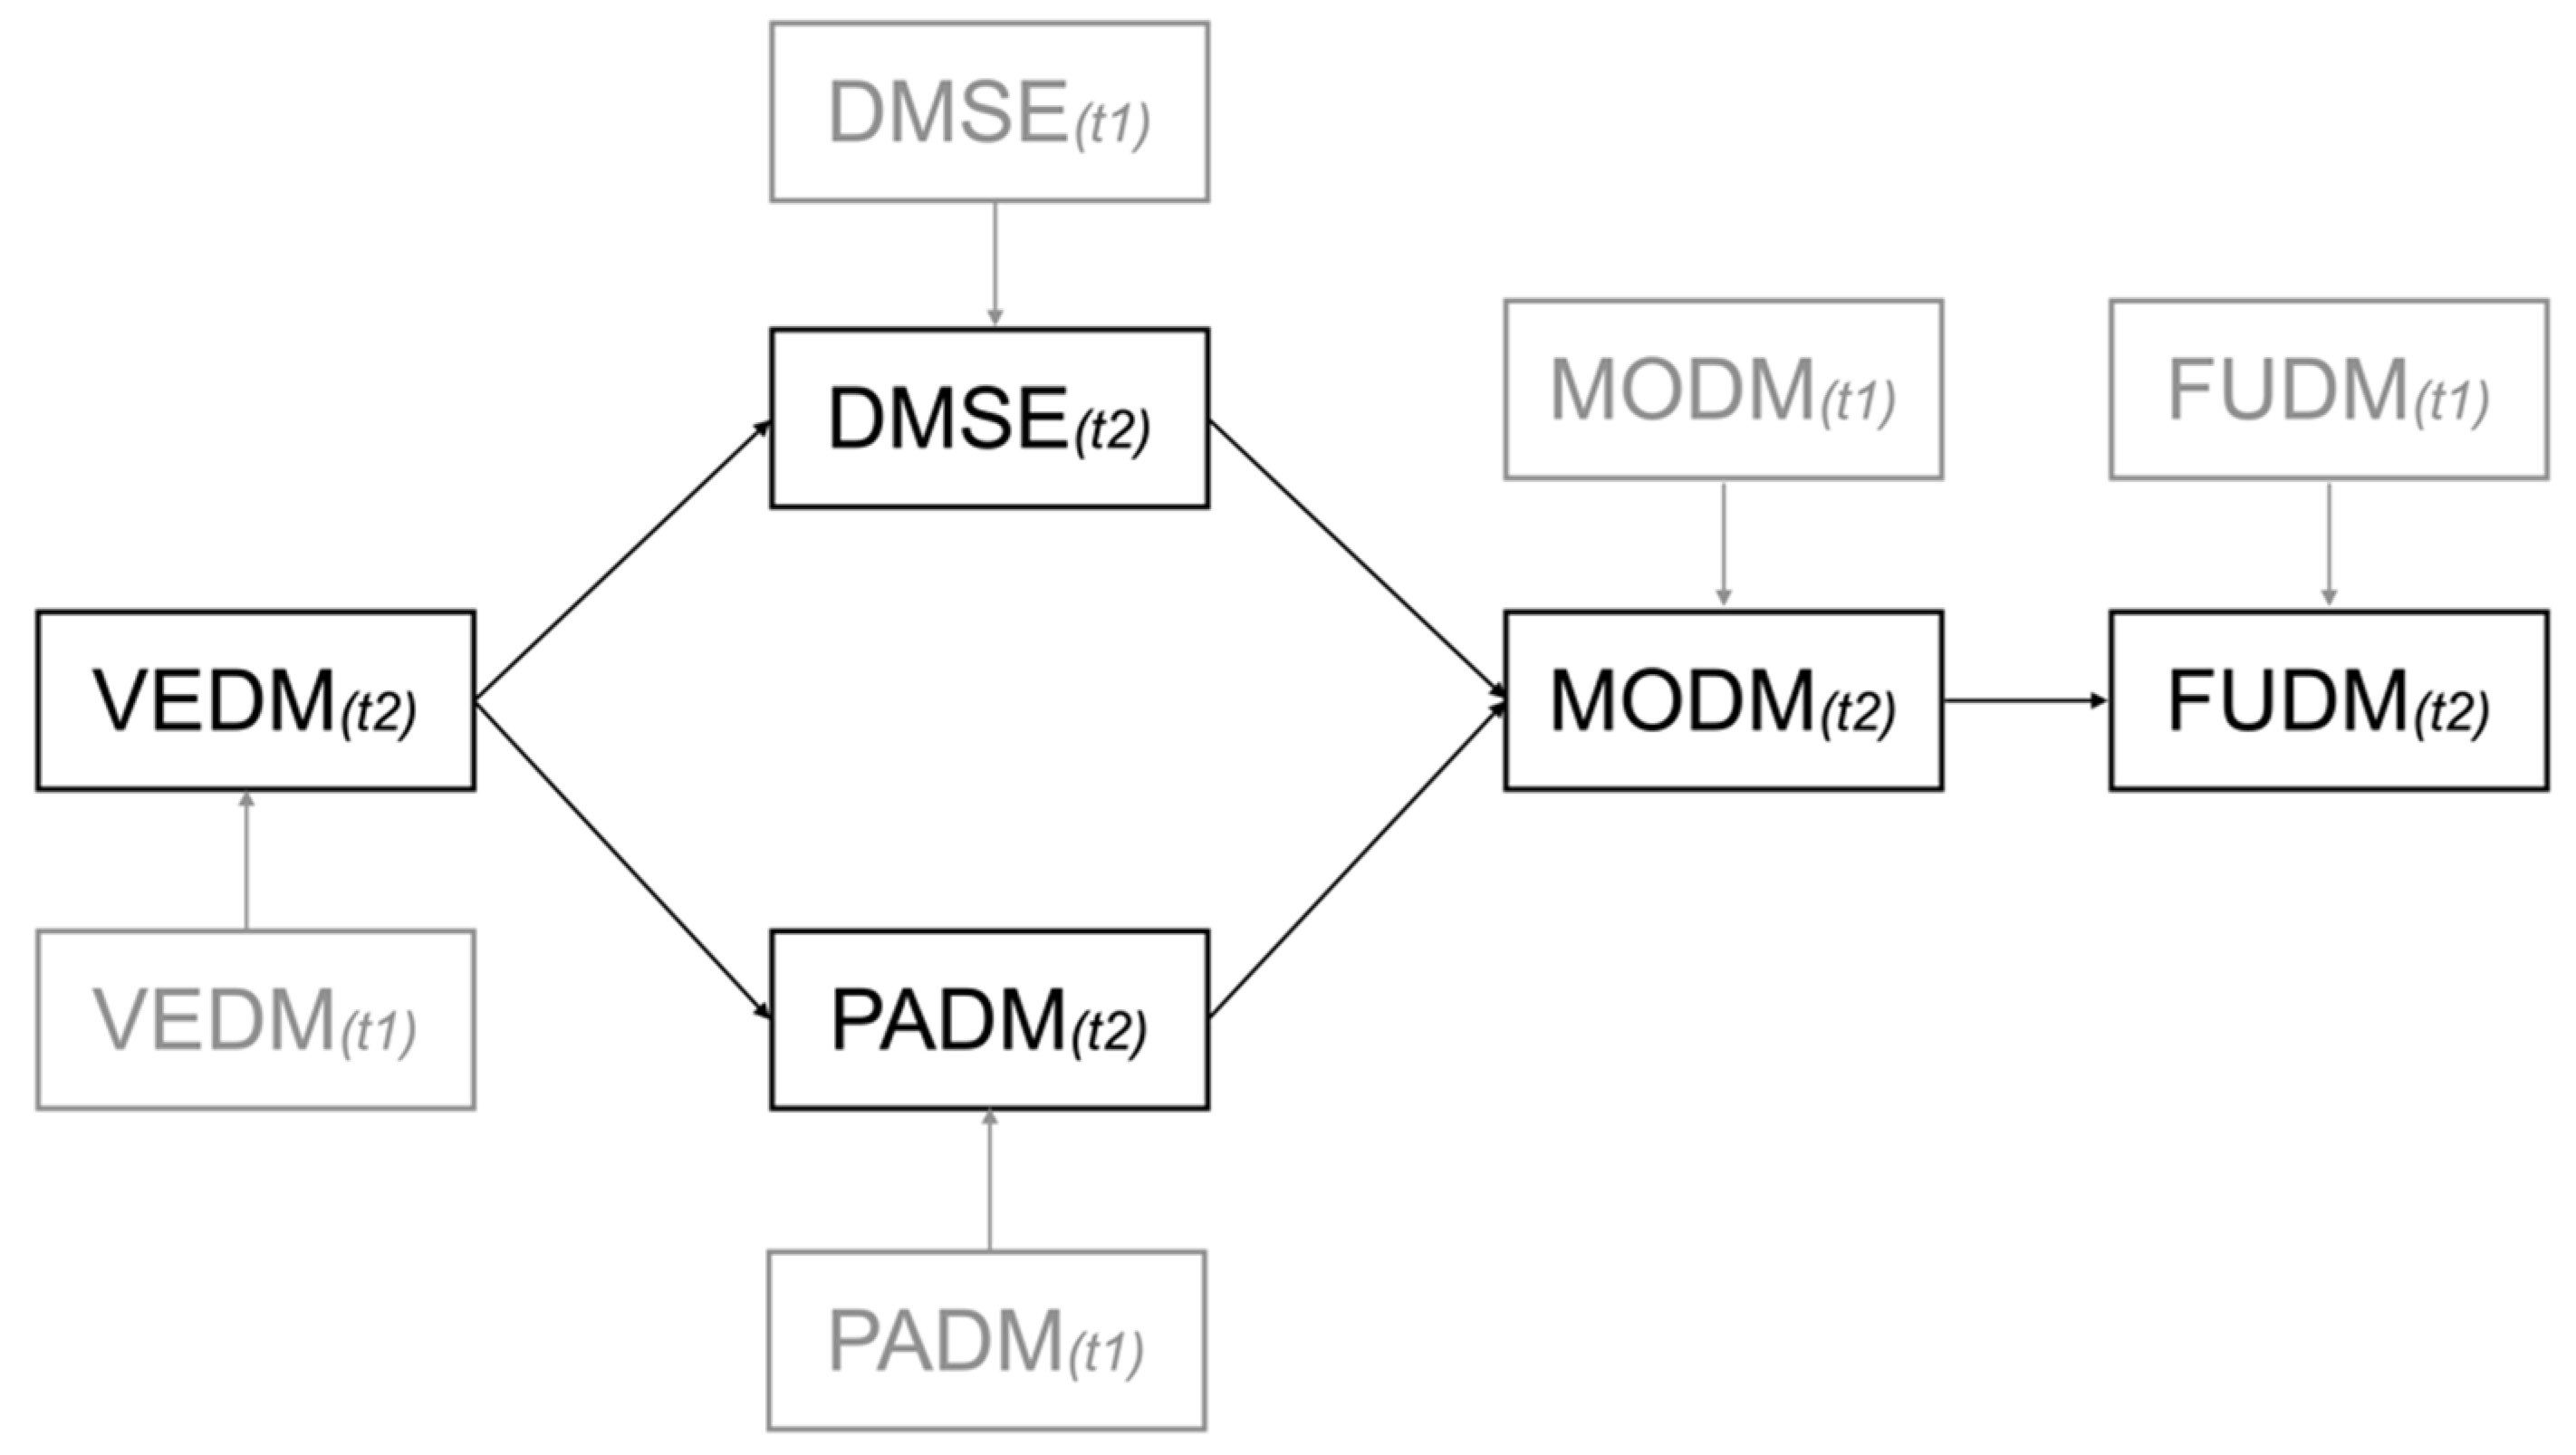
2.3.1. Data Preparation and Model Specification

Initially, based on the underlying theories, relationships between the variables were hypothesized and the data was checked for outliers, normal distribution, and multicollinearity using SPSS (version 29.0.2.0). This was essential to ensure the validity and reliability of the subsequent Bayesian Path Analysis.

Model Specification

The model specification is based on Hypotheses 1 to 3 (see Figure 1). The changes in each variable were considered by controlling its expression on measurement point 2 by its expression on measurement point 1.
The hypothesized model specifications were then estimated using Bayesian Path Analysis. Variances for independent variables (e.g., PADM(t1)) were not included in the model to reduce the number of parameters, keep the model identifiable, and minimize complexity. These variables are treated as independent input factors.

Outliers

Each variable was Z-standardized to identify outliers, and the resulting Z-scores were compared against the established cutoff value of ±3. Data points with Z-scores exceeding this threshold were interpreted as outliers. No outliers were identified in the dataset that exceeded the cutoff value of ±3 for the Z-scores.

Normal Distribution

A Shapiro–Wilk test was employed to assess normality, as it is more reliable for smaller sample sizes due to its higher power in detecting deviations from normality compared to the Kolmogorov–Smirnov test (Razali & Wah, 2011). To further ensure the adequacy of the normality assumption, skewness and kurtosis values were examined for variables where the Shapiro–Wilk test indicated potential non-normality. The cutoff values proposed by West et al. (1995) were applied, where skewness values exceeding 2 and kurtosis values exceeding 7 were considered significant deviations from normality. These additional criteria helped identify any violations that could impact the accuracy and reliability of the statistical analyses.
Although the Shapiro–Wilk test indicated non-normality for DMSE(t2), FUDM(t1), and FUDM(t2) (with significant p-values), neither the skewness nor the kurtosis values exceeded the established cutoff thresholds (highest skewness: 0.710, highest kurtosis: −1.478). As a result, these slight deviations from normality were not considered problematic for the subsequent analyses.

Multicollinearity

Correlation matrices were generated to examine the Pearson correlations between (1) VEDM(t2) & DMSE(t1), (2) VEDM(t2) & PADM(t1), (3) PADM(t2), DMSE(t2) & MODM(t1), and (4) MODM(t2) & FUDM(t1). Established thresholds were applied, with correlations exceeding 0.7 indicating potential multicollinearity.
No multicollinearity was detected in the Pearson correlation matrix, with the highest observed correlation being 0.520. This value is well below the commonly accepted threshold for multicollinearity of 0.7.

2.3.2. Bayesian Path Analysis

Bayesian Path Analysis was performed following the “When to worry and how to avoid the misuse of Bayesian statistics” (WAMBS) checklist by Depaoli and Van De Schoot (2017). Estimations were conducted using the R software with the Stan package (version 2.32.6), which implements the Hamiltonian Monte Carlo (HMC) algorithm within the Markov Chain Monte Carlo (MCMC) framework. Detailed information on the prior specification, convergence, autocorrelation, posterior distribution, sensitivity analysis, and evaluating model fit are presented in Appendix B.

3. Results

3.1. Descriptives and Results of the t-Test

Table 2 provides an overview of the data by displaying the means and standard deviations of the individual constructs at time points t1 and t2.
Table 3 presents the results of the mean comparison between the constructs pre- and post-intervention. Paired t-tests indicate significant increases with high effect sizes across all constructs. The highest effect sizes are observed in pre-service science teachers’ digital media self-efficacy (Cohen’s d = 1.13), while attitudes exhibit the relatively lowest change in mean values (Cohen’s d = 0.816).

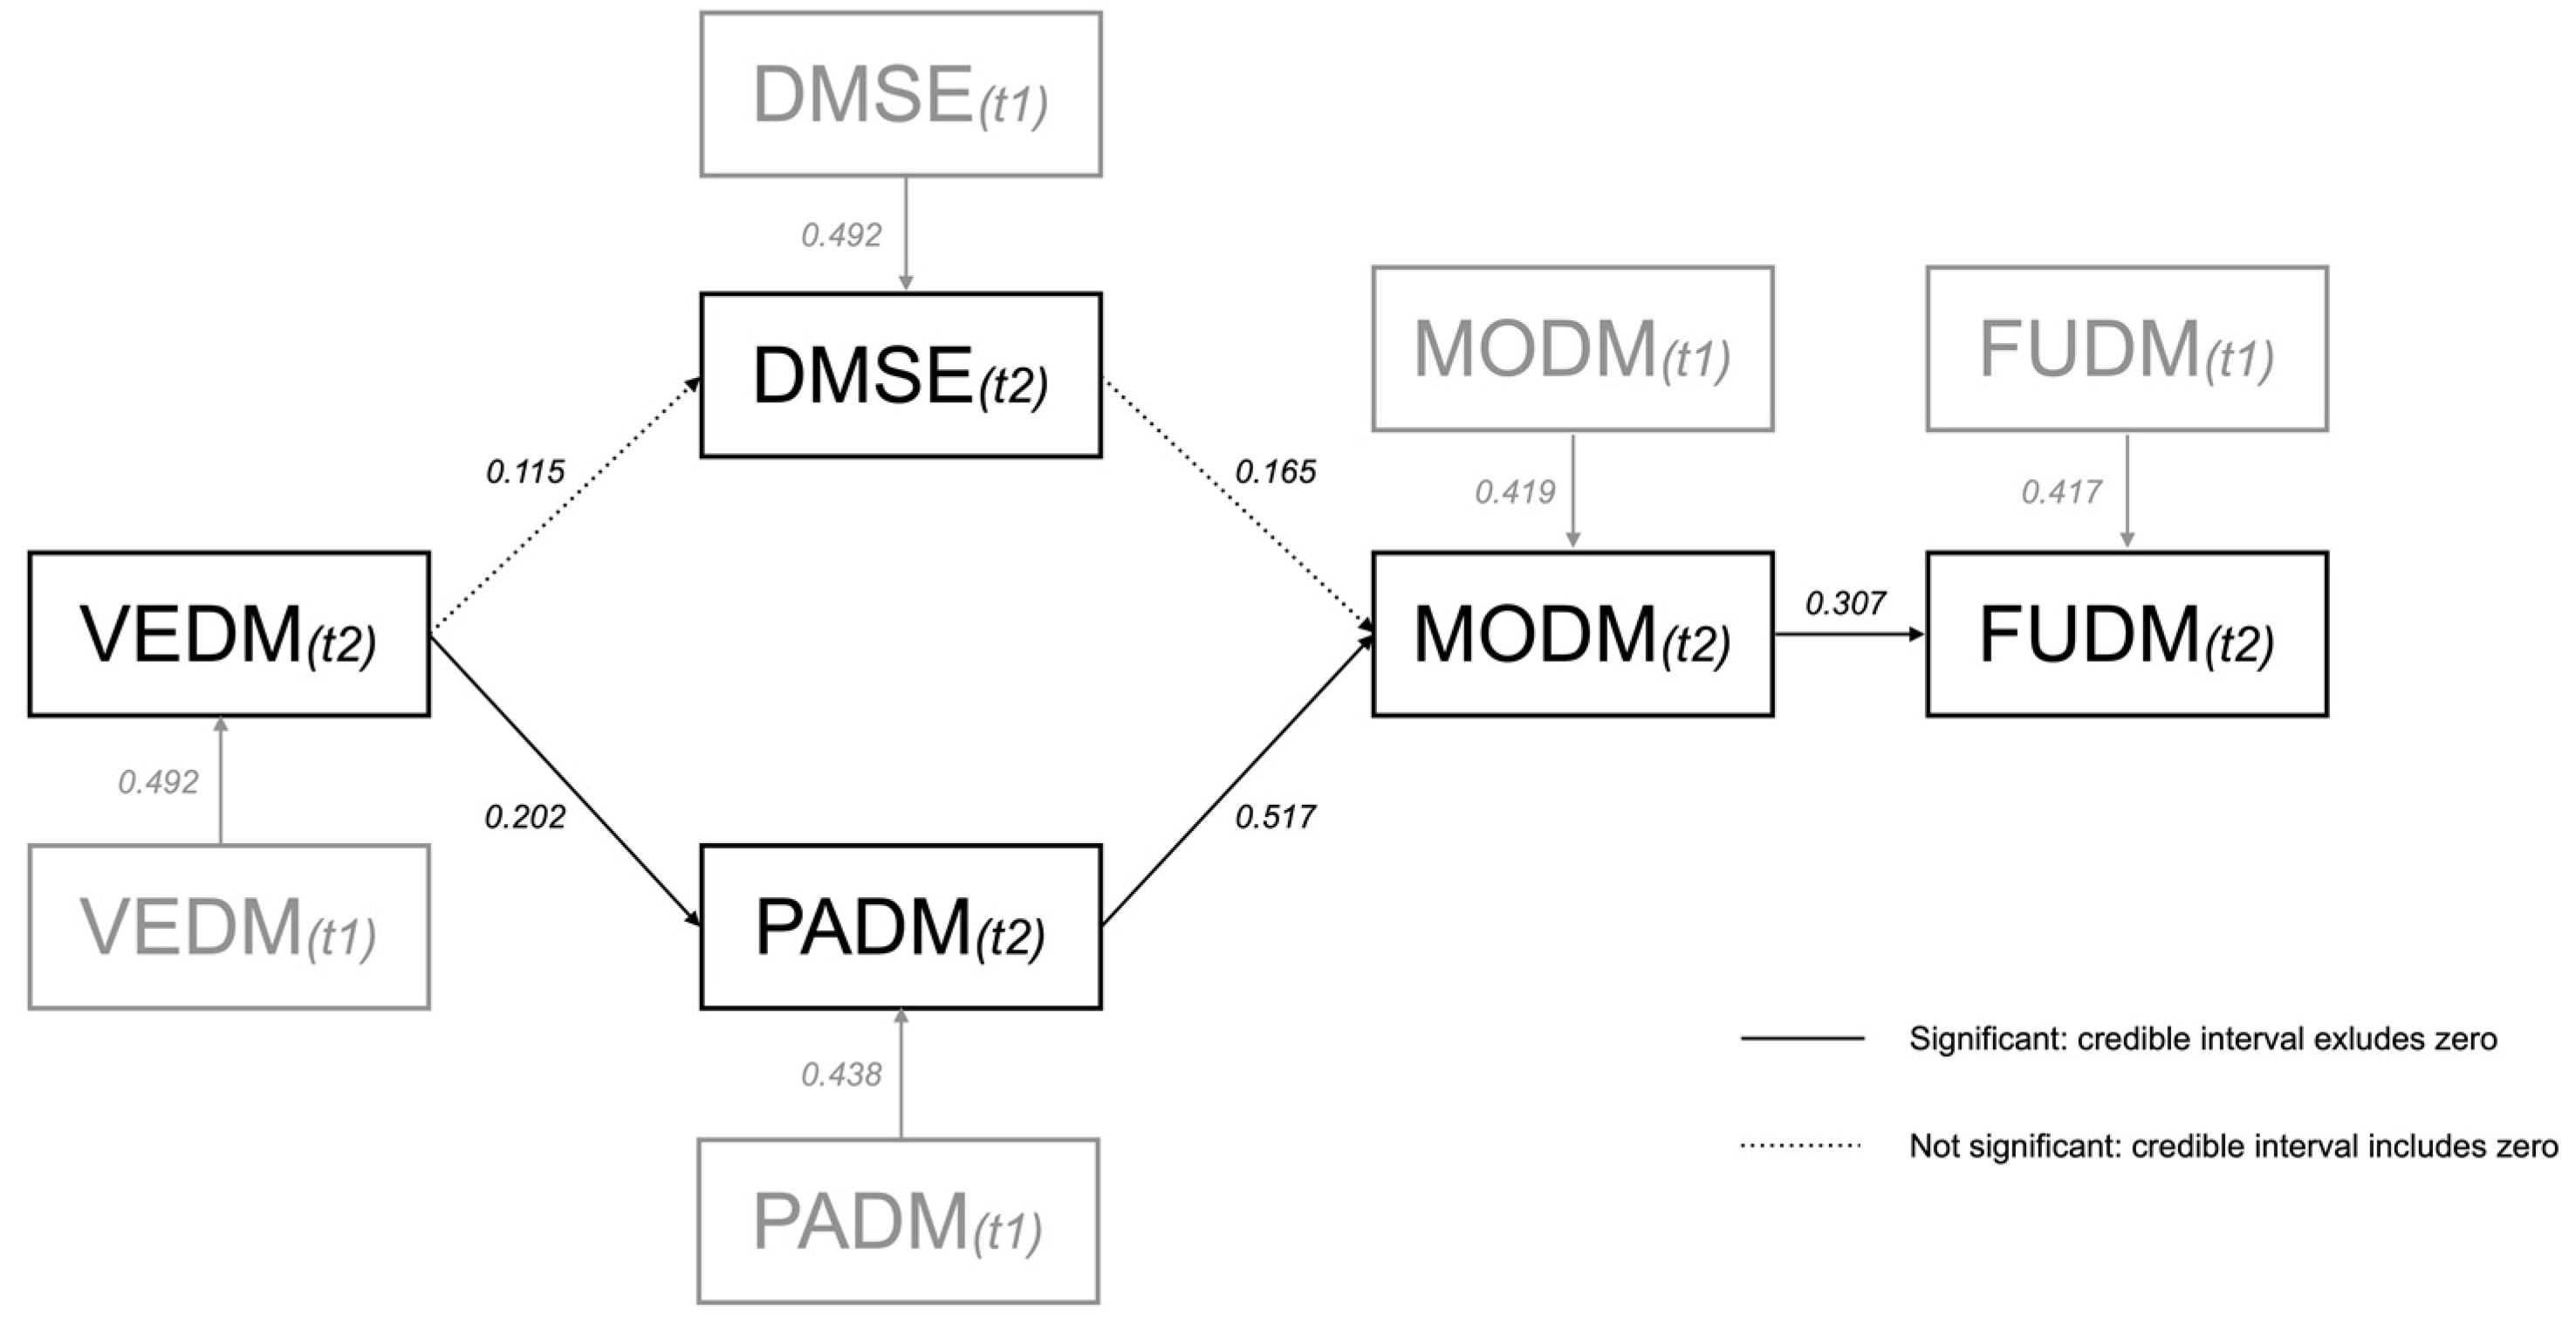
3.2. Results of the Hypotheses

The estimated model demonstrated a strong fit to the data, as indicated by the Posterior Predictive p-Value (ppp) of 0.539. Additionally, the Bayesian Root Mean Square Error of Approximation (BRMSEA) was 0.001, well below the threshold of 0.05, indicating an excellent fit. However, as already noted, this value must be interpreted with caution in consideration of the small sample size. Nevertheless, the fit indices collectively suggest that the model accurately represents the underlying structure of the data. Figure 2 depicts a visual representation of the path model, including the estimated regression paths, to further illustrate the relationships between the variables. Autoregressive paths across all variables show a similar pattern, indicating moderate temporal stability within constructs.
With regard to the hypotheses, the results indicate that pre-service science teachers’ use of digital media in teaching increases when their motivational orientation in using digital media grows (H1). Further, the results gave evidence that pre-service science teachers’ motivational orientation in using digital media in teaching grows when their positive attitudes toward digital media increase (H2b). There was no effect of pre-service science teachers’ increased self-efficacy on their increased motivational orientation in using digital media in teaching (H2a). Finally, increasing vicarious experiences (observed behavior) in using digital media resulted in positive changes in pre-service science teachers’ positive attitudes toward digital media (H3b) but not their digital media self-efficacy (H3a).

4. Discussion

Digital technology and media are rarely used to enhance student learning in science education in Germany. Based on Bandura’s Social Cognitive Theory and the Theory of Planned Behavior, we aimed to understand how vicarious experiences with digital media shape teachers’ affective-motivational dispositions, which are vital for integrating digital technology in class. We employed a longitudinal design to investigate how vicarious experiences influence pre-service science teachers’ attitudes toward digital media and their digital media self-efficacy. Additionally, we investigated the impact of these attitudes and self-efficacy beliefs on the pre-service science teachers’ motivational orientation to use digital media and the frequency of usage in their teaching. According to the theoretical frameworks, hypothetical relationships were specified and examined using Bayesian Path Analysis. We examined these relationships over an internship semester including a targeted intervention. The results indicated that vicarious experiences positively influence pre-service science teachers’ attitudes toward digital media in teaching, which, in turn, enhance their motivational orientation toward implementing digital media. This heightened motivational orientation ultimately results in a more frequent use of digital media in the classroom. On the other hand, the results showed that vicarious experiences did not appear to impact pre-service science teachers’ digital media self-efficacy, which in turn does not significantly influence their motivational orientation toward digital media in teaching.
The findings support the argument that rare use of digital media in teaching can be partially attributed to teachers’ low motivation or negative attitudes toward using these tools (Cheng & Weng, 2017; Drossel et al., 2017; Eldaou, 2016; Lee & Lee, 2014) and highlight—once again—the importance of fostering motivational beliefs, attitudes, and orientations in the use of digital media in teacher education (Baumert & Kunter, 2013; Stender et al., 2017; Weinert, 2001). Additionally, the study design indicates that this can be achieved through a preparatory workshop offered at the beginning of an internship semester in the accompanying seminar and the subsequent realization of a technology-supported lesson in the classroom. In this context, self-efficacy, on which the intervention had the strongest effect, should be emphasized, implying that evidence-based structured interventions in using digital media in teaching can promote successful mastery experiences for fostering pre-service science teachers’ technology-related self-efficacy (Kiili et al., 2016; Paetsch et al., 2023). Moreover, the findings highlight the relevance of role models in using digital media in teaching to foster students’ professional motivational beliefs, attitudes, and orientations. These role models can be university teachers or internship supervisors, for example. Empirical work indicates that university teachers and internship supervisors are not well experienced per se in using digital media in teaching (DeCoito & Richardson, 2018; Kramer et al., 2019; Pringle et al., 2015; Szeto & Cheng, 2017), so complementary teacher training is necessary to support the development of digital media competences.
The missing link between vicarious experiences and students’ self-efficacy beliefs could be explained as follows: Social Cognitive Theory highlights mastery experiences as the most potent source for developing self-efficacy (Bandura, 1977, 1997), which also applies to the digital media-related self-efficacy of pre-service teachers (Bautista, 2011; Pfitzner-Eden, 2016). In the present study, this is evident from the notably strong impact of the intervention on the pre-service science teachers’ digital media self-efficacy (Cohen’s d = 1.13), which exhibited the most remarkable growth among all of the constructs. Accordingly, the missing relationship between vicarious experiences and digital media self-efficacy might be attributed to the particularly strong influence of mastery experiences during the intervention, potentially overshadowing the impact of vicarious experiences. Additionally, according to Social Cognitive Theory, vicarious experiences are most effective when individuals can identify with the role models they observe. For pre-service teachers who have no choice regarding the accompanying teachers at their internship school and with limited practical experience, establishing such identification with the role models may be challenging. While pre-service teachers may develop positive attitudes by observing teaching with digital media, these vicarious experiences might not translate into enhanced self-efficacy. A potential misalignment between the self-perception of pre-service teachers and their role models due to a perceived gap between their abilities and those of the in-service teachers could prevent pre-service science teachers from applying these observed experiences to strengthen their self-efficacy in using digital media. Furthermore, although Bandura’s theory (Bandura, 1977, 1997) highlights the significance of self-efficacy, it can be argued that in the early stages of teacher training and within initial practical encounters, attitudes shaped by vicarious experiences exert a more substantial influence. During early phases, such as the internship semester, fundamental attitudes toward the teaching profession are formed. These initial attitudes may impact motivational orientation more than developing self-efficacy beliefs, as pre-service teachers have few personal success experiences and rely heavily on their mentoring teachers at the respective internship schools. Self-efficacy may gain importance for motivational orientation with increasing successful personal and self-directed experiences.
A key limitation of this study is the small sample size of n = 43, which challenges the generalizability and robustness of the findings. The small sample is due to three reasons: (1) The number of pre-service teachers at our university was limited. The sample already corresponded to a complete survey of the respective cohort. (2) Pre-service teachers from other universities could not be included in the study due to the intensive and individualized intervention, which required close collaboration and accompaniment between the first author and each school. (3) The intervention involved an elaborate lesson planning, implementation, and reflection process, with personalized guidance for each participant over three consecutive semesters.
While Bayesian methods were employed to mitigate the small sample by incorporating prior knowledge, caution in interpreting the results is still necessitated, as there is a risk of overfitting to the study’s specific context. The priors used in the Bayesian analysis notably influenced the posterior estimates (see the results of the sensitivity analysis in Appendix B). This further highlights the need for larger samples in future research to ensure more robust and generalizable outcomes. Additionally, incorporating informative priors resulted in only slightly reduced model complexity, as indicated by the effective number of parameters (see Appendix C). Moreover, the study was conducted under specific contextual conditions: pre-service teachers from a university in southern Germany using a specific technology (student-generated explainer videos) in science teaching. This contextual specificity limits the external validity of the findings and suggests that the results may not be fully applicable to other teaching contexts, subject areas, or geographical regions. As such, this study represents a first approximation to the research question. To ensure the reliability and representativity of the findings, further research is needed with larger sample sizes and in diverse educational settings. Such studies will help to validate the current results and extend their applicability to broader contexts.
Due to the small sample, no control group could be added to carry out an experimental approach. Correspondingly, the findings on the intervention’s influence on the constructs should also be interpreted with caution, as there are numerous different influences on the pre-service teachers during the internship semester.
Based on the findings, several practical recommendations can be made for teacher education programs, although these should always be understood in light of the aforementioned limitations. First, we propose a methodological differentiation in teacher education—taking into account the training level of pre-service teachers—when it comes to fostering affective-motivational dispositions toward the use of digital media in the classroom. Early teacher education should initially incorporate opportunities to observe others successfully using digital media. This could be achieved, for example, through video demonstrations, peer observations, or mentorship programs. This way, the pre-service teachers’ attitudes toward digital media can be fostered, motivating them to use technology in their future teaching. In this respect, subsequent teacher education programs should also aim to create a wide range of opportunities to use digital media in the classroom, which can be implemented through internships. Additionally, providing pre-service teachers with structured opportunities to plan, implement, and reflect on the use of digital media in authentic classroom settings seems crucial to enabling positive experiences. Workshops, internships, and practicum experiences should include targeted interventions focusing on technology integration and combining theoretical inputs with practical experiences. These mastery experiences should contribute to the development of pre-service teachers’ self-efficacy.

Author Contributions

Conceptualization, A.A.; methodology, A.A.; formal analysis, A.A.; investigation, A.A.; resources, A.A.; data curation, A.A.; writing—original draft preparation, A.A.; writing—review and editing, A.A., R.G. and H.W.; visualization, A.A.; supervision, R.G. and H.W.; funding acquisition, R.G. and H.W. All authors have read and agreed to the published version of the manuscript.

Funding

This research was funded by the German Federal Ministry of Education and Research (BMBF), grant number 01JA2036.

Institutional Review Board Statement

Not applicable. The study was conducted in accordance with the Declaration of Helsinki. The conduction of the study aligned with normal educational practices and did not pose any additional risk to the participants.

Informed Consent Statement

Informed consent was obtained from all subjects involved in the study.

Data Availability Statement

The datasets used and/or analyzed during the current study are available from the corresponding author on reasonable request.

Conflicts of Interest

The authors declare no conflicts of interest. The funders had no role in the design of the study; in the collection, analyses, or interpretation of data; in the writing of the manuscript; or in the decision to publish the results.

Appendix A

Items for each of the scales.
ConstructItemsReference
Vicarious experiences using digital media in teaching (VEDM)During my studies or internship…
  • I saw good examples of ICT practice that inspired me to use ICT applications in the classroom myself
  • I saw many examples of ICT use in an educational setting
  • I observed sufficient ICT use in an educational setting in order to integrate applications myself in the future
  • The potential of ICT use in education was demonstrated concretely
Tondeur et al. (2016)
Digital media self-efficacy (DMSE)
  • I am relaxed about difficulties when dealing with digital media, because I can always trust by abilities.
  • If something doesn’t work with the use of digital media, I find ways and means to make it work.
  • I have no difficulty in realising my intentions and goals in connection with a media application.
  • Whatever happens when dealing with digital media, I can handle it.
  • For every problem in connection with digital media I can find a solution.
  • When I am dealing with a new media application, I know to handle it.
  • If a problem arises concerning a media application, I can handle it by my own.
Pumptow (2020)
Positive attitudes toward digital media in teaching (PADM)
  • The use of digital media enables a high degree of self-determined learning.
  • Digital media should generally be given a strong emphasis in school curricula.
  • Pupils can be better motivated to learn through the use of digital media.
  • Computers and digital media open up scope for creativity in learning.
  • The use of digital media at school ensures that children are well prepared for working life.
  • Learning with digital media is an efficient form of learning.
  • With digital media, I can plan and adapt lessons to suit the target group.
  • Digital media allow greater student activation.
Vogelsang et al. (2019)
Motivational orientation toward digital media in teaching (MODM)
  • I am very interested in thinking about how I can better support my students’ learning with the help of digital media.
  • I enjoy thinking about how I can use digital media in the classroom.
  • I also find out in my free time what possibilities there are for integrating digital media in lessons.
  • I like to familiarise myself with the operation of digital media (e.g., programmes) for lessons.
  • I am prepared to invest a little more time in lesson preparation if I can use digital media in my lessons.
  • Selecting or creating digital media for lessons is one of the most interesting parts of lesson preparation.
  • Digital media allow greater student activation.
Vogelsang et al. (2019)

Appendix B

Information on the prior specification, convergence, autocorrelation, posterior distribution, sensitivity analysis, and evaluating model fit:
(i)
Prior Specification
The path model estimated regression and variance parameters using informative priors. Prior specification can have a strong impact on parameter estimation, especially in small sample studies. Therefore, it is essential to define and interpret priors with caution and to report them transparently.
Two techniques were used to define the hyperparameters of the informative priors. First, we drew on an empirical study by Vogelsang et al. (2023) conducted under comparable contextual conditions. Second, expert estimates were incorporated. Specific regression coefficients were drawn from the results of Vogelsang et al. (2023), providing a robust basis for prior predictions due to the similarity of the study. The referenced research examined a mediation analysis that included self-efficacy, attitudes, and motivational orientation toward teaching with digital media among pre-service science teachers during their internship semester. In addition, the same scales for attitudes (PADM) and motivational orientations (MODM) were used in Vogelsang et al. (2023). These regression coefficients, adopted from the source, were rounded to one decimal place as priors to provide initial information and ensure robust estimates.
The default standard deviation of the priors was set to 0.1 in order to keep the priors fairly informative. Nevertheless, the following uncertainties were considered in estimating the prior standard deviations. First, the regression coefficients in Vogelsang et al. (2023) were based on a 7-point Likert scale, while this study used a 6-point Likert scale. Therefore, a standard deviation of 0.2 was defined for all prior regression parameters to reflect this difference in scale.
Second, Vogelsang et al. (2023) differentiated three facets of self-efficacy for technology use in the classroom that were regressed on attitudes and motivational orientation in three separate path analyses. None of these facets directly corresponded to the digital media self-efficacy (DMSE) construct used in this study. Therefore, the MKSE 2 facet that most closely aligned with DMSE was selected for prior specification. This scale describes the concrete use of digital media in instructional contexts. The standard deviation was increased to 0.3 for the corresponding parameters to account for the resulting uncertainty in the self-efficacy priors.
For other parameters where no directly comparable examples were found in the literature, moderate regression effects of 0.3 and slightly stronger autoregressive effects of 0.4 were defined as priors based on expert estimates. Experts were full professors focusing on teacher education and specialized in digitalization-related competences of pre-service teachers in the fields of psychology (n = 1), science education (n = 1), and informatics education (n = 1). In the form of a focus group, the three experts were asked to define priors for the respective regression parameters. They were also given insights into the priors defined based on the literature. To quantify the increased uncertainty for these parameters, the respective parameter spaces were expanded by setting their standard deviation to 0.3. The regression coefficients according to Vogelsang et al. (2023) and the hyperparameters used as informative priors can be found in Appendix D.
For variance distributions, a weakly informative Gamma distribution G(1,1) was chosen in regard to the informative priors. All priors were visualized through plots to verify their distributions and assess their plausibility. No multivariate priors, such as those for covariances, were specified in the current model. Given the relatively small sample size, this decision was made to avoid increasing model complexity. Instead, the priors in this path analysis were focused on directed regression paths and variances.
(ii)
Test for Convergence
Due to the moderate complexity of the model, model specifications were initially estimated using four MCMC chains with 10,000 burn-in iterations and an additional 10,000 sampling iterations, following the recommendations of Depaoli and Van De Schoot (2017). Subsequently, the MCMC chains were visually inspected for chain convergence via trace plots. To rule out local convergence, a potential shift in distributions after the initial 10,000 iterations, the model specification was rerun with double the burn-in and sampling iterations (20,000 each; Depaoli & Van De Schoot, 2017), and the trace plots were reexamined for any signs of shifts in convergence. Following this, a formal convergence diagnostic was performed. Given the multiple chains, the Gelman and Rubin (1992) diagnostic was employed, utilizing the potential scale reduction factor (PSRF) to assess convergence, with values below 1.1 generally accepted as indicating sufficient convergence (Depaoli & Van De Schoot, 2017).
Overall, visual analysis of the trace plots and Gelman–Rubin shrink factor plots suggests that the model exhibits good convergence and mixing across all parameters. Compared to the regression coefficients, the variance parameters demonstrated slightly slower mixing. In the first step, the parameters’ trace plots were analyzed for stability in the estimated parameter space and for local convergence. The trace plots suggest that the chains are well-mixed, with each chain exploring the parameter space effectively and showing no clear trends or drifts in estimated mean over iterations, thereby indicating no signs of local convergence. The four chains for each parameter showed strong agreement in their respective parameter spaces, with no evidence of shifts in the distributional patterns. Subsequently, the Gelman–Rubin diagnostic was calculated and Gelman–Rubin shrink factor plots were analyzed. PSRF point estimates and upper confidence intervals of 1.00 for all parameters, as well as a multivariate PSRF of 1.00, indicate successful convergence of the chains across all parameters. The Gelman–Rubin shrink factor plots revealed that most parameters reached stability within the first 5000 iterations, with variance parameters exhibiting more pronounced initial fluctuations before converging. Additionally, the 97.5% quantiles tracked closely to the median lines, suggesting relatively low uncertainty in the parameter estimates. Given these observations, we proceeded with 10,000 iterations, as no indications of local convergence issues were observed.
(iii)
Test for Autocorrelation
Despite the strong convergence diagnostics, the data were further analyzed for autocorrelation to assess the degree of dependency between consecutive samples in the MCMC chains. Autocorrelation plots were generated and visually inspected to determine the lag at which the autocorrelation function (ACF) decays to zero. Based on this evaluation, a decision was made regarding the necessity of thinning the sample.
The ACF values for each parameter decreased rapidly, approaching zero by lag 5. This rapid decay indicates that the chains mixed efficiently, with successive samples becoming largely independent after only a few iterations. Such behavior suggests that the MCMC procedure performed effectively, with no significant autocorrelation issues impacting the reliability of the posterior estimates. Consequently, thinning was deemed unnecessary, as the MCMC samples were already sufficiently independent.
(iv)
Posterior Distribution
The distribution of the posterior estimates was evaluated visually for informational content using histograms and kernel density plots. Histograms were explicitly employed to detect gaps in the posterior distribution, as Depaoli and Van De Schoot (2017) recommended. Kernel density plots were utilized because they provide a more comprehensive visualization by incorporating all data points, offering greater informational richness than histograms, and are particularly effective in identifying potential multimodal distributions in the data (Węglarczyk, 2018).
The histograms of the posterior distributions for all parameters were smooth, displaying no gaps or abnormalities. This suggests that a sufficient number of iterations was employed, ensuring reliable posterior estimates (Gelman & Rubin, 1992). Similarly, the kernel density plots exhibited relative smoothness, indicating well-mixed chains with no significant irregularities. Additionally, the kernel density plots showed no evidence of multimodality. However, certain parameters, particularly the variance estimates, showed broader posterior distributions, suggesting higher uncertainty compared to the regression parameter estimates.
(v)
Sensitivity Analysis
A comprehensive sensitivity analysis was conducted to evaluate the impact of the specified priors on model estimates. This involved re-estimating the model under two conditions: (1) using non-informative priors and (2) applying various adjustments within the predefined priors. Parameter estimates were subsequently compared to assess the influence of these priors on the model’s outcomes. As part of the sensitivity analysis, the priors for the regression coefficients were systematically varied between non-informative and informative settings to examine the effects of these changes on model fit and parameter estimates (De Bondt et al., 2020; Kaplan & Harra, 2024). For the non-informative priors, we selected normal distributions N(0, 100) for the regression coefficients and gamma distributions G(0.001, 0.001) for the variance components. This broad specification was chosen to enable the data to primarily guide the estimation process, minimizing the influence of prior assumptions. Initially, we conducted a comparative analysis between the models estimated with non-informative and informative priors to gain a preliminary understanding of the impact of prior specification on posterior estimates and overall model stability. We examined parameter estimates, credible intervals, and model fit indices to achieve this. To deepen this analysis, individual hyperparameters were varied at the parameter level to explore the specific effects of changes in the priors. Initially, as Depaoli and Van De Schoot (2017) recommended, only the mean hyperparameters were incrementally adjusted in steps of 0.2 (upward and downward). Following this, we varied the standard deviation hyperparameters for the regression priors by estimating models with standard deviations of 0.1 and 0.5 for all priors. Finally, the variance priors were varied between gamma distributions G(0.01, 0.01) and G(10, 10). To compare the parameter estimates across models, we calculated the relative difference in parameter estimates, using the model with informative priors as the reference. Following Depaoli and Van De Schoot (2017), differences of <1% were classified as minor, 1–10% as moderate, and >10% as large. The predictive accuracy of the models was calculated using the Leave-One-Out Information Criterion (LOOIC) and compared across the models. In this context, higher LOOIC values indicate lower predictive accuracy. This criterion was selected for its robustness in scenarios involving small sample sizes instead of other information criteria, such as the widely applicable information criterion (Gelman et al., 2013b; Vehtari et al., 2017). The effective number of parameters ( p l o o ) was also included in the comparison to assess model complexity. A higher effective number of parameters suggests increased model complexity and a higher risk of overfitting (Vehtari et al., 2017).
The results of the sensitivity analysis are as follows:
(1)
Comparison with Non-Informative Priors
In conducting a sensitivity analysis to compare the influence of non-informative and informative priors, several notable differences in model fit were observed. In this context, the Leave-One-Out Information Criterion (LOOIC) supports the advantage of the informative priors. The lower LOOIC (569.250) of the informative model compared to the non-informative model (575.056) indicates better predictive performance and generalization. Moreover, the adequate number of parameters ( p l o o ) is lower in the informative model (14.658 vs. 18.682), suggesting that the informative priors effectively regularized the model, reducing its complexity without compromising fit quality. The LOOIC and p l o o values of all models estimated during the sensitivity analysis can be found in Appendix C. Appendix E depicts the estimates for the regression parameters, including the credible intervals of the estimated path models that apply informative versus non-informative priors. The relative differences in the regression parameter estimates between the two models are predominantly moderate (n = 5) and, in some cases, large (n = 3) or minor (n = 2). Differences are substantial between the regression paths of self-efficacy (DMSE(t2)) and motivational orientation (MODM(t2)), as well as between attitudes (PADM(t2)) and motivational orientation (MODM(t2)). Compared to the model applying informative priors, the model with non-informative priors results in higher regression estimates between attitudes and motivational orientation and lower regression estimates between self-efficacy and motivational orientation. Posterior variance parameter estimates can be found in Appendix F.
(2)
Parameter Variation
The sensitivity analysis revealed varying levels of parameter sensitivity to prior specifications. Regression estimates were particularly affected by changes in the mean hyperparameters of the priors. A variation of ±0.4 in the mean hyperparameters resulted in predominantly large differences in the regression estimates, while a variation of ±0.2 led to mostly moderate differences. Variance estimates displayed greater sensitivity to downward adjustments of the regression priors, with mild differences emerging when the mean parameter was decreased, compared to minor differences with an upward adjustment. Variations in the standard deviation of the regression priors generally led to minor differences in the variance estimates but caused moderate to significant differences in the regression estimates. This suggests that the precision of the priors (as reflected by their standard deviations) had a substantial impact on the forecast, particularly on the regression coefficients. Finally, variations in the variance priors, specifically between G(0.01, 0.01) and G(10, 10) distributions, resulted in minor differences in the regression estimates but moderate to large differences in the variance parameters.
When comparing the LOOIC values across the sensitivity analysis, the baseline model with the original informative priors demonstrated the second-best fit among all models tested, indicating that the original informative priors provided a robust foundation for model estimation. Regarding model complexity, as indicated by the effective number of parameters ( p l o o ), the baseline model was of average complexity relative to the other models. Notably, the model employing a low, uniform standard deviation in the regression priors (SD = 0.1) achieved the best overall fit, with the lowest LOOIC and the most straightforward model structure, as evidenced by the effective parameters. However, it is important to note that while the model with SD = 0.1 produced superior fit metrics, the strict constraints imposed by such a low standard deviation could overly restrict the model’s flexibility, particularly for the small sample size (n = 42). This raises concerns that the model may excessively rely on priors, some of which are guided by somewhat uncertain expert estimates. Therefore, while the model is promising, caution should be exercised in interpreting these results, as the small sample size may not support the stringent assumptions embedded in such narrowly defined priors.
(3)
Evaluating Model Fit
We used the Posterior Predictive P-Value (ppp) and the Bayesian Root Mean Square Error of Approximation (BRMSEA) to evaluate model fit. The ppp, following the principles of posterior predictive checking, was particularly appropriate due to its reliability in small samples, with a value around 0.5 indicating good fit (Gelman et al., 2013a). Although the BRMSEA is typically used in large samples, we included it to provide an additional perspective on model fit. As noted by Hoofs et al. (2018), this fit index can be unstable in small samples. Despite this limitation, the BRMSEA was employed, with values below 0.05 indicating good fit and those between 0.05 and 0.08 considered acceptable (Hoofs et al., 2018). By combining ppp and BRMSEA, we sought to balance the ppp’s strength in small samples with the broader evaluation offered by BRMSEA, while remaining cautious of its limitations in this context.

Appendix C

Leave-One-Out Information Criteria (LOOIC) and effective number of parameters ( p l o o ) of the estimated models.
LOOIC p l o o
Informative Priors
(Baseline Model)
N(M, SD), G(1, 1)
569.25014.658
Non-informative Priors575.05618.682
M (−0.4)574.10314.340
M (−0.2)570.80714.527
M (+0.2)569.75414.876
M (+0.4)572.06715.166
SD = 0.1564.0039.585
SD = 0.5572.38616.803
G(0.01, 0.01)570.50515.765
G(10, 10)570.98911.253

Appendix D

Selected hyperparameters of the informative priors for regression paths in the model.
Regression Coefficient According to Vogelsang et al. (2023)Hyperparameters of the Informative Priors for Regression Paths in the Model
MODM(t2)~MODM(t1)0.345N(0.4, 0.2)
MODM(t2)~PADM(t2)0.335N(0.3, 0.2)
MODM(t2)~DMSE(t2)0.323N(0.3, 0.3)
DMSE(t2)~DMSE(t1)0.395N(0.4, 0.3)
PADM(t2)~PADM(t1)0.495N(0.5, 0.2)
DMSE(t2)~VEDM(t2)-N(0.3, 0.3)
PADM(t2)~VEDM(t2)-N(0.3, 0.3)
VEDM(t2)~VEDM(t1)-N(0.4, 0.3)
FUDM(t2)~MODM(t2)-N(0.3, 0.3)
FUDM(t2)~FUDM(t1)-N(0.4, 0.3)

Appendix E

Posterior regression parameter estimates and credible intervals in Bayesian path modeling of the estimated path model with informative and non-informative priors.
Regression ParameterMODM
(t2)
MODM
(t2)
MODM
(t2)
PADM
(t2)
PADM
(t2)
DMSE (t2)DMSE
(t2)
VEDM
(t2)
FUDM
(t2)
FUDM
(t2)
MODM
(t1)
PADM
(t2)
DMSE
(t2)
PADM
(t1)
VEDM
(t2)
DMSE
(t1)
VEDM
(t2)
VEDM
(t1)
FUDM
(t1)
MODM
(t2)
Model with Informative Priors
Regression0.4190.5170.1650.4380.2020.4920.1150.4940.4170.307
Credible Intervall/Posterior Intervalllower0.2170.257−0.0310.2410.0660.278−0.0850.2000.1650.051
upper0.6180.7660.3690.6390.3370.7030.3180.7880.6660.563
Model with Non-Informative Priors
Regression0.4020.6800.1040.4190.1990.5120.0880.5220.4200.308
Credible Intervall/Posterior Intervalllower0.1660.354−0.1880.1950.0610.283−0.1310.1800.1310.018
upper0.63410.0060.3240.6420.3350.7440.3070.8630.7060.598

Appendix F

Posterior variance parameter estimates and credible intervals in Bayesian path modeling of the estimated path model with informative and non-informative priors.
Variance
Parameter
MODM (t2)PADM (t2)DMSE (t2)VEDM (t2)FUDM (t2)
Model with Informative Priors
Variance0.4950.4230.94610.67910.004
Credible Intervall/Posterior Intervalllower0.3190.2740.61210.0980.650
upper0.4230.94610.45220.56810.538
Model with Non-Informative Priors
Variance0.4670.3960.94810.72510.015
Credible Intervall/Posterior Intervalllower0.2970.2540.60710.1100.649
upper0.7330.61710.47620.66010.579

References

  1. Ajzen, I. (1991). The theory of planned behavior. Organizational Behavior and Human Decision Processes, 50, 179–211. [Google Scholar] [CrossRef]
  2. Al-Awidi, H. M., & Alghazo, I. M. (2012). The Effect of student teaching experience on preservice elementary teachers’ self-efficacy beliefs for technology integration in the UAE. Educational Technology Research and Development, 60, 923–941. [Google Scholar] [CrossRef]
  3. Anderson, S. E., Groulx, J. G., & Maninger, R. M. (2011). Relationships among preservice teachers’ technology-related abilities, beliefs, and intentions to use technology in their future classrooms. Journal of Educational Computing Research, 45, 321–338. [Google Scholar] [CrossRef]
  4. Aumann, A., & Weitzel, H. (2022, July 4–6). Fostering pre-service science teachers’ enacted TPACK. Presentation of a comprehensive intervention in terms of a specific media use. Proceedings of the EDULEARN22 Proceedings (pp. 5400–5406), Palma, Spain. [Google Scholar]
  5. Aumann, A., & Weitzel, H. (2023). Exploring a theory-practice gap: An investigation of pre-service biology teachers’ enacted tpack. shaping the future of biological education research. In K. Korfiatis, M. Grace, & M. Hammann (Eds.), Contributions from Biology Education Research (pp. 311–323). Springer International Publishing. ISBN 978-3-031-44791-4. [Google Scholar]
  6. Backfisch, I., Lachner, A., Stürmer, K., & Scheiter, K. (2021). Gelingensbedingungen Beim Einsatz Digitaler Medien Im Unterricht—Kognitive Und Motivationale Voraussetzungen von Lehrpersonen. In N. Beck, T. Bohl, & S. Meissner (Eds.), Vielfältig herausgefordert. Forschungs-und entwicklungsfelder der lehrerbildung auf dem prüfstand (pp. 73–87). Universität Tübingen. ISBN 978-3-947251-30-8. [Google Scholar]
  7. Bandura, A. (1997). Self-Efficacy: The Exercise of Control. Freeman. [Google Scholar]
  8. Bandura, A. (1977). Self-efficacy: Toward a unifying theory of behavioral change. Psychological Review, 84, 191–215. [Google Scholar] [CrossRef] [PubMed]
  9. Baumert, J., & Kunter, M. (2013). The COACTIV model of teachers’ professional competence. In M. Kunter, J. Baumert, W. Blum, U. Klusmann, S. Krauss, & M. Neubrand (Eds.), Cognitive activation in the mathematics classroom and professional competence of teachers (pp. 25–48). Springer. ISBN 978-1-4614-5148-8. [Google Scholar]
  10. Bautista, N. U. (2011). Investigating the use of vicarious and mastery experiences in influencing early childhood education majors’ self-efficacy beliefs. Journal of Science Teacher Education, 22, 333–349. [Google Scholar] [CrossRef]
  11. Becker, S., Bruckermann, T., Finger, A., Huwer, J., Kremser, J., Meier, M., Thoms, L. J., Thyssen, C., & von Kothebue, L. (2020). Orientierungsrahmen digitale kompetenzen für das lehramt in den naturwissenschaften—DiKoLAN. In S. Becker, J. Meßinger-Koppelt, & C. Thyssen (Eds.), Digitale Basiskompetenzen—Orientierungshilfe und Praxisbeispiele für die universitäre Lehramtsausbildung in den Naturwissenschaften (pp. 14–43). Joachim Herz Stiftung. [Google Scholar]
  12. Blömeke, S. (2007). Empirische forschung zu neuen medien in schule und lehrerausbildung. In W. Sesink, M. Kerres, & H. Moser (Eds.), Jahrbuch Medienpädagogik 6. Medienpädagogik—Standortbestimmung einer erziehungswissenschaftlichen Disziplin (pp. 246–262). Springer. [Google Scholar]
  13. Braun, A., Weiß, S., & Kiel, E. (2022). Überzeugungsmuster angehender lehrpersonen zum einsatz digitaler medien im unterricht. MedienPädagogik: Zeitschrift für theorie und praxis der medienbildung, 235–259. [Google Scholar] [CrossRef]
  14. Caprara, G. V., Barbaranelli, C., Steca, P., & Malone, P. S. (2006). Teachers’ self-efficacy beliefs as determinants of job satisfaction and students’ academic achievement: A study at the school level. Journal of School Psychology, 44, 473–490. [Google Scholar] [CrossRef]
  15. Cheng, Y., & Weng, C. (2017). Factors influence the digital media teaching of primary school teachers in a flipped class: A Taiwan case study. South African Journal of Education, 37, 1–12. [Google Scholar] [CrossRef]
  16. De Bondt, N., Donche, V., & Van Petegem, P. (2020). Are contextual rather than personal factors at the basis of an anti-school culture? A bayesian analysis of differences in intelligence, overexcitability, and learning patterns between (former) lower and higher-track students. Social Psychology of Education, 23, 1627–1657. [Google Scholar] [CrossRef]
  17. DeCoito, I., & Richardson, T. (2018). Teachers and technology: Present practice and future directions. Contemporary Issues in Technology and Teacher Education, 18, 362–378. [Google Scholar]
  18. De La Torre Cruz, M. J., & Casanova Arias, P. F. (2007). Comparative analysis of expectancies of efficacy in in-service and prospective teachers. Teaching and Teacher Education, 23, 641–652. [Google Scholar] [CrossRef]
  19. Depaoli, S., & Van De Schoot, R. (2017). Improving transparency and replication in bayesian statistics: The WAMBS-checklist. Psychological Methods, 22, 240–261. [Google Scholar] [CrossRef] [PubMed]
  20. Diepolder, C., Weitzel, H., Huwer, J., & Lukas, S. (2021). Verfügbarkeit und zielsetzungen digitalisierungsbezogener lehrkräftefortbildungen für naturwissenschaftliche lehrkräfte in Deutschland. Zeitschrift für Didaktik der Naturwissenschaften, 27, 203–214. [Google Scholar] [CrossRef]
  21. Drossel, K., Eickelmann, B., & Gerick, J. (2017). Predictors of teachers’ use of ICT in school—the relevance of school characteristics, teachers’ attitudes and teacher collaboration. Education and Information Technologies, 22, 551–573. [Google Scholar] [CrossRef]
  22. Eickelmann, B., Bos, W., Gerick, J., Goldhammer, F., Schaumburg, H., Schwippert, K., Senkbeil, M., & Vahrenhold, J. (2019). ICILS 2018 #Deutschland computer-und informationsbezogene kompetenzen von schülerinnen und schülern im zweiten internationalen vergleich und kompetenzen im bereich computational thinking. Waxmann. ISBN 978-3-8309-4000-5. [Google Scholar]
  23. Eickelmann, B., Lorenz, R., Endberg, M., & Domke, M. (2022). Digitalisierungsbezogene fortbildung und professionelle lerngelegenheiten von lehrpersonen der sekundarstufe 1 in Deutschland und im bundesländervergleich. In R. Lorenz, S. Yotyodying, B. Eickelmann, & M. Endberg (Eds.), Schule digital—der Länderindikator 2021. Lehren und lernen mit digitalen medien in der sekundarstufe 1 in Deutschland im bundesländervergleich und im Trend seit 2017. Waxmann. [Google Scholar]
  24. Eldaou, B. (2016). The relationship between teacher’s self-efficacy, attitudes toward ICT usefulness and student’s science performance in the lebanese inclusive schools 2015. Acta Psychopathology, 8, 277–293. [Google Scholar] [CrossRef]
  25. Gelman, A., Carlin, J. B., Stern, H. S., Dunson, D. B., Vehtari, A., & Rubin, D. B. (2013a). Bayesian data analysis (3rd ed.). Chapman and Hall/CRC. ISBN 978-0-429-11307-9. [Google Scholar]
  26. Gelman, A., Hwang, J., & Vehtari, A. (2013b). Understanding predictive information criteria for bayesian models. Statistics and Computing, 24, 997–1016. [Google Scholar] [CrossRef]
  27. Gelman, A., & Rubin, D. B. (1992). Inference from iterative simulation using multiple sequences. Statistical Science, 7, 457–511. [Google Scholar] [CrossRef]
  28. Gerick, J., Eickelmann, B., & Labusch, A. (2019). Schulische prozesse als lern- und lehrbedingungen in den ICILS-2018-teilnehmerländern. In B. Eickelmann, W. Bos, J. Gerick, F. Goldhammer, H. Schaumburg, K. Schwippert, M. Senkbeil, & J. Vahrenhold (Eds.), ICILS 2018 #Deutschland. Computer-und informationsbezogene kompetenzen von schülerinnen und schülern im zweiten internationalen vergleich und kompetenzen im bereich computational thinking (pp. 173–203). Waxmann. [Google Scholar]
  29. Goldstone, R. L., & Sakamoto, Y. (2003). The Transfer of abstract principles governing complex adaptive systems. Cognitive Psychology, 46, 414–466. [Google Scholar] [CrossRef] [PubMed]
  30. Gregoire, M. (2003). Is it a challenge or a threat? A dual-process model of teachers’ cognition and appraisal processes during conceptual change. Educational Psychology Review, 15, 147–179. [Google Scholar] [CrossRef]
  31. Han, I., Shin, W. S., & Ko, Y. (2017). The effect of student teaching experience and teacher beliefs on pre-service teachers’ self-efficacy and intention to use technology in teaching. Teachers and Teaching: Theory and Practice, 23, 829–842. [Google Scholar] [CrossRef]
  32. Heath, M. K. (2017). Teacher-initiated one-to-one technology initiatives: How teacher self-efficacy and beliefs help overcome barrier thresholds to implementation. Computers in the Schools, 34, 88–106. [Google Scholar] [CrossRef]
  33. Hillmayr, D., Ziernwald, L., Reinhold, F., Hofer, S. I., & Reiss, K. M. (2020). The potential of digital tools to enhance mathematics and science learning in secondary schools: A context-specific meta-analysis. Computers & Education, 153, 103897. [Google Scholar] [CrossRef]
  34. Holden, H., & Rada, R. (2011). Understanding the influence of perceived usability and technology self-efficacy on teachers’ technology acceptance. Journal of Research on Technology in Education, 43, 343–367. [Google Scholar] [CrossRef]
  35. Holzberger, D., Philipp, A., & Kunter, M. (2013). How teachers’ self-efficacy is related to instructional quality: A longitudinal analysis. Journal of Educational Psychology, 105, 774–786. [Google Scholar] [CrossRef]
  36. Hoofs, H., Van De Schoot, R., Jansen, N. W. H., & Kant, I. (2018). Evaluating model fit in bayesian confirmatory factor analysis with large samples: Simulation study introducing the BRMSEA. Educational and Psychological Measurement, 78, 537–568. [Google Scholar] [CrossRef] [PubMed]
  37. Hoy, A. W., Hoy, W. K., & Davis, H. A. (2009). Teachers’ self-efficacy beliefs. In K. R. Wigfield, & A. Wentzel (Eds.), Handbook of motivation at school (pp. 627–653). Routledge. [Google Scholar]
  38. Hsu, M. H., & Chiu, C. M. (2004). Internet self-efficacy and electronic service acceptance. Decision Support Systems, 38, 369–381. [Google Scholar] [CrossRef]
  39. Joo, Y. J., Park, S., & Lim, E. (2018). Factors influencing preservice teachers’ intention to use technology. Educational Technology & Society, 21, 48–59. [Google Scholar]
  40. Kaplan, D., & Harra, K. (2024). A bayesian workflow for the analysis and reporting of international large-scale assessments: A case study using the oecd teaching and learning international survey. Large-Scale Assessments in Education, 12, 2. [Google Scholar] [CrossRef]
  41. Kiili, C., Kauppinen, M., Coiro, J., & Utriainen, J. (2016). Measuring and supporting pre-service teachers’ self-efficacy toward computers, teaching, and technology integration. Journal of Technology and Teacher Education, 24, 443–469. [Google Scholar]
  42. Kindermann, K., & Pohlmann-Rother, S. (2022). Unterricht mit digitalen medien?!: Mit welchen überzeugungen und motivationalen orientierungen zum unterrichtlichen einsatz von tablets starten studierende ins lehramtsstudium? Zeitschrift für Grundschulforschung, 15, 435–452. [Google Scholar] [CrossRef]
  43. Klassen, R. M., & Tze, V. M. C. (2014). Teachers’ self-efficacy, personality, and teaching effectiveness: A meta-analysis. Educational Research Review, 12, 59–76. [Google Scholar] [CrossRef]
  44. Klassen, R. M., Bong, M., Usher, E. L., Chong, W. H., Huan, V. S., Wong, I. Y. F., & Georgiou, T. (2009). Exploring the validity of a teachers’ self-efficacy scale in five countries. Contemporary Educational Psychology, 34, 67–76. [Google Scholar] [CrossRef]
  45. König, C., & Van De Schoot, R. (2018). Bayesian statistics in educational research: A look at the current state of affairs. Educational Review, 70, 486–509. [Google Scholar] [CrossRef]
  46. Kramer, M., Förtsch, C., Aufleger, M., & Neuhaus, B. J. (2019). Der einsatz digitaler medien im gymnasialen biologieunterricht. Eine deskriptive auswertung einer quantitativen videostudie. Zeitschrift für Didaktik der Naturwissenschaften, 25, 131–160. [Google Scholar] [CrossRef]
  47. Kreijns, K., Van Acker, F., Vermeulen, M., & Van Buuren, H. (2013). What stimulates teachers to integrate ICT in their pedagogical practices? The use of digital learning materials in education. Computers in Human Behavior, 29, 217–225. [Google Scholar] [CrossRef]
  48. Lee, Y., & Lee, J. (2014). Enhancing pre-service teachers’ self-efficacy beliefs for technology integration through lesson planning practice. Computers & Education, 73, 121–128. [Google Scholar] [CrossRef]
  49. Li, Y., Garza, V., Keicher, A., & Popov, V. (2019). Predicting high school teacher use of technology: Pedagogical beliefs, technological beliefs and attitudes, and teacher training. Technology, Knowledge and Learning, 24, 501–518. [Google Scholar] [CrossRef]
  50. McGarr, O., & McDonagh, A. (2020). Exploring the digital competence of pre-service teachers on entry onto an initial teacher education programme in ireland. Irish Educational Studies, 40, 115–128. [Google Scholar] [CrossRef]
  51. Meagher, M., Ozgun-Koca, A., & Edwards, M. T. (2011). Preservice teachers’ experiences with advanced digital technologies: The interplay between technology in a preservice classroom and in field placements. Contemporary Issues in Technology and Teacher Education, 11, 243–270. [Google Scholar]
  52. Murphy, C. A., Coover, D., & Owen, S. V. (1989). Development and validation of the computer self-efficacy scale. Educational and Psychological Measurement, 49, 893–899. [Google Scholar] [CrossRef]
  53. Muthén, B., & Asparouhov, T. (2012). Bayesian structural equation modeling: A more flexible representation of substantive theory. Psychological Methods, 17, 313–335. [Google Scholar] [CrossRef]
  54. Paetsch, J., Franz, S., & Wolter, I. (2023). Changes in early career teachers’ technology use for teaching: The roles of teacher self-efficacy, ICT literacy, and experience during COVID-19 school closure. Teaching and Teacher Education, 135, 104318. [Google Scholar] [CrossRef]
  55. Pfitzner-Eden, F. (2016). Why do I feel more confident? Bandura’s sources predict preservice teachers’ latent changes in teacher self-efficacy. Frontiers in Psychology, 7, 1486. [Google Scholar] [CrossRef] [PubMed]
  56. Pozas, M., Letzel, V., & Frohn, J. (2022). An empirical study exploring pre-service teachers’ profiles and their prospective ICT integration: Is it a matter of attitudes, self-efficacy, self-concept or concerns? Journal of Computers in Education, 11, 237–257. [Google Scholar] [CrossRef]
  57. Pringle, R. M., Dawson, K., & Ritzhaupt, A. D. (2015). Integrating science and technology: Using technological pedagogical content knowledge as a framework to study the practices of science teachers. Journal of Science Education and Technology, 24, 648–662. [Google Scholar] [CrossRef]
  58. Pumptow, M. I. (2020). Digital media in higher education—The use and importance of digital media in contemporary university studies [Ph.D. Dissertation, Tübingen University]. [Google Scholar]
  59. Razali, N. M., & Wah, Y. B. (2011). Power comparisons of shapiro-wilk, kolmogorov-smirnov, lilliefors and anderson-darling tests. Journal of Statistical Modeling and Analytics, 2, 21–33. [Google Scholar]
  60. Reusser, K., & Pauli, C. (2014). Berufsbezogene überzeugungen von lehrerinnen und lehrern. In E. Terhart, H. Bennewitz, & M. Rothland (Eds.), Handbuch der Forschung zum Lehrerberuf (pp. 642–661). Waxmann. [Google Scholar]
  61. Schleicher, A. (2020). The impact of COVID-19 on education: Insights from education at a glance. OECD. [Google Scholar]
  62. Smid, S. C., & Rosseel, Y. (2020). SEM with small samples. Two-step modeling and factor score regression versus bayesian estimation with informative priors. In R. Van De Schoot, & M. Miočević (Eds.), Small sample size solutions: A guide for applied researchers and practitioners (pp. 239–255). Routledge. [Google Scholar]
  63. Stender, A., Brückmann, M., & Neumann, K. (2017). Transformation of topic-specific professional knowledge into personal pedagogical content knowledge through lesson planning. International Journal of Science Education, 39, 1690–1714. [Google Scholar] [CrossRef]
  64. Straub, E. T. (2009). Understanding technology adoption: Theory and future directions for informal learning. Review of Educational Research, 79, 625–649. [Google Scholar] [CrossRef]
  65. Szeto, E., & Cheng, A. Y. N. (2017). Pedagogies across subjects: What are preservice teachers’ tpack patterns of integrating technology in practice? Journal of Educational Computing Research, 55, 346–373. [Google Scholar] [CrossRef]
  66. Teo, T., Zhou, M., & Noyes, J. (2016). Teachers and technology: Development of an extended theory of planned behavior. Educational Technology Research and Development, 64, 1033–1052. [Google Scholar] [CrossRef]
  67. Tondeur, J., van Braak, J., Sang, G., Voogt, J., Fisser, P., & Ottenbreit-Leftwich, A. (2012). Preparing pre-service teachers to integrate technology in education: A synthesis of qualitative evidence. Computers & Education, 59, 134–144. [Google Scholar] [CrossRef]
  68. Tondeur, J., van Braak, J., Siddiq, F., & Scherer, R. (2016). Time for a new approach to prepare future teachers for educational technology use: Its meaning and measurement. Computers & Education, 94, 134–150. [Google Scholar] [CrossRef]
  69. Valtonen, T., Hoang, N., Sointu, E., Näykki, P., Virtanen, A., Pöysä-Tarhonen, J., Häkkinen, P., Järvelä, S., Mäkitalo, K., & Kukkonen, J. (2021). How pre-service teachers perceive their 21st-century skills and dispositions: A longitudinal perspective. Computers in Human Behavior, 116, 106643. [Google Scholar] [CrossRef]
  70. Vehtari, A., Gelman, A., & Gabry, J. (2017). Practical bayesian model evaluation using leave-one-out cross-validation and WAIC. Statistics and Computing, 27, 1413–1432. [Google Scholar] [CrossRef]
  71. Vogelsang, C., Caruso, C., Seifert, A., & Schwabl, F. (2023). Wie entwickeln sich medienbezogene einstellungen, selbsteingeschätzte medienkompetenzen und motivationale orientierungen angehender lehrkräfte? Eine sekundäranalyse von evaluationsdaten zum praxissemester im zweiten COVID-19-bedingten lockdown. MedienPädagogik: Zeitschrift für Theorie und Praxis der Medienbildung, 22–50. [Google Scholar] [CrossRef]
  72. Vogelsang, C., Finger, A., Laumann, D., & Thyssen, C. (2019). Vorerfahrungen, einstellungen und motivationale orientierungen als mögliche einflussfaktoren auf den einsatz digitaler werkzeuge im naturwissenschaftlichen unterricht. Zeitschrift für Didaktik der Naturwissenschaften, 25, 115–129. [Google Scholar] [CrossRef]
  73. Wang, L., Ertmer, P. A., & Newby, T. J. (2004). Increasing preservice teachers’ self-efficacy beliefs for technology integration. Journal of Research on Technology in Education, 36, 231–250. [Google Scholar] [CrossRef]
  74. Weinert, F. E. (2001). Vergleichende leistungsmessung in schulen—Eine umstrittene selbstverständlichkeit. Beltz. [Google Scholar]
  75. West, S. G., Finch, J. F., & Curran, P. J. (1995). Structural equation models with nonnormal variables: Problems and remedies. In R. H. Hoyle (Ed.), Structural equation modeling. concepts, issues, and applications (pp. 56–76). Sage. [Google Scholar]
  76. Węglarczyk, S. (2018). Kernel density estimation and its application. ITM Web Conferences, 23, 00037. [Google Scholar] [CrossRef]
  77. Zeng, Y., Wang, Y., & Li, S. (2022). The relationship between teachers’ information technology integration self-efficacy and TPACK: A meta-analysis. Frontiers in Psychology, 13, 1091017. [Google Scholar] [CrossRef] [PubMed]
Figure 1. Hypothesized path model. Autoregressive pathways and constructs at t1 are grayed out.
Education 15 00015 g001
Figure 2. Bayesian path model depicting the posterior regression estimates. Autoregressive pathways and constructs at t1 are grayed out.
Education 15 00015 g002
Table 1. Scales used and their validity.
ConstructExemplary ItemReferenceValidityItems
Vicarious experiences using digital media in teaching (VEDM)“I saw good examples of ICT practice that inspired me to use ICT applications in the classroom myself.”Tondeur et al. (2016)Cronbachs’
α = 0.875 (Pre)
α = 0.928 (Post)
4
Digital media self-efficacy (DMSE)“I am relaxed about difficulties when dealing with digital media, because I can always trust by abilities.”Pumptow (2020)Cronbachs’
α = 0.957 (Pre)
α = 0.946 (Post)
7
Positive attitudes toward digital media in teaching (PADM)“The use of digital media enables a high degree of self-determined learning.”Vogelsang et al. (2019)Cronbachs’
α = 0.822 (Pre)
α = 0.881 (Post)
8
Motivational orientation toward digital media in teaching (MODM)“I am very interested in thinking about how I can better support my students’ learning with the help of digital media.”Vogelsang et al. (2019)Cronbachs’
α = 0.865 (Pre)
α = 0.916 (Post)
6
Frequency of use of digital media in teaching (FUDM)“How often have you systematically used digital media to achieve specific learning objectives in your own teaching and learning programs (e.g., internships, seminars)?”Single-item scale with 5 response categories ranging from 0 to over 15 times.
Table 2. Descriptive statistics of the constructs surveyed in study 2 at t1 and t2 (measured on a Likert Scale from 0 to 6).
MODM
(t1)
MODM
(t2)
PADM
(t1)
PADM
(t2)
DMSE
(t1)
DMSE
(t2)
VEDM
(t1)
VEDM
(t2)
FUDM
(t1)
FUDM
(t2)
Arithmetic Mean Value3.7604.2054.4074.7623.7004.2693.3663.4652.9103.370
Standard Deviation1.0751.111.877.7811.3271.1811.1781.4211.1301.176
Table 3. Paired t-test results comparing t1 and t2.
MODMPADMDMSE
Significance (Two-Sided)p < 0.001p = 0.003p < 0.001
Cohen’s d0.8990.8161.13
Disclaimer/Publisher’s Note: The statements, opinions and data contained in all publications are solely those of the individual author(s) and contributor(s) and not of MDPI and/or the editor(s). MDPI and/or the editor(s) disclaim responsibility for any injury to people or property resulting from any ideas, methods, instructions or products referred to in the content.

