Abstract
This paper solves the complex scientific and practical problem of developing the critical thinking skills of the modern student. The solution of the indicated problem was accomplished by generalizing contemporary scientific works and conducting an empirical study (survey) of university students. The conducted research made it possible to distinguish students’ behavior styles according to seven criteria: the student’s level of trust in the higher education system; the student’s tendency to cheat the education system; the student’s degree of self-reliance and self-confidence; the student’s degree of disappointment with the education system; the student’s degree of involvement in the education process; the student’s degree of social inclusion; and the student’s degree of dependence on formal learning results. In this research, we determined the effectiveness of different teaching methods and proved that the student’s preference of teaching methods depends on their behavior styles. This means that in order to increase the effectiveness of the educational process, the academic teacher must select teaching methods while taking into account the behavior styles of the students. To this end, the article develops a model for the selection of active learning methods, taking into account the behavior styles of modern students, and conducts an approval of this model.
1. Introduction
The beginning of the 2020s is characterized by a significant intensification on the digitization processes of all areas of social and economic life. The widespread use of internet technologies and artificial intelligence (key technologies of the Fourth Industrial Revolution) contributes to profound transformations in the labor market and needs the formation of new employee skills [1,2,3,4,5]. According to global experts, the most important of these skills is the ability to think critically and analyze [6].
Critical thinking is an intellectual cognitive process of evaluating and analyzing gathered information. Critical thinking directed at understanding and solving problems on the grounds of evaluating alternatives is based on the ability to question existing findings and practices. Critical thinking can be used as a tool to conduct research and make decisions about socio-economic processes and personal development [7,8]. With the development of the information society, critical thinking has been recognized as an indispensable tool for properly recognizing and processing diverse information [9,10] and shaping personal and social transformation [11]. Researchers define critical thinking as the ability to conceptualize problems, that is, the ability to generate an original vision for solving a specific scientific or practical problem [12,13].
In the conditions of the Fourth Industrial Revolution, when artificial intelligence replaces humans even in white-collar jobs, the ability to think critically is an essential factor for success in the job market [1,14,15,16,17]. For their part, employers feel a great need for employees capable of critical thinking and analysis, since only such employees are able to make intelligent decisions directed at the development of the organization in the constantly changing external environment of the company [18,19].
Taking into account the importance of critical thinking in personal, social and professional life, the researchers conducted an analysis of the level of students’ critical thinking skills and the level of students’ knowledge of critical thinking, as well as their position on the higher education system’s efforts to develop such thinking competencies. The results of these studies showed an understanding of the essence and importance of critical thinking, but also indicated a significant deficit in critical thinking skills among students and a lack of knowledge about methods for developing them [20,21,22,23,24,25]. Accordingly, developing critical thinking skills is a key objective of the teaching process in higher education. The realization of this goal needs the selection of teaching methods which are focused on the student, not the teacher [26], and taking into account the fact that the process of the absorption of knowledge by the student largely depends on the degree of the correlation of knowledge with reality, that is, the possible practical application of the knowledge received [27].
With regard to the quality of such methods, directed at the development of critical thinking skills in students, many authors propose the use of active learning methods, such as case studies, brainstorming, decision-making games, debates, project methods and others. These methods force students to search for the necessary information, evaluate and analyze data, to question the traditional approach to solving a problem, and to ultimately make an independent intellectual decision [12,28,29,30]. In addition to this, the process of education using active learning methods needs interdisciplinary academic knowledge necessary to solve specific practical problems. With active learning, education becomes a process of students’ mental, intelligent acts, based on the knowledge acquired early on [31,32,33]. Such a learning process is fully student-centered, increases student engagement, improves learning outcomes, and develops critical thinking skills [34,35,36,37,38].
Despite the understanding of the indispensability of using active learning, studies conducted at universities have shown that, as of today, the educational process in higher education is mainly based on traditional (passive) teaching methods [39,40,41,42]. This has been due to the fact that the intensity of the introduction of active methods in universities depends not only on the involvement of the teacher, but also on the student’s willingness to engage in group interaction during the learning process [43]. In turn, the level of students’ readiness for such interaction is highly dependent on their motivation for learning and the level of their academic and professional knowledge. Active learning methods, selected with the student’s level of readiness for learning in mind, make it possible to: compensate for poor educational and cognitive motivation; raise the level of personal and team responsibility; and foster the development of critical thinking [13,21,26,33,44]. To increase the student’s inclusion in the learning process, the academic teacher must remember that each student is a personality, an individual who has his or her own specific characteristics, tastes, preferences, abilities, his or her original way of processing information and approach to problem solving [45,46,47,48,49].
Upon summarizing the analysis of the literature, we can conclude the following:
- Technological advances and the modern labor market need employees with developed critical thinking skills, and this means that developing critical thinking skills in today’s students becomes the most important goal for universities;
- Research conducted at universities has shown that students have a good understanding of the essence of critical thinking, but they do not fully understand how to develop critical thinking skills;
- For the quality of the tool in developing critical thinking skills, researchers determine active learning methods, which by definition are student-centered and require an enlarged degree of student involvement in the learning process;
- The student’s level of involvement in learning largely depends on his or her personal motivation and personality traits, and this means that the selection of active learning methods aimed at developing critical thinking skills must take into account the student’s personality and behavior style.
Accordingly, the purpose of this article is to develop a model for the selection of active learning methods while taking into account the behavior styles of modern students.
The implementation of the stated goal needs answers to three fundamental questions:
- What teaching methods have a higher level of efficiency and effectiveness on the modern student?
- What are the modern student’s behavior styles?
- How to effectively select teaching methods while taking into account the modern student behavior styles?
The subject scope of the research refers to two research fields: teaching methods and student behavior styles. The subjective scope includes the students of a Polish higher education institution.
2. Materials and Methods
2.1. Research Sample
The study included voluntarily participating students assigned to class groups where the researchers taught in the winter semester of the 2022/2023 academic year. All students participating in the study were studying full-time. The surveyed students come from three majors: physiotherapy (single master’s degree year 1–52%), management (bachelor’s degree year 3–18%; master’s degree year 2–8%; total—26%), and economics (bachelor’s degree year 3–16%; master’s degree year 2–6%; total—22%). In the field of physiotherapy, 67% of the surveyed student group completed the questionnaire, while in the field of management—75%, and in the field of economics—100% of the students.
The total number of students in the selected groups is 181 people; 141 students completed the questionnaire; after rejecting incomplete questionnaires, 136 questionnaires were left for analysis; the size of the surveyed population was 75% (136/181 = 0.75); and the representative sample size was 123 people (the representative sample size was calculated using a sampling calculator [50] while assuming the following parameters: fraction size—0.5; maximum error—5%; confidence level α—95%).
Preliminary analysis of the questionnaires made it possible to isolate a group of students whose answers can be categorized as “mechanical”. Such a separation was achieved by analyzing the standard deviation of the obtained answers to questions drawn up in the manner of the so-called “one-choice grid” (question numbers in the research survey—P5–10, P11–25, P26–31, P34–38). In general, the standard deviation shows to what extent the surveyed person’s ratings deviate from the average of the person’s given ratings; in other words, to what extent the person answering the questions and providing the ratings is aware of the usefulness of each of the analyzed items compared to others. Distinguishing what is better and what is worse is the basis for conscious choice-making and the process of analyzing the given elements. In the case of 136 analyzed questionnaires, it was found that in 22.06% of all questionnaires, the standard deviation in some groups of questions is zero, namely 17 students (12.50% from all respondents) approached the questions in a “mechanical” manner 1 time; 6 students (4.41%)—2 times; 2 students (1.47%)—3 times; and 5 students (3.68%)—4 times. Statistically speaking, a preliminary analysis of student surveys showed that at least 1 out of 25 people filled out the survey “mechanically.” In this study, it was decided that 5 surveys in which students filled out the survey four times in a “mechanical” manner should be considered unusable and excluded from further analysis. As a result, 131 surveys were finally analyzed, which corresponds to the condition of representativeness of the selected research sample (a minimum of 123 respondents).
2.2. Research Tools and Hypotheses
An online survey was developed to conduct the study. The survey consists of three substantive parts: (1) student profile, (2) teaching methods, and (3) modern students’ behavior styles. A linear scale from 1 to 10 points is used in the survey to build a ranking of teaching methods and to determine the level of student satisfaction with the study. This approach provided an opportunity to identify methods directed at the development of critical thinking skills, and enabled the development of a model for the selection of active learning methods while taking into account the behavior styles of modern students identified in the survey.
Research hypotheses:
H1.
Active learning methods, according to students’ opinions, have the highest level of effectiveness and efficiency in the educational process compared to other types of approaches.
H2.
There is a discrepancy between the set of didactic methods most popular among university teachers and the effectiveness of these methods from the students’ point of view.
H3.
The modern student, despite the widespread use of internet technologies, still needs direct interaction with the academic teacher.
H4.
Active learning methods in the educational process are used incompletely.
H5.
Students believe that active learning methods have a high degree of influence on the development of their professional skills.
H6.
There are a set of factors that demotivate students to learn, which in turn affect their behavior styles.
H7.
A group of students is diverse, where each participant is different—they look at the world through their own prism, namely their level of knowledge, skills and social competence, which shape their behavior style.
H8.
To improve the effectiveness of the educational process, the academic teacher must select teaching methods while taking into account the behavior styles of the students of the class group.
2.3. Survey Design
The survey was divided into three parts and consisted of 88 questions in total (Supplementary Material 2).
The first part of the survey “Student Profile” had 4 main questions (P1–4), namely: P1: Name; P2: Field of study (physiotherapy, economics, management); P3: Degree of study (first degree—bachelor’s, second degree—master’s, single master’s); P4: Year of study (1, 2, 3, 4, 5). The survey deliberately omitted the question on gender for the reason that teaching methods are supposed to be independent of the student’s gender.
The second part of the survey “Teaching methods” was based on questions regarding the evaluation of the effectiveness and efficiency of the use of selected teaching methods in the educational process (didactic methods were selected on the basis of a modified division of teaching methods according to Franciszek Szlosek [51]):
- Questions P5–10: Students were asked to rate on a scale of 1 to 10 the effectiveness of the use of each group of teaching methods in the educational process. In order to increase the quality of the results obtained from the survey, students were given definitions of each method.
- Questions P11–25: Students were asked to rate on a scale of 1 to 10 the effectiveness of selected teaching methods that they may have encountered during their studies (if they had not encountered a selected method during their studies, they were given the option to select “Not applicable”).
- Questions P26–31: Students were asked to rate on a scale of 1 to 10 their level of preference for selected forms of innovative teaching. In order to raise the level of students’ awareness when answering and the level of quality of the results received, students were given additional instructions with examples.
- Questions P32–38: Questions in this pool refer to the so-called methods of engaging the student in the educational process. The purpose of using these methods is to increase the level of student involvement in the learning process, develop the student’s critical thinking skills, ability to solve problems outside the box and make decisions independently. The results obtained are intended to show to what extent the student is exposed to active learning methods (in other words, how popular these methods are among university teachers) and how the student perceives active learning. All questions in this category use a scale from 1 to 10.
- Questions P39–49: The questions in this pool are directed at exploring factors demotivating a student to study. Students were asked to rate on a scale of 1 to 10 to what extent the following factors have a negative impact on a student’s motivation to study.
The third part of the survey “Modern Student Behavior Styles” consists of questions designed to allow an understanding of the behavior styles of modern students, determine their self-assessment, and prove that the modern occupational group is diverse, heterogeneous in terms of views, needs, characters and willingness to learn. This part of the survey consists of 39 questions (P50–88), the answers to which allowed the authors to distinguish students’ behavior styles according to seven criteria:
- S1: Students’ level of confidence in the higher education system;
- S2: Students’ tendency to cheat the education system/academic teacher (students’ level of honesty);
- S3: Students’ level of self-reliance and self-confidence;
- S4: Students’ level of disillusionment with the educational system;
- S5: Students’ level of involvement in the educational process;
- S6: Students’ level of social inclusion;
- S7: Students’ level of dependence on formal learning outcomes, i.e., on assessment.
The obtained answers to the questions of the third group are meant to provide the university teachers with an understanding of what kind of students they are managing. The distinguished behavior styles of students, combined with the results of the second part of the questionnaire, will allow the development of a model for the selection of active learning methods while taking into account the behavior styles of modern university students.
3. Results
3.1. Evaluation of the Effectiveness and Efficiency of the Use of Selected Teaching Methods in the Educational Process
3.1.1. Analysis of Questions P5–10: Evaluation of the Effectiveness of the Use of Selected Groups of Teaching Methods
Questions P5–10 concern the evaluation of the effectiveness of the use of selected groups of teaching methods: “Instructional methods”, “Problem-based methods”, “Activation methods”, “Expository methods”, “Software-based methods”, and “Practical methods”. The general descriptive statistics of the obtained answers to P5–10 questions on groups of teaching methods is presented in Supplementary Material 3 (Table S3).
Based on the data obtained (Supplementary Material 3, Table S3), we can conclude that the conducted study has a high level of confidence and allows us to develop a ranking of the studied groups of teaching methods according to the indicator “Total points obtained” (Figure 1).

Figure 1.
Overall ranking of selected groups of teaching methods according to the opinion of students, points.
In the presented ranking, the first place belongs to “Activating methods” with a score of 897 points (the maximum number of points to be obtained was 1310), and the second place was occupied by the group of “Practical methods” (893 points), followed by “Software-based methods” (860 points). The last place in the ranking is occupied by “Instructional methods”.
3.1.2. Analysis of Questions P11–25: Assessing the Popularity and Effectiveness of Selected Teaching Methods
Questions P11–25 were directed at assessing the popularity and effectiveness of selected teaching methods that students may have encountered during their studies. Teaching methods were selected on the basis of the use of the literature on the subject [26,52,53,54,55] and the expert method. The authors of the article, who are university teachers with many years of professional experience (12 and 25 years of work at universities), acted in the quality of experts. The following methods of teaching referred to the selected methods: lecture; discussion; questions and answers; case study; debate; brainstorming; decision tree; field activities; project method; snowball method; SWOT analysis; fish skeleton; mind map; learning games; and specialized software. The general descriptive statistics of the obtained answers to P11–25 questions on the selected teaching methods with which the students may have had to use during the course of their studies are presented in Supplementary Material 3 (Table S4).
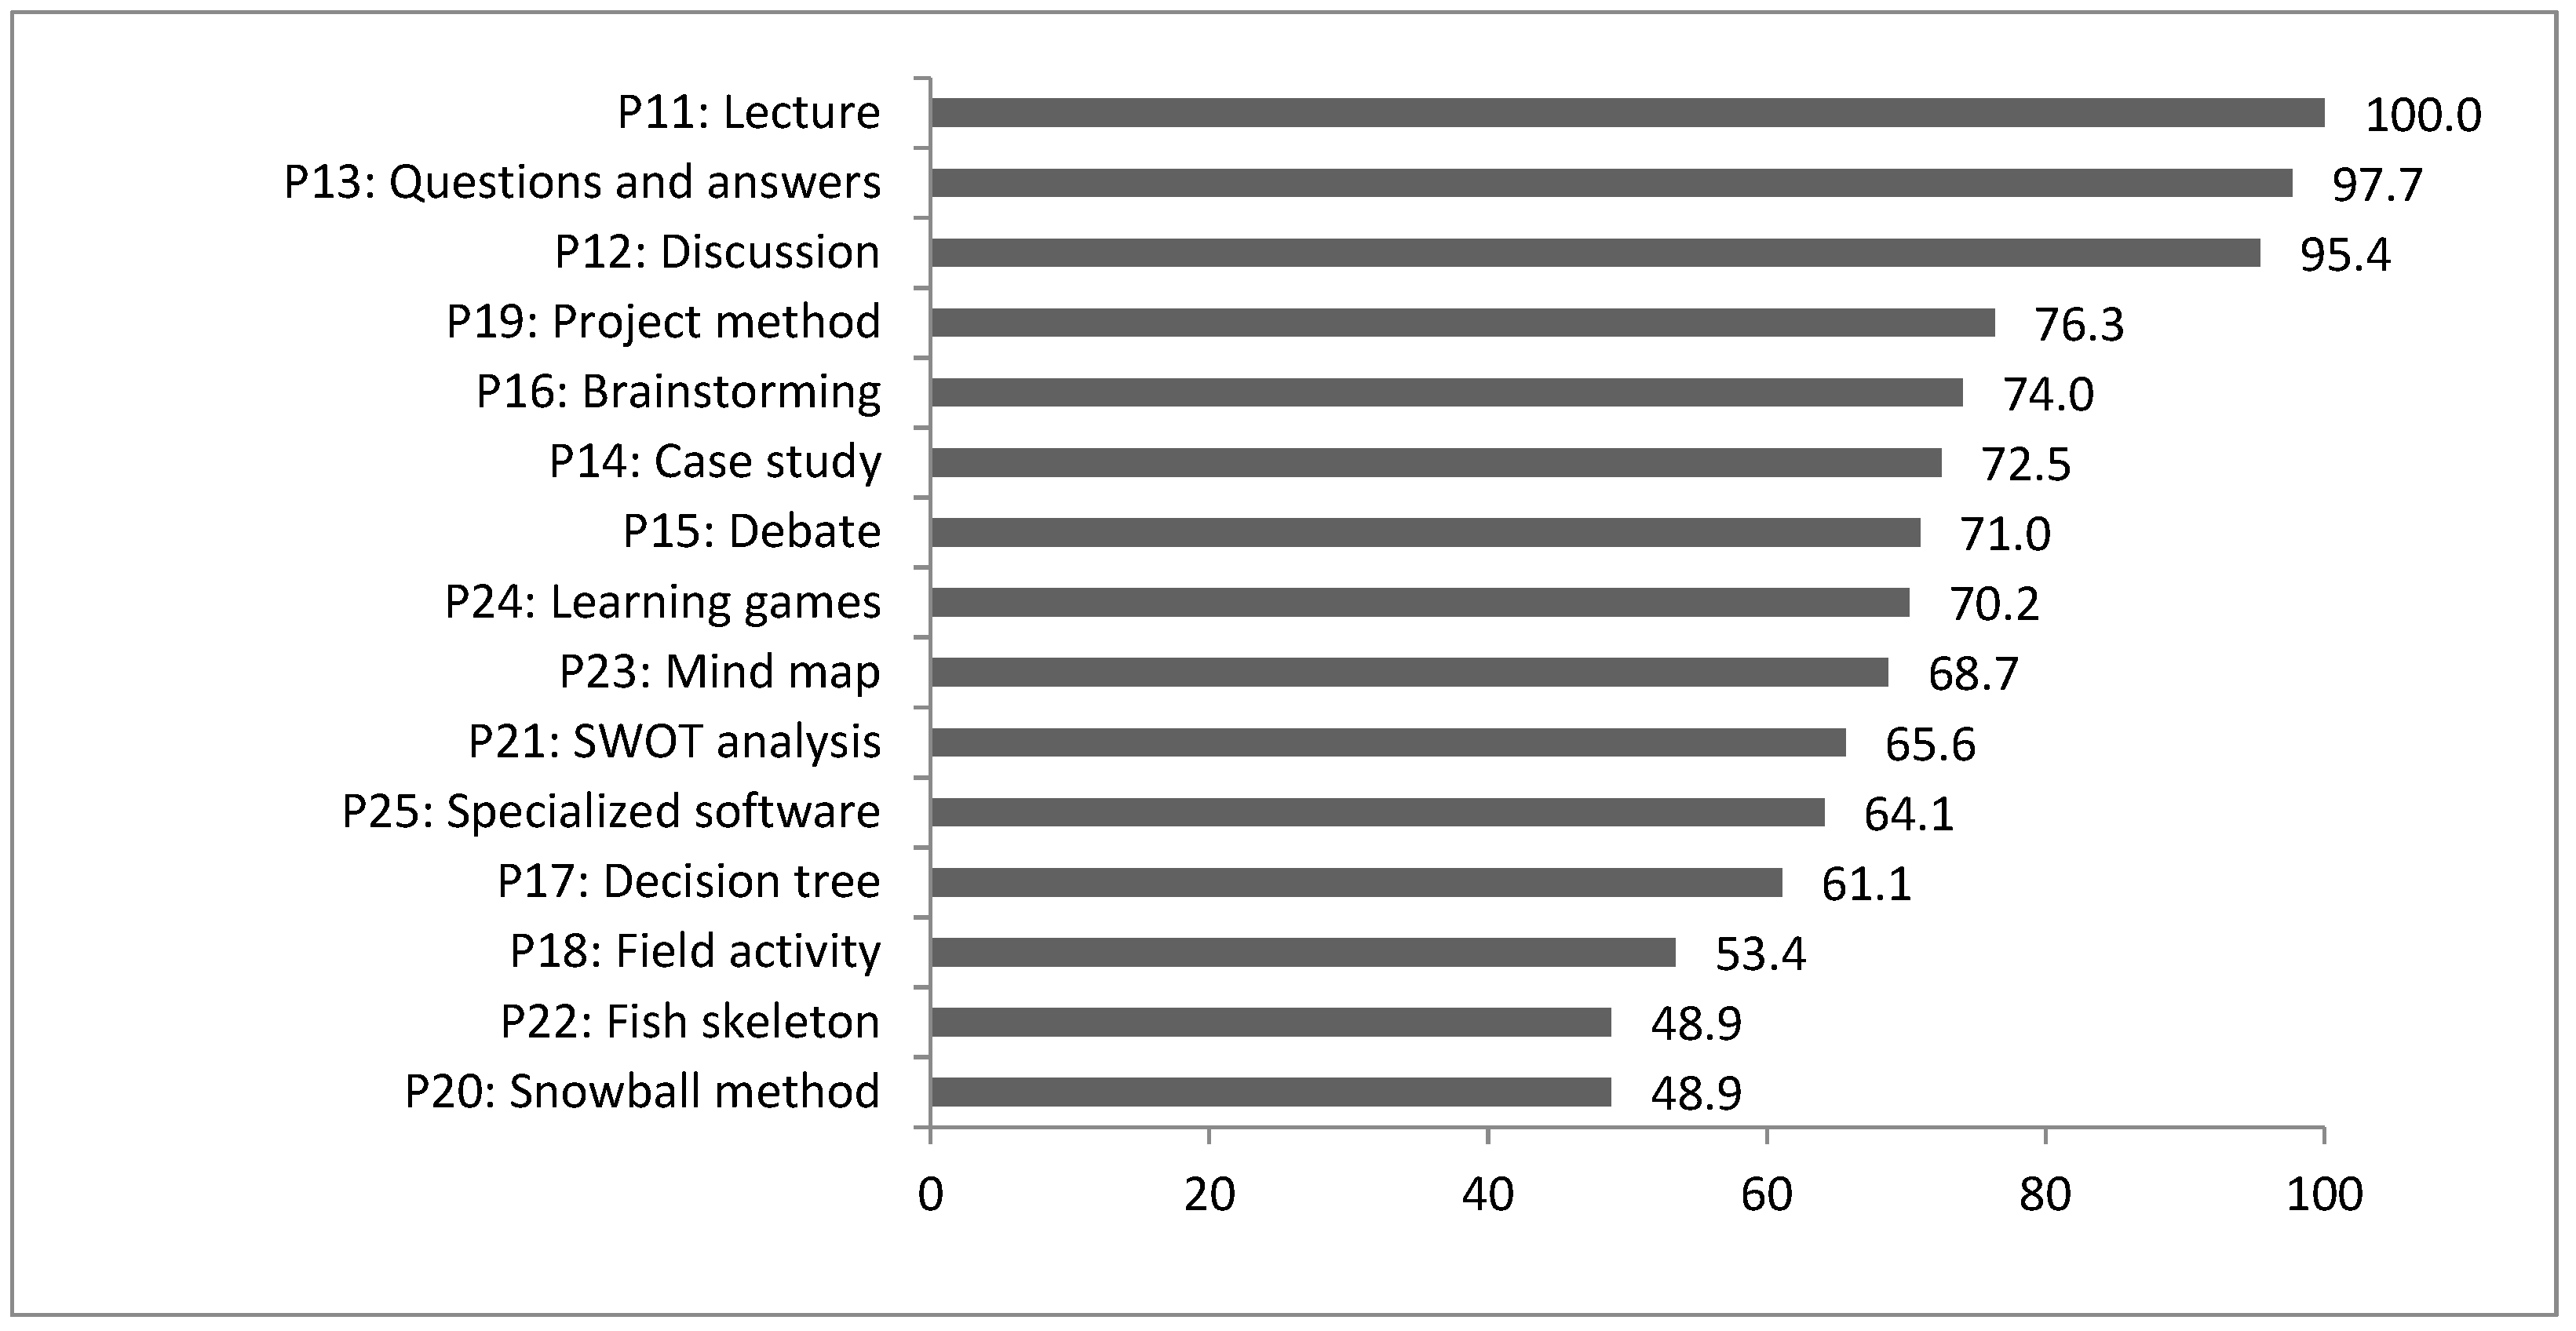
The results of the analysis allow us to build a ranking of selected teaching methods according to the popularity of the use of these methods by university teachers (Figure 2).
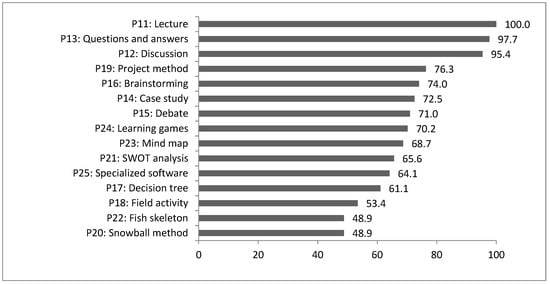
Figure 2.
Ranking of selected teaching methods by popularity of their use in teaching classes, %.
The most popular didactic method is the lecture, which refers to administering methods (100% of people indicated that they had experienced it); the second most popular method is “Questions and answers” (97.7%); and the third place was “Discussion” (95.4%)—these methods refer to active methods. Further, in fourth place, by a wide margin, was the “Project method” (76.3%), and in fifth place was “Brainstorming” (74.0%). It is worth noting that “Specialized software” (a method from the group of program methods) is in the second half of the ranking of selected methods (only 64.1% of people indicated that they had used this method). The least popular were the teaching activities conducted using the “Fish skeleton” and “Snowball” methods, with less than 50% of the people surveyed having had to use these methods (48.9% and 48.9%, respectively).
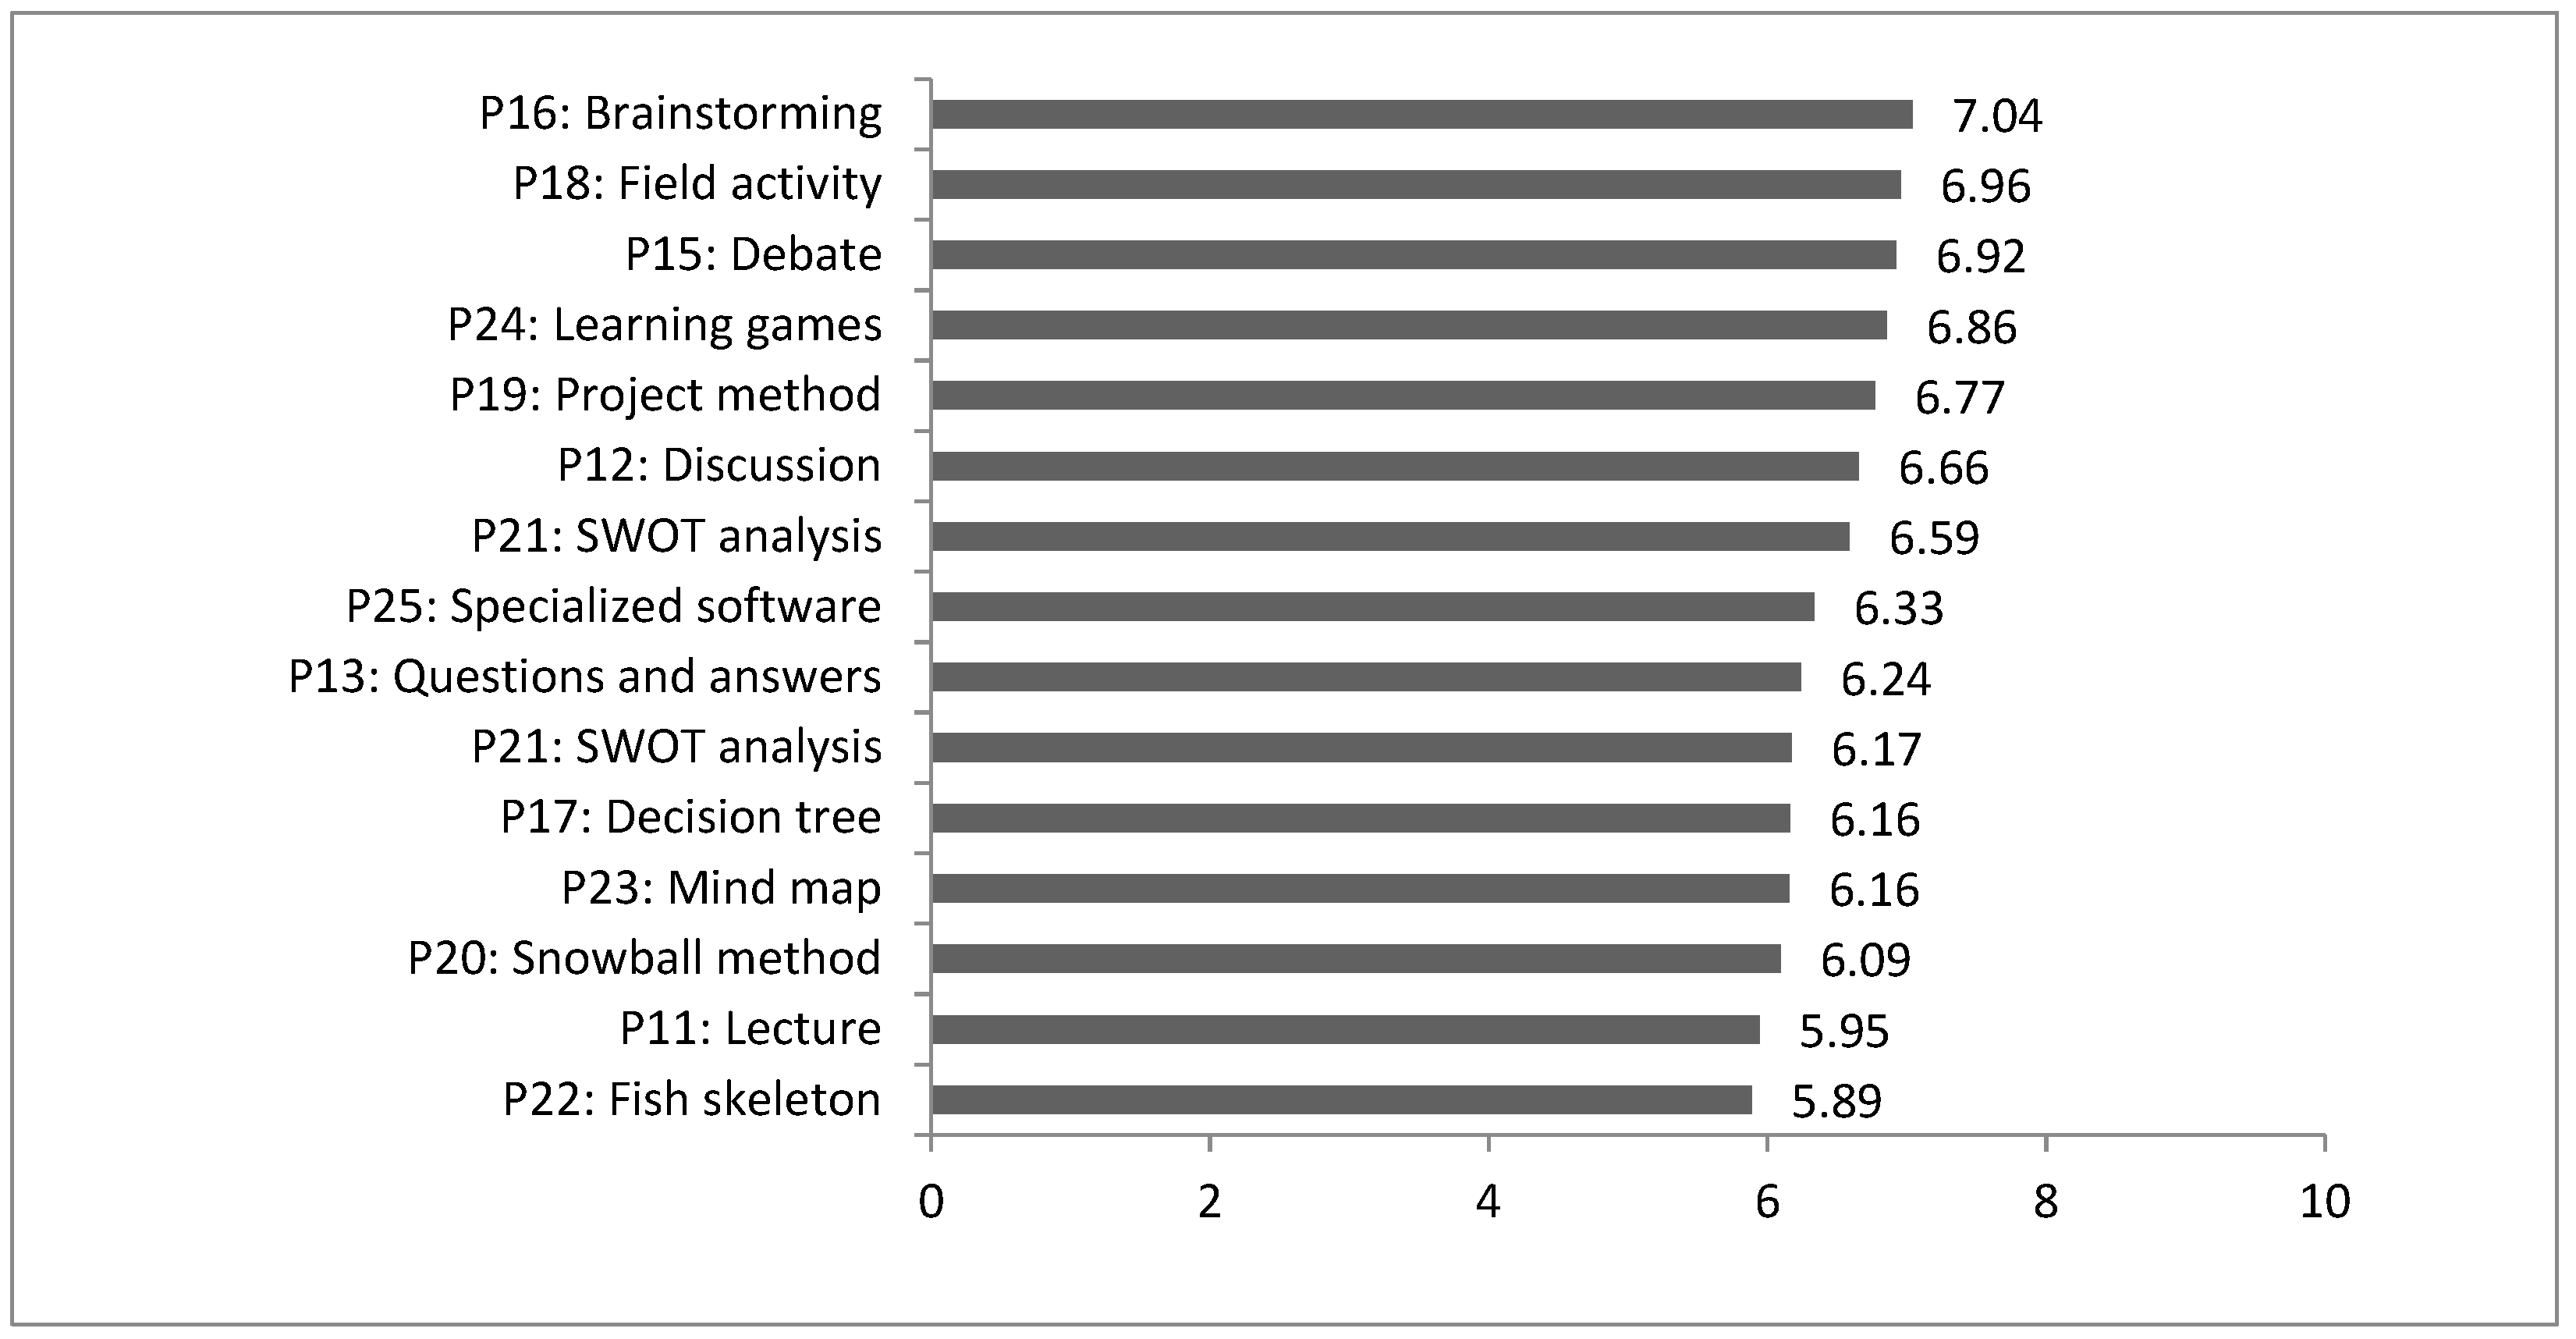
An analysis of the given ratings on the effectiveness of selected teaching methods (Figure 3) provides grounds to conclude that there are discrepancies between students’ ratings of the effectiveness of these methods and the popularity of particular methods among academics. The highest average rating was given to the following methods: “Brainstorming” (active learning)—7.04, “Field activities” (practical method)—6.96, “Debate” (active learning)—6.92, “Learning games” (active learning)—6.86, and “Project method” (active learning)—6.77. Such a teaching method as “Lecture” (instructional method) was located in the penultimate position with a rating of 5.95.
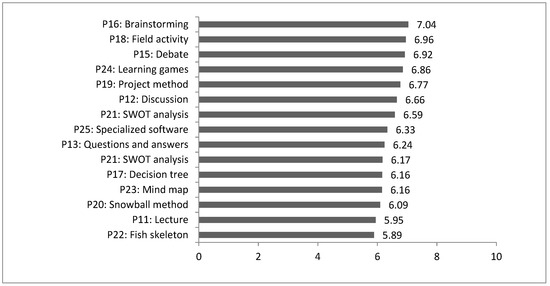
Figure 3.
Ranking of the effectiveness of selected teaching methods according to the average evaluation of students, assessment.
3.1.3. Analysis of Questions P26–31: Assessing Students’ Level of Preference for Forms of Innovative Teaching
Questions P26–31 were directed at understanding students’ preferences for forms of innovative learning such as: e-learning, blended learning, m-learning, mentoring, tutoring, and coaching. An analysis of the level of students’ preferences for forms of learning and correlation coefficients shows that there are forms in the evaluation of which students tend to agree, and there are forms of learning that can trigger discussion. Students were found to agree on forms of education such as e-learning, blended learning, mentoring, tutoring, and coaching. The level of students’ preference for a form of education like m-learning can be considered a debatable issue. The general descriptive statistics of the obtained answers to questions P26–31 on the level of students’ preference for selected forms of innovative learning are presented in Supplementary Material 3 (Table S5).
The ranking of the above innovative forms of education according to the number of points obtained is given in Figure 4. The results of the analysis show that the modern student prefers to combine traditional forms of education with innovative solutions; this is what determines blended learning as the most preferred form of education. The least preferred form of education is m-learning, where the student is left alone most of the time. Such results reveal that the modern student, despite the fact that they are eager to use internet technologies, needs live contact and cooperation with the academic teacher.

Figure 4.
Ranking of preferences for innovative forms of teaching according to students’ opinions, points.
3.1.4. Analysis of Questions P32–38: Evaluation of the Degree of Use and Effectiveness of Active Learning Methods
General descriptive statistics of the obtained answers to questions P32–38 on the degree of the use and effectiveness of active teaching methods are presented in Supplementary Material 3 (Table S6).
In response to question P32, concerning the degree of the use of active learning methods during the organization of the educational process, 50% of the surveyed students indicated that lecturers in teaching classes use active learning methods to a high and very high degree (44% of students—graded 7–8 and 6% of students—graded 9–10); 12% of students considered that such methods were used to a low and very low degree (10% of students—graded 3–4, 2% of students—graded 1–2); and 38% of students indicated a medium degree of the use of such methods (Figure 5). In other words, 50% of students felt that the degree of the use of active learning methods must be higher.

Figure 5.
Degree of use of active learning methods in the educational process (on the left, the frequency of awarding each grade; on the right, the percentage distribution of students’ opinions).
In response to question P33, regarding the impact of active learning methods on raising the levels of skills, knowledge, and competence, 77% of the surveyed students presented high scores (47% of students—scores 7–8 and 30% of students—scores 9–10), 20% of students presented medium scores (5–6), and only 3% of all surveyed students marked “low impact” for these methods (marks 3–4) (Figure 6). In conclusion, it can be said that from the students’ point of view, the use of active learning methods has a great impact on improving the effectiveness of the educational process.

Figure 6.
Degree of influence of the use of active learning methods on raising the levels of skills, knowledge, and competencies (on the left, the frequency of awarding each rating; on the right, the percentage distribution of students’ opinions).
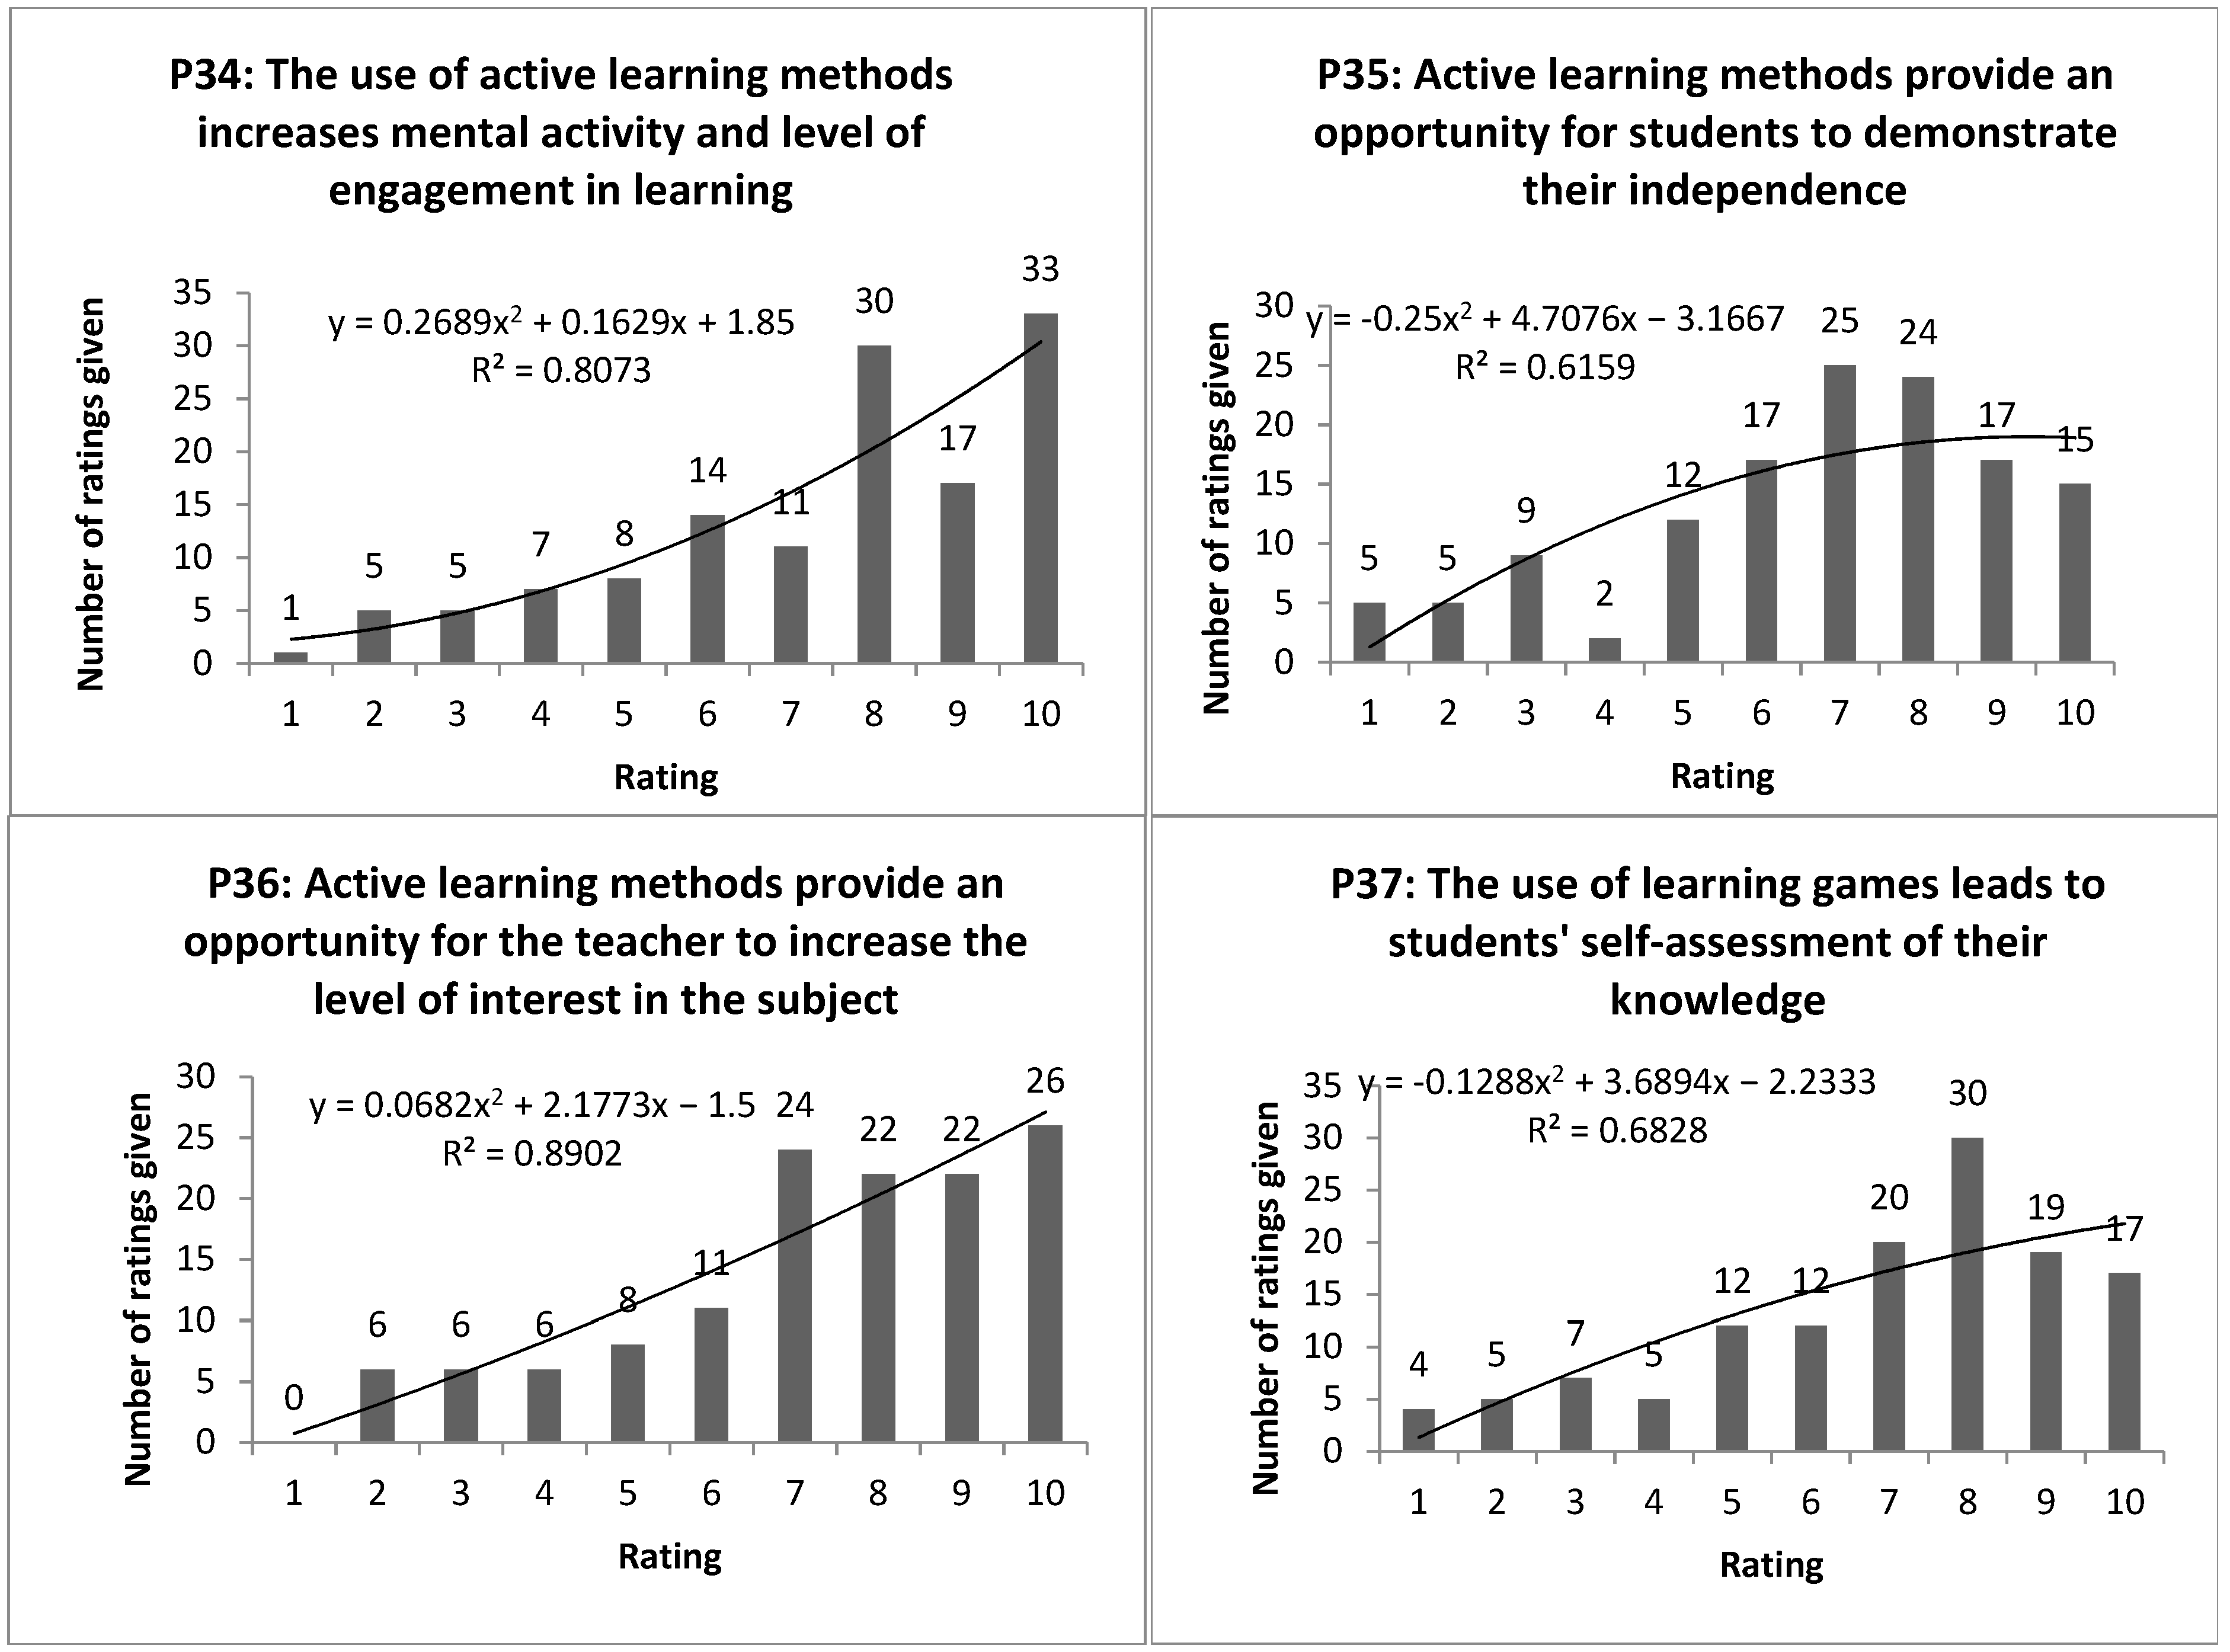
Additional confirmation of the positive impact of active learning methods on the effectiveness of the learning process is provided by students’ opinions on the statements placed in questions P34–37. In order to estimate the trend among students on the “for” and “against” validity of individual statements, a polynomial trend line, regression equation, and coefficient of determination were placed on the graphs. An analysis of these graphs shows that, according to students, active learning methods provide them with a sense of opportunity to demonstrate self-reliance and to self-assess their knowledge (P35 and P37—75% of students presented a score of 6 and above), increase their interest in the subject, and engage them in learning (P34 and P36—80% of students presented a score of 6 and above). It is noteworthy that the use of active learning methods provides the teacher with a chance to maximize the transfer of information/knowledge to the majority of students in the academic group (80 students out of 131 provided a rating of 8 and above on statement P34 and 70 students on statement P36; 25% and 20% of all surveyed students presented a rating of 10 on issues P34 and P36, respectively). The calculated coefficients of determination for issues P34 and P36 (R2 = 0.8073 and R2 = 0.8902) also confirm the existence of a high correlation between the use of active learning methods in the educational process and mental activity and the level of student involvement in learning (Figure 7).
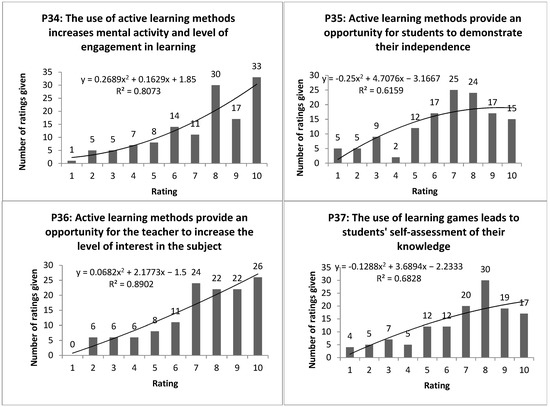
Figure 7.
Degree of correctness of the formulated statements P34–P37 according to students’ opinions, the number of occurrences of each rating.
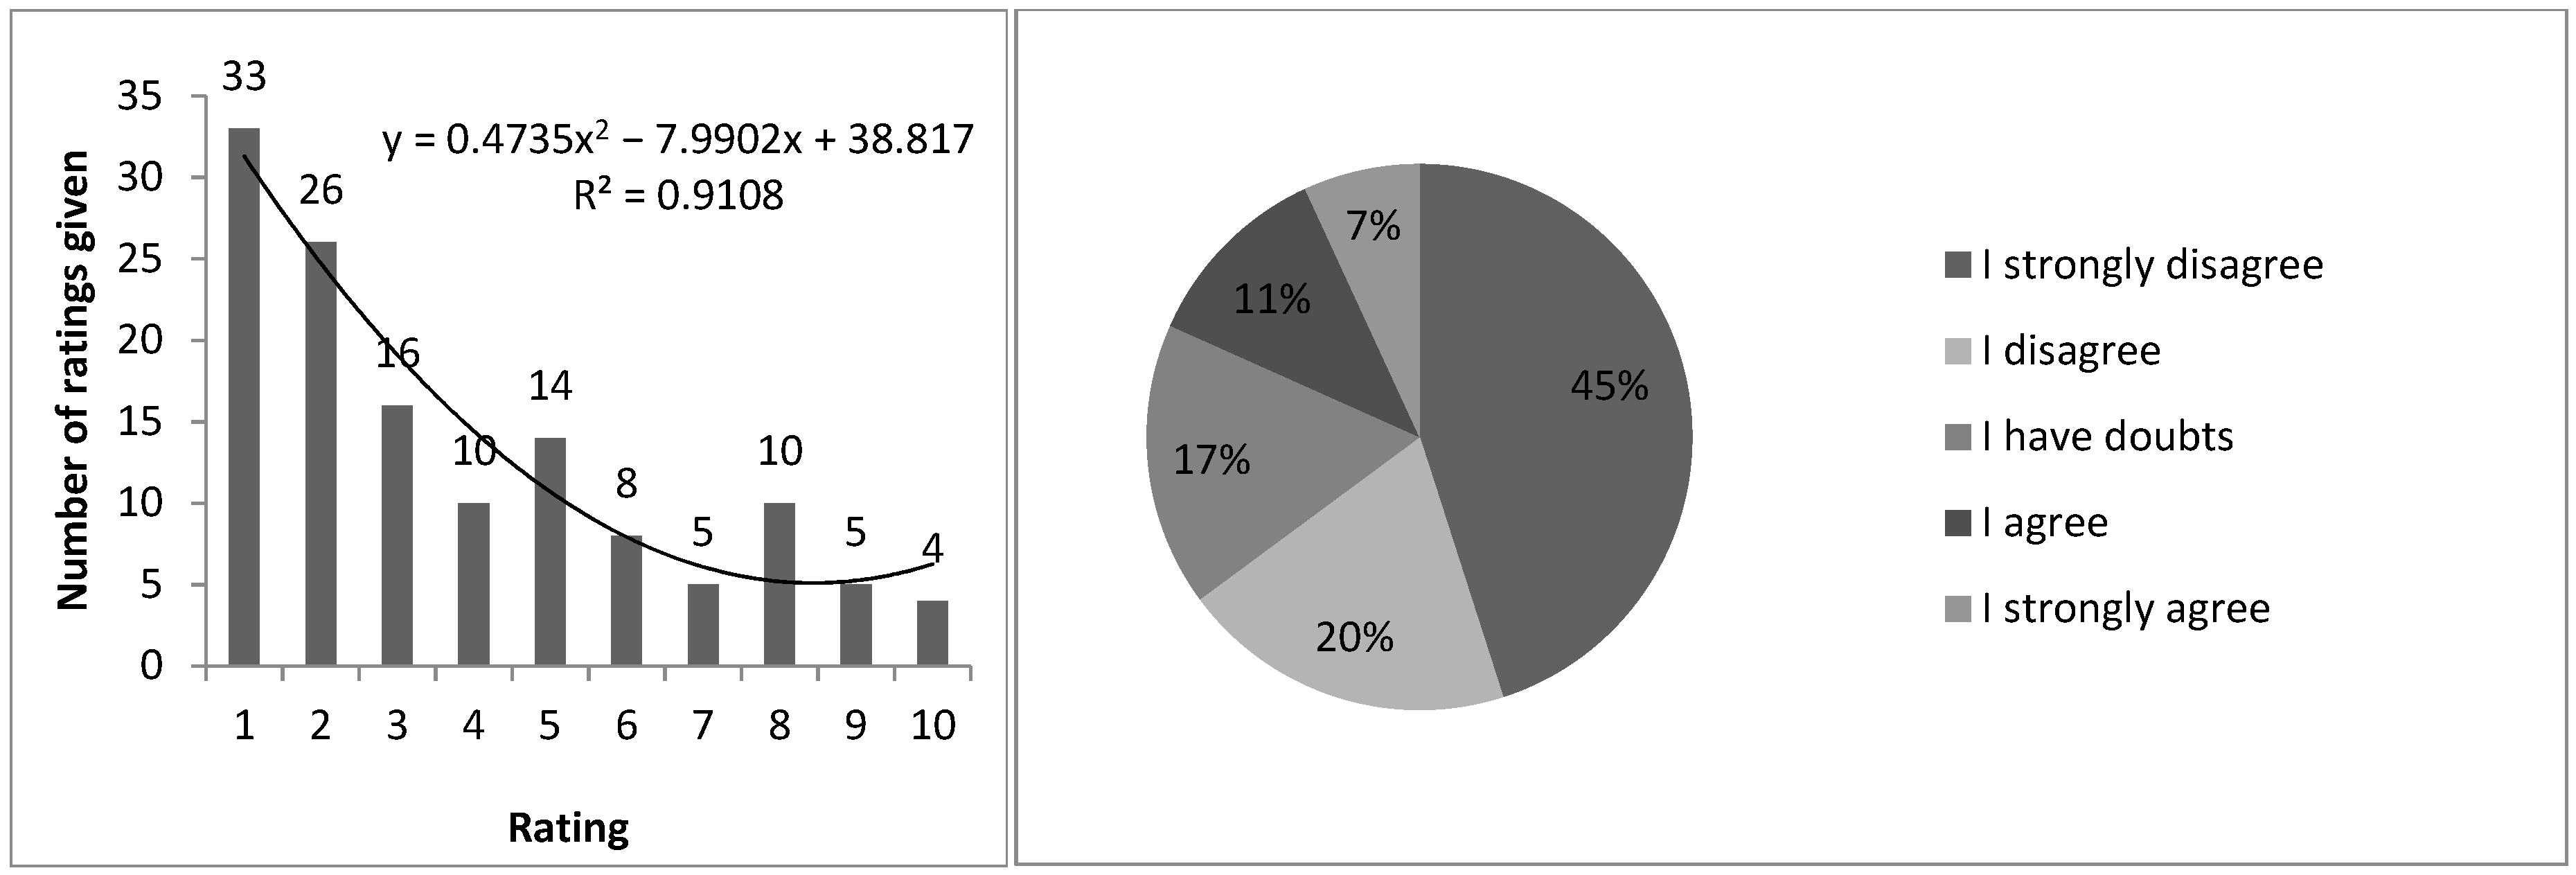
The results of question P38 are also interesting, where students were asked to indicate whether they agreed or disagreed with the statement “a learning game does not have much effectiveness due to the fact that it is fun entertainment and has no direct connection with solving tasks in real life” on a scale from 1 to 10 (results given in Figure 8).
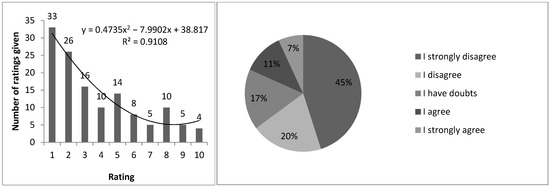
Figure 8.
Results of responses to question P38: “The learning game does not have much effectiveness due to the fact that it is fun entertainment and has no direct connection with solving tasks in real life”.
The data shown in Figure 8 prove that 18% of all surveyed students agree with the statement that a learning game is merely for enjoyment with no connection to real life. These results correlate with students’ answers to questions P34 and P36, where 26 students (that is, 20% of all surveyed students) presented ratings from 1 to 5. In other words, the vast majority of students—80%—believe that active learning methods are able to increase the degree of curiosity about the subject, the level of student involvement in learning, and their mental activity, which means that they are suitable for developing the critical thinking skills of the modern student.
3.1.5. Analysis of Questions P39–49: Assessment of Factors That Demotivate a Student to Study
General descriptive statistics of the obtained answers to questions P39–49 are shown in Supplementary Material 3 (Table S7).
Student motivation for learning is one of the key factors in the efficiency and effectiveness of the educational process [56]. Questions P39–49 of the questionnaire are used to assess the degree of the influence of factors demotivating the student to study. The following were distinguished in the quality of such factors: P39: a lack of the ability to make contact; P40: a lack of self-motivation to act; P41: a lack of motivation on the part of the academic teacher; P42: a lack of vision for future opportunities; P43: a lack of contact with reality; P44: a lack of demand for knowledge; P45: a lack of authority from the academic teacher; P46: easy access to the knowledge base through the internet; P47: self-employment through social media; P48: a lack of adequate remuneration in the labor market; and P49: the negative influence of social media.
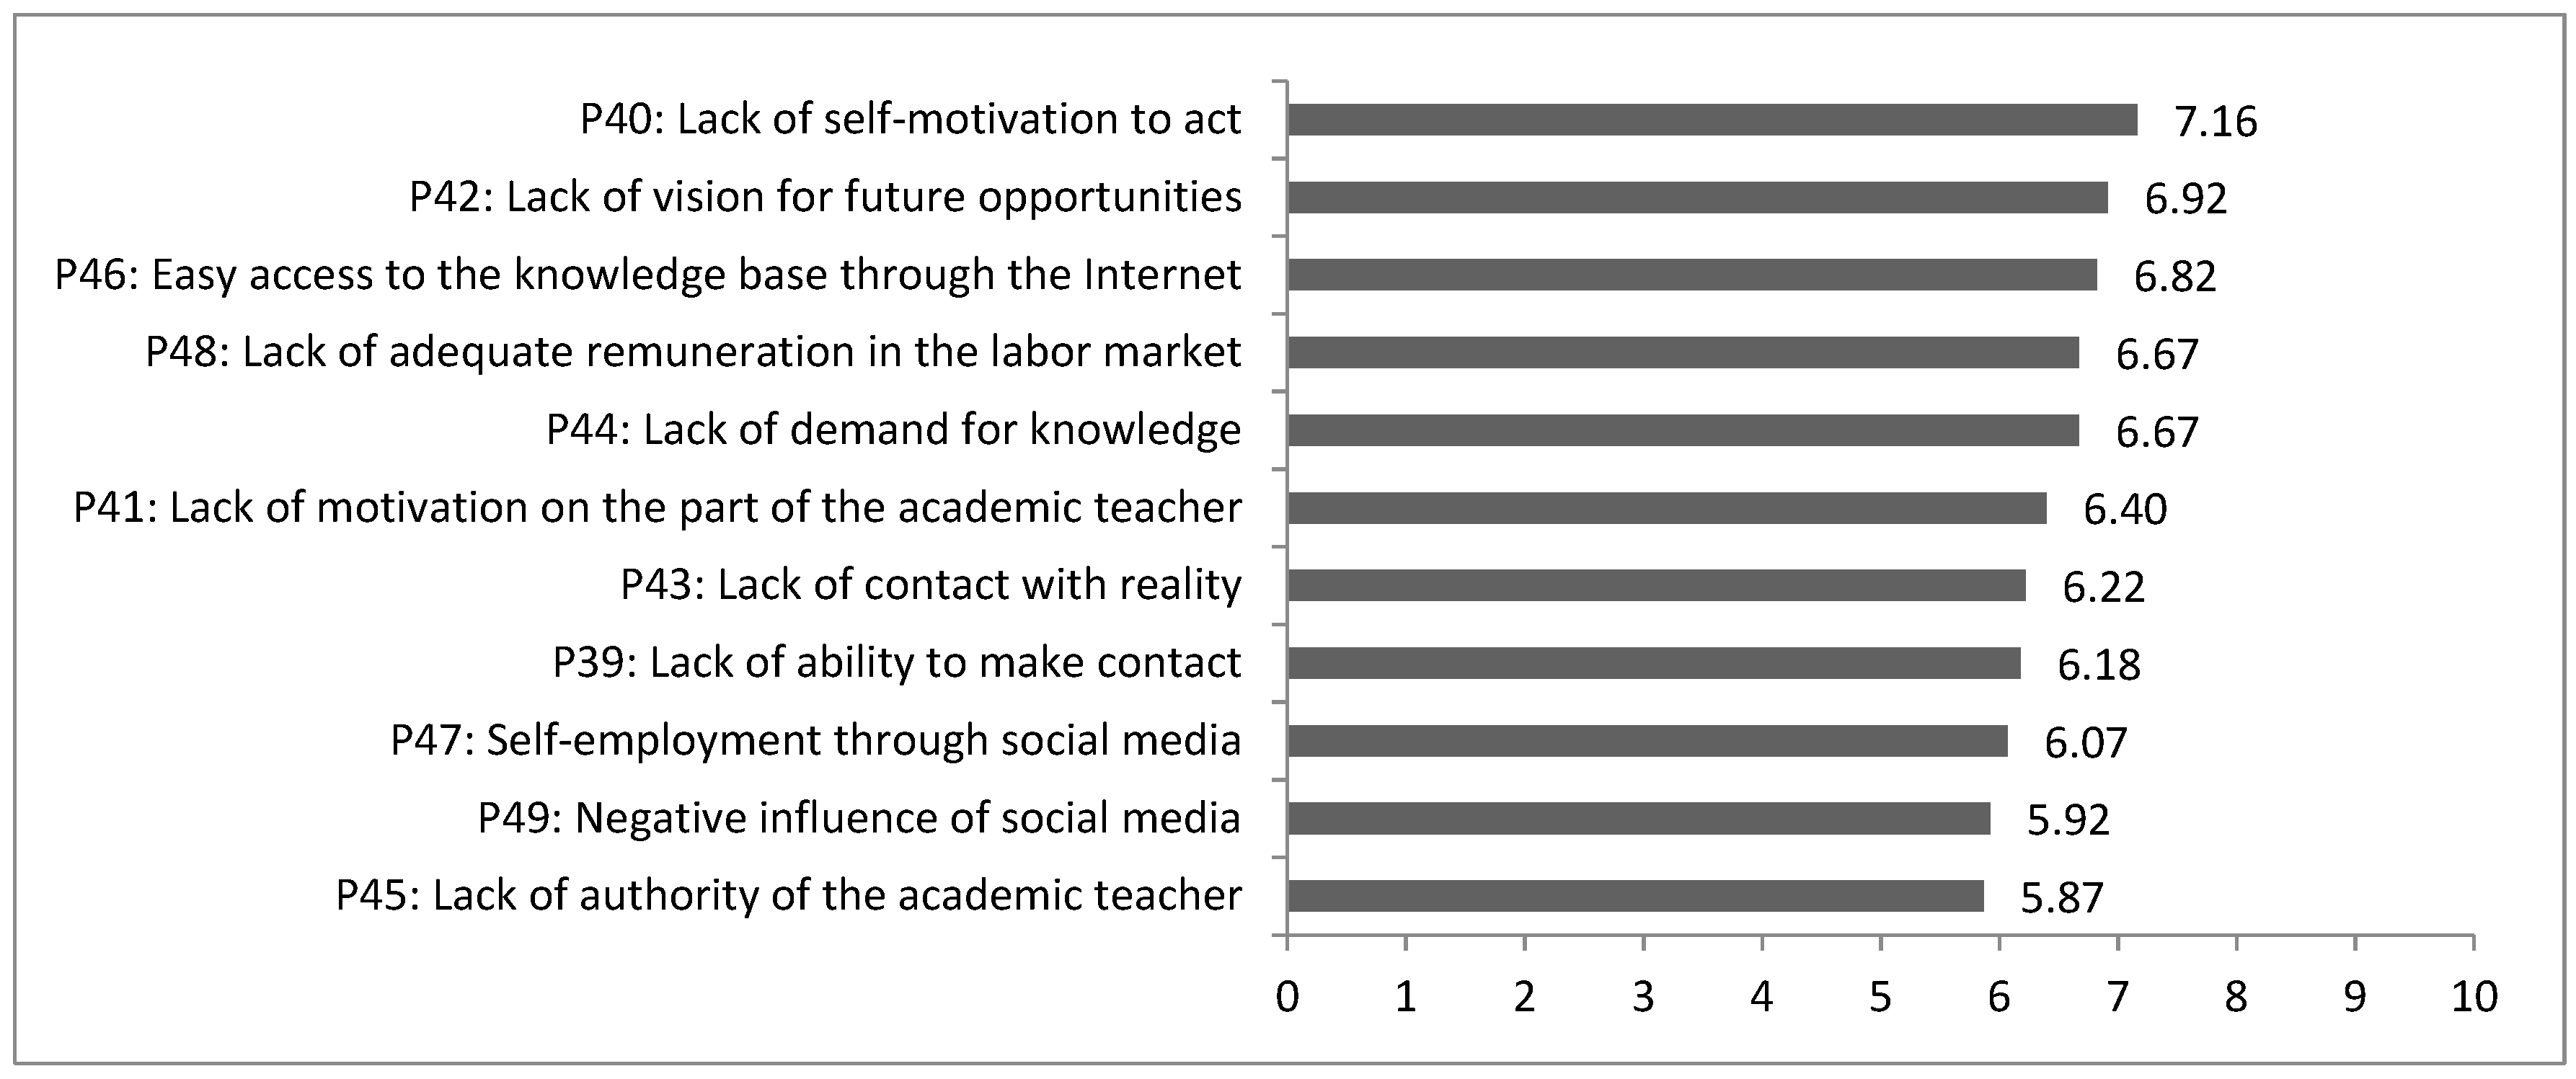
Based on the average rating given by the students, a ranking of selected factors that have a negative impact on the student’s motivation to study was developed (Figure 9).
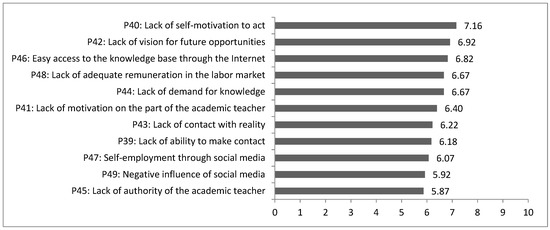
Figure 9.
Ranking of selected factors, demotivating a student to learn.
According to the opinion of the students, all the factors listed have a great degree of negative impact on the student’s motivation to learn (the average ratings placed are in the range from 5.87 to 7.16). The most demotivating factor to study is “a lack of self-motivation to act” (the average rating for this factor was 7.16). Second in this ranking is “a lack of vision for future opportunities” (rating of 6.92), and third is an “easy access to the knowledge base via the internet” (rating of 6.82). The last place in this ranking is “a lack of academic authority” (average score of 5.87). Such results provide grounds to conclude that, in general, modern students lack motivation to study. To understand to what extent the selected factors affect the student’s lack of self-motivation to act, a correlation analysis was conducted between the selected factors (correlation values given in Supplementary Material 4, Table S8).
The analysis of correlation coefficients provides us with the opportunity to draw the following conclusions.
First, the relationship between all analyzed indicators is statistically significant (p = 0.002).
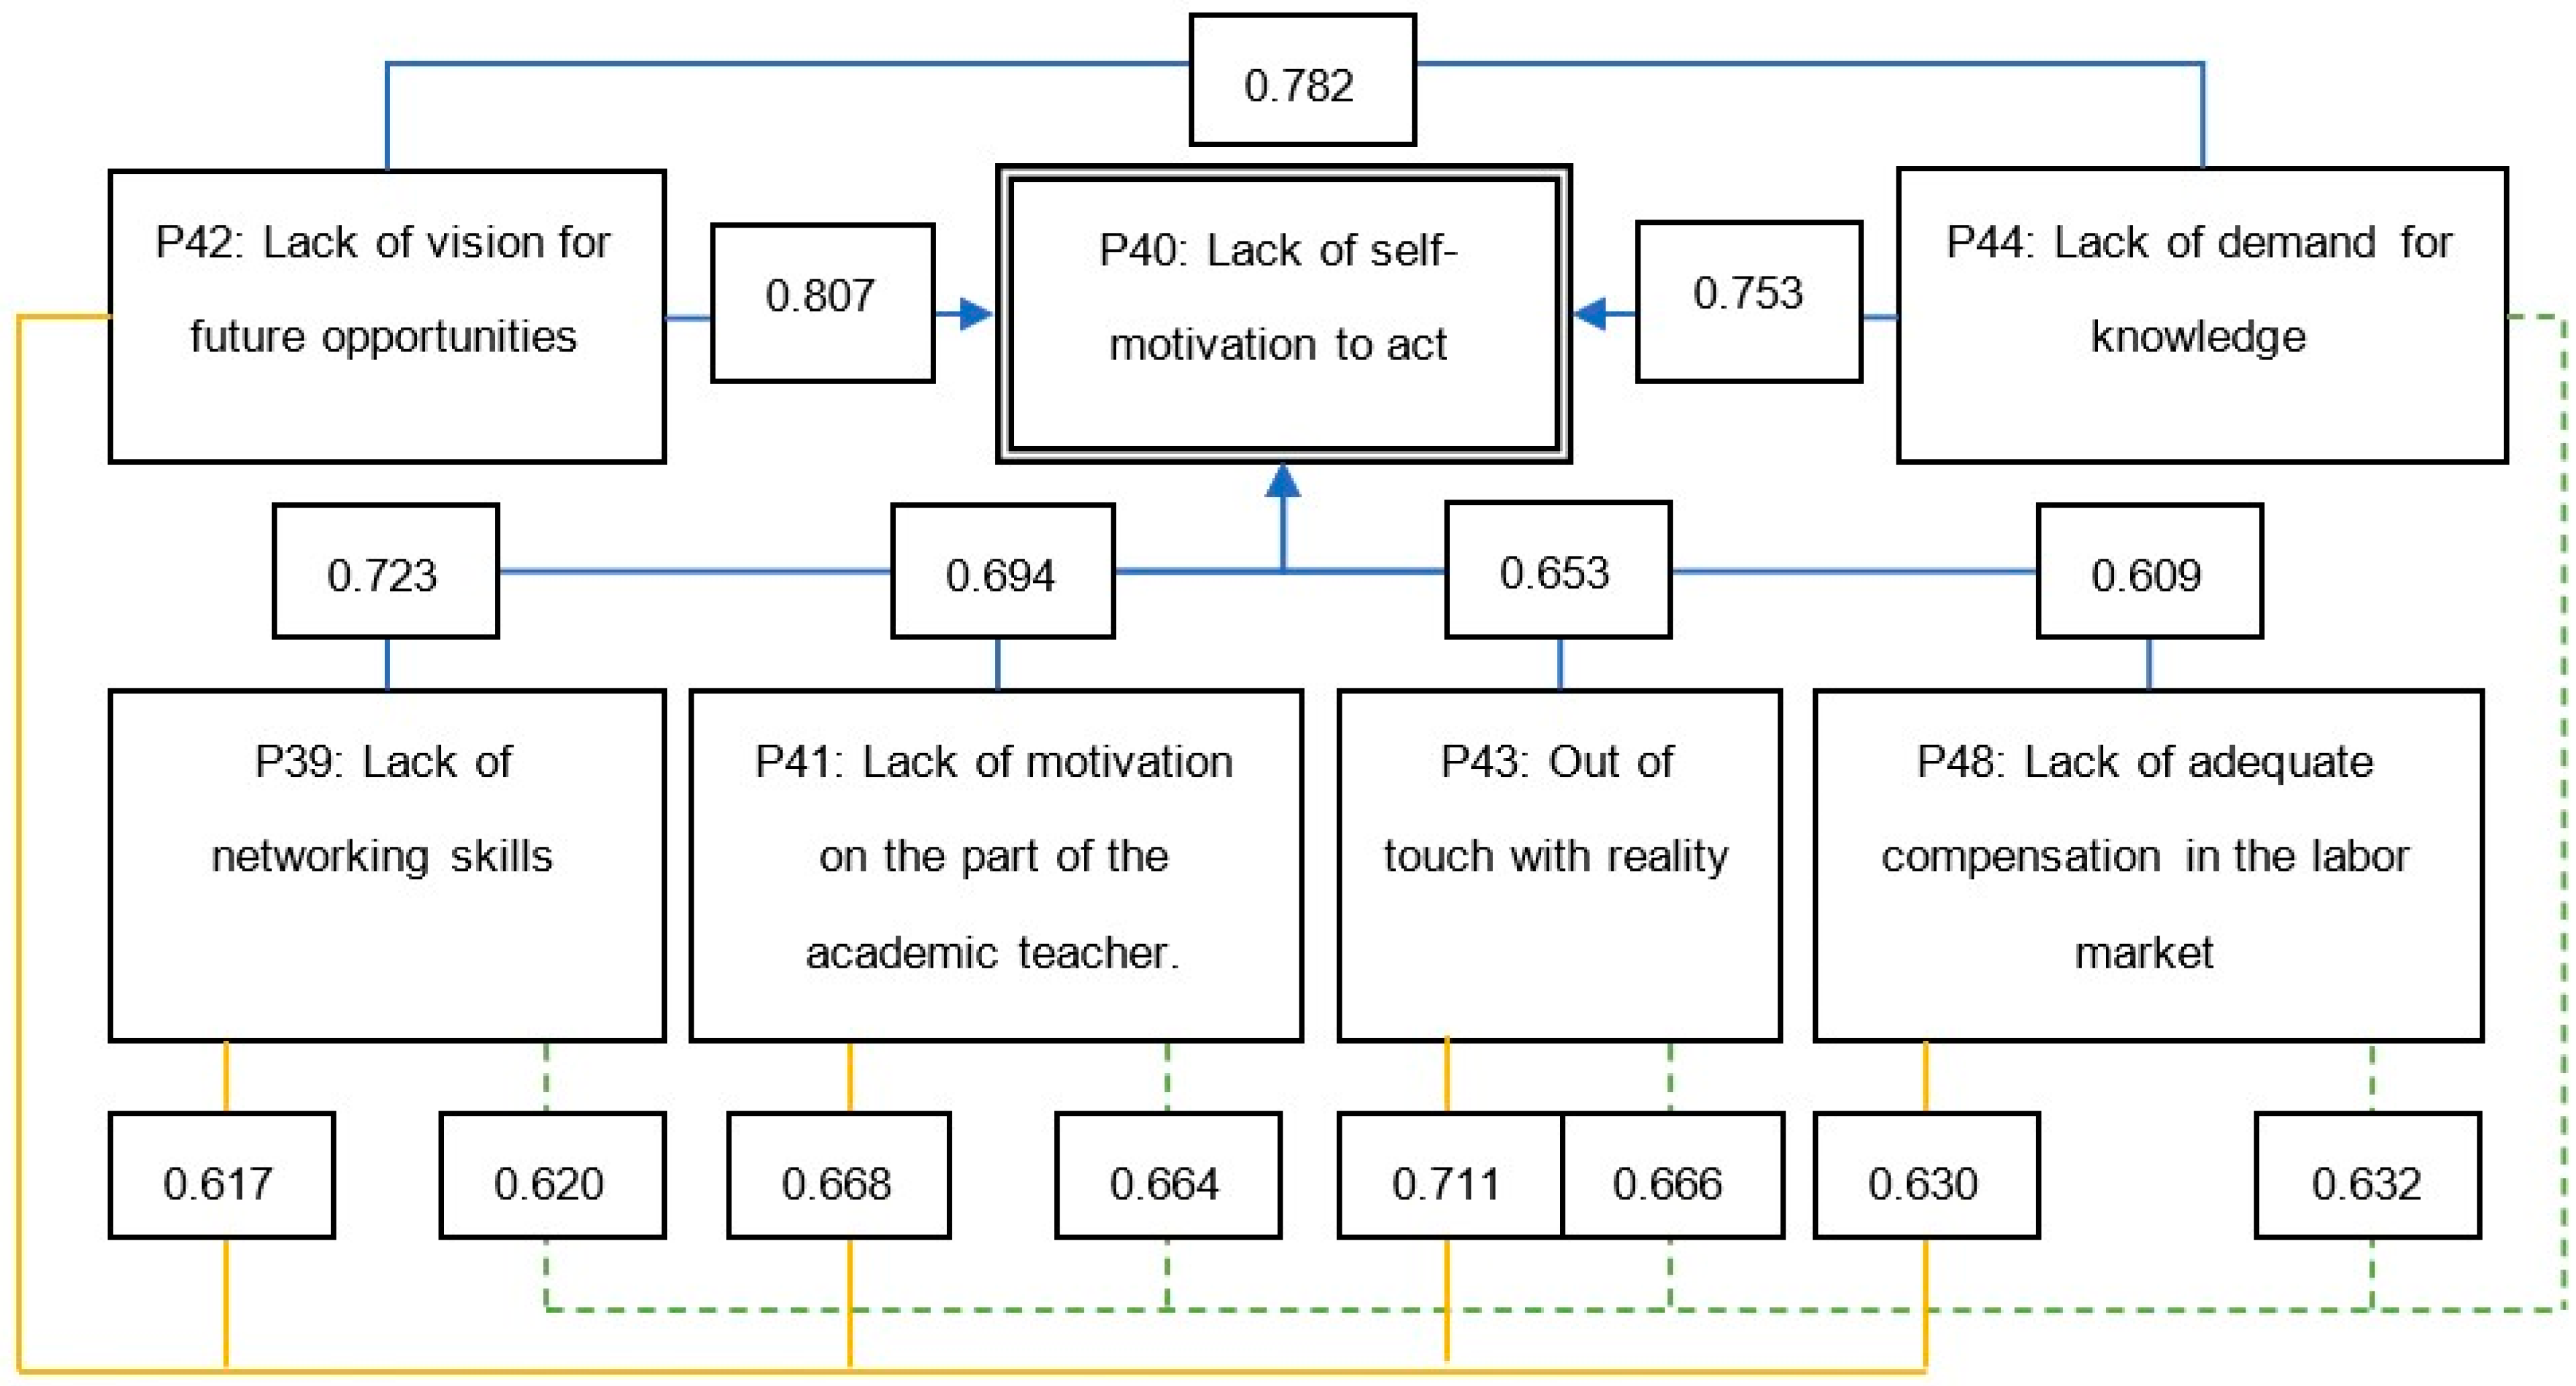
Second, the factors with the highest level of correlation with P40 “a lack of self-motivation to act” can be referred to: P42 “a lack of vision for future opportunities” (correlation coefficient is 0.807) and P44 “a lack of demand for knowledge” (0.753). On the other hand, P44 “a lack of demand for knowledge” has the highest level of correlation with factor P42 “a lack of vision for future opportunities” (0.782). That is, an academic teacher has to manage a student who is frustrated by the lack of correlation between the level of knowledge and future opportunities for personal development (career building). Working with such a student requires the academic teacher to be more involved in the educational process and to select teaching methods with integrity.
Third, according to the opinion of students, another factor with a significant impact on P40 “a lack of self-motivation to act” is P39 “a lack of ability to make contact” (correlation coefficient 0.723). This factor, in turn, has a high level of correlation with the factors P44 “a lack of demand for knowledge” (0.620) and P42 “a lack of vision for future opportunities” (0.617). In other words, the lack of contact skills has a direct impact on the level of a student’s own motivation to learn, while these skills are interdependent with the demand for knowledge and vision for future opportunities.
Fourth, there is a high correlation between the P40 factor “a lack of self-motivation to act” and the P41 factor “a lack of motivation on the part of the academic teacher” (correlation coefficient 0.694), and this means that the level of involvement of the academic teacher and those teaching methods, which they will use, have a strong impact on the level of student motivation to learn. The factor “a lack of motivation on the part of the academic teacher” is heavily influenced by the factors P42 “a lack of vision for future opportunities” (0.668) and P44 “a lack of demand for knowledge” (0.644).
Fifth, P40 “a lack of self-motivation to act” is significantly influenced by factor P43 “a lack of contact with reality” (correlation coefficient 0.653) and factor P48 “a lack of adequate compensation in the labor market” (0.609). The latter two factors, in turn, are closely related to factors P42 “a lack of vision for future opportunities” (correlation coefficients of 0.711 and 0.630, respectively) and P44 “a lack of demand for knowledge” (0.666 and 0.632), and again the circle closes on factors P42 and P44.
Such an act of correlation analysis allows us to develop a model of the relationship between the factors, demotivating the modern student to study (Figure 10).
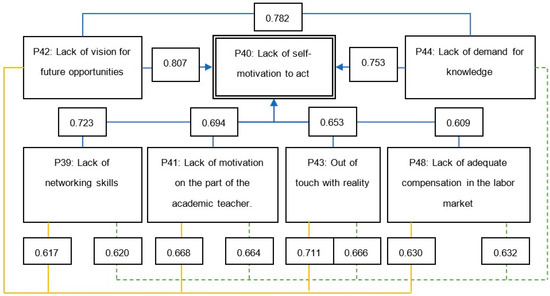
Figure 10.
Model of the relationship between factors, demotivating the modern student to learn.
The developed model shows that motivating the student to learn, forming in him or her a vision for future opportunities (that is, a vision of the prospects for personal development and his or her place in the labor market) is the most important task of the academic teacher in the educational process. This approach to the student increases the demand for the development of a model for the selection of teaching methods tailored to the personality of modern students and their behavior styles.
3.2. Analysis of Questions P50–88: Distinguishing Behavior Styles of Modern Students and Selection of Teaching Methods
This part of the study was devoted to an attempt to isolate the different behavior styles of modern students in order to adapt the way of education to a specific occupational group and to determine the teaching methods preferred in this group. It is worth noting that in the occupational group, there will always be representatives of all behavior styles, while the leading task of the academic teacher is to extract the share of each style.
3.2.1. Analysis of Questions on Students’ Behavior Styles by the Level of Trust in the Higher Education System (S1)
This group of questions aimed to divide the student group according to the level of confidence in the higher education system, in the methods of education, and in the methods of assessment and verification of knowledge, selected by the academician. According to the level of confidence, it was possible to distinguish four subgroups of students, namely: S1.1., students with a very low level of confidence; S1.2., students with a low level of confidence; S1.3., students with a medium level of confidence; and S1.4., students with a high level of confidence.
The division of students according to the S1.1–S1.4 levels of trust was carried out on the basis of the number of calculated scores from the pool of questions assigned in (Supplementary Material 2, Table S2) to students’ behavior styles from the S1 category. The total number of assigned questions from this pool is 14. The maximum number of points possible per question is 10, and the maximum number of points for the entire pool of questions is 140. For the purpose of implementing this study, it was assumed that:
- The student has a very low level of confidence in the higher education system, in the evaluation system used by the university teacher, and in the selected teaching methods if he/she assigns less than 50% of the points;
- The student has a low level of confidence if the sum of the assigned points is between 50% and 65%;
- The student has a medium level of confidence if the sum of the assigned points is between 65% and 75%;
- If the sum of assigned points is more than 75%, it can be considered that such a student’s level of confidence in the higher education system is high.
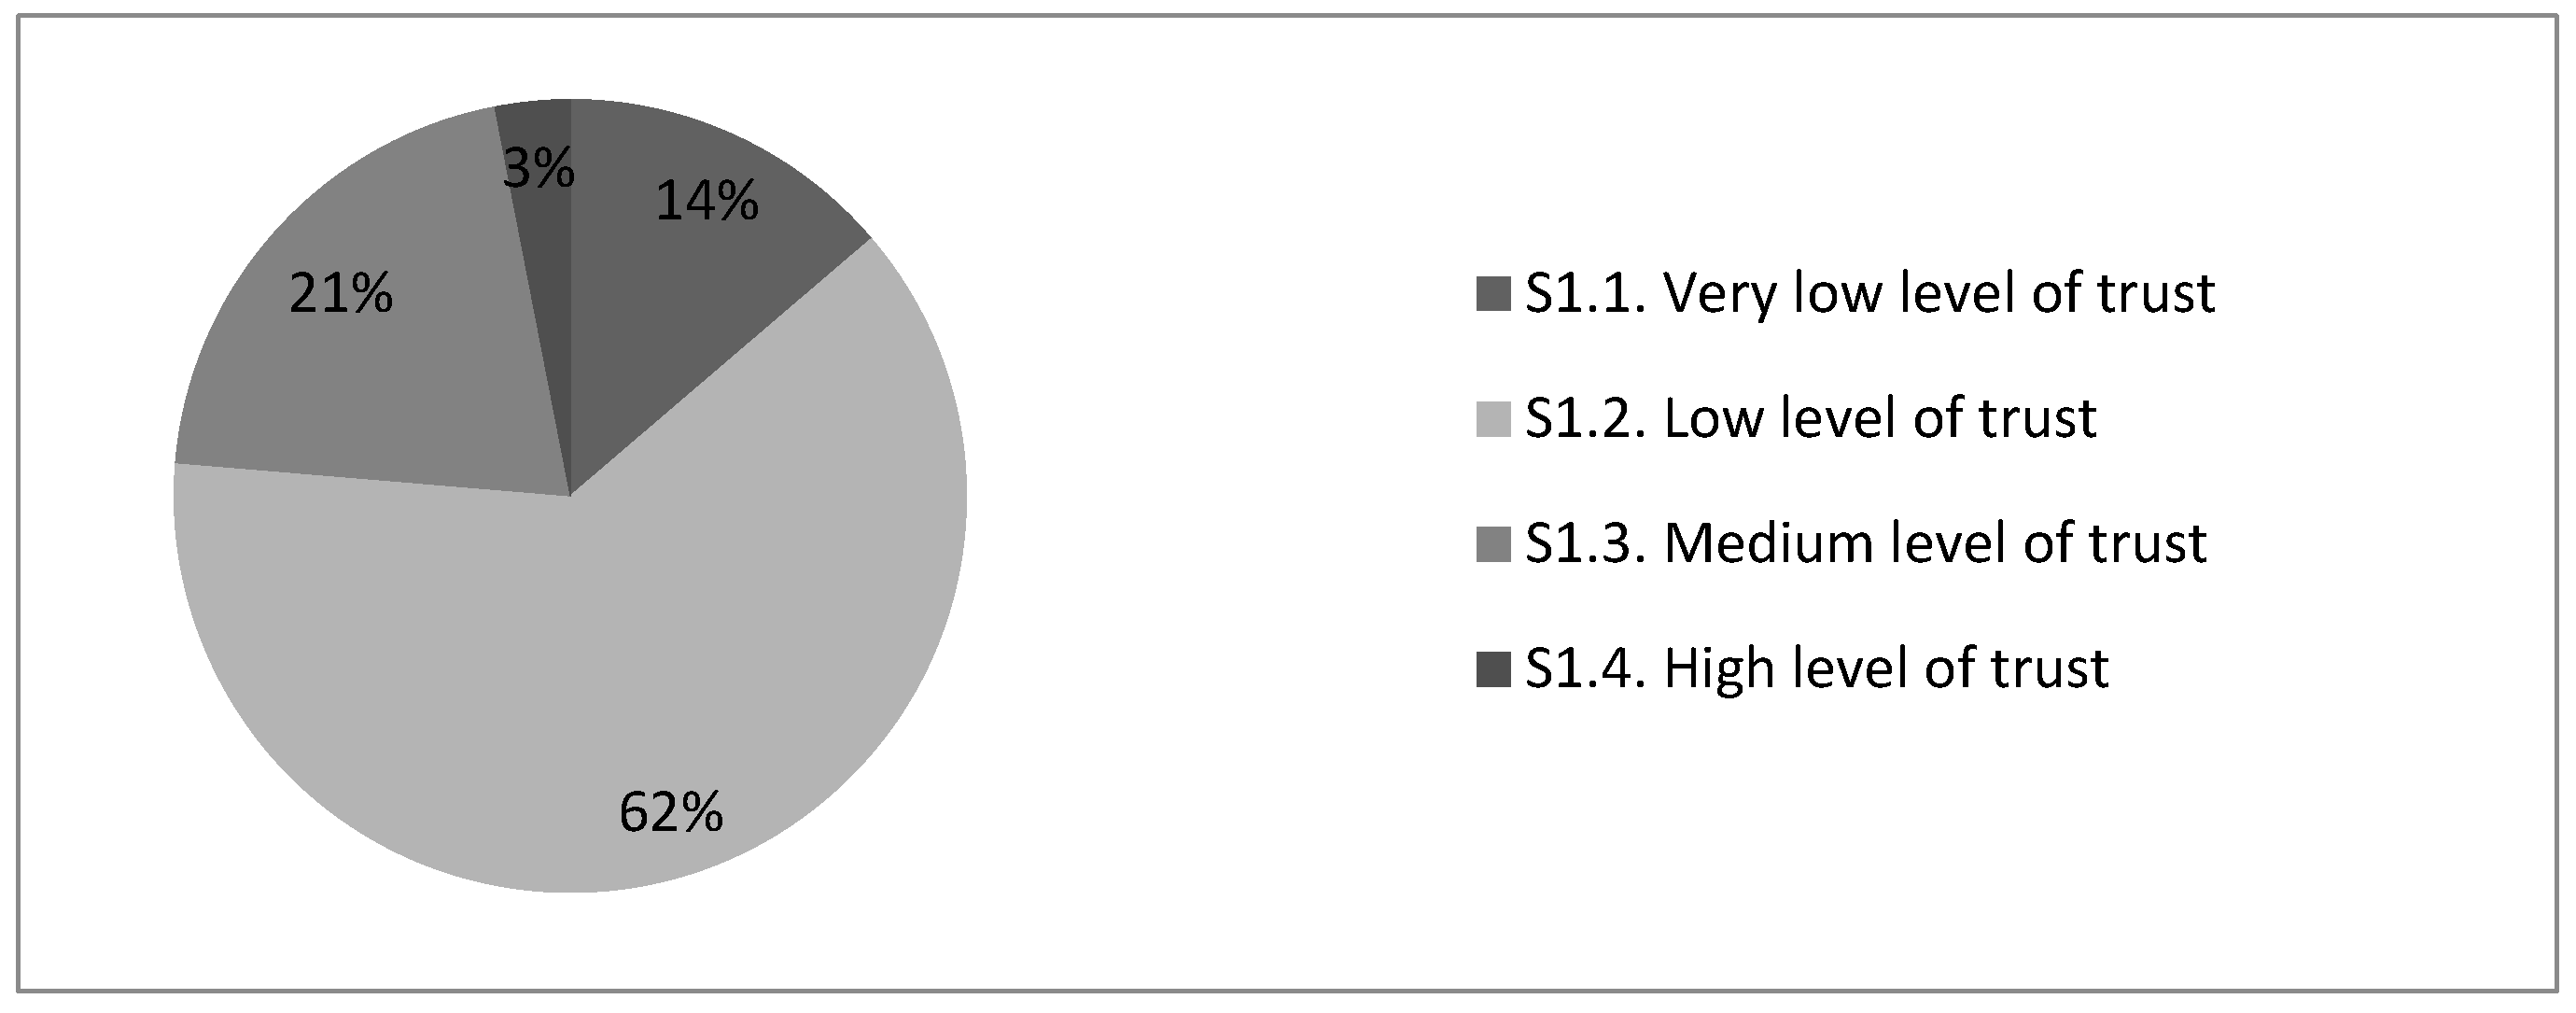
According to the analysis of the points awarded, the people participating in the survey can be divided into four groups based on the level of trust in the following proportions (Figure 11).
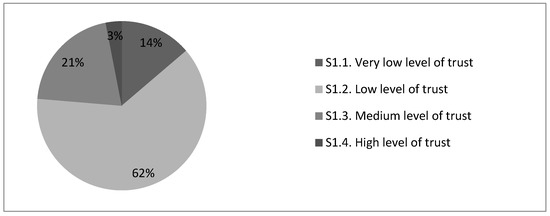
Figure 11.
Structure of surveyed students by level of trust in the higher education system, %.
According to the calculations, only 3% of students have a high level of trust in the higher education system and in the methods used by the university teacher, whereas 21% have a medium level of trust. The largest group of students accounting for 62% of all surveyed students have a low level of trust, while the remaining 14% have a very low level of trust in the higher education system. These are quite worrisome values, which require actions on the part of the academic staff to raise the level of students’ trust in the higher education system. One direction of such measures is the appropriate selection of teaching methods.
The average ratings of the analyzed teaching methods according to the level of students’ trust in the higher education system are shown in Supplementary Material 5 (Table S9). The results of the analysis provide a basis for the conclusion that students who have a very low or low level of trust in the higher education system, including the academic teacher, are rather inclined to such teaching methods as “Learning Games”, “Field Activities”, and “Brainstorming”. It is worth noting that such students also tend to be discouraged from developing tasks based on the “SWOT analysis” and “Decision tree” methods. Students with a high level of confidence in the educational system are the only ones who highly rate the use of the methods “Specialized software” and “Snowball”, with “Discussion” in second place, followed by “Learning games” and “Field activities” in last place. The following trends were noted: the higher the level of confidence, the more the students are willing to participate in the discussion.
3.2.2. Analysis of Questions on Students’ Behavior Styles by the Propensity of Students to Cheat the Education System (Students’ Level of Honesty) (S2)
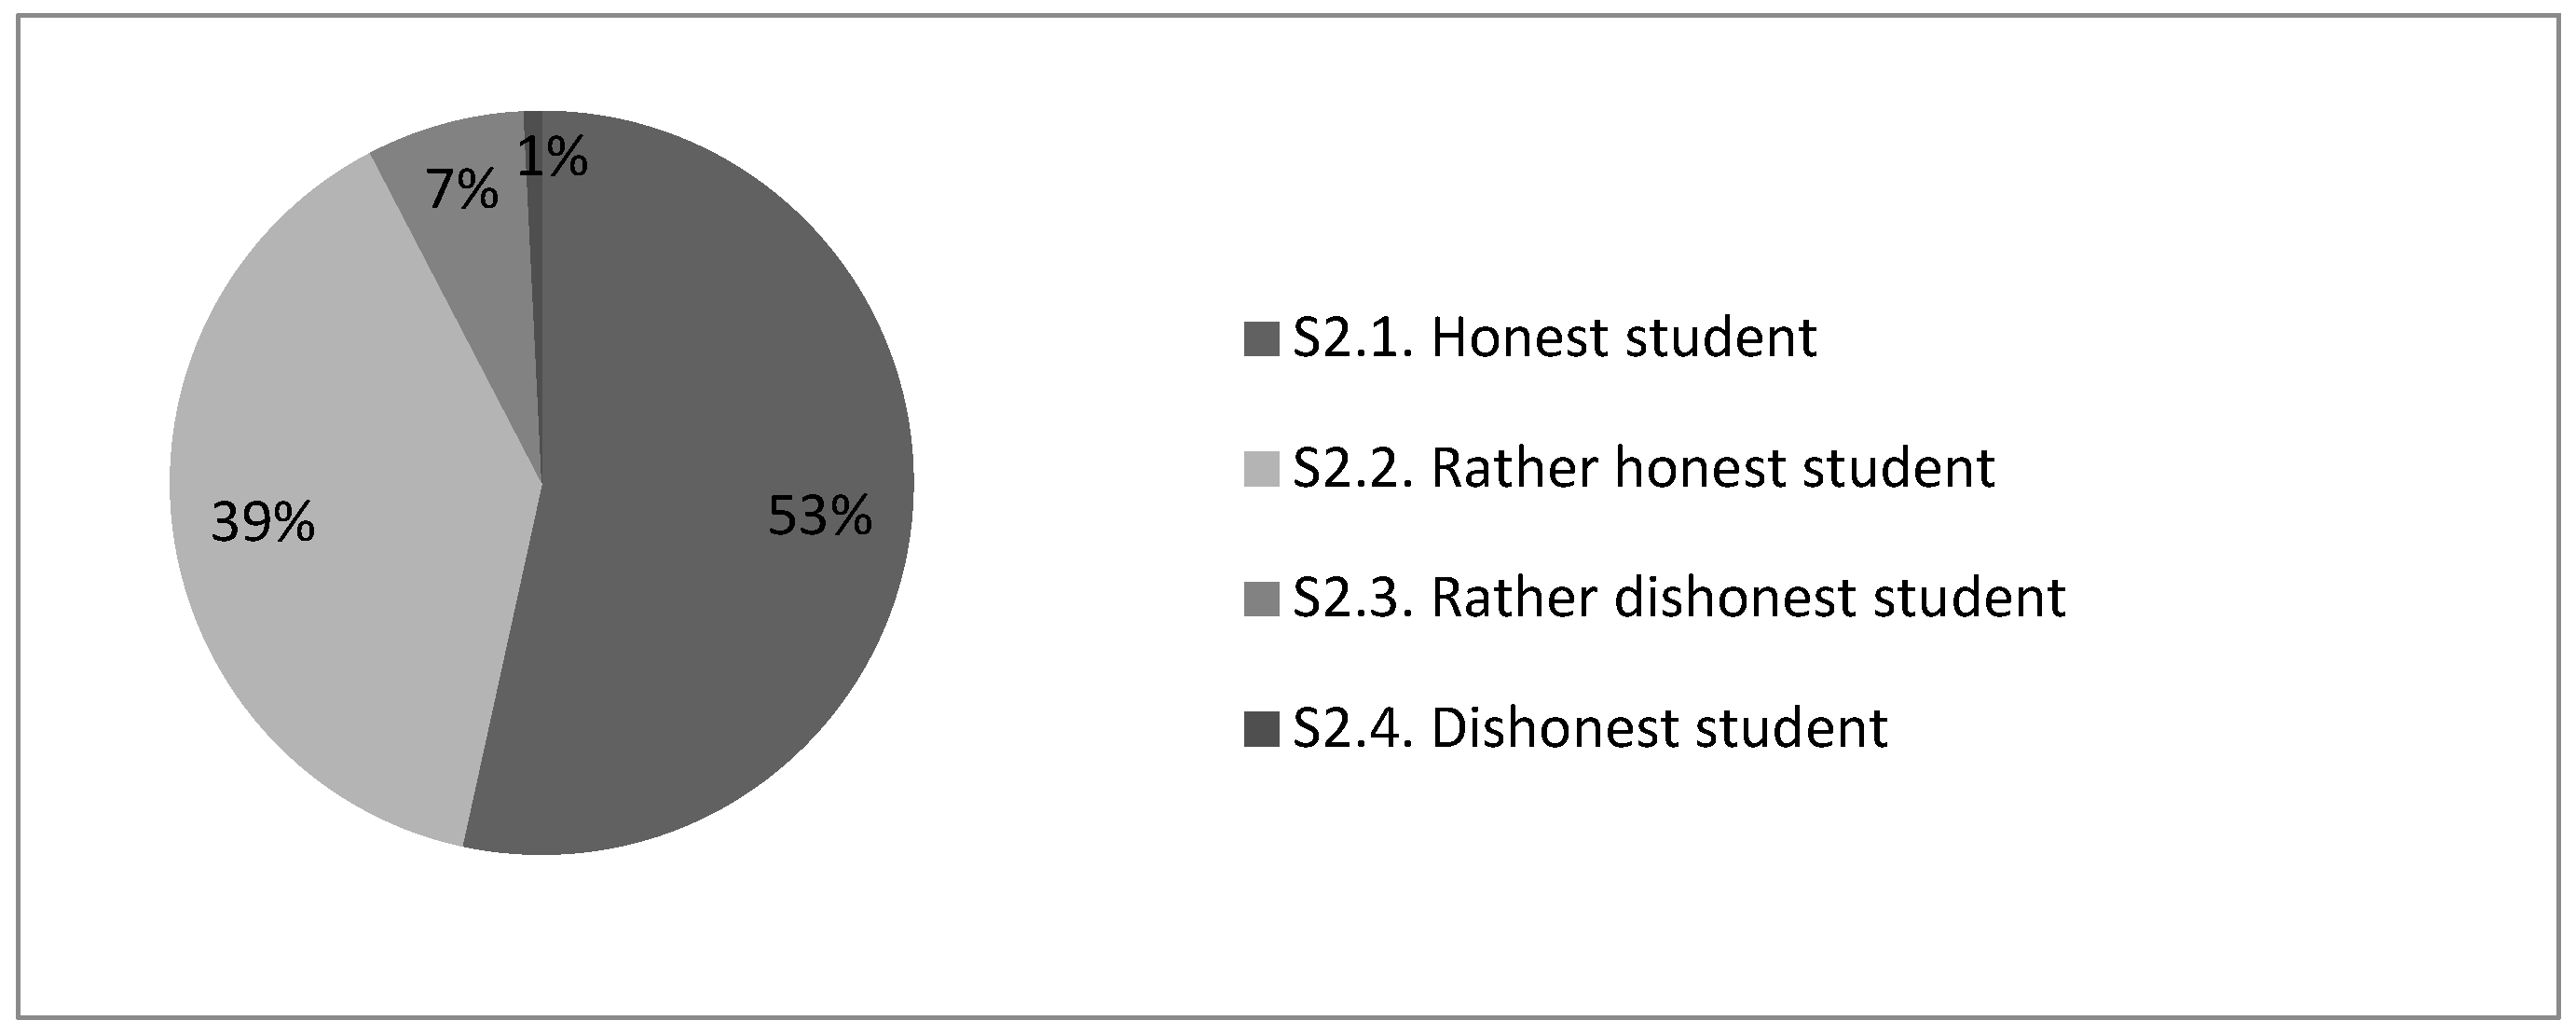
An analysis of the answers given to the S2 category questions made it possible to distinguish the behavior styles of students according to their level of honesty, with the maximum at 110 points (11 questions with 10 points each). A total of 53% are honest students who scored at least 75% points, the second largest group of students are those who are rather honest at 39%, 7% of the students surveyed were those who occasionally try to cheat the education system or the academician, and the remaining less than 1% (1/131) of the students can be placed under the category of the “Dishonest student” (Figure 12). Such results show that in the case of 8% of students, the academician can expect an attempt to cheat (dishonest behavior).
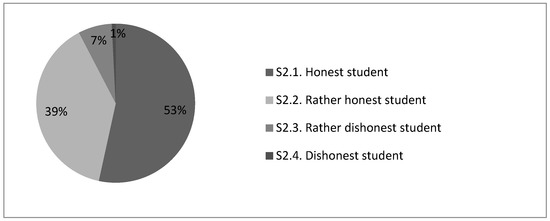
Figure 12.
Structure of surveyed students according to students’ propensity to cheat the education system (level of student honesty), %.
The ranking of teaching methods according to students’ propensity to cheat the education system (level of student honesty) is shown in Supplementary Material 5 (Table S10). The results indicate that dishonest students are more likely to prefer the university teacher’s use of “Specialized software” or “Learning Games” than honest students. Honest students are more likely to find satisfactory methods that are more creative or require them to justify their own point of view, such as “Brainstorming” or “Project method”.
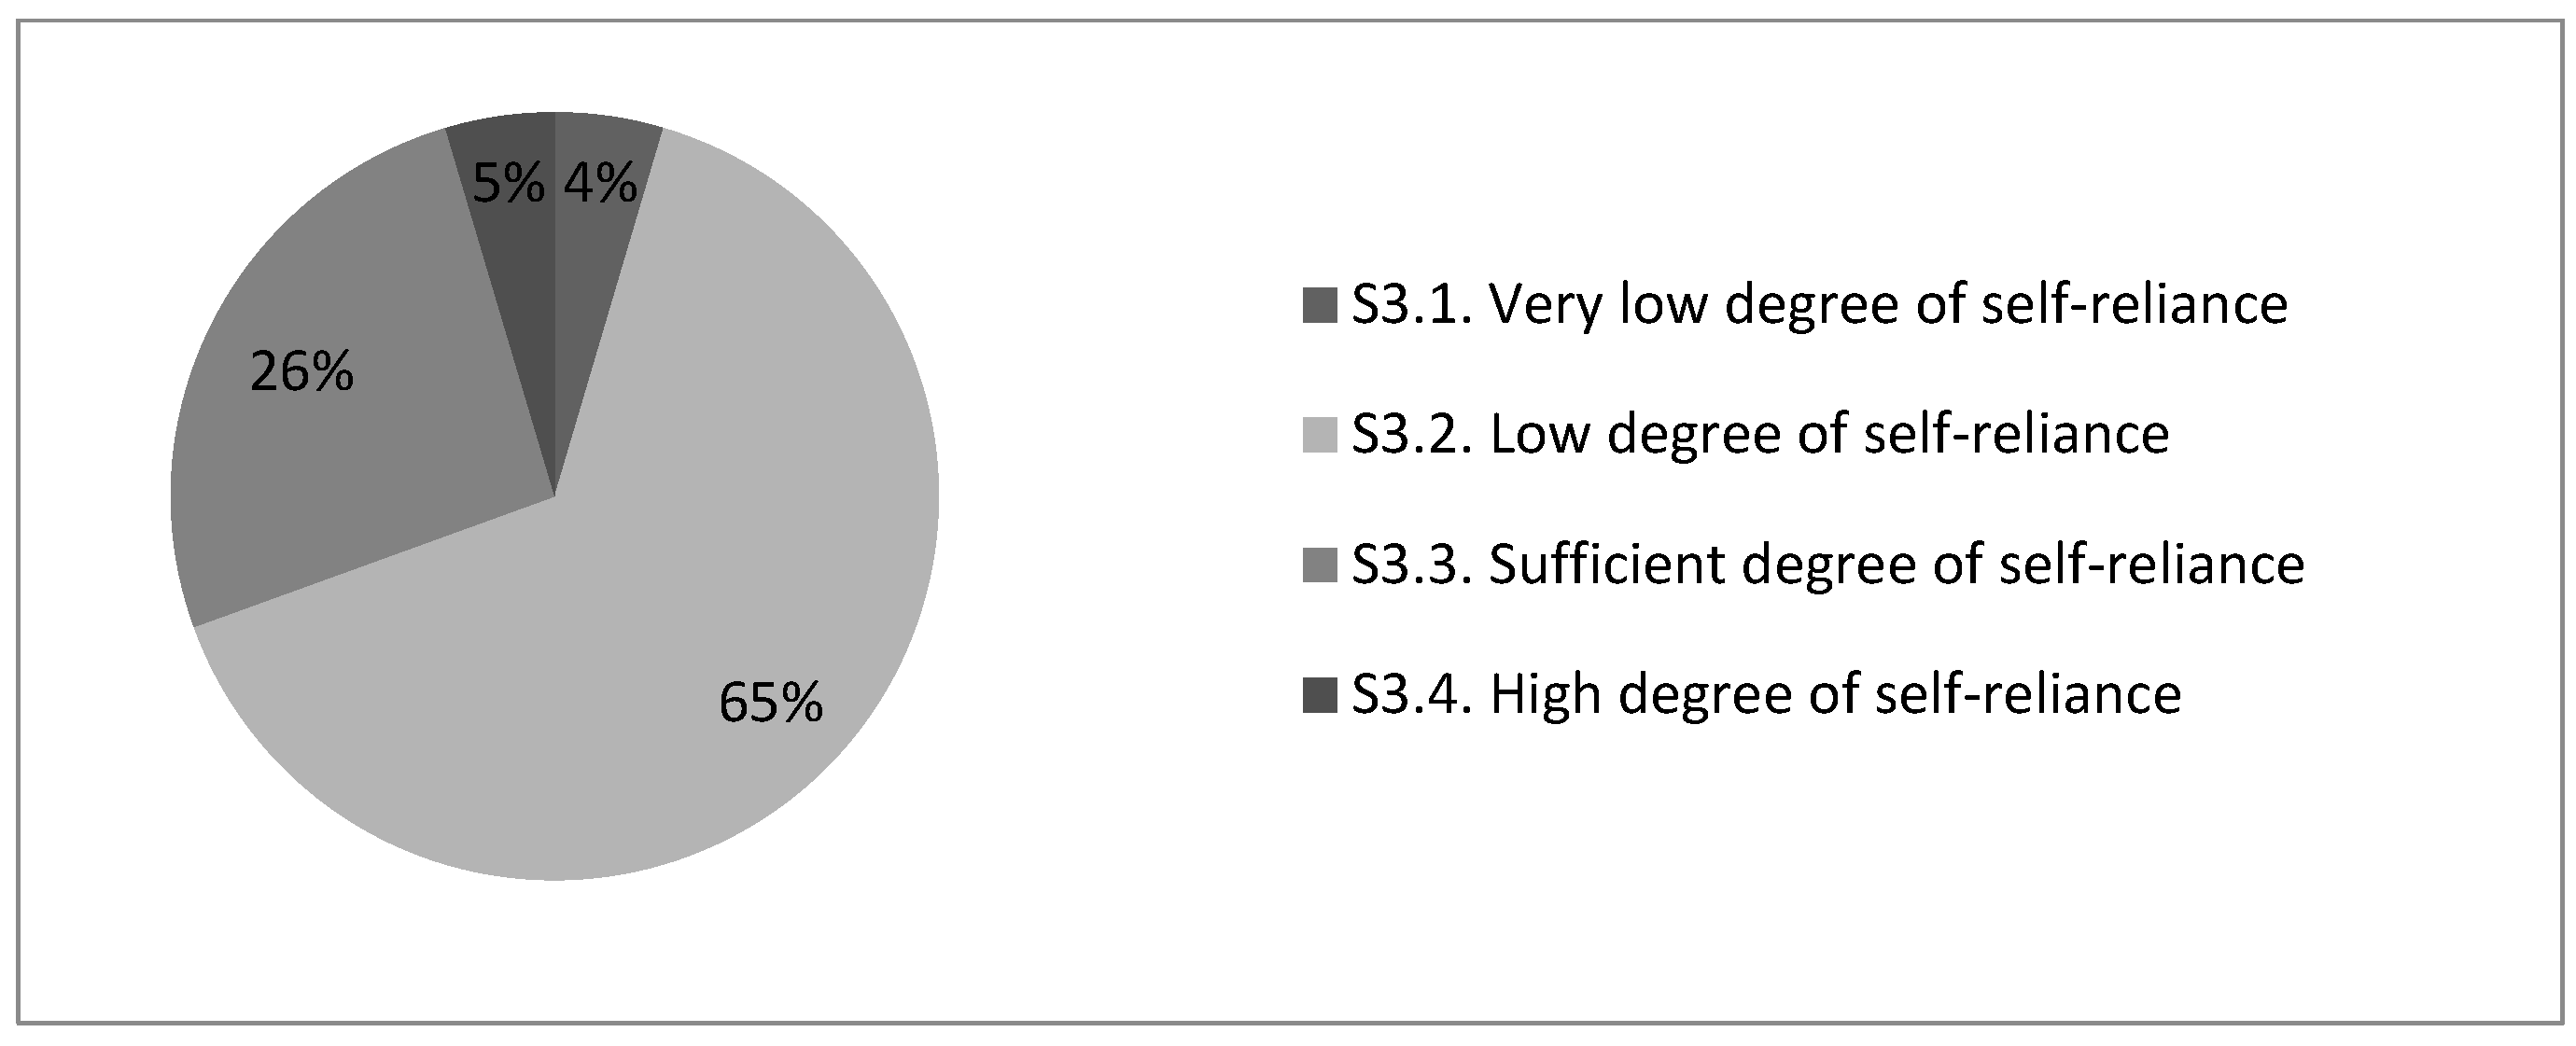
3.2.3. Analysis of Questions on Students’ Behavior Styles by Degree of Self-Reliance (S3)
Analysis of the answers given to the S3 category questions made it possible to distinguish students’ behavior styles according to their degree of self-reliance: 20 questions of 10 points each, a maximum of 200 points. The results of the survey indicate that among the surveyed students, the vast majority, i.e., 69%, have a low (65%) and very low (4%) degree of self-reliance; whereas 31% of students showed a sufficient (26%) or high (5%) degree of self-reliance (Figure 13). This situation results in a low level of effectiveness in the use of methods focused on independent student work. With such a group structure, it would be more justified to use such methods as: “Questions and answers”, “Discussion”, “Fish skeleton”, “Learning games”, and “SWOT analysis” or “Discussion” (Supplementary Material 5, Table S11).
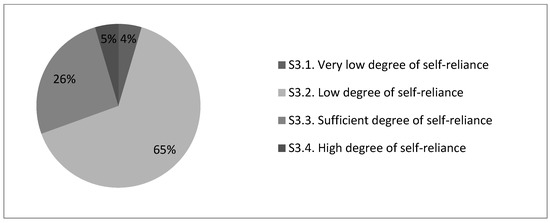
Figure 13.
Structure of surveyed students by degree of self-reliance, %.
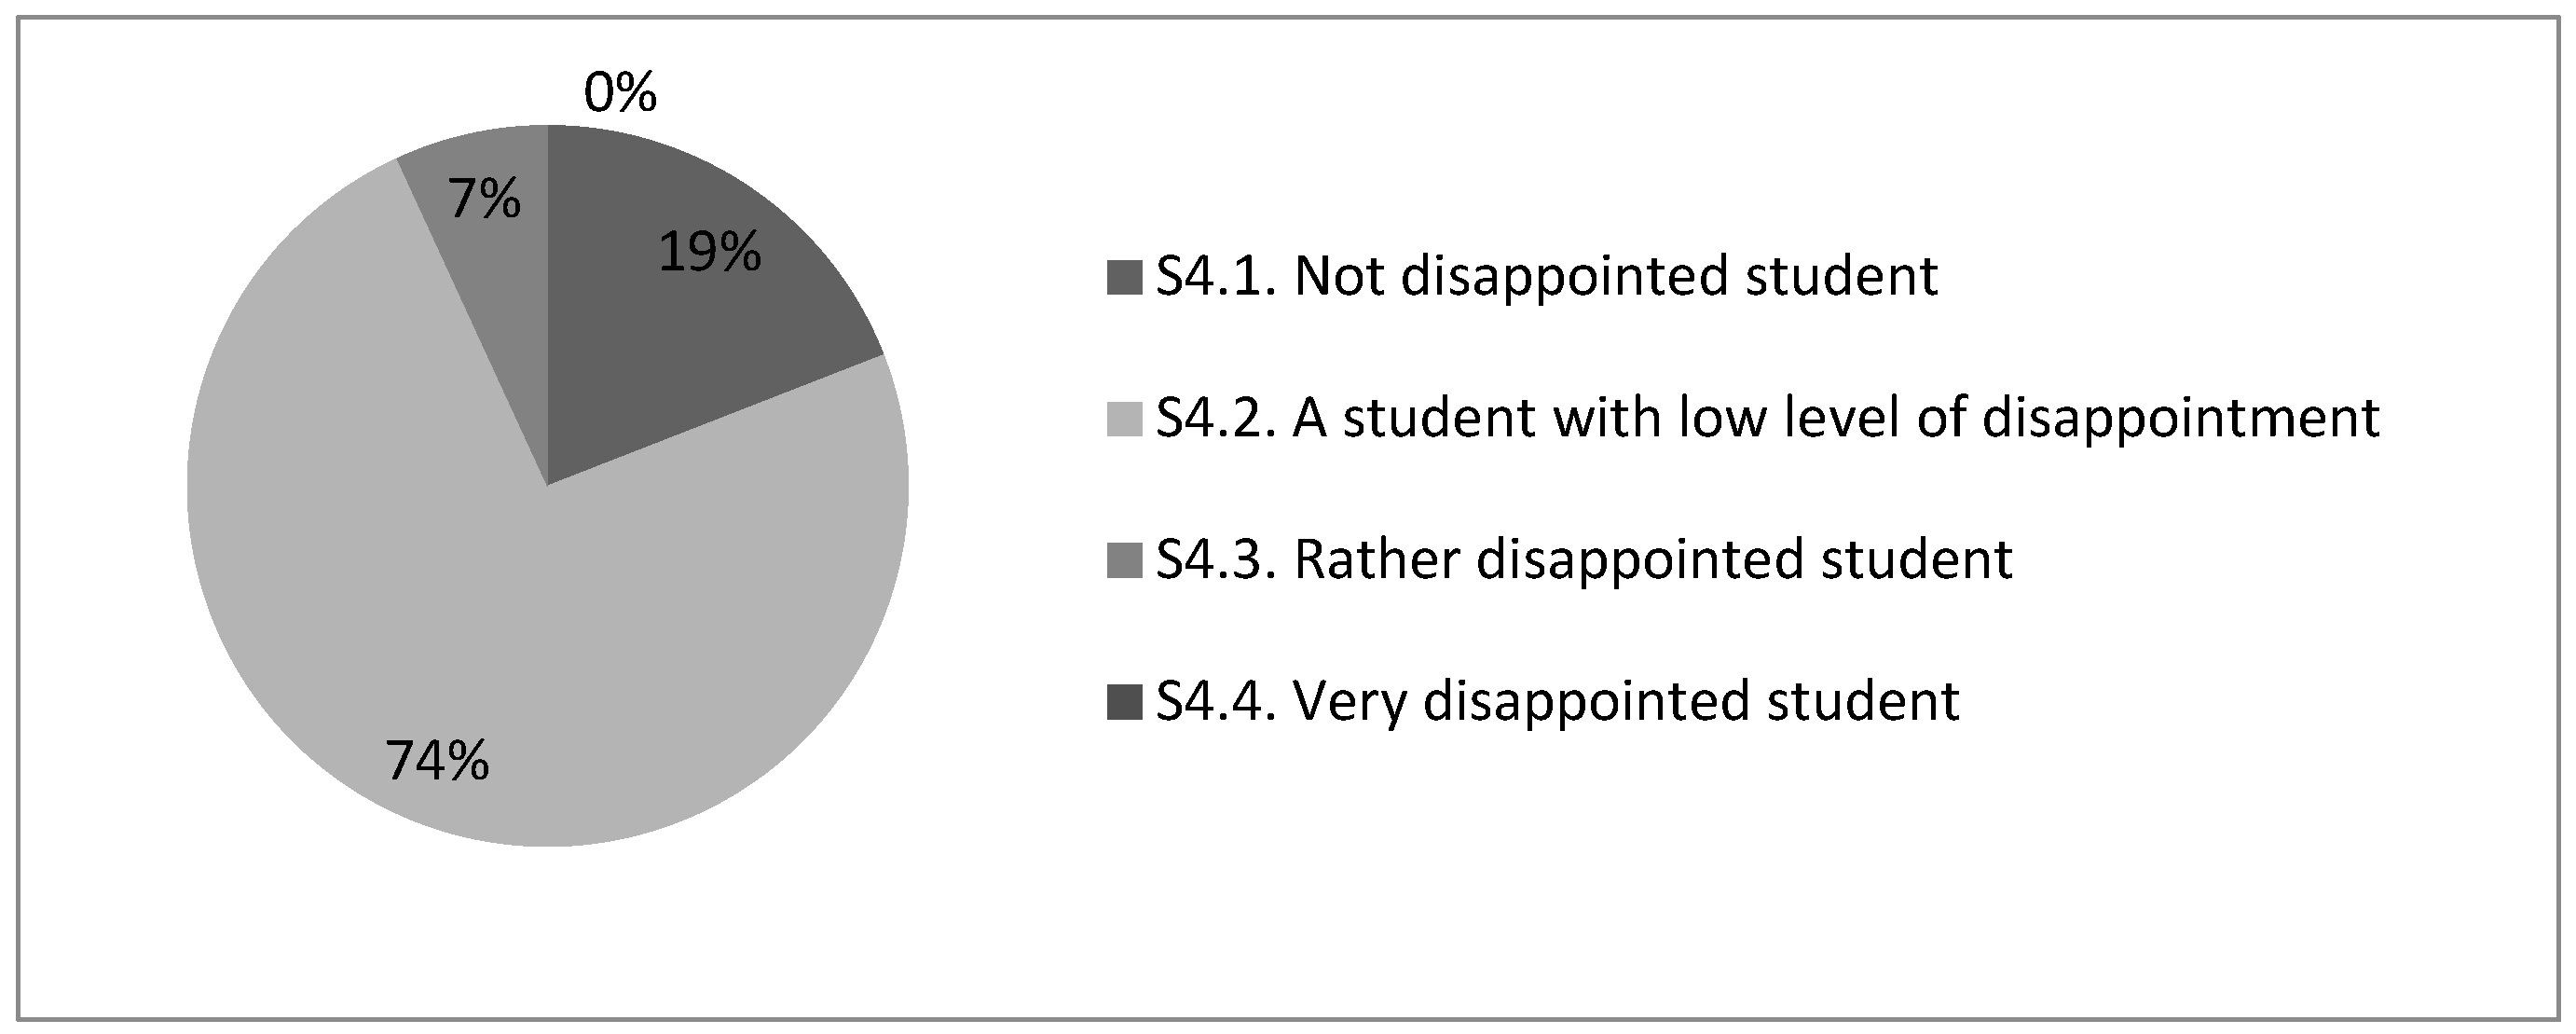
3.2.4. Analysis of Questions on Students’ Behavior Styles according to Their Level of Disillusionment with the Educational System (S4)
An analysis of the answers given by students to questions on category S4 (21 questions of 10 points each, a maximum of 210 points) (Figure 14) give rise to the conclusion that the majority of students have a certain degree of disillusionment with the educational system, i.e., 74% are students with a low degree of disappointment and 7% are rather disappointed students. Students who are not disappointed account for 19% from all respondents. This is a very low rate, which indicates that students are discouraged about their studies and confirms their lack of vision for future opportunities. These data fully correspond to the above results regarding the level of students’ confidence in the higher education system (S1), which showed that 76% of all students have a low or very low level of confidence in the education system. Among the surveyed students, there were no representatives of the S4.4 “Very disappointed student” category. Supplementary Material 5 (Table S12) shows the average ratings of teaching methods according to the degree of students’ disappointment with the educational system.
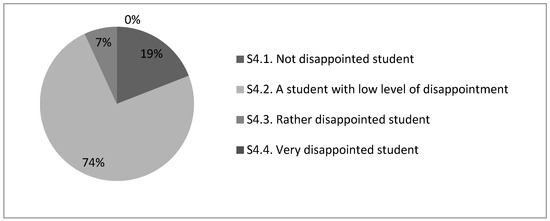
Figure 14.
Structure of surveyed students according to the degree of their disappointment with the educational system, %.
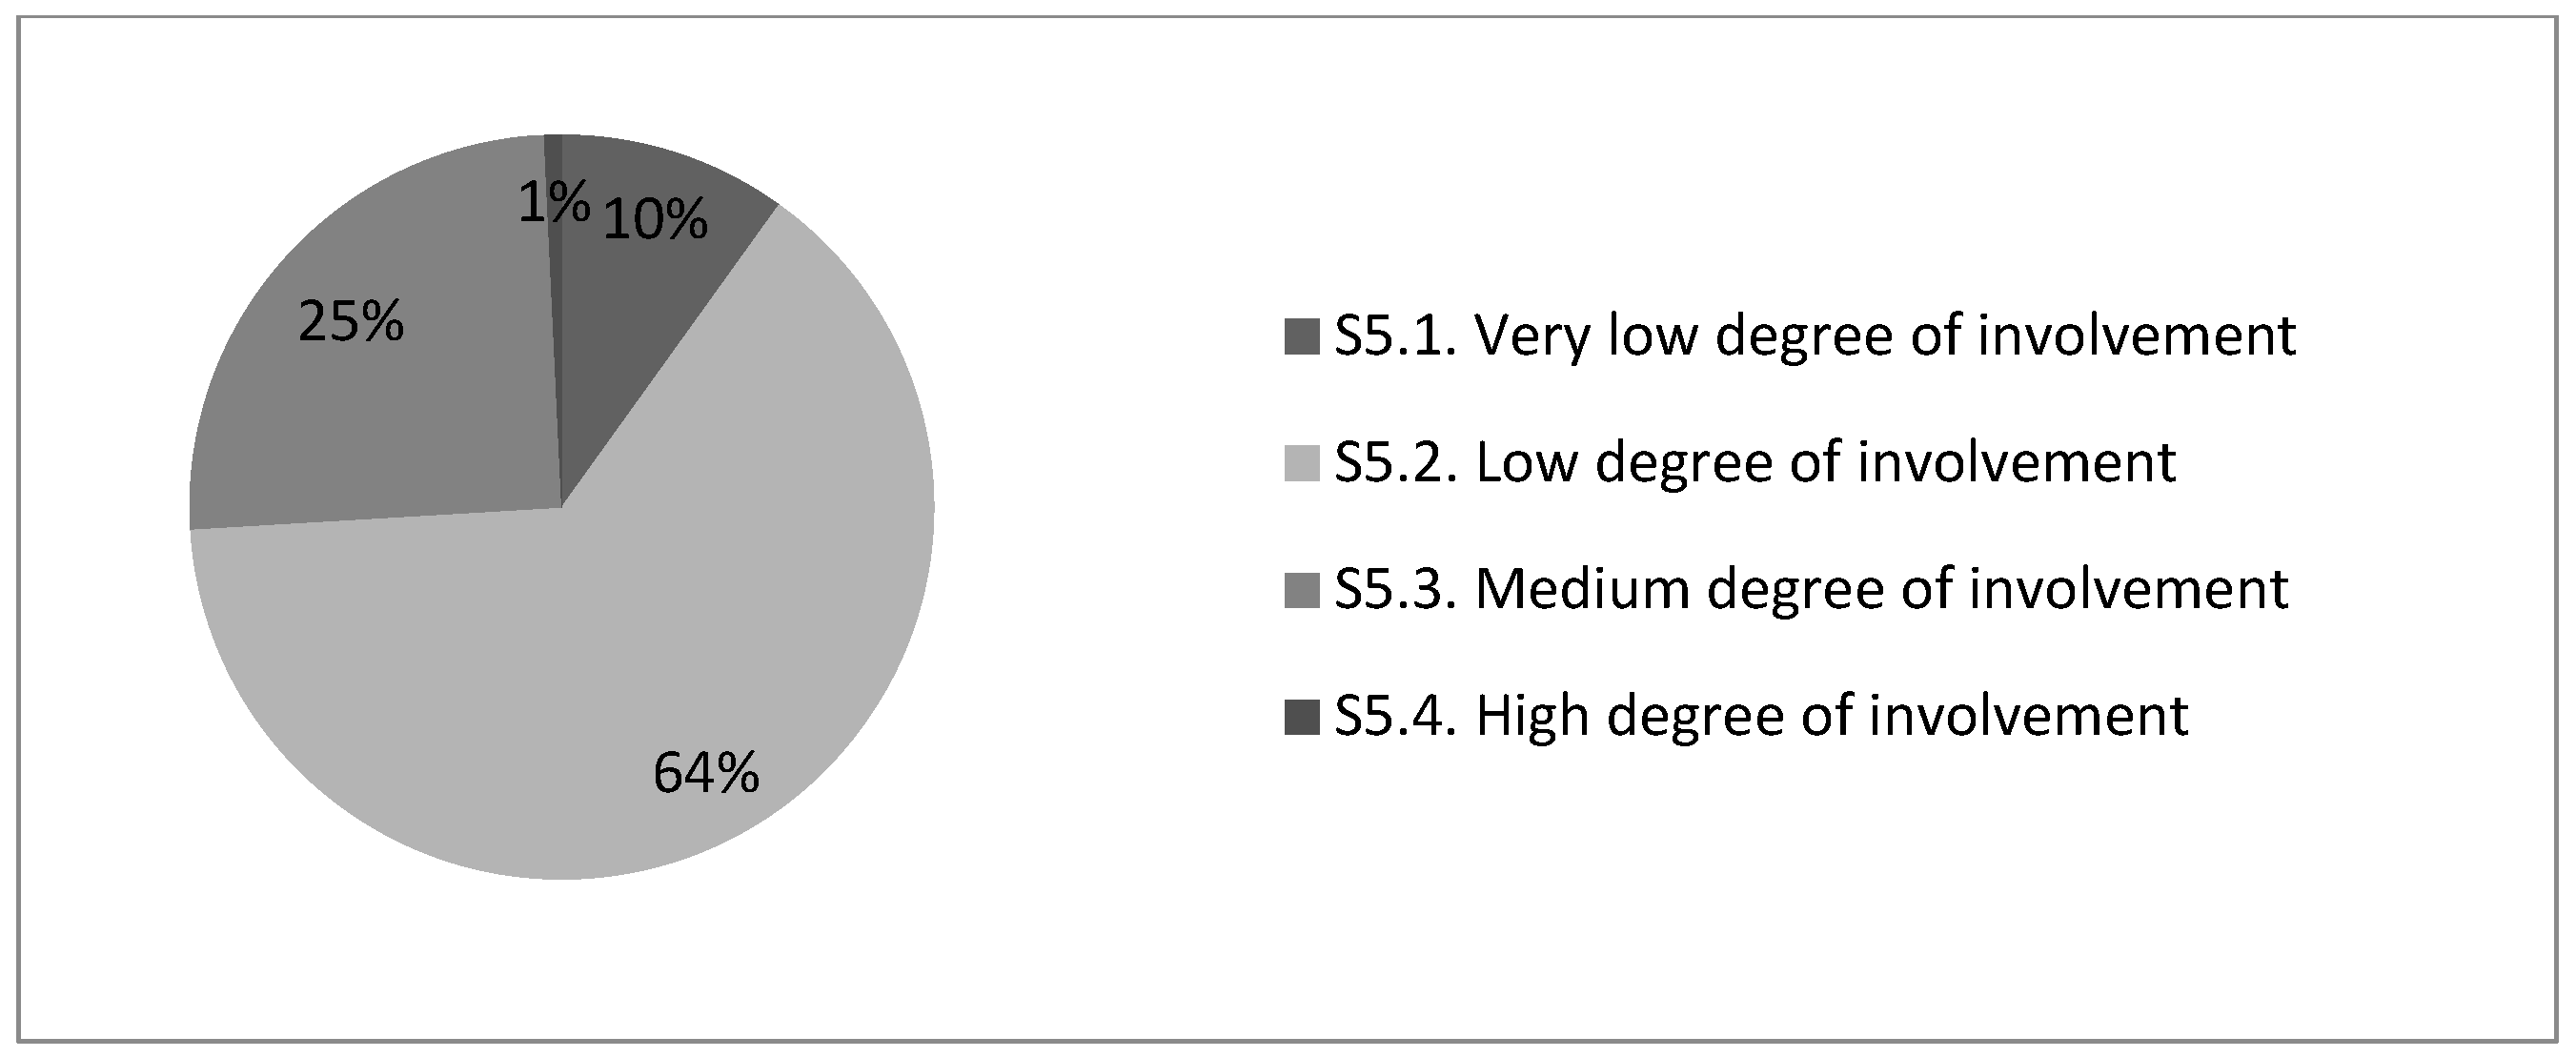
3.2.5. Analysis of Questions on Students’ Behavior Styles by Degree of Their Involvement in the Educational Process (S5)
An analysis of the degree of involvement of students in the educational process (S5) (14 questions of 10 points each, a maximum of 140 points) shows that: only 1% of students show a high level of involvement in the educational process; 25% of students a referred to the “Rather Involved” category; 64% of students comprise the group of students with a low degree of involvement; and 10% of students show a very low degree of involvement. In other words, 74%, or the vast majority of students surveyed, have a low and very low degree of involvement in learning (Figure 15). Such results collide with previous findings regarding the low level of trust in the higher education system (76% of students have low and very low levels of trust) and the degree of student disappointment (81% of students feel disappointed with the education system in one way or another).
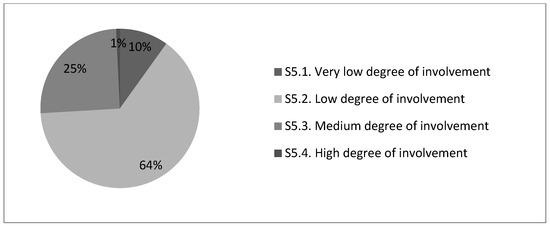
Figure 15.
Structure of surveyed students according to their degree of involvement in the educational process, %.
The data in Supplementary Material 5 (Table S13) indicate that, in general, students with a very low degree of involvement rated “Learning games” and “Field activities” for the quality of the most effective methods. The least effective, from their point of view, are such methods as “Questions and answers”, “Discussion”, and “Snowball”. These are methods that require interaction with another person along with a presentation of their views and arguments. It is also worth noting that students showing a high level of involvement are generally inclined to provide higher ratings to the mentioned teaching methods. Such students prefer methods, needing more effort and concentration on the part of the student (for example, “Case Study”, “Debate”, Brainstorming”, “Decision Tree”).
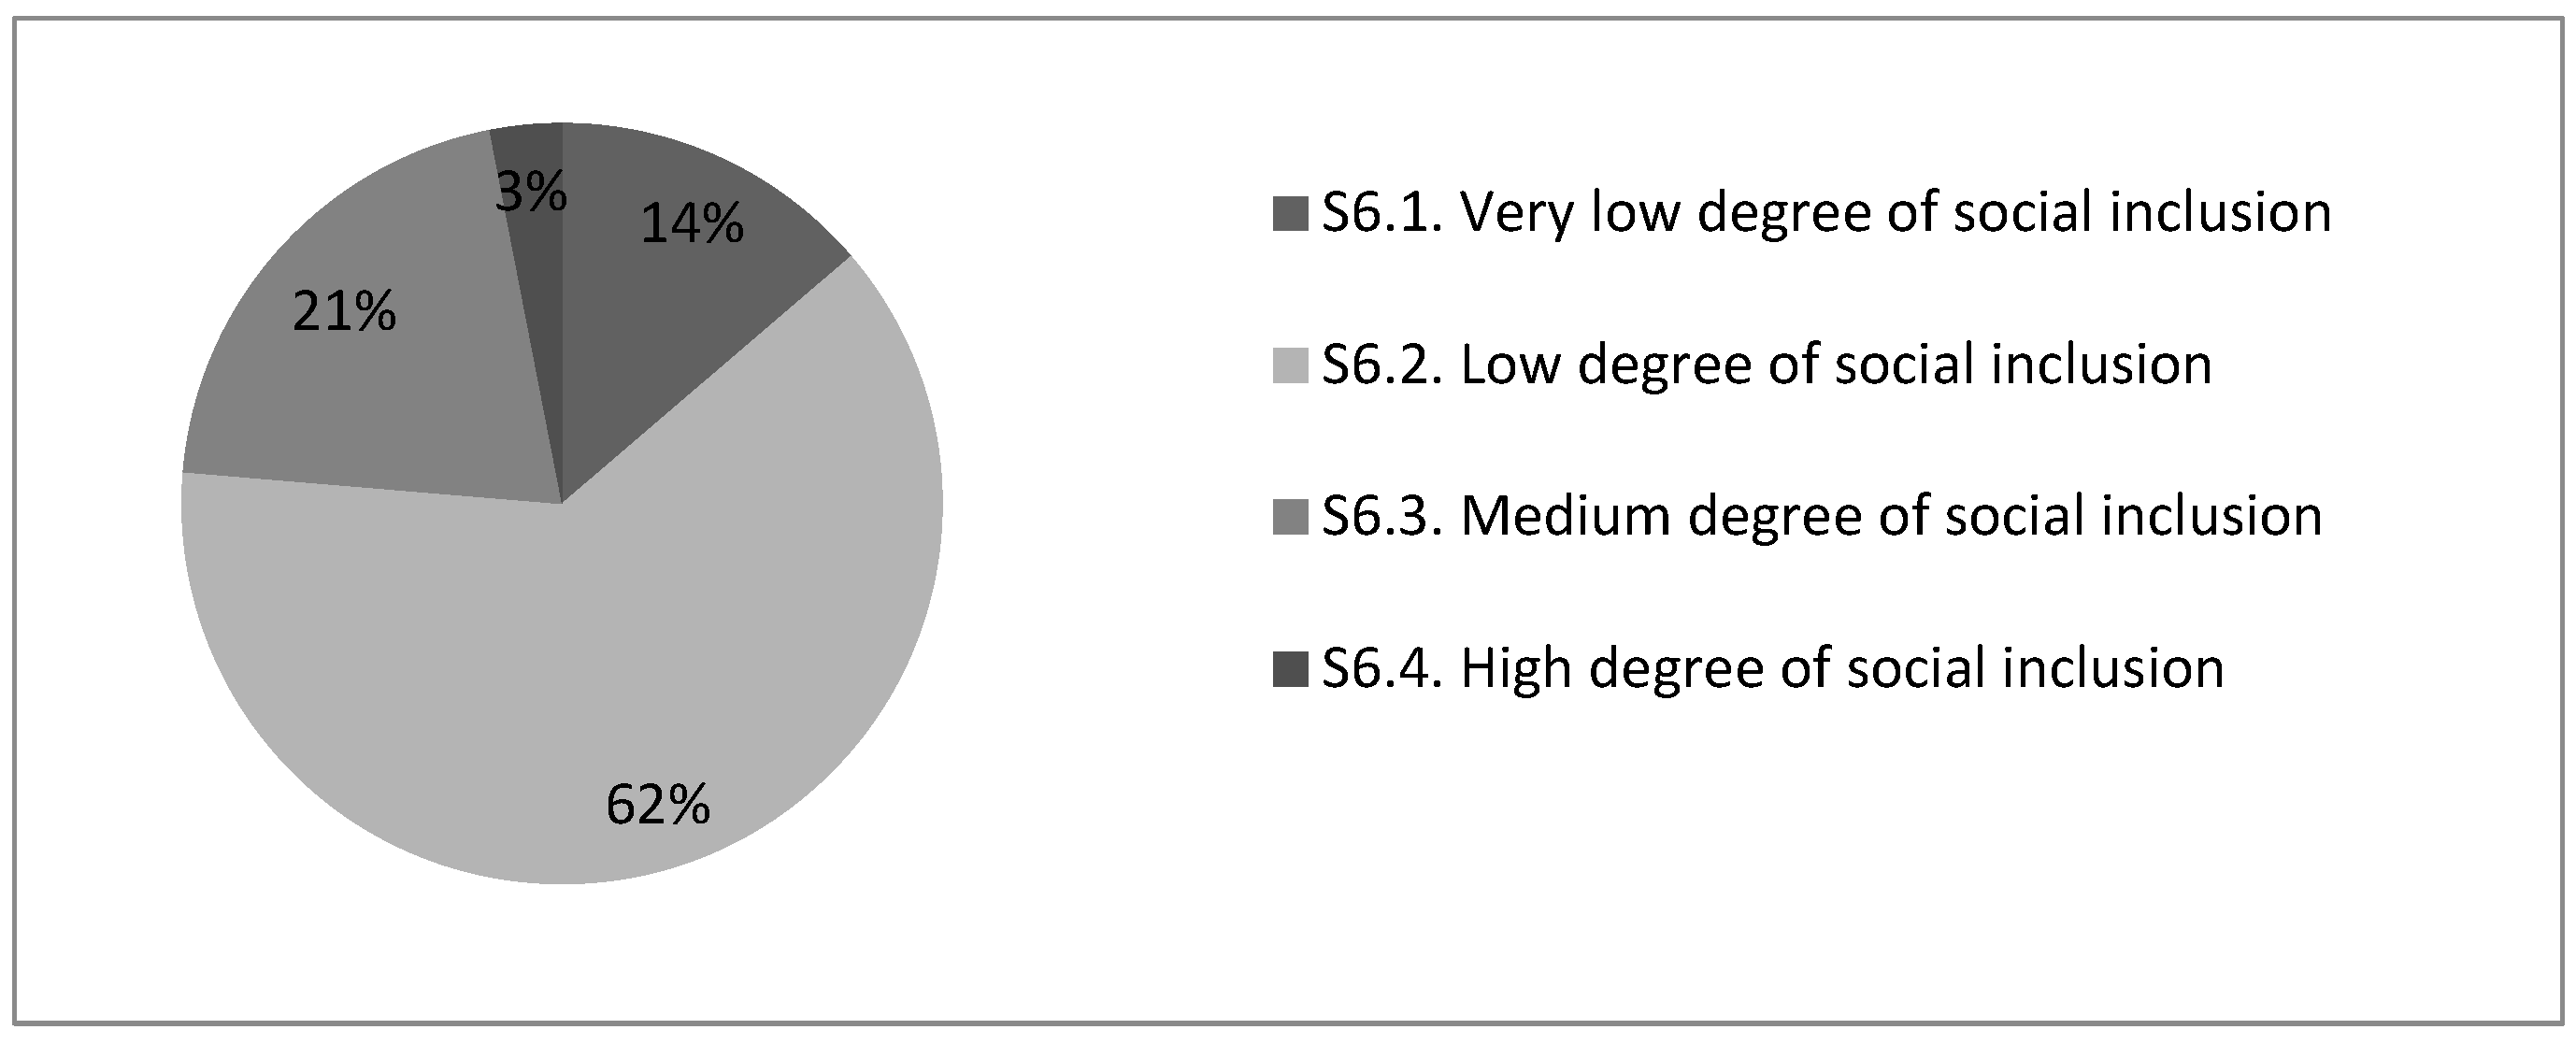
3.2.6. Analysis of Questions on Students’ Behavior Styles According to Their Degree of Social Inclusion (S6)
The students participating in the survey reveal problems with establishing or maintaining contact, which is confirmed by the results of the analysis of questions relating to the S6 category (16 questions of 10 points each, a maximum of 160 points). A total of 76% of all surveyed students have a low and very low degree of social inclusion (62% and 14%, respectively), 21% of students have a medium degree of social inclusion and only 3% have a high degree (Figure 16). These results demonstrate the existence of a serious problem among students. One of the ways to rectify the existing situation is the appropriate selection of teaching methods, aimed at teamwork among students and increasing their degree of social inclusion. Supplementary Material 5 (Table S14) shows the average ratings of teaching methods by the degree of students’ social inclusion.
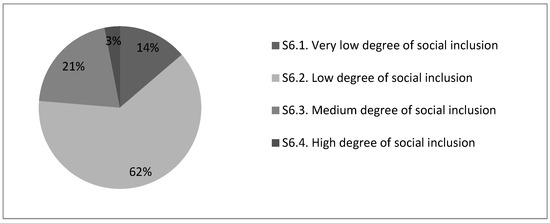
Figure 16.
Structure of surveyed students by degree of social inclusion, %.
3.2.7. Analysis of Questions on Students’ Behavior Styles According to Their Dependence on Formal Learning Outcomes (On Assessment) (S7)
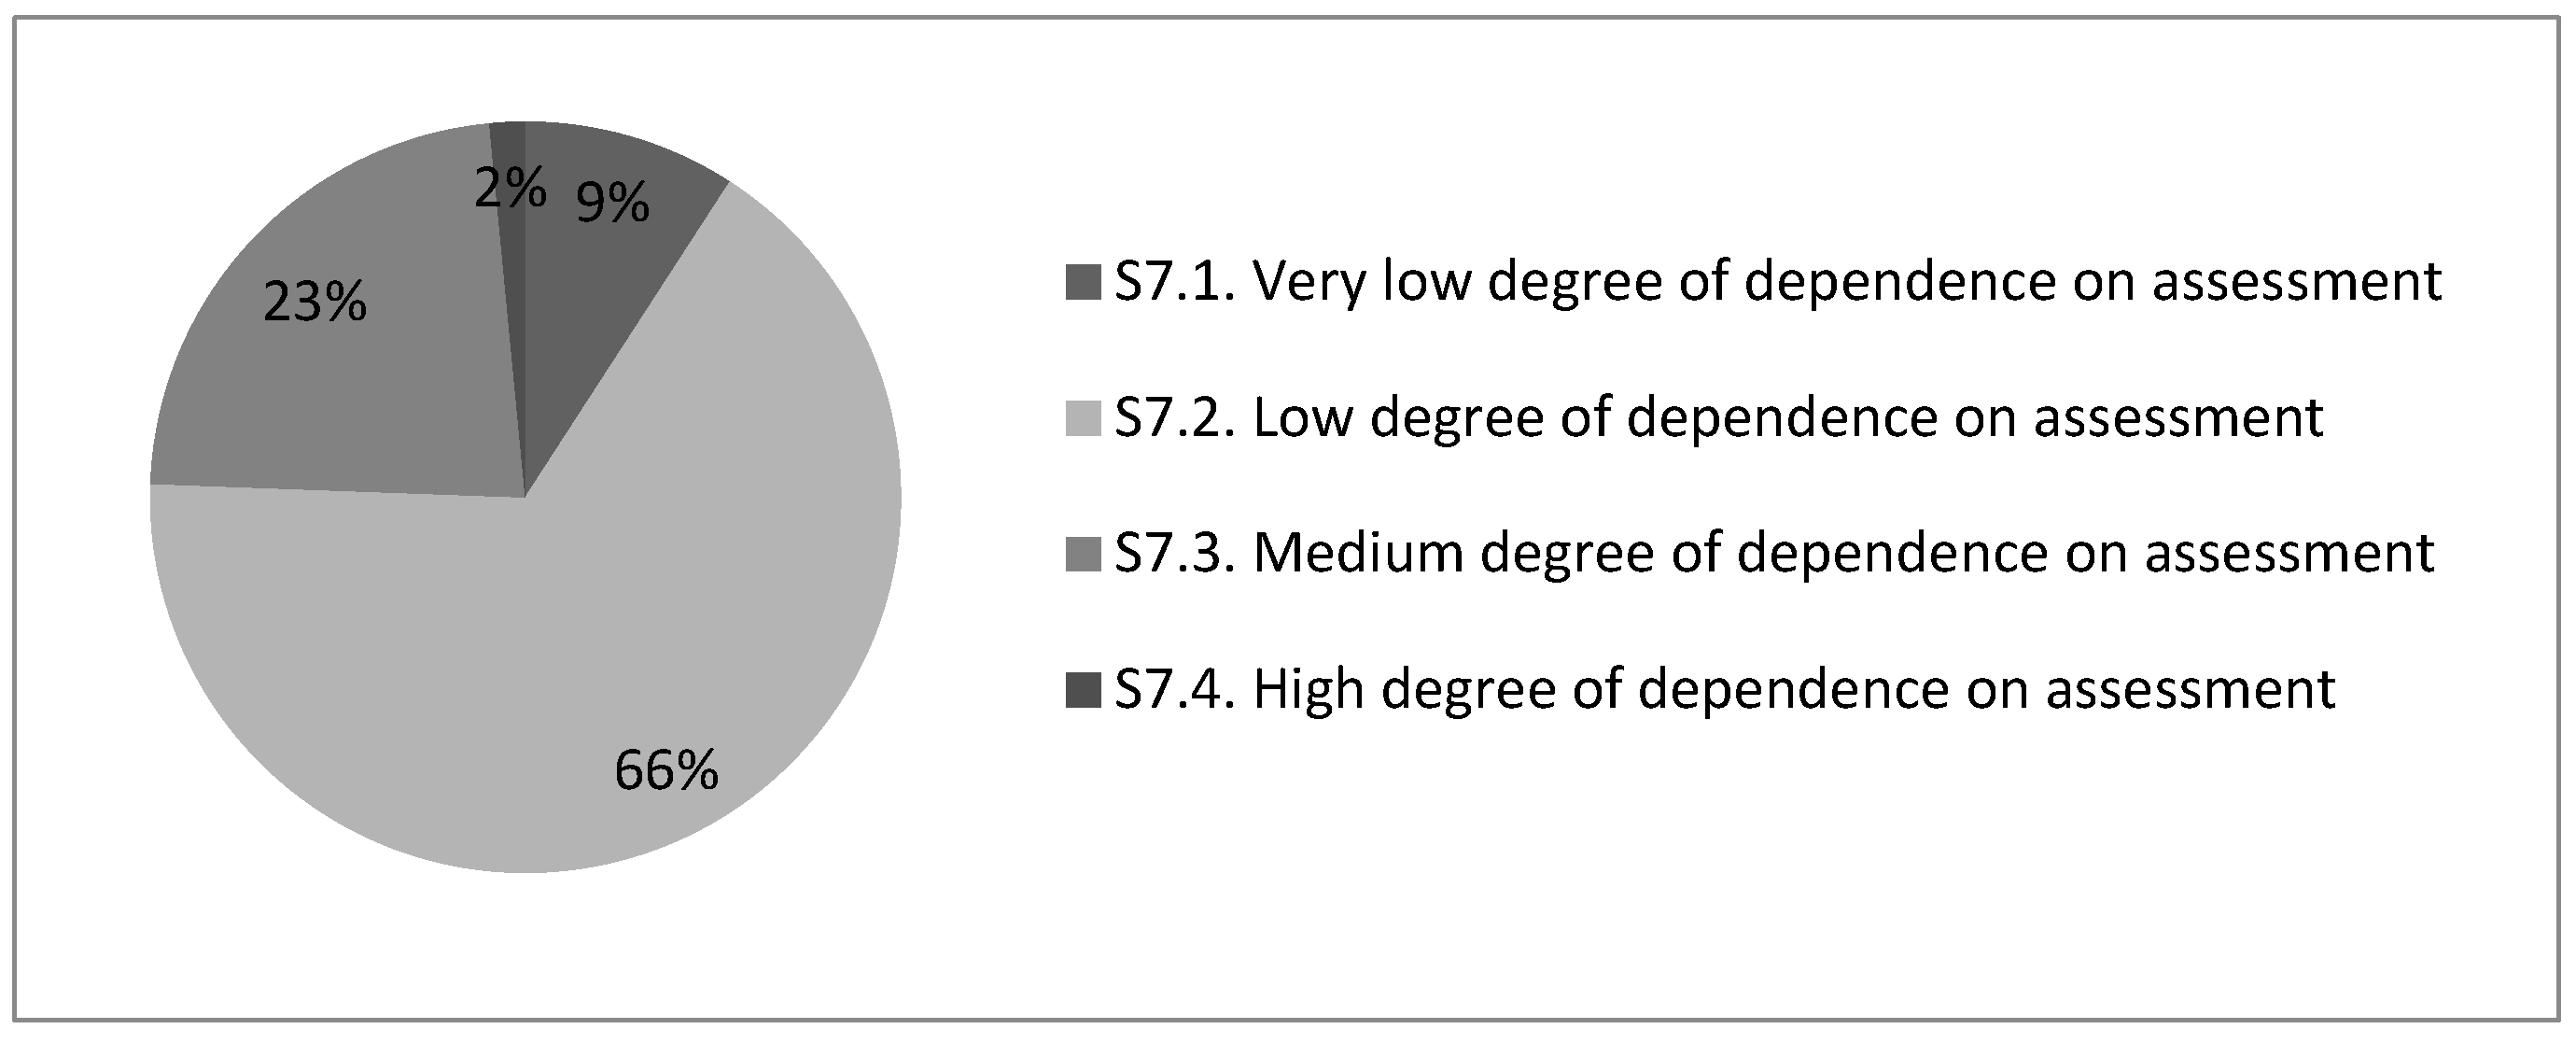
The last category of S7 questions (11 questions of 10 pts each, maximum 110 pts) is aimed at determining the ability of the academic staff to motivate students through the evaluation system (Figure 17). The results show that there is a very large group of students—75% of all respondents—who can be motivated through assessment to a very low degree (9%) or a low degree (66%). This means that, in general, for the modern student, assessment does not have much motivational power (23% of students show susceptibility to this type of motivational tool and 2% show a high degree of dependence on the grades received). And this means that for the modern student, assessment in itself ceases to be a primary motivational tool, but rather serves only to verify learning outcomes.
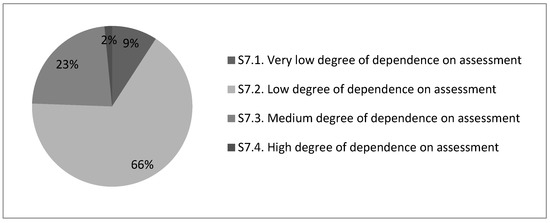
Figure 17.
Structure of surveyed students according to their dependence on formal learning results, i.e., on assessment, %.
Supplementary Material 5 (Table S15) shows the ranking of teaching methods by their ability to motivate student performance through the grading system. The results indicate that for students who are less susceptible to a motivation system based solely on assessment, the most effective teaching methods will be “Learning Games”, “Brainstorming” or “Field Activities” (these methods occupy the first three places according to students’ opinions).
4. Results and Discussion
4.1. Profile of an Average University Student
The study of the behavior styles of modern students allowed us to distinguish the profile of the average university student. The average university student has a low level of confidence in the higher education system and in the methods used by the university teacher (76% of all surveyed students indicated that they have a low and very low level of confidence). The average student can be characterized as a learner with a low level of self-reliance and confidence in their abilities (69% of the students surveyed indicated that they have a low and very low level of self-reliance) and a low level of commitment to learning (74% of the students surveyed have a low and very low level of involvement in learning). Today’s student is disillusioned by the educational system (81% of students indicated the existence of a certain level of disillusionment), who is very difficult to motivate through assessment (75% of all students surveyed said that assessment was not their motivator for learning). Such a student is unlikely to have a tendency to cheat the system or the academic teacher (only on the part of 8% of students can the academic teacher expect dishonest behavior). The modern student has difficulty establishing and maintaining contacts (76% of the students surveyed have low and very low levels of social inclusion). Such a student is characterized by self-doubt, which leads to a lower willingness to acquire knowledge and develop critical thinking skills.
4.2. Model for Selecting Active Learning Methods While Taking into Account the Behavior Styles of Modern Students
After determining the structure of the activity group, we can carry out the optimization of the selection of teaching methods. Thus, our task is to obtain the maximum average grade from the selected teaching methods. Below is a model for selecting active learning methods while taking into account the behavior styles of modern students:
where SRS1 is the average evaluation of teaching methods, selected by the academic teacher; xij is the average evaluation of the i-th teaching method by the j-th category of students; yij is the number of times the i-th teaching method is applied to the j-th category of students; and n is the number of meetings in the course of studying the subject.
The following limitations were formulated to maximize the function SRS1(x,y):
- In order to diversify the methods used and make the teaching activities more attractive, we will assume that ∑yij ≤ 2. That is, each teaching method should not be used more than 2 times. This condition may vary depending on the approach of each specific academic teacher and also the number of meetings based on the class schedule (as an example, this article also provides optimization results for ∑yij ≤ 4 and ∑yij ≤ 6).
- In order to take into account the behavior styles of students, a rule of thumb was taken that the number of methods used depends on the percentage of the student subgroup. Thus, for example, in the case of student subgroup S1.1, which is 14% of the study population, two methods (0.14 ∙ 15 = 2.1) preferred by the students of this subgroup must be used in 15 class meetings.
- Taking into account that a semester in an academic year in a full-time study lasts 15 weeks, for the purposes of this study, 15 meetings can be scheduled with students (in the case of separate subjects, or forms of instruction, the number of meetings may vary)
- We assume that in one teaching session, the academic teacher is able to use only one teaching method.
5. Conclusions
In order to increase the level of students’ interest in the subject, engage them in learning, and develop their critical thinking skills, we will conduct the optimization of the selection of teaching methods while taking into account the profile of the average university student described above. We will use the developed model of the selection of active teaching methods (Formula (1)) and Solver/MS Excel tools for optimization. In the model, we will apply the following constraints: each teaching method should not be used more than 2 times (∑yij ≤ 2); 15 meetings with students are expected in a semester of the academic year; in one class meeting, the academic teacher will use only one teaching method. The optimization results are presented in Table 1.

Table 1.
Results of the approval of the model on the selection of active teaching methods, taking into account the behavior styles of modern students (15 teaching activities).
Supplementary Materials
The following supporting information can be downloaded at: https://www.mdpi.com/article/10.3390/educsci13070693/s1, SM1: Data, SM2: Survey design, SM3: General descriptive statistics of the obtained answers, SM4: Correlation coefficients between demotivating factors, SM5: Average ratings of teaching methods.
Author Contributions
Conceptualization, I.S. and A.S.; methodology, I.S. and A.S.; software, A.S.; validation, I.S. and A.S.; formal analysis, I.S.; investigation, I.S. and A.S.; resources, I.S. and A.S.; data curation, A.S.; writing—original draft preparation, I.S. and A.S.; writing—review and editing, I.S. and A.S.; visualization, A.S.; supervision, I.S. All authors have read and agreed to the published version of the manuscript.
Funding
This research received no external funding.
Informed Consent Statement
Informed consent was obtained from all subjects involved in the study
Data Availability Statement
Preliminary data can be found in the Supplementary Material “Supplementary Material 1—Data”.
Conflicts of Interest
The authors declare no conflict of interest.
References
- Schwab, K. The Fourth Industrial Revolution; Crown Business: New York, NY, USA, 2017. [Google Scholar]
- Caruso, L. Digital innovation and the fourth industrial revolution: Epochal social changes? AI Soc. 2018, 33, 379–392. [Google Scholar] [CrossRef]
- World Development Report. The Changing Nature of Work; World Bank: Washington, DC, USA, 2019; Available online: https://elibrary.worldbank.org/doi/epdf/10.1596/978-1-4648-1328-3 (accessed on 5 February 2023).
- Gupta, A.; Singh Rajesh, K.; Kamble, S.; Mishra, R. Knowledge management in industry 4.0 environment for sustainable competitive advantage: A strategic framework. Knowl. Manag. Res. Pract. 2022, 20, 878–892. [Google Scholar] [CrossRef]
- Sony, M.; Mekoth, N. Employee adaptability skills for Industry 4.0 success: A road map. Prod. Manuf. Res. 2022, 10, 24–41. [Google Scholar] [CrossRef]
- World Economic Forum. The Future of Jobs Report: 2020. Available online: https://www3.weforum.org/docs/WEF_Future_of_Jobs_2020.pdf (accessed on 4 February 2023).
- Facione, P.A. Critical Thinking: A Statement of Expert Consensus for Purposes of Educational Assessment and Instruction. Executive Summary: The Delphi Report; 1990. Available online: https://files.eric.ed.gov/fulltext/ED315423.pdf (accessed on 4 February 2023).
- Straková, Z.; Cimermanovám, I. Critical Thinking Development—A Necessary Step in Higher Education Transformation towards Sustainability. Sustainability 2018, 10, 3336. [Google Scholar] [CrossRef]
- Paul, R.; Elder, L. The Nature and Functions of Critical & Creative Thinking; Rowman & Littlefield Publishers: Lanham, MD, USA, 2019. [Google Scholar]
- Riggs, L.W.; Hellyer-Riggs, S. Development and Motivation in/for Critical Thinking. J. Coll. Teach. Learn. 2014, 11, 1–8. [Google Scholar] [CrossRef]
- Shpeizer, R. Teaching critical thinking as a vehicle for personal and social transformation. Res. Educ. 2018, 100, 32–49. [Google Scholar] [CrossRef]
- Abrami, P.C.; Bernard, R.M.; Borokhovski, E.; Waddington, D.I.; Wade, C.A.; Persson, T. Strategies for Teaching Students to Think Critically: A Meta-Analysis. Rev. Educ. Res. 2015, 85, 275–314. [Google Scholar] [CrossRef]
- Sellars, M.; Fakirmohammad, R.; Bui, L.; Fishetti, J.; Niyozov, S.; Reynolds, R.; Thapliyal, N.; Liu-Smith, Y.-L.; Ali, N. Conversations on Critical Thinking: Can Critical Thinking Find Its Way Forward as the Skill Set and Mind set of the Century? Educ. Sci. 2018, 8, 205. [Google Scholar] [CrossRef]
- Rotatori, D.; Lee, E.J.; Sleeva, S. The evolution of the work force during the fourth industrial revolution. Hum. Resour. Dev. Int. 2021, 24, 92–103. [Google Scholar] [CrossRef]
- Di Nardo, M.; Forino, D.; Murino, T. The evolution of man–machine interaction: The role of human in Industry 4.0 paradigm. Prod. Manuf. Res. 2020, 8, 20–34. [Google Scholar] [CrossRef]
- Sanchez, D.G.; Parra, N.G.; Ozden, C.; Rijkers, B. Which Jobs Are Most Vulnerable to COVID-19? What an Analysis of the European Union Reveals. Research & Policy Briefs from the World Bank Malaysia Hub. 11 May 2020. Available online: https://openknowledge.worldbank.org/bitstream/handle/10986/33737/Which-Jobs-Are-Most-Vulnerable-to-COVID-19-What-an-Analysis-of-the-European-Union-Reveals.pdf?sequence=5 (accessed on 5 February 2023).
- Hecklau, F.; Galeitzke, M.; Flachs, S.; Kohl, H. Holistic approach for human resource management in Industry 4.0. Procedia CIRP 2016, 54, 1–6. [Google Scholar] [CrossRef]
- Indrašienė, V.; Jegelevičienė, V.; Merfeldaitė, O.; Penkauskienė, D.; Pivorienė, J.; Railienė, A.; Sadauskas, J.; Valavičienė, N. The Value of Critical Thinking in Higher Education and the Labour Market: The Voice of Stakeholders. Soc. Sci. 2021, 10, 286. [Google Scholar] [CrossRef]
- Jiang, J.; Gao, A.; Yang, B. Employees’ Critical Thinking, Leaders’ Inspirational Motivation, and Voice Behavior: The Mediating Role of Voice Efficacy. J. Pers. Psychol. 2018, 17, 33–41. [Google Scholar] [CrossRef]
- García-Moro, F.J.; Gómez-Baya, D.; Muñoz-Silva, A.; Martín-Romero, N. Qualitative and Quantitative Study on Critical Thinking in Social Education Degree Students. Sustainability 2021, 13, 6865. [Google Scholar] [CrossRef]
- Lu, S.; Singh, M. Debating the Capabilities of “Chinese Students” for Thinking Critically in Anglophone Universities. Educ. Sci. 2017, 7, 22. [Google Scholar] [CrossRef]
- Norton, F.; Gregson, M. The Thinking Skills Deficit: What Role Does a Poetry Group Have in Developing Critical Thinking Skills for Adult Lifelong Learners in a Further Education Art College? Educ. Sci. 2020, 10, 73. [Google Scholar] [CrossRef]
- Al-Mahrooqi, R.; Denman, C.J. Assessing Students’ Critical Thinking Skills in the Humanities and Sciences Colleges of a Middle Eastern University. Int. J. Instr. 2020, 13, 783–796. [Google Scholar] [CrossRef]
- Huber, C.R.; Kuncel, N.R. Does College Teach Critical Thinking? A Meta-Analysis. Rev. Educ. Res. 2016, 86, 431–468. [Google Scholar] [CrossRef]
- Kumar, R.; James, R. Evaluation of Critical Thinking in Higher Education in Oman. Int. J. High. Educ. 2015, 4, 33–43. [Google Scholar]
- Campo, L.; Galindo-Domínguez, H.; Bezanilla, M.J.; Fernández-Nogueira, D.; Poblete, M. Methodologies for Fostering Critical Thinking Skills from University Students’ Points of View. Educ. Sci. 2023, 13, 132. [Google Scholar] [CrossRef]
- Dumont, H.; Istance, D.; Benavides, F. (Eds.) The Nature of Learning: Using Research to Inspire Practice; OECD Publishing: Paris, France, 2010. [Google Scholar]
- Williams, M.; Uhing, K.; Bennett, A.; Voigt, M.; Funk, R.; Smith, W.M.; Donsig, A. Conceptualizations of active learning in departments engaged in instructional change efforts. Act. Learn. High. Educ. 2022. [Google Scholar] [CrossRef]
- Decius, J.; Dannowsky, J.; Schaper, N. The casual within the formal: A model and measure of informal learning in higher education. Act. Learn. High. Educ. 2022. [Google Scholar] [CrossRef]
- Alkaabi, K. Applying the Innovative Approach of Employing a Business Simulation Game and Prototype Developing Platform in an Online Flipped Classroom of an Entrepreneurial Summer Course: A Case Study of UAEU. Educ. Sci. 2023, 13, 13. [Google Scholar] [CrossRef]
- Chen, S.Y.; Tsai, J.C.; Liu, S.Y.; Chang, C.Y. The effect of a scientific board game on improving creative problem solving skills. Think. Ski. Creat. 2021, 41, 100921. [Google Scholar] [CrossRef]
- Aydin, B.; Demirer, V. Are flipped classrooms less stressful and more successful? An experimental study on college students. Int. J. Educ. Technol. High. Educ. 2022, 19, 55. [Google Scholar] [CrossRef]
- Reilly, C.; Reeves, T.C. Refining active learning design principles through design-based research. Act. Learn. High. Educ. 2020. [Google Scholar] [CrossRef]
- Freeman, S.; Eddy, S.L.; McDonough, M.; Smith, M.K.; Okoroafor, N.; Jordt, H.; Wenderoth, M.P. Active learning increases student performance in science, engineering, and mathematics. Proc. Natl. Acad. Sci. USA 2014, 111, 8410–8415. [Google Scholar] [CrossRef]
- Rodriguez-Dono, A.; Hernández-Fernández, A. Fostering Sustainability and Critical Thinking through Debate—A Case Study. Sustainability 2021, 13, 6397. [Google Scholar] [CrossRef]
- Rubilyn, G.L. Active learning reflective review: Key tore-engage students back in the classroom after a pandemic hiatus. Int. J. Res. Stud. Educ. 2022, 11, 83–88. [Google Scholar] [CrossRef]
- Attié, E.; Guibert, J.; Polle, C. Promoting student self-regulation and motivation through active learning. In Handbook of Research on Active Learning and Student Engagement in Higher Education; IGIGlobal: Hershey, PA, USA, 2022; pp. 203–226. [Google Scholar]
- Sánchez, S.L.; García-Martín, J. Elimpactopsico educativo de la metodología Flipped Classroom en la Educación Superior: Una revision teórica sistemática. Rev. Complut. De Educ. 2023, 34, 217–229. [Google Scholar] [CrossRef]
- Borte, K.; Nesje, K.; Lillejord, S. Barriers to student active learning in higher education. Teach. High. Educ. 2023, 28, 597–615. [Google Scholar] [CrossRef]
- Roe, Y.; Wojniusz, S.; Bjerke, A.H. The digital transformation of higher education teaching: Four pedagogical prescriptions to move active learning pedagogy forward. Front. Educ. 2022, 6, 583. [Google Scholar] [CrossRef]
- Fryirs, K. A pedagogy of fluvial geomorphology: Incorporating scaffolding and active learning in to tertiary education courses. Earth Surf. Process. Landf. 2022, 47, 1671–1679. [Google Scholar] [CrossRef]
- Hisey, F.; Zhu, T.; He, Y. Use of interactive storytelling trailers to engage students in an online learning environment. Act. Learn. High. Educ. 2022. [Google Scholar] [CrossRef]
- Hailikari, T.; Virtanen, V.; Vesalainen, M.; Postareff, L. Student perspectives on how different elements of constructive alignment support active learning. Act. Learn. High. Educ. 2022, 23, 217–231. [Google Scholar] [CrossRef]
- Gómez-Barreto, I.M.; Merino-Tejedor, E.; Sánchez-Santamaría, J. University Students’ Perspectives on Reflective Learning: Psychometric Properties of the Eight-Cultural-Forces Scale. Sustainability 2020, 12, 729. [Google Scholar] [CrossRef]
- Mann, R.D.; Arnold, S.M.; Binder, J.; Cytrynbaum, S.; Newman, B.M.; Ringwald, B.; Ringwald, J.; Rosenwein, R. The College Classroom: Conflict, Change, and Learning; Wiley: New York, NY, USA, 1970. [Google Scholar]
- Young, M.R.; Klemz, B.R.; Murphy, J.W. Enhancing Learning Outcomes: The Effects of Instructional Technology, Learning Styles, Instructional Methods, and Student Behaviour. J. Mark. Educ. 2003, 25, 130–142. [Google Scholar] [CrossRef]
- Higgins, N.C.; La Pointe, M.R.P. AnIndividual Differences Measure of Attributions That Affect Achievement Behavior: Actor Structure and Predictive Validity of the Academic Attributional Style Questionnaire. SAGE Open 2012, 2, 2158244012470110. [Google Scholar] [CrossRef]
- Grecu, A.L.; Hadjar, A.; Simoes, L.K. The Role of Teaching Styles in the Development of School Alienation and Behavioral Consequences: A Mixed Methods Study of Luxembourgish Primary Schools. Waste Manag. Res. 2022, 12, 2. [Google Scholar] [CrossRef]
- Abbiati, M.; Cerutti, B. Do students’ personality traits change during medical training? A longitudinal cohort study. Adv. Health Sci. Educ. 2023. [Google Scholar] [CrossRef]
- Jabkowski, P. Reprezentatywność Badań Reprezentatywnych. Analiza Wybranych Problemów Metodologicznych Oraz Praktycznych w Paradygmacie Całkowitego Błędu Pomiaru; Wydawnictwo Naukowe Uniwersytetu im Adama Mickiewicza w Poznaniu: Poznań, Poland, 2015. [Google Scholar]
- Szlosek, F. Wstęp do Dydaktyki Przedmiotów Zawodowych; Instytut Technologii Eksploatacji w Radomiu: Radom, Poland, 1995. [Google Scholar]
- González-González, I.; Jiménez-Zarco, A.I. Using learning methodologies and resources in the development of critical thinking competency: An exploratory study in a virtual learning environment. Comput. Hum. Behav. 2015, 51, 1359–1366. [Google Scholar] [CrossRef]
- Kusumoto, Y. Enhancing critical thinking through active learning. Lang. Learn. High. Educ. 2018, 8, 45–63. [Google Scholar] [CrossRef]
- Dumitru, D.; Bigu, D.; Elen, J.; Jiang, L.; Railienè, A.; Penkauskienè, D.; Papathanasiou, I.; Tsaras, K.; Fradelos, E.; Ahern, A.; et al. European Review on Critical Thinking Educational Practices in Higher Education Institutions; UTAD: VilaReal, Portugal, 2018. [Google Scholar]
- Zamir, S.; Yang, Z.; Sarwar, U.; Maqbool, S.; Fazal, K.; Ihsan, H.M.; Arif, A. Teaching methodologies used for learning critical thinking in higher education: Pakistani teachers’ perceptions. Int. Trans. J. Eng. Manag. Appl. Sci. Technol. 2021, 12, 1–10. [Google Scholar]
- Ferrer, J.; Ringer, A.; Saville, K.; Parris, M.A.; Kashi, K. Students’ motivation and engagement in higher education: The importance of attitude to online learning. High. Educ. 2022, 83, 317–338. [Google Scholar] [CrossRef]
Disclaimer/Publisher’s Note: The statements, opinions and data contained in all publications are solely those of the individual author(s) and contributor(s) and not of MDPI and/or the editor(s). MDPI and/or the editor(s) disclaim responsibility for any injury to people or property resulting from any ideas, methods, instructions or products referred to in the content. |
© 2023 by the authors. Licensee MDPI, Basel, Switzerland. This article is an open access article distributed under the terms and conditions of the Creative Commons Attribution (CC BY) license (https://creativecommons.org/licenses/by/4.0/).


