
Managing Employee Motivation in Slovak Universities from the Perspectives of Time and Age

 , ,
, ,  and
and
Abstract
1. Introduction
2. Materials and Methods
- WH1—it is assumed that the motivation of university teachers in Slovakia will be constant over time.
- WH2—it is assumed that the motivation of university teachers in Slovakia will be different in terms of age.
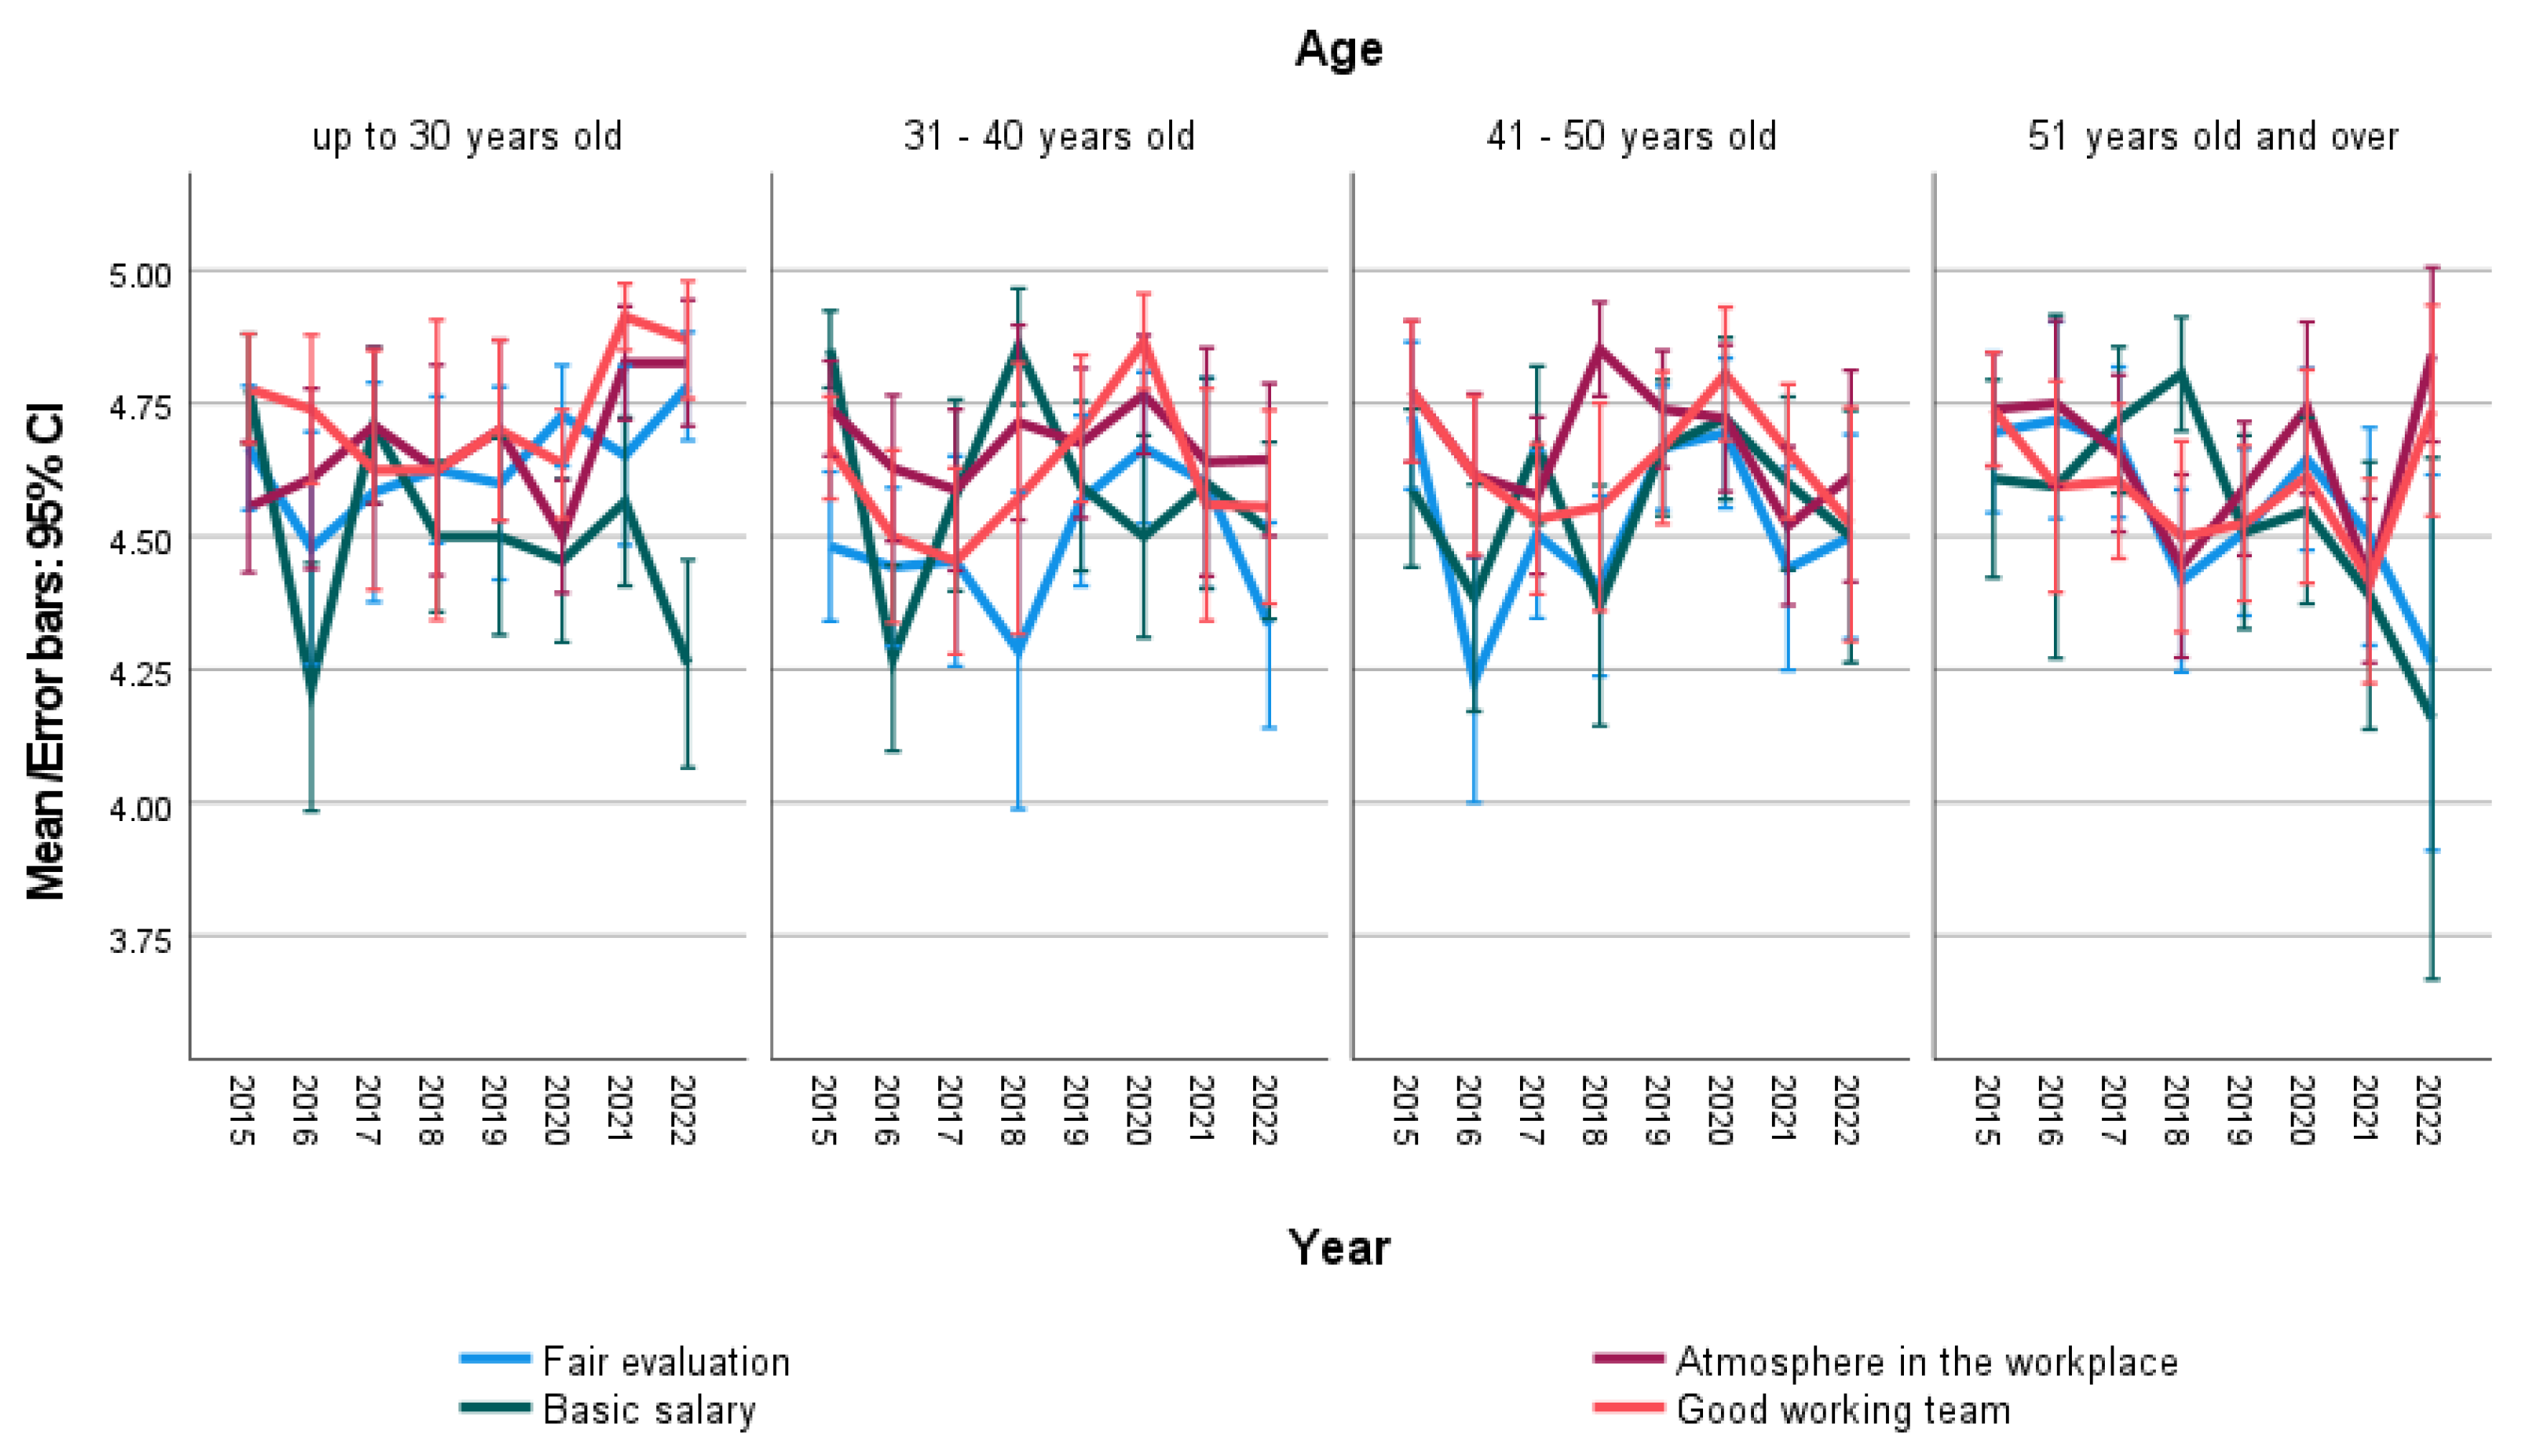
3. Results and Discussion
4. Conclusions
Author Contributions
Funding
Institutional Review Board Statement
Informed Consent Statement
Data Availability Statement
Conflicts of Interest
References
- Carpio-Pacheco, D.A.; Urbano, B. Job preferences in the agrarian sector: A gender, generation and present and future employees’ analysis. Itea-Inf. Tec. Econ. Agrar. 2021, 117, 436–448. [Google Scholar] [CrossRef]
- Sun, S.R. Public service motivation and proactive behavioral responses to change: A three-way interaction. Soc. Behav. Personal. 2021, 49, 1–15. [Google Scholar] [CrossRef]
- Young, S.; Berlan, D. We are not all the same: What motivates individuals to be members of professional associations varies by sector. Volunt. Sect. Rev. 2021, 12, 413–438. [Google Scholar] [CrossRef]
- Vnouckova, L.; Urbancova, H.; Smolova, H. Factors describing students’ perception on education quality standards. J. Effic. Responsib. Educ. Sci. 2017, 10, 109–115. [Google Scholar] [CrossRef]
- Kohnová, L.; Stacho, Z.; Salajová, N.; Stachová, K.; Papula, J. Application of agile management methods in companies operating in Slovakia and the Czech Republic. Econ. Res.-Ekon. Istraživanja 2022, 36, 2142809. [Google Scholar] [CrossRef]
- Raza, H.; Ali, A.; Rafiq, N.; Xing, L.; Asif, T.; Jing, C.J. Comparison of higher education in Pakistan and China: A sustainable development in student’s perspective. Sustainability 2023, 15, 4327. [Google Scholar] [CrossRef]
- Tuan, V.K. The role of human resources practices and the mediating effect of innovative capacity on the growth of Vietnamese enterprises. J. Hum. Resour. Manag. 2021, 24, 1–13. [Google Scholar]
- Smerek, L.; Vetrakova, M. Difference in human resources development in various types of companies. Pol. J. Manag. Stud. 2020, 21, 398–411. [Google Scholar] [CrossRef]
- Nastase, M.; Bibu, N.; Munteanu, A.I.; Mircioi, I.; Florescu, M.S. The specific elements of strategic human resources management for competitive business development. Ind. Text. 2019, 70, 579–589. [Google Scholar] [CrossRef]
- Urbancova, H.; Vrabcova, P. Age management as a human resources management strategy with a focus on the primary sector of the Czech Republic. Agric. Econ.-Zemed. Ekon. 2020, 66, 251–259. [Google Scholar] [CrossRef]
- Nobakht, S.; Shirdel, A.; Molavi-Taleghani, Y.; Doustmohammadi, M.M.; Sheikhbardsiri, H. Human resources for health: A narrative review of adequacy and distribution of clinical and nonclinical human resources in hospitals of Iran. Int. J. Health Plan. Manag. 2018, 33, 560–572. [Google Scholar] [CrossRef]
- Tamasevicius, V.; Diskiene, D.; Stankeviciene, A. Human resource management practice in Lithuania: Evidences and challenges. Montenegrin J. Econ. 2020, 16, 207–226. [Google Scholar] [CrossRef]
- Dreher, C.R.G.; Zaremski, M.; Leven, F.; Schneider, D.; Roitberg, A.; Stiefelhagen, R.; Heizmann, M.; Demi, B.; Asfour, T. Capturing and interpreting human actions for programming robots in the production. AT-AUTOMATISIERUNGSTECHNIK 2022, 70, 517–533. [Google Scholar] [CrossRef]
- Moon, T.W.; Hur, W.M.; Hyun, S.S. How service employees’ work motivations lead to job performance: The role of service employees’ job creativity and customer orientation. Curr. Psychol. 2019, 38, 517–532. [Google Scholar] [CrossRef]
- Dewi, T.; Respati, W.; Sanvenia, V. Exploring employee’s motivation and performance factors: Evidence in a 3 Star Hotel in Indonesia by Contrasting Maslow’s and Cetin’s Model. Pertanika J. Soc. Sci. Humanit. 2020, 28, 75–86. [Google Scholar]
- Ouakouak, M.L.; Zaitouni, M.G.; Arya, B. Ethical leadership, emotional leadership, and quitting intentions in public organizations: Does employee motivation play a role? Leadersh. Organ. Dev. J. 2020, 41, 257–279. [Google Scholar] [CrossRef]
- Ralevic, P.; Dobrodolac, M.; Svadlenka, L.; Sarac, D.; Duric, D. Efficiency and productivity analysis of universal service obligation: A case of 29 designated operators in the European countries. Technol. Econ. Dev. Econ. 2020, 26, 785–807. [Google Scholar] [CrossRef]
- Stacho, Z.; Stachova, K.; Caganova, D. Participation of all employee categories in innovation processes in Slovak organisations. Mob. Netw. Appl. 2020, 25, 853–859. [Google Scholar] [CrossRef]
- Farkasova, E.; Badura, R. Understandings of design in circumstances of humanity. Acta Fac. Xylologiae Zvolen 2021, 63, 143–150. [Google Scholar] [CrossRef]
- Riketta, M. The causal relation between job attitudes and performance: A metaanalysis of panel studies. J. Appl. Psychol. 2008, 93, 472–481. [Google Scholar] [CrossRef]
- Elias, S.M.; Smith, W.L.; Barney, C.E. Age as a moderator of attitudes towards technology in the workplace: Work motivation and overall job satisfaction. Behav. Inf. Technol. 2012, 31, 453–467. [Google Scholar] [CrossRef]
- Myskova, R.; Hajek, P. The effect of managerial sentiment on market-to-book ratio. Transform. Bus. Econ. 2016, 15, 498–513. [Google Scholar]
- Musa, H.; Rech, F.; Chen, Y.; Musova, Z. The deterioration of financial ratios during the COVID-19 pandemic: Does corporate governance matter? Folia Oeconomica Stetin. 2022, 22, 219–242. [Google Scholar] [CrossRef]
- Kicová, E.; Poniščiaková, O. Concept of BSC system and its use in strategic management of business transport enterprise in SR. Perner’s Contacts 2020, 15, 2020. [Google Scholar] [CrossRef]
- Lazarevic, D.; Dobrodolac, M.; Svadlenka, L.; Stanivukovic, B. A model for business performance improvement: A case of the postal company. J. Bus. Econ. Manag. 2020, 21, 564–592. [Google Scholar] [CrossRef]
- Pancasila, I.; Haryono, S.; Sulistyo, B.A. Effects of work motivation and leadership toward work satisfaction and employee performance: Evidence from Indonesia. J. Asian Financ. Econ. Bus. 2020, 7, 387–397. [Google Scholar] [CrossRef]
- Jankelova, N.; Joniakova, Z.; Romanova, A.; Remenova, K. Motivational factors and job satisfaction of employees in agriculture in the context of performance of agricultural companies in Slovakia. Agric. Econ. 2020, 66, 402–412. [Google Scholar] [CrossRef]
- Chiu, H.H. Employees’ intrinsic and extrinsic motivations in innovation implementation: The moderation role of managers’ persuasive and assertive strategies. J. Chang. Manag. 2018, 18, 218–223. [Google Scholar] [CrossRef]
- James, C. Organising in schools: It’s all about emotion. In Emotion Management and Feelings in Teaching and Educational Leadership: A cultural Perspective; Oplatka, I., Arar, K., Eds.; Emerald Publishing: Binglay, UK, 2019; pp. 25–41. [Google Scholar] [CrossRef]
- Giurge, L.M.; Woolley, K. Working during non-standard work time undermines intrinsic motivation. Organ. Behav. Hum. Decis. Process. 2022, 170, 104134. [Google Scholar] [CrossRef]
- Monnot, M.J. The effect of incentives on intrinsic motivation and employee attitudes: A multilevel study across nations and cultural clusters. Thunderbird Int. Bus. Rev. 2018, 60, 675–689. [Google Scholar] [CrossRef]
- Vo, T.T.D.; Tuliao, K.V.; Chen, C.W. Work motivation: The roles of individual needs and social conditions. Behav. Sci. 2022, 12, 49. [Google Scholar] [CrossRef]
- Bogdanovic, M.; Durian, J.; Cingula, D. HRM choices for business strategy support: How to resolve the most important hrm strategic dilemmas? In Proceedings of the International Scientific Conference on Economic and Social Development—Human Resources Development, Varazdin, Croatia, 9–10 June 2016.
- Wahba, M.A.; Bridwell, L.G. Maslow reconsidered: A review of research on the need hierarchy theory. Organ. Behav. Hum. Perform. 1976, 15, 212–240. [Google Scholar] [CrossRef]
- Lee, M.T.; Raschke, R.L. Understanding employee motivation and organizational performance: Arguments for a set-theoretic approach. J. Innov. Knowl. 2016, 1, 162–169. [Google Scholar] [CrossRef]
- Bushi, F. An overview of motivation theories: The impact of employee motivation on achieving organizational goals. Qual. Access Success 2021, 22, 8–12. [Google Scholar]
- Parker, S.L.; Dawson, N.; Van den Broeck, A.; Sonnentag, S.; Neal, A. Employee motivation profiles, energy levels, and approaches to sustaining energy: A two-wave latent-profile analysis. J. Vocat. Behav. 2021, 131, 103659. [Google Scholar] [CrossRef]
- Jankelova, N.; Joniakova, Z.; Misun, J. Innovative work behavior-A key factor in business performance? The role of team cognitive diversity and teamwork climate in this relationship. J. Risk Financ. Manag. 2021, 14, 240. [Google Scholar] [CrossRef]
- Olexova, C.; Sudzina, F. Gender and personality traits’ (BFI-10) effect on trust. In Proceedings of the International Scientific Conference of Business Economics, Management and Marketing, Zajecí, Czech Republic, 25–26 May 2017. [Google Scholar]
- Mura, L.; Zsigmond, T.; Machová, R. The effects of emotional intelligence and ethics of SME employees on knowledge sharing in Central-European countries. Oeconomia Copernic. 2021, 12, 907–934. [Google Scholar] [CrossRef]
- Kreps, G. Organizational Communication, 2nd ed.; Longman: White Plains, NY, USA, 1990; p. 155. [Google Scholar]
- Abuhamdeh, S.; Csikszentmihalyi, M. Attentional involvement and intrinsic motivation. Motiv. Emot. 2012, 36, 257–267. [Google Scholar] [CrossRef]
- Mikkelsen, M.F.; Jacobsen, C.B.; Andersen, L.B. Managing employee motivation: Exploring the connections between managers’ enforcement actions, employee perceptions, and employee intrinsic motivation. Int. Public Manag. J. 2017, 20, 183–205. [Google Scholar] [CrossRef]
- Cinar, O. A motivation on the effectiveness of intrinsic and extrinsic factors. Econ. Manag. 2011, 16, 690–695. [Google Scholar]
- Grofcikova, J.; Musa, H. The impact of the board process on board and corporate performance: The case of Slovakia. Probl. Perspect. Manag. 2020, 18, 366–381. [Google Scholar] [CrossRef]
- Kantzell, R.A.; Thompson, D.E. Work motivation: Theory and practice. Am. Psychol. 1990, 45, 144–152. [Google Scholar] [CrossRef]
- Sadhna, P.; Gupta, S.; Rastogi, S. Key motivators for driving work performance amid COVID-19 in developing nations. Int. J. Work Organ. Emot. 2020, 11, 105–119. [Google Scholar] [CrossRef]
- Ariani, D.W. Job stress, motivation, and job performance: Direct and indirect relationship. J. Hum. Resour. Manag. 2021, 24, 1–11. [Google Scholar]
- Vivek, B.; Sweksha, R. Impact of employees motivation on job satisfaction and organizational commitment at Balco. Glob. J. Eng. Sci. Res. Manag. 2018, 5, 45–58. [Google Scholar] [CrossRef]
- Sekova, M.; Vetrakova, M.; Durian, J. The proposal of intercultural competency model of managers in multinational companies globalization and its socio-economic consequences. In Proceedings of the International Scientific Conference on Globalization and its Socio-Economic Consequences, Rajecke Teplice, Slovakia, 5–6 October 2016. [Google Scholar]
- Lolowang, N.L.; Troena, E.A.; Djazuli, A.; Aisjah, S. The effect of leadership and organizational culture on employee performance that is educated by motivation (study on the implementation empowerment programs in Jayapura city). Eur. J. Train. Dev. 2019, 17, 268–277. [Google Scholar] [CrossRef]
- Chahar, B. Performance appraisal systems and their impact on employee performance: The moderating role of employee motivation. Inf. Resour. Manag. J. 2020, 33, 17–32. [Google Scholar] [CrossRef]
- Zhang, W.P.; Guo, S.S.; Liu, J.S.; He, Y.; Song, M.M.; Chen, L.R. Linking emotion regulation strategies to employee motivation: The mediating role of guanxi harmony in the Chinese context. Front. Psychol. 2022, 13, 837144. [Google Scholar] [CrossRef]
- Ciobanu, A.; Androniceanu, A.; Lazaroiu, G. An integrated psycho-sociological perspective on public employees’ motivation and performance. Front. Psychol. 2019, 10, 36. [Google Scholar] [CrossRef]
- Bhuvaneswari, G.; Vijayarajakumar, P. Impact of factors of motivation on employee motivation in higher educational institutions in coimbatore, India. Smart-J. Bus. Manag. Stud. 2021, 17, 26–35. [Google Scholar] [CrossRef]
- Vetráková, M.; Smerek, L. Competitiveness of Slovak enterprises in Central and Eastern European region. E+M Ekon. A Manag. 2019, 22, 36–51. [Google Scholar] [CrossRef]
- Yaghoubinejad, H.; Zarrinabadi, N.; Nejadansari, D. Culture-specificity of teacher demotivation: Iranian junior high school teachers caught in the newly-introduced CLT trap! Teach. Teach. 2017, 23, 127–140. [Google Scholar] [CrossRef]
- Mokretsova, L.A.; Sychev, O.A.; Bespalov, A.M.; Vlasov, M.S.; Prudnikova, M.M. Teachers’ autonomous motivation and work engagement: The role of the principal’s democratic leadership style and psychological climate. Obraz. I Nauka-Educ. Sci. 2021, 23, 115–141. [Google Scholar] [CrossRef]
- Fjendbo, T.H. Leading employees of different genders: The importance of gender for the leadership-motivation relationship. Rev. Public Pers. Adm. 2021, 41, 651–673. [Google Scholar] [CrossRef]
- Forson, J.A.; Ofosu-Dwamena, E.; Opoku, R.A.; Adjavon, S.E. Employee motivation and job performance: A study of basic school teachers in Ghana. Future Bus. J. 2021, 7, 30. [Google Scholar] [CrossRef]
- Engidaw, E.E. The effect of motivation on employee engagement in public sectors: In the case of North Wollo zone. J. Innov. Entrep. 2021, 10, 43. [Google Scholar] [CrossRef]
- Curry, G.D. Supervising Across Generations. In Security Supervision and Management; Davies, S.J., Hertig, C.A., Gilbride, B.P., Eds.; Butterworth: Oxford, UK, 2015. [Google Scholar]
- Kupperschmidt, B.R. Multigenerational employees: Strategies for effective management. Health Care Manag. 2000, 19, 65–76. [Google Scholar] [CrossRef]
- Meece, J.L.; Glienke, B.B.; Burg, S. Gender and motivation. J. Sch. Psychol. 2006, 44, 351–373. [Google Scholar] [CrossRef]
- Urbancova, H.; Vrabcova, P. Factors influencing the setting of educational processes in the context of age management and CSR. Econ. Sociol. 2020, 13, 218–229. [Google Scholar] [CrossRef]
- Tarí, J.J.; Pereira-Moliner, J.; Molina-Azorín, J.F.; López-Gamero, M.D. A taxonomy of quality standard adoption: Its relationship with quality management and performance in tourism organizations in Spain. J. Tour. Serv. 2020, 21, 22–37. [Google Scholar] [CrossRef]
- Metzker, Z.; Zvarikova, K. The Perception of company employees by SMEs with CSR concept implementation. Int. J. Entrep. Knowl. 2021, 9, 81–96. [Google Scholar] [CrossRef]
- Stacho, Z.; Stachova, K.; Hudakova, M.; Stasiak-Betlejewska, R. Employee adaptation as key activity in human resource management upon implementing and maintaining desired organisational culture. Serb. J. Manag. 2017, 12, 305–315. [Google Scholar] [CrossRef]
- Czaplicka-Kozlowka, I.Z.; Stachowska, S. Factors shaping engagement of employees on the example of university workers. Manag. Theory Stud. Rural Bus. Infrastruct. Dev. 2018, 40, 455–466. [Google Scholar] [CrossRef]
- Kucharcikova, A.; Miciak, M. The application of human capital efficiency management towards the increase of performance and competitiveness in an enterprise operating in the field of distribution logistics. Nase More 2018, 65, 276–283. [Google Scholar] [CrossRef]
- Tohidian, I.; Abbaspour, A. Employees’ decision-making power in universities: Employees’ right or taken for granted realities? Cogent Bus. Manag. 2020, 7, 1785107. [Google Scholar] [CrossRef]
- Lei, D.Y.; Cheng, J.H.; Chen, C.M.; Huang, K.P.; Chou, C.J. Discussion of teaching with multiple intelligences to corporate employees’ learning achievement and learning motivation. Front. Psychol. 2021, 12, 770473. [Google Scholar] [CrossRef]
- Hassan, S.; Ansari, N.; Rehman, A.; Moazzam, A. Understanding public service motivation, workplace spirituality and employee well-being in the public sector. Int. J. Ethics Syst. 2022, 38, 147–172. [Google Scholar] [CrossRef]
- Weske, U.; Schott, C. What motivates different groups of public employees working for dutch municipalities? Combining autonomous and controlled types of motivation. Rev. Public Pers. Adm. 2018, 38, 415–430. [Google Scholar] [CrossRef]
- de Reuver, R.; Van de Voorde, K.; Kilroy, S. When do bundles of high performance work systems reduce employee absenteeism? The moderating role of workload. Int. J. Hum. Resour. Manag. 2021, 32, 2889–2909. [Google Scholar] [CrossRef]
- Murangi, A.; Bailey, L. Employee engagement of special needs teachers in Windhoek, Namibia: The moderating role of job crafting. SA J. Ind. Psychol. 2022, 48, a1964. [Google Scholar] [CrossRef]
- Kim, E.J.; Park, S.; Kang, H.S. Support, training readiness and learning motivation in determining intention to transfer. Eur. J. Train. Dev. 2019, 43, 306–321. [Google Scholar] [CrossRef]
- Ashraf, M.A. The mediating role of work atmosphere in the relationship between supervisor cooperation, career growth and job satisfaction. J. Workplace Learn. 2019, 31, 78–94. [Google Scholar] [CrossRef]
- Jankelova, N.; Joniakova, Z.; Cajkova, A.; Romanova, A. Leadership competencies in communal policy. J. Political Sci. 2021, 24, 181–204. [Google Scholar] [CrossRef]
- Shafagatova, A.; Van Looy, A.; Shamasbi, S.M. Uncovering the combined impact of process characteristics and reward types on employees’ job satisfaction: A European quantitative study. Sage Open 2023, 13, 21582440231160125. [Google Scholar] [CrossRef]
- Mahmoud, A.B.; Fuxman, L.; Mohr, I.; Reisel, W.D.; Grigoriou, N. “We aren’t your reincarnation!” workplace motivation across X, Y and Z generations. Int. J. Manpow. 2021, 42, 193–209. [Google Scholar] [CrossRef]
- Munir, Z.A.; Shukor, S.A.M.; Sundram, V.P.K.; Dzulkipli, M.R.; Shaharudin, N. Engaging the echo boomer: Teamwork at workplace. Adv. Sci. Lett. 2017, 23, 10519–10523. [Google Scholar] [CrossRef]
- Rynes, S.L.; Gerhart, B.; Minette, K.A. The importance of pay in employee motivation: Discrepancies between what people say and what they do. Hum. Resour. Manag. 2004, 43, 381–394. [Google Scholar] [CrossRef]
- Casuneanu, C. The Romanian employee motivation system: An empirical analysis. Int. J. Math. Model. Methods Appl. Sci. 2011, 5, 931–938. [Google Scholar]
- Pruneda, G. Determinantes y evolución de la motivación de los trabajadores en un contexto de crisis económica. El caso de España. Pap. Rev. Sociol. 2014, 99, 41–72. [Google Scholar] [CrossRef]
- Sánchez-Sellero, M.C.; Sánchez-Sellero, P.; Cruz-González, M.M.; Sánchez-Sellero, F.J. Determinants of job satisfaction in the Spanish wood and paper industries: A comparative study across Spain. Drv. Ind. 2018, 69, 71–80. [Google Scholar] [CrossRef]
- Al-Madi, F.N.; Assal, H.; Shrafat, F.; Zaglat, D. The impact of employee motivation on organizational commitment. Eur. J. Bus. Manag. 2017, 9, 134–145. [Google Scholar]
- Ozturk Akar, E. Motivations of Turkish pre-service teachers to choose teaching as a career. Aust. J. Teach. Educ. 2012, 37. [Google Scholar] [CrossRef]
- Rasheed, M.I.; Humayon, A.A.; Awan, U.; ud Din Ahmed, A. Factors affecting teachers’ motivation An HRM challenge for public sector higher educational institutions of Pakistan (HEIs). Int. J. Educ. Manag. 2016, 30, 101–114. [Google Scholar] [CrossRef]


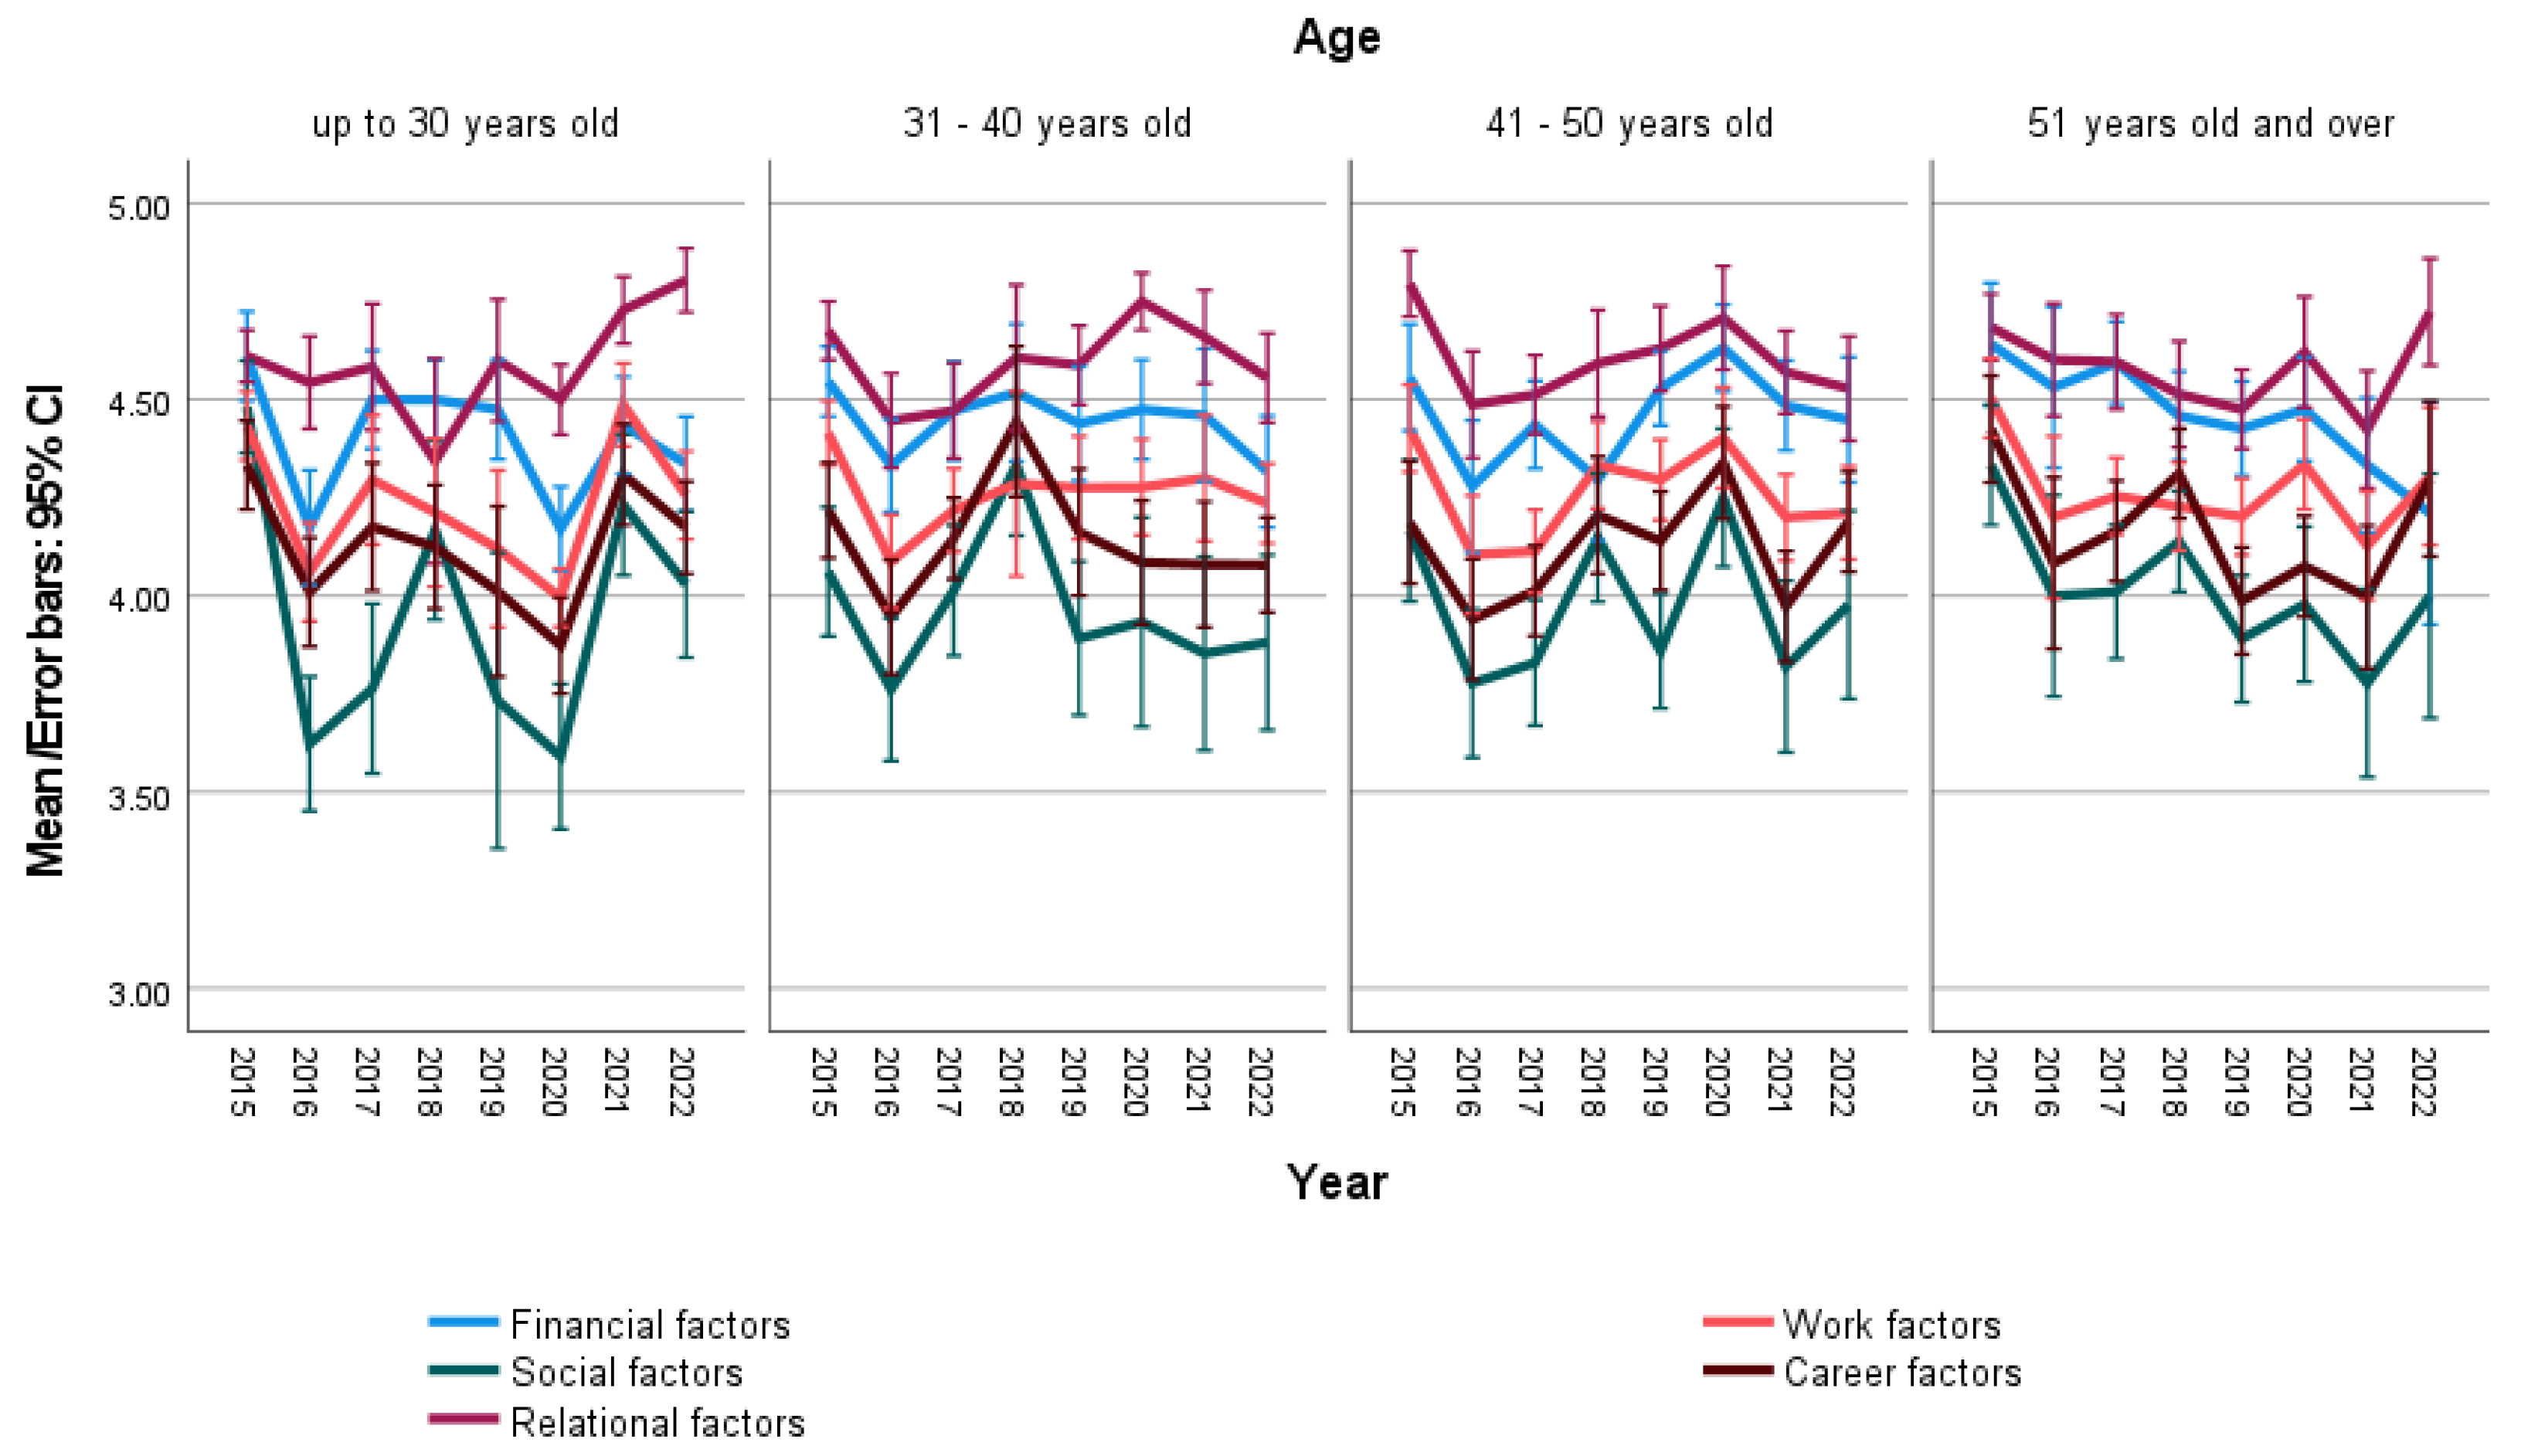
| Age | Total | ||||||
|---|---|---|---|---|---|---|---|
| Up to 30 Years Old | 31–40 Years Old | 41–50 Years Old | 51 Years Old and Over | ||||
| Year | 2015 | Count | 66 | 96 | 61 | 69 | 292 |
| % within Year | 22.6% | 32.9% | 20.9% | 23.6% | 100.0% | ||
| 2016 | Count | 58 | 86 | 75 | 33 | 252 | |
| % within Year | 23.0% | 34.1% | 29.8% | 13.1% | 100.0% | ||
| 2017 | Count | 40 | 79 | 88 | 66 | 273 | |
| % within Year | 14.7% | 28.9% | 32.2% | 24.2% | 100.0% | ||
| 2018 | Count | 51 | 43 | 66 | 93 | 253 | |
| % within Year | 20.2% | 17.0% | 26.1% | 36.8% | 100.0% | ||
| 2019 | Count | 32 | 56 | 83 | 78 | 249 | |
| % within Year | 12.9% | 22.5% | 33.3% | 31.3% | 100.0% | ||
| 2020 | Count | 89 | 58 | 55 | 51 | 253 | |
| % within Year | 35.2% | 22.9% | 21.7% | 20.2% | 100.0% | ||
| 2021 | Count | 81 | 43 | 67 | 52 | 243 | |
| % within Year | 33.3% | 17.7% | 27.6% | 21.4% | 100.0% | ||
| 2022 | Count | 67 | 63 | 49 | 22 | 201 | |
| % within Year | 33.3% | 31.3% | 24.4% | 10.9% | 100.0% | ||
| Total | Count | 484 | 524 | 544 | 464 | 2016 | |
| % within Year | 24.0% | 26.0% | 27.0% | 23.0% | 100.0% | ||
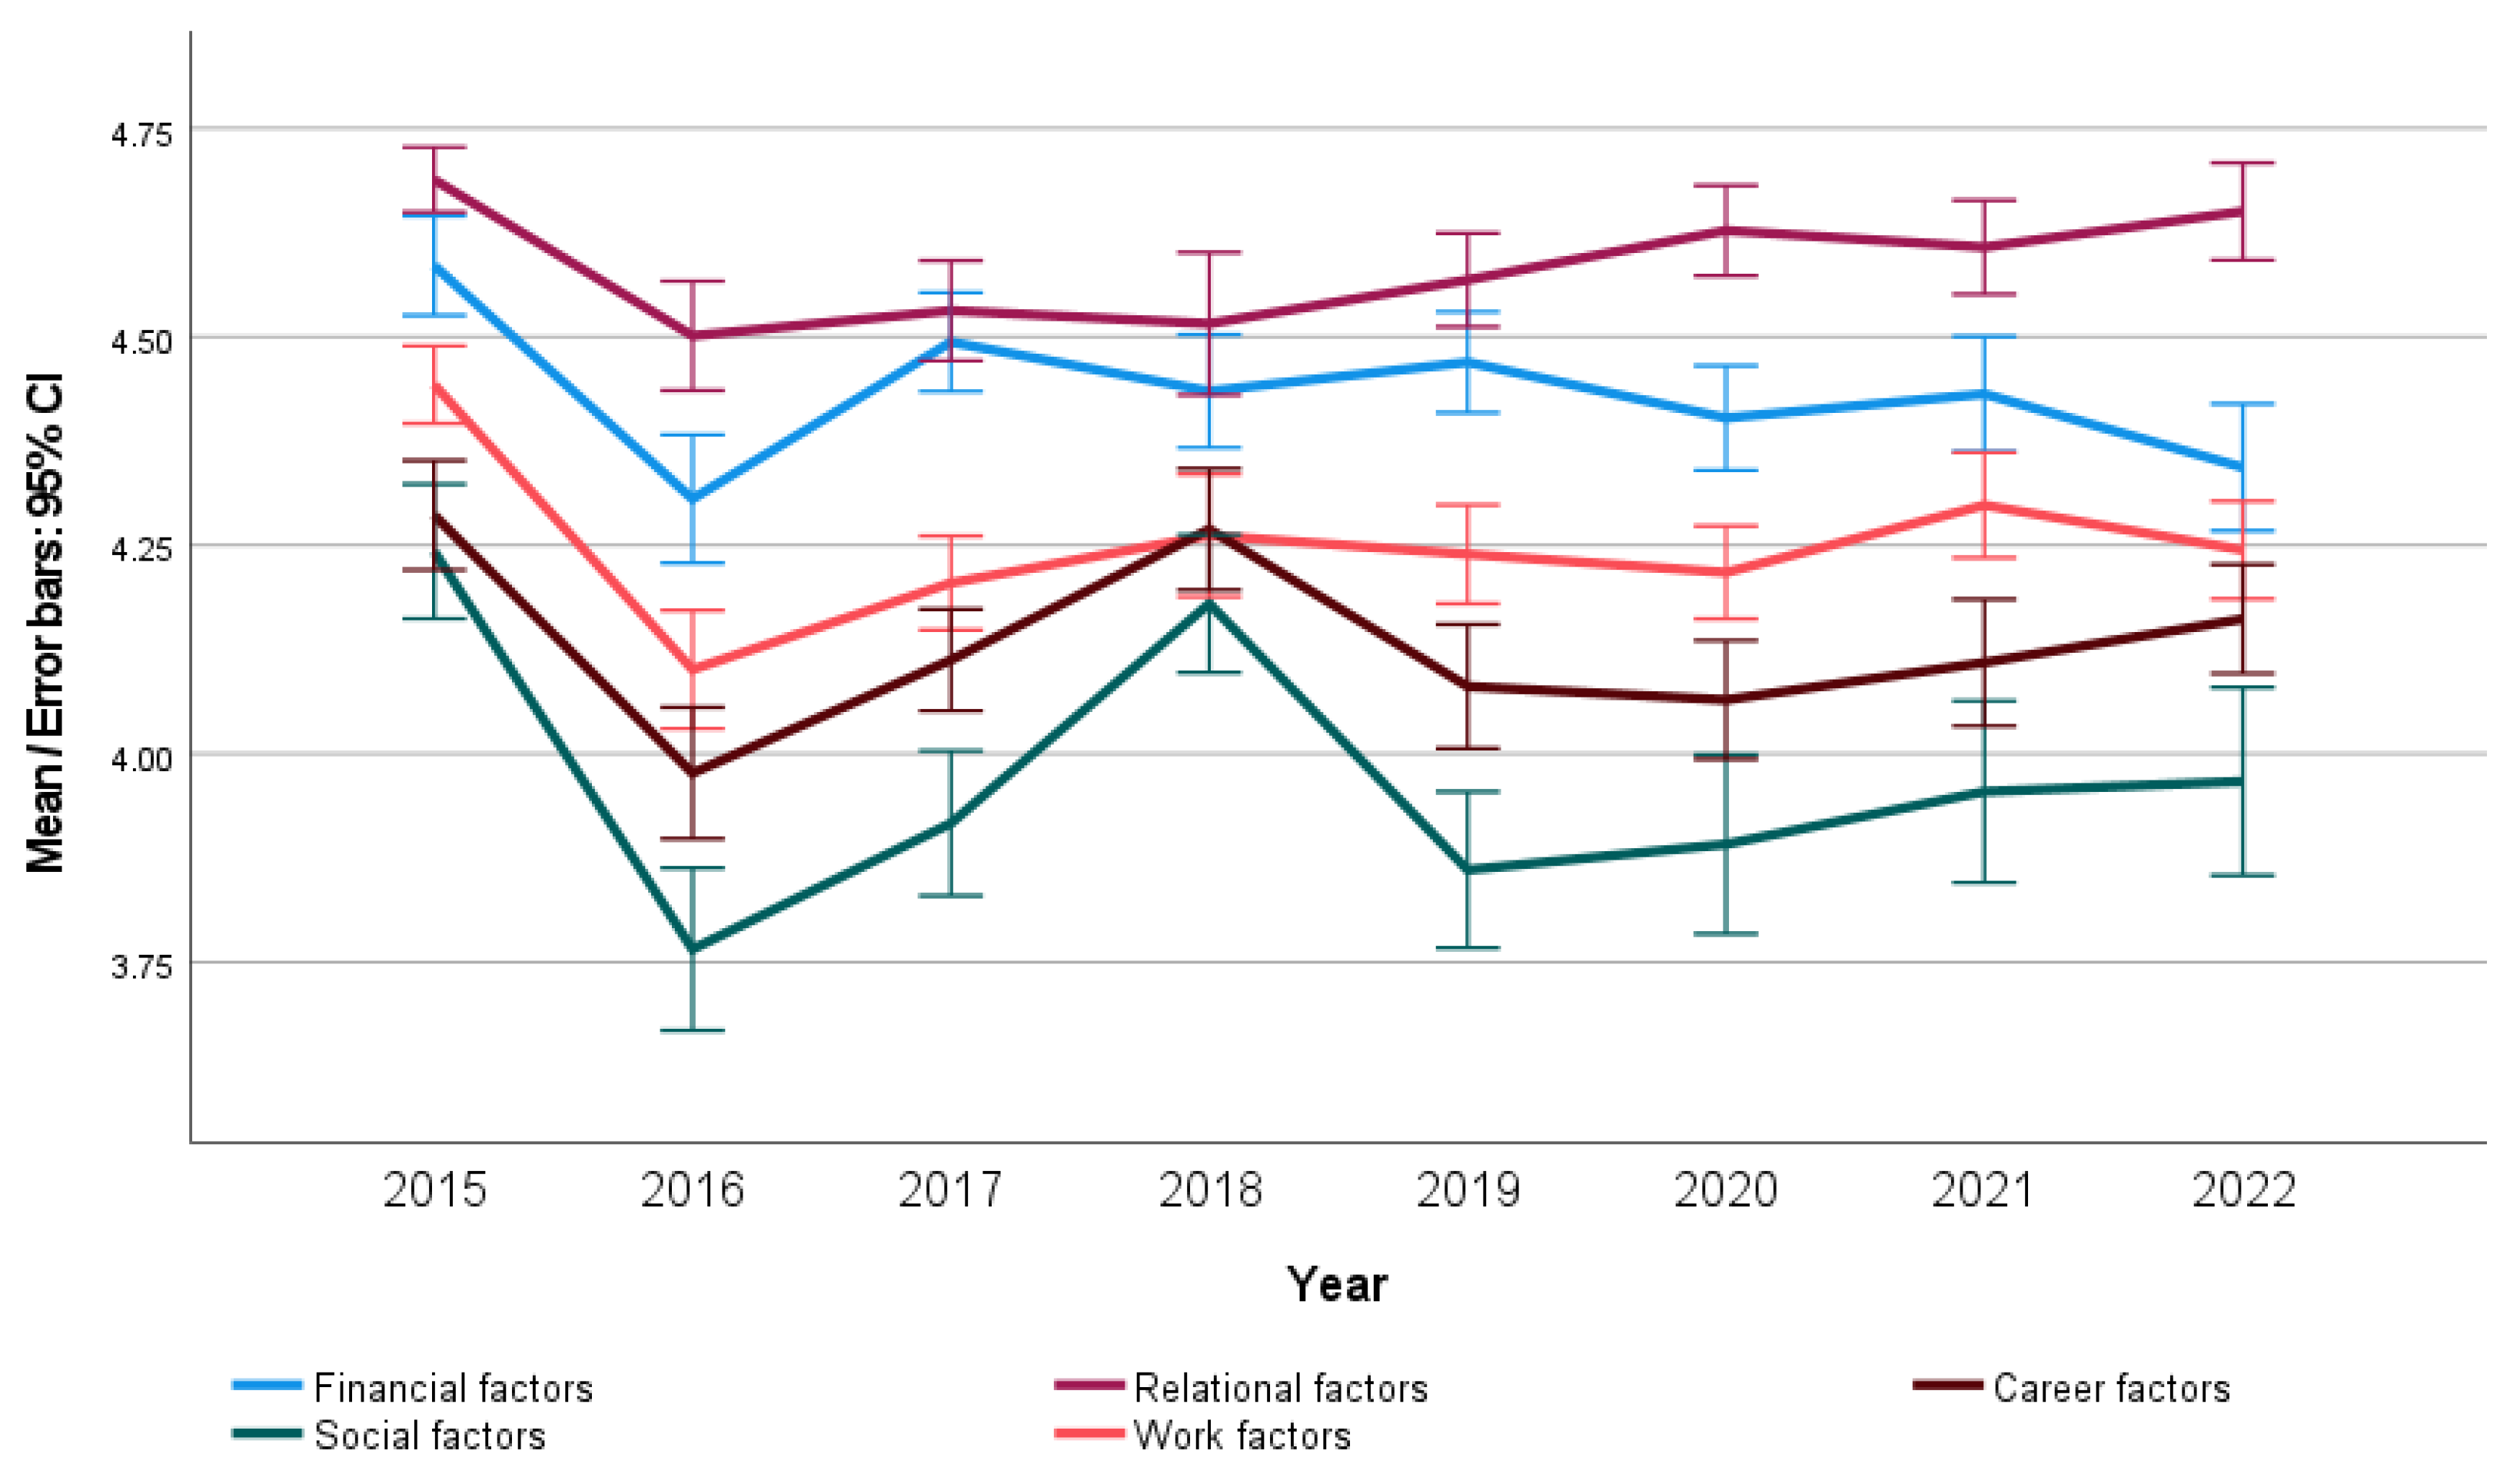
| Year | Financial Factors | Social Factors | Relational Factors | Work Factors | Career Factors |
|---|---|---|---|---|---|
| 2015 | 4.5855 | 4.2426 | 4.6885 | 4.4427 | 4.2863 |
| 2016 | 4.3057 | 3.7657 | 4.5013 | 4.1012 | 3.9769 |
| 2017 | 4.4938 | 3.9167 | 4.5314 | 4.2049 | 4.1125 |
| 2018 | 4.4349 | 4.1800 | 4.5159 | 4.2619 | 4.2693 |
| 2019 | 4.4695 | 3.8608 | 4.5682 | 4.2394 | 4.0808 |
| 2020 | 4.4028 | 3.8916 | 4.6275 | 4.2175 | 4.0647 |
| 2021 | 4.4315 | 3.9546 | 4.6076 | 4.2982 | 4.1094 |
| 2022 | 4.3436 | 3.9669 | 4.6504 | 4.2444 | 4.1617 |
| Total | 4.4392 | 3.9775 | 4.5861 | 4.2545 | 4.1349 |
| p-value (ANOVA) | <0.001 | <0.001 | <0.001 | <0.001 | <0.001 |
| Eta-squared | 0.024 | 0.039 | 0.017 | 0.036 | 0.030 |
| Age | Year | Year | |||||||
|---|---|---|---|---|---|---|---|---|---|
| 2015 | 2016 | 2017 | 2018 | 2019 | 2020 | 2021 | 2022 | ||
| Up to 30 years old | 2015 | 0.000 * | 0.888 | 0.823 | 0.740 | 0.000 * | 0.425 | 0.026 * | |
| 2016 | 0.000 * | 0.021 * | 0.009 * | 0.046 * | 1.000 | 0.127 | 0.673 | ||
| 2017 | 0.888 | 0.021 * | 1.000 | 1.000 | 0.003 * | 0.995 | 0.562 | ||
| 2018 | 0.823 | 0.009 * | 1.000 | 1.000 | 0.000 * | 0.992 | 0.431 | ||
| 2019 | 0.740 | 0.046 * | 1.000 | 1.000 | 0.009 * | 1.000 | 0.752 | ||
| 2020 | 0.000 * | 1.000 | 0.003 * | 0.000 * | 0.009 * | 0.034 * | 0.449 | ||
| 2021 | 0.425 | 0.127 | 0.995 | 0.992 | 1.000 | 0.034 * | 0.949 | ||
| 2022 | 0.026 | 0.673 | 0.562 | 0.431 | 0.752 | 0.449 | 0.949 | ||
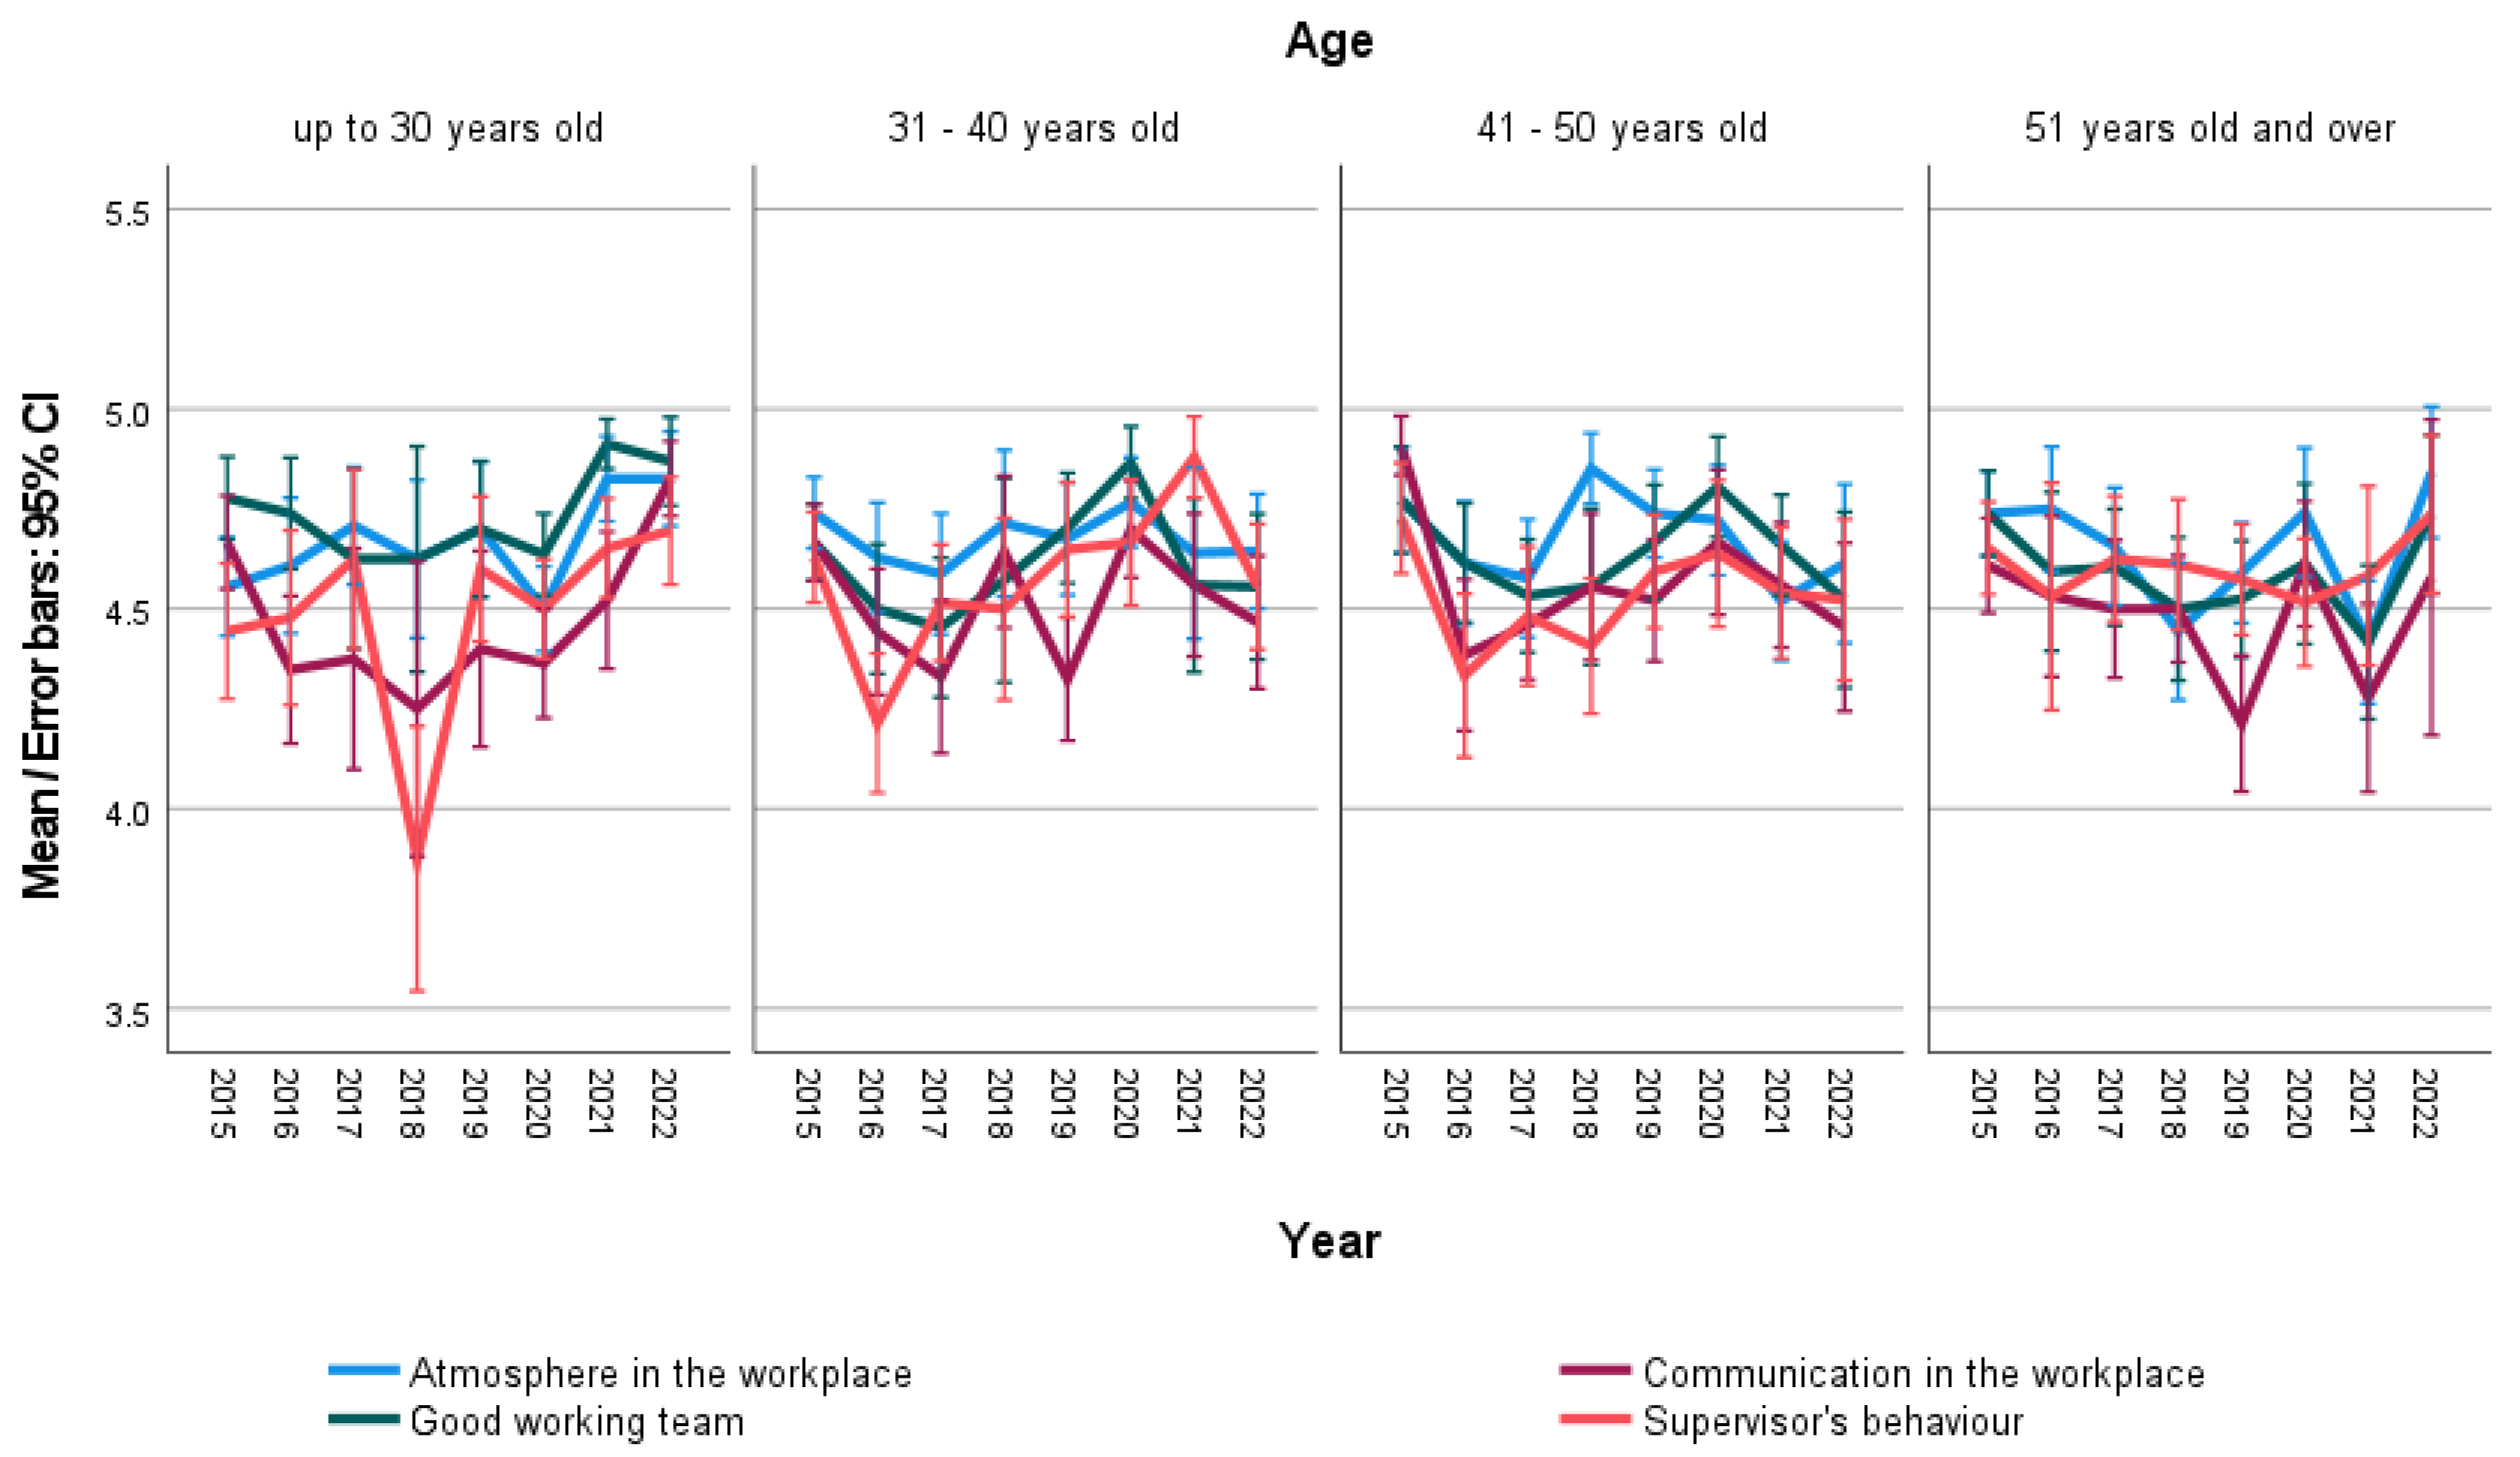
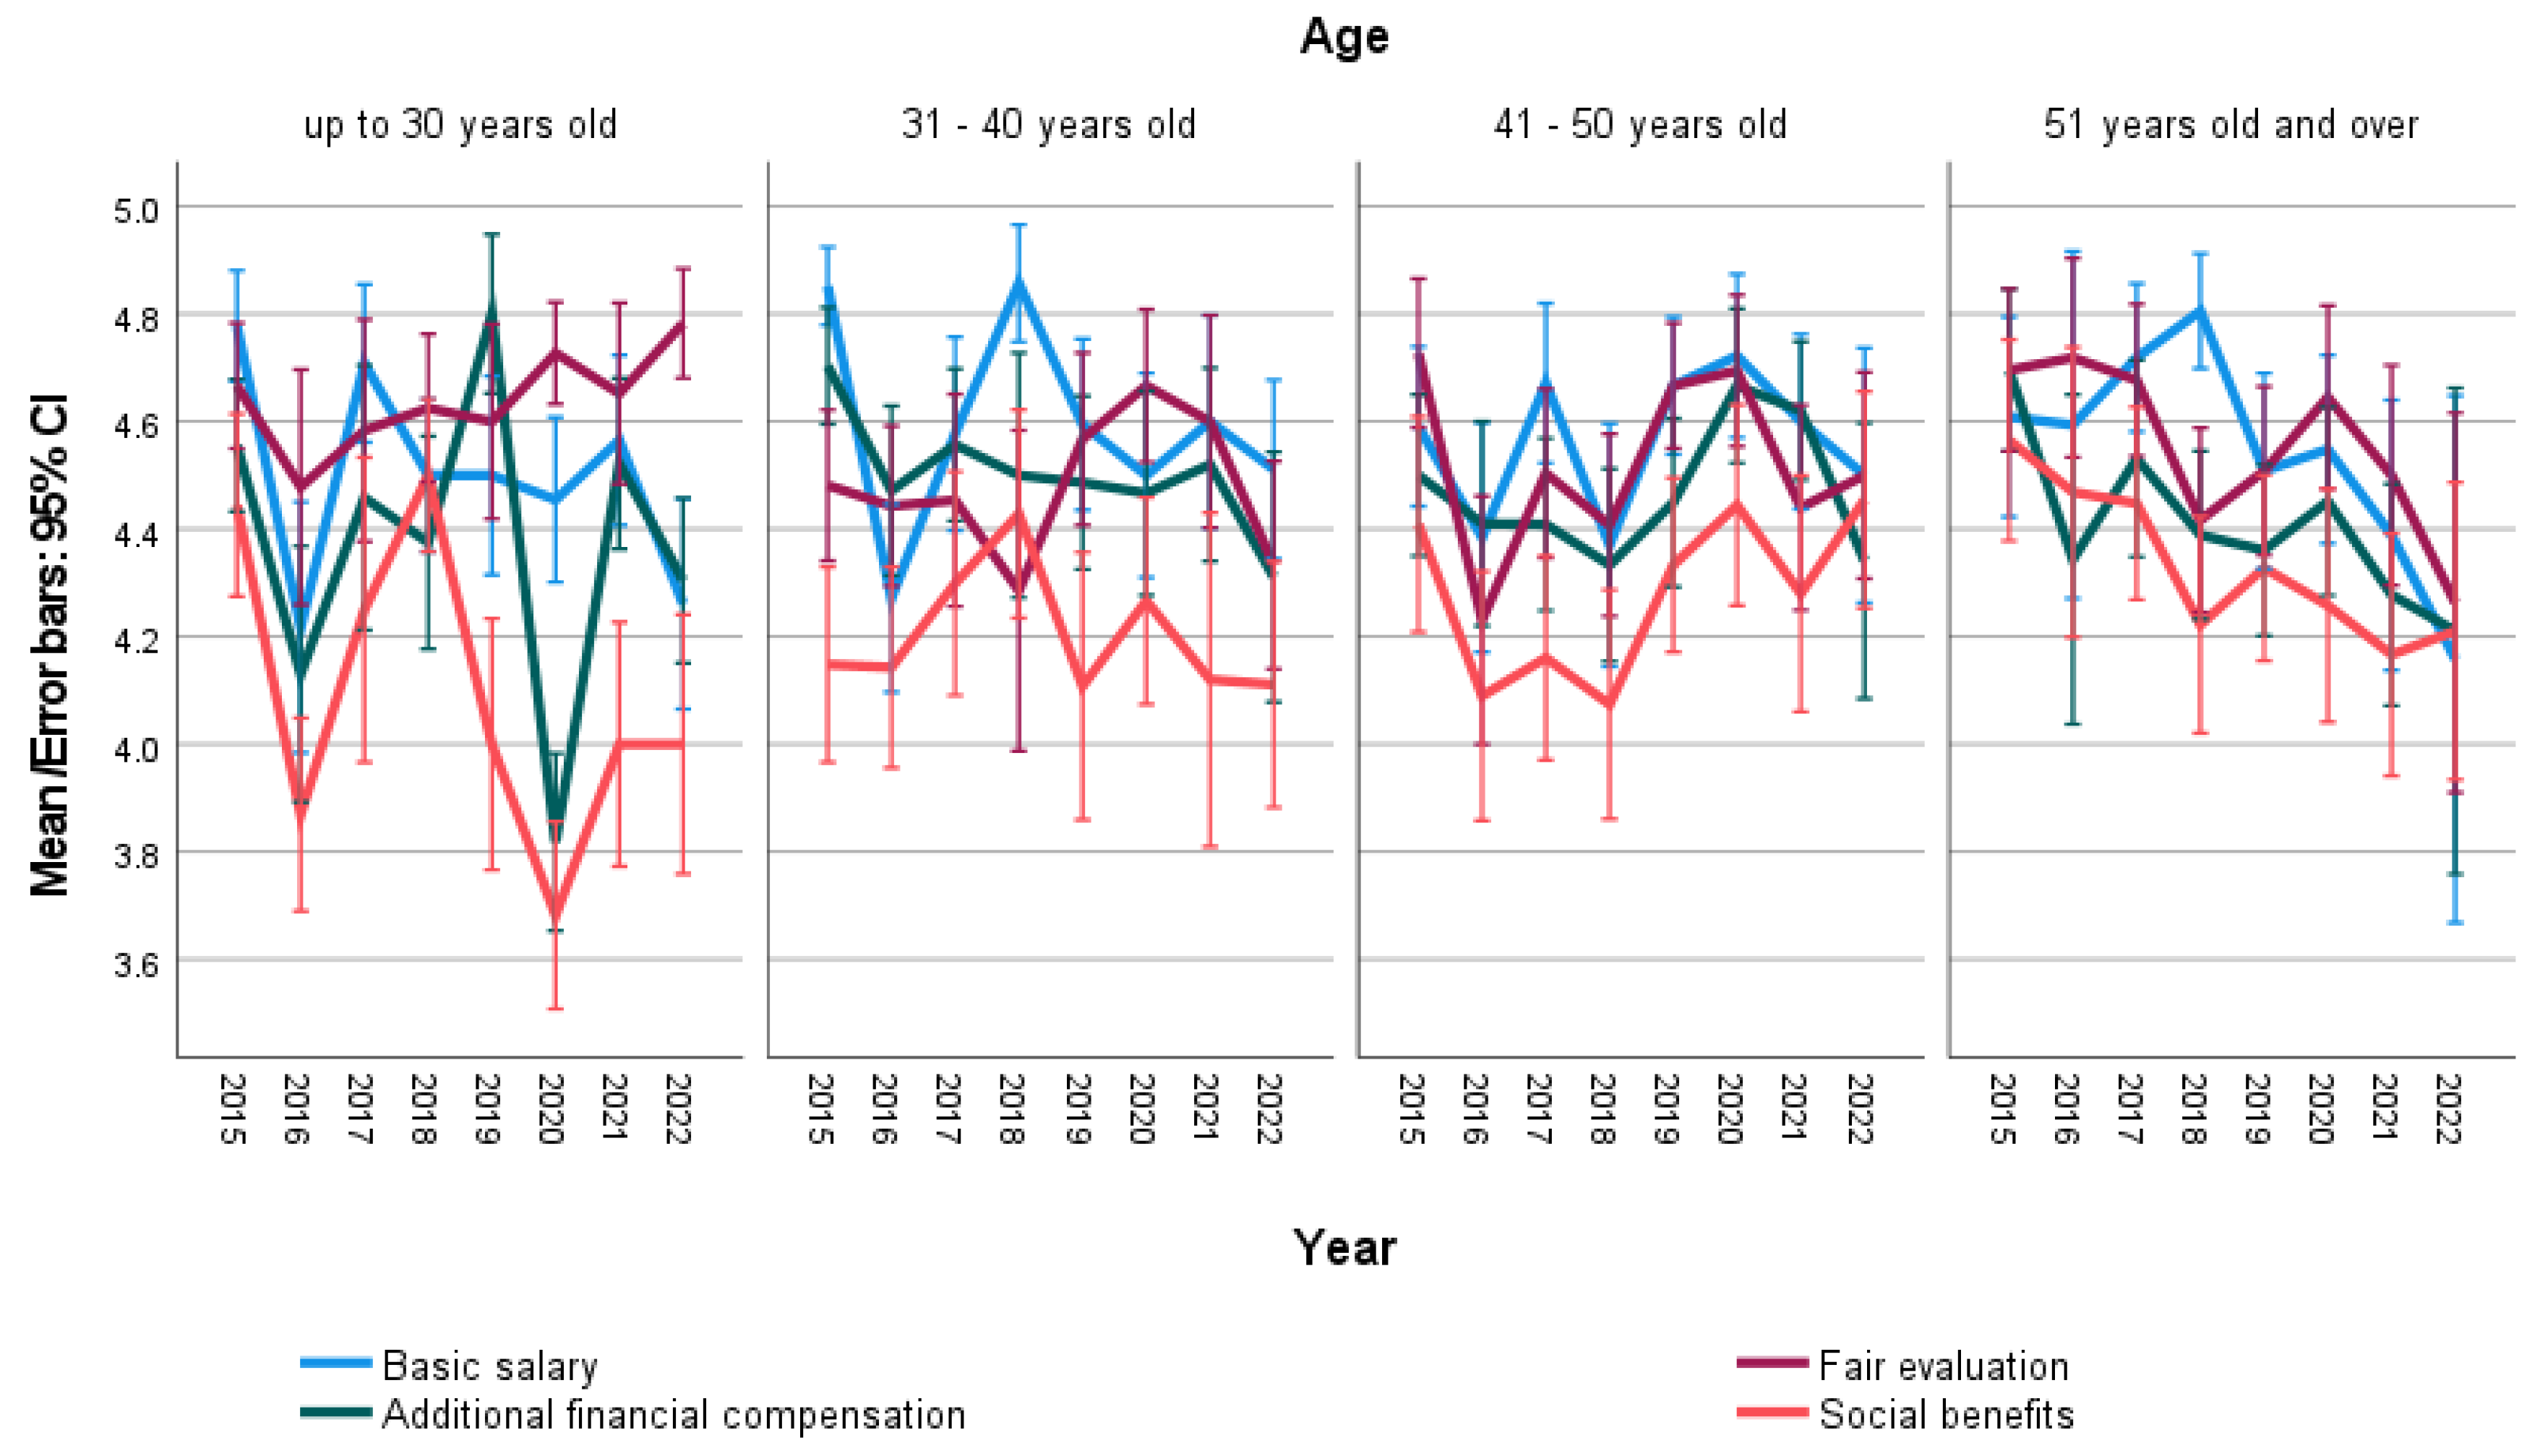
| Year | Atmosphere in the Workplace | Good Work Team | Communication in the Workplace | Supervisor’s Approach | Fringe Benefits | Fair Appraisal System | Basic Salary | Social Benefits |
|---|---|---|---|---|---|---|---|---|
| 2015 | 4.71 | 4.73 | 4.70 | 4.61 | 4.63 | 4.63 | 4.72 | 4.37 |
| 2016 | 4.64 | 4.60 | 4.42 | 4.35 | 4.36 | 4.42 | 4.33 | 4.11 |
| 2017 | 4.62 | 4.54 | 4.42 | 4.55 | 4.49 | 4.54 | 4.66 | 4.28 |
| 2018 | 4.63 | 4.55 | 4.49 | 4.39 | 4.39 | 4.43 | 4.64 | 4.27 |
| 2019 | 4.67 | 4.63 | 4.36 | 4.60 | 4.47 | 4.59 | 4.58 | 4.24 |
| 2020 | 4.66 | 4.72 | 4.56 | 4.57 | 4.28 | 4.69 | 4.54 | 4.10 |
| 2021 | 4.62 | 4.68 | 4.49 | 4.65 | 4.50 | 4.55 | 4.54 | 4.13 |
| 2022 | 4.72 | 4.67 | 4.60 | 4.61 | 4.30 | 4.52 | 4.39 | 4.17 |
| Total | 4.66 | 4.64 | 4.50 | 4.54 | 4.43 | 4.55 | 4.56 | 4.21 |
| Age | Year | Year | |||||||
|---|---|---|---|---|---|---|---|---|---|
| 2015 | 2016 | 2017 | 2018 | 2019 | 2020 | 2021 | 2022 | ||
| Up to 30 years old | 2015 | 1.000 | 0.746 | 0.999 | 0.855 | 0.997 | 0.025 * | 0.040 * | |
| 2016 | 1.000 | 0.986 | 1.000 | 0.994 | 0.959 | 0.380 | 0.421 | ||
| 2017 | 0.746 | 0.986 | 0.997 | 1.000 | 0.299 | 0.894 | 0.912 | ||
| 2018 | 0.999 | 1.000 | 0.997 | 0.999 | 0.952 | 0.626 | 0.655 | ||
| 2019 | 0.855 | 0.994 | 1.000 | 0.999 | 0.473 | 0.904 | 0.918 | ||
| 2020 | 0.997 | 0.959 | 0.299 | 0.952 | 0.473 | 0.001 * | 0.002 * | ||
| 2021 | 0.025 * | 0.380 | 0.894 | 0.626 | 0.904 | 0.001 | 1.000 | ||
| 2022 | 0.040 * | 0.421 | 0.912 | 0.655 | 0.918 | 0.002 * | 1.000 | ||
| 41–50 years old | 2015 | 0.780 | 0.506 | 0.975 | 1.000 | 0.999 | 0.193 | 0.883 | |
| 2016 | 0.780 | 1.000 | 0.145 | 0.896 | 0.968 | 0.987 | 1.000 | ||
| 2017 | 0.506 | 1.000 | 0.037 * | 0.651 | 0.838 | 0.999 | 1.000 | ||
| 2018 | 0.975 | 0.145 | 0.037 * | 0.755 | 0.758 | 0.005 * | 0.365 | ||
| 2019 | 1.000 | 0.896 | 0.651 | 0.755 | 1.000 | 0.271 | 0.953 | ||
| 2020 | 0.999 | 0.968 | 0.838 | 0.758 | 1.000 | 0.491 | 0.985 | ||
| 2021 | 0.193 | 0.987 | 0.999 | 0.005 * | 0.271 | 0.491 | 0.995 | ||
| 2022 | 0.883 | 1.000 | 1.000 | 0.365 | 0.953 | 0.985 | 0.995 | ||
| 51 years old and over | 2015 | 1.000 | 0.985 | 0.081 | 0.620 | 1.000 | 0.018 | 0.957 | |
| 2016 | 1.000 | 0.987 | 0.152 | 0.742 | 1.000 | 0.055 | 0.990 | ||
| 2017 | 0.985 | 0.987 | 0.578 | 0.997 | 0.994 | 0.329 | 0.674 | ||
| 2018 | 0.081 | 0.152 | 0.578 | 0.874 | 0.196 | 1.000 | 0.023 * | ||
| 2019 | 0.620 | 0.742 | 0.997 | 0.874 | 0.813 | 0.657 | 0.221 | ||
| 2020 | 1.000 | 1.000 | 0.994 | 0.196 | 0.813 | 0.077 | 0.986 | ||
| 2021 | 0.018 | 0.055 | 0.329 | 1.000 | 0.657 | 0.077 | 0.006 * | ||
| 2022 | 0.957 | 0.990 | 0.674 | 0.023 * | 0.221 | 0.986 | 0.006 * | ||
| Age | Year | Year | |||||||
|---|---|---|---|---|---|---|---|---|---|
| 2015 | 2016 | 2017 | 2018 | 2019 | 2020 | 2021 | 2022 | ||
| Up to 30 years old | 2015 | 1.000 | 0.913 | 0.969 | 0.993 | 0.525 | 0.337 | 0.926 | |
| 2016 | 1.000 | 0.988 | 0.996 | 1.000 | 0.935 | 0.322 | 0.824 | ||
| 2017 | 0.913 | 0.988 | 1.000 | 0.999 | 1.000 | 0.223 | 0.509 | ||
| 2018 | 0.969 | 0.996 | 1.000 | 1.000 | 1.000 | 0.490 | 0.736 | ||
| 2019 | 0.993 | 1.000 | 0.999 | 1.000 | 0.998 | 0.269 | 0.687 | ||
| 2020 | 0.525 | 0.935 | 1.000 | 1.000 | 0.998 | 0.000 * | 0.048 * | ||
| 2021 | 0.337 | 0.322 | 0.223 | 0.490 | 0.269 | 0.000 * | 0.997 | ||
| 2022 | 0.926 | 0.824 | 0.509 | 0.736 | 0.687 | 0.048 * | 0.997 | ||
| 31–40 years old | 2015 | 0.649 | 0.404 | 0.997 | 1.000 | 0.057 | 0.985 | 0.960 | |
| 2016 | 0.649 | 1.000 | 1.000 | 0.554 | 0.003 * | 1.000 | 1.000 | ||
| 2017 | 0.404 | 1.000 | 0.994 | 0.339 | 0.001 * | 0.994 | 0.993 | ||
| 2018 | 0.997 | 1.000 | 0.994 | 0.984 | 0.368 | 1.000 | 1.000 | ||
| 2019 | 1.000 | 0.554 | 0.339 | 0.984 | 0.491 | 0.952 | 0.901 | ||
| 2020 | 0.057 | 0.003 * | 0.001 * | 0.368 | 0.491 | 0.170 | 0.055 | ||
| 2021 | 0.985 | 1.000 | 0.994 | 1.000 | 0.952 | 0.170 | 1.000 | ||
| 2022 | 0.960 | 1.000 | 0.993 | 1.000 | 0.901 | 0.055 | 1.000 | ||
| Age | Year | Year | |||||||
|---|---|---|---|---|---|---|---|---|---|
| 2015 | 2016 | 2017 | 2018 | 2019 | 2020 | 2021 | 2022 | ||
| Up to 30 years old | 2015 | 0.001 * | 0.994 | 0.041 | 0.157 | 0.015 * | 0.332 | 0.000 * | |
| 2016 | 0.001 * | 0.012 * | 0.439 | 0.544 | 0.689 | 0.221 | 1.000 | ||
| 2017 | 0.994 | 0.012 * | 0.451 | 0.625 | 0.253 | 0.885 | 0.009 * | ||
| 2018 | 0.041 * | 0.439 | 0.451 | 1.000 | 1.000 | 0.999 | 0.500 | ||
| 2019 | 0.157 | 0.544 | 0.625 | 1.000 | 1.000 | 0.999 | 0.626 | ||
| 2020 | 0.015 * | 0.689 | 0.253 | 1.000 | 1.000 | 0.974 | 0.776 | ||
| 2021 | 0.332 | 0.221 | 0.885 | 0.999 | 0.999 | 0.974 | 0.243 | ||
| 2022 | 0.000 * | 1.000 | 0.009 * | 0.500 | 0.626 | 0.776 | 0.243 | ||
| 31–40 years old | 2015 | 0.000 * | 0.102 | 1.000 | 0.077 | 0.019 | 0.258 | 0.007 * | |
| 2016 | 0.000 * | 0.236 | 0.000 * | 0.123 | 0.643 | 0.208 | 0.497 | ||
| 2017 | 0.102 | 0.236 | 0.147 | 1.000 | 0.999 | 1.000 | 0.999 | ||
| 2018 | 1.000 | 0.000 * | 0.147 | 0.125 | 0.032 * | 0.309 | 0.016 * | ||
| 2019 | 0.077 | 0.123 | 1.000 | 0.125 | 0.995 | 1.000 | 0.996 | ||
| 2020 | 0.019 * | 0.643 | 0.999 | 0.032 * | 0.995 | 0.996 | 1.000 | ||
| 2021 | 0.258 | 0.208 | 1.000 | 0.309 | 1.000 | 0.996 | 0.997 | ||
| 2022 | 0.007 * | 0.497 | 0.999 | 0.016 * | 0.996 | 1.000 | 0.997 | ||
| Age | Year | Year | |||||||
|---|---|---|---|---|---|---|---|---|---|
| 2015 | 2016 | 2017 | 2018 | 2019 | 2020 | 2021 | 2022 | ||
| 41–50 years old | 2015 | 0.008 * | 0.402 | 0.077 | 0.998 | 1.000 | 0.235 | 0.535 | |
| 2016 | 0.008 | 0.522 | 0.921 | 0.023 * | 0.019 * | 0.859 | 0.625 | ||
| 2017 | 0.402 | 0.522 | 0.991 | 0.715 | 0.619 | 1.000 | 1.000 | ||
| 2018 | 0.077 | 0.921 | 0.991 | 0.198 | 0.164 | 1.000 | 0.996 | ||
| 2019 | 0.998 | 0.023 | 0.715 | 0.198 | 1.000 | 0.472 | 0.811 | ||
| 2020 | 1.000 | 0.019 | 0.619 | 0.164 | 1.000 | 0.393 | 0.724 | ||
| 2021 | 0.235 | 0.859 | 1.000 | 1.000 | 0.472 | 0.393 | 1.000 | ||
| 2022 | 0.535 | 0.625 | 1.000 | 0.996 | 0.811 | 0.724 | 1.000 | ||
| Age | Atmosphere in the Workplace | Good Work Team | Basic Salary | Fair Appraisal System | ||||
|---|---|---|---|---|---|---|---|---|
| p-Value | Eta-Squared | p-Value | Eta-Squared | p-Value | Eta-Squared | p-Value | Eta-Squared | |
| Up to 30 years old | 0.001 | 0.052 * | 0.009 | 0.039 * | 0.000 | 0.068 * | 0.158 | 0.022 |
| 31–40 years old | 0.579 | 0.011 | 0.011 | 0.035 | 0.000 | 0.081 * | 0.116 | 0.022 |
| 41–50 years old | 0.014 | 0.032 | 0.106 | 0.022 | 0.029 | 0.029 | 0.000 | 0.048 * |
| 51 years old and over | 0.002 | 0.049 * | 0.172 | 0.022 | 0.002 | 0.047 * | 0.027 | 0.034 |
Disclaimer/Publisher’s Note: The statements, opinions and data contained in all publications are solely those of the individual author(s) and contributor(s) and not of MDPI and/or the editor(s). MDPI and/or the editor(s) disclaim responsibility for any injury to people or property resulting from any ideas, methods, instructions or products referred to in the content. |
© 2023 by the authors. Licensee MDPI, Basel, Switzerland. This article is an open access article distributed under the terms and conditions of the Creative Commons Attribution (CC BY) license (https://creativecommons.org/licenses/by/4.0/).
Share and Cite
Hitka, M.; Lizbetinova, L.; Javorcikova, J.; Lorincova, S.; Vanderkova, K. Managing Employee Motivation in Slovak Universities from the Perspectives of Time and Age. Educ. Sci. 2023, 13, 556. https://doi.org/10.3390/educsci13060556
Hitka M, Lizbetinova L, Javorcikova J, Lorincova S, Vanderkova K. Managing Employee Motivation in Slovak Universities from the Perspectives of Time and Age. Education Sciences. 2023; 13(6):556. https://doi.org/10.3390/educsci13060556
Chicago/Turabian StyleHitka, Milos, Lenka Lizbetinova, Jana Javorcikova, Silvia Lorincova, and Katarina Vanderkova. 2023. "Managing Employee Motivation in Slovak Universities from the Perspectives of Time and Age" Education Sciences 13, no. 6: 556. https://doi.org/10.3390/educsci13060556
APA StyleHitka, M., Lizbetinova, L., Javorcikova, J., Lorincova, S., & Vanderkova, K. (2023). Managing Employee Motivation in Slovak Universities from the Perspectives of Time and Age. Education Sciences, 13(6), 556. https://doi.org/10.3390/educsci13060556