Article

Comparability of Feedback in PISA 2015 across Culturally Diverse Countries

1
Section of ELAN, Faculty of Behavioural, Management and Social Sciences, University of Twente, 7522 NB Enschede, The Netherlands
2
Section of CoDE, Faculty of Behavioural, Management and Social Sciences, University of Twente, 7522 NB Enschede, The Netherlands
3
Department of Research and Innovation, Cito Institute for Educational Measurement, 6801 MG Arnhem, The Netherlands
4
Institute for Learning Sciences and Teacher Education, Australian Catholic University, Brisbane, QLD 4000, Australia
5
Centre for School and System Improvement (CSSI), Australian Council for Educational Research, Brisbane, QLD 4101, Australia
*
Author to whom correspondence should be addressed.
Educ. Sci. 2022, 12(2), 145; https://doi.org/10.3390/educsci12020145
Submission received: 24 December 2021 / Revised: 9 February 2022 / Accepted: 16 February 2022 / Published: 21 February 2022

Abstract

:
The aim of this study was to investigate the comparability of feedback across culturally diverse countries by assessing the measurement invariance in PISA 2015 data. A multi-group confirmatory factor analysis showed that the feedback scale implemented in PISA 2015 was not invariant across countries. The intercepts and residuals of the factor model were clearly not the same, and the factor loadings also differed. Model fit slightly improved when the more individualism-oriented countries were separated from the more collectivism-oriented countries, but not to an acceptable level. This implies that the feedback results from PISA 2015 have a different meaning across countries, and it is necessary to be careful when making cross-cultural comparisons. However, the absence of measurement invariance did not affect the relationship between feedback and science achievement scores. This means that feedback, as measured by PISA 2015, can be compared across culturally different countries, although the current form of this scale lacks important, culturally specific elements.

1. Introduction

Feedback is considered to be one of the most effective strategies for improving student learning [1]. It can be defined as ‘information provided by an agent (e.g., teacher, peer, book, parent, self, experience) regarding aspects of one’s performance or understanding’ ([1], p. 81). However, feedback currently is also conceptualized as ‘the new knowledge that students generate when they compare their current knowledge and competence against some reference information’ ([2], p. 757). The second definition elaborates on the first, as feedback is not only about the information provided, but also about the comparison between students’ own work and other information (such as the comments of the teacher). However, whether positive effects of feedback are found depends greatly on how feedback is provided and perceived [1,3,4,5]. The latter can differ within and between individuals, and is impacted to some extent by the cultural context [1].
One aim of international large-scale assessments, such as the OECD’s Programme for International Student Assessment (PISA), is to compare classroom practices in educational systems across the world, with the aim of providing policy recommendations based on the strengths and weaknesses of diverse educational systems. Given the critical importance of feedback for student learning, feedback has become a focus in PISA [6]. To achieve the aim of providing meaningful policy recommendations, it is critical that PISA results can be meaningfully compared across countries. This study therefore evaluated the comparability across countries of feedback in science classes as measured in PISA 2015.

1.1. Feedback across Culturally Different Countries

Differences between the cultures of countries can be characterized along different continuums, but they are most often characterized by the individualism–collectivism continuum proposed by Hofstede in his seminal 1986 work [7]. There is evidence that this continuum, even though it does not capture the full complexity of cultural differences, can be used as an indicator for certain teacher and student behaviours in the classroom [8,9]. It is important to note here that the descriptions below are ideal–typical; there are many countries that fall somewhere between these extremes. Generally, Asian and South American countries tend to be more oriented towards collectivism, whereas northwest European countries and the United States tend to be more oriented towards individualism [10].
Collectivism is characterized by a stronger we-consciousness: people are born into extended families or clans that protect them in exchange for loyalty. Teachers in countries on the collectivistic end of the spectrum commonly tend to take a more teacher-centred approach: the teacher transfers the knowledge to passive students [11,12]. The teacher is more likely to guide the student through each step of the process [13]. This also means that a stricter hierarchy between teachers and students can often be observed, in which students only respond when they are personally called upon by the teacher. Students are typically not expected to ask for feedback [14]. As a result, students with more collectivism-oriented identities can be more used to taking a passive role in the classroom than students with more individualism-oriented identities.
However, students being active is critical for feedback to be effective [15]. Specific cultural values, such as the power distance between teacher and student, can hinder the use of feedback in classrooms in the more collectivism-oriented countries [16,17]. This is in line with the fact that teachers in the more collectivism-oriented countries aim to give implicit, group-focused feedback [18]. Such feedback is also the feedback style more typically preferred by students, as it does not evaluate them in front of their peers (e.g., harmony in the group is preserved) [19].
Individualism, on the other hand, is characterized by a stronger I-consciousness: everyone is supposed to take care of themselves and their immediate family only. Others are considered as individuals [10]. Teachers in countries on the more individualism-oriented end of the spectrum tend to have a more student-centred approach in their classrooms. Students are motivated by their teacher to become independent thinkers and to take the initiative [11,12,13]. In the more individualism-oriented countries, two-way communication is more commonly encouraged as a norm in the classroom, and teachers often expect students to seek feedback and ask questions [10,18]. This means that students are expected to speak up when they have questions or when questions are asked by the teacher [10]. Teachers also have a certain amount of autonomy in their lessons and can, therefore, also give more attention to individual differences [13]. Individual feedback is the style of feedback typically preferred by students in the more individualism-oriented countries [19].
As mentioned, in practice, no country has all of the traits belonging to the described orientations. For example, in some Western countries, such as the Netherlands, teaching is not completely student-centred (yet), and teachers find it difficult to give students more ownership of their own learning process [20]. On the other hand, some students in the more collectivism-oriented countries of China, Singapore, and Chinese Taipei actually prefer more individual feedback [13]. In addition, the move from more teacher-centredness to more student-centredness can be seen in educational contexts worldwide, albeit this move is rather slow. There has (very) slowly been increasing recognition of the view that the student has a significant role to play in feedback processes, while adherence to the transmission model of a teacher telling students what to do in the classroom is slowly fading [21].

1.2. Feedback in PISA 2015

The data used in this study are from the PISA 2015 survey. The aim of PISA is to map student achievement and educational background factors internationally by country. This gives greater insight into the effectiveness of classroom practices in educational systems across countries worldwide. Every 3 years, PISA assesses the level of 15-year-old students in various subjects, most importantly science, reading and mathematics [6]. Moreover, PISA distributes background questionnaires to the students, parents and teachers to gain information on the classroom practices and strategies used, and the (educational) background of students. The purpose of including feedback in PISA 2015 was to investigate the use of feedback in science classes as a strategy to improve student learning outcomes across countries worldwide [22]. However, constructs such as feedback must have the same meaning in order to meaningfully compare results across countries. It is likely that the cultural context of a country can interfere with the meaning of social constructs. The feedback scale implemented in PISA 2015 seems to be focused on the more individualism-oriented classroom: (1) the items are all focused on the relationship between the teacher and the student, and (2) all of the feedback is directed to the first person, the I. The formulation of these items seems to be better suited for the more individualism-oriented countries, where a more student-centred approach is typical [13], in contrast with the more collectivism-oriented countries, in which implicit and group-related feedback is more often the norm [19]. The items for PISA are usually developed in Western, more individualism-oriented, countries, which could easily have caused a greater influence of these countries on the content of the items.
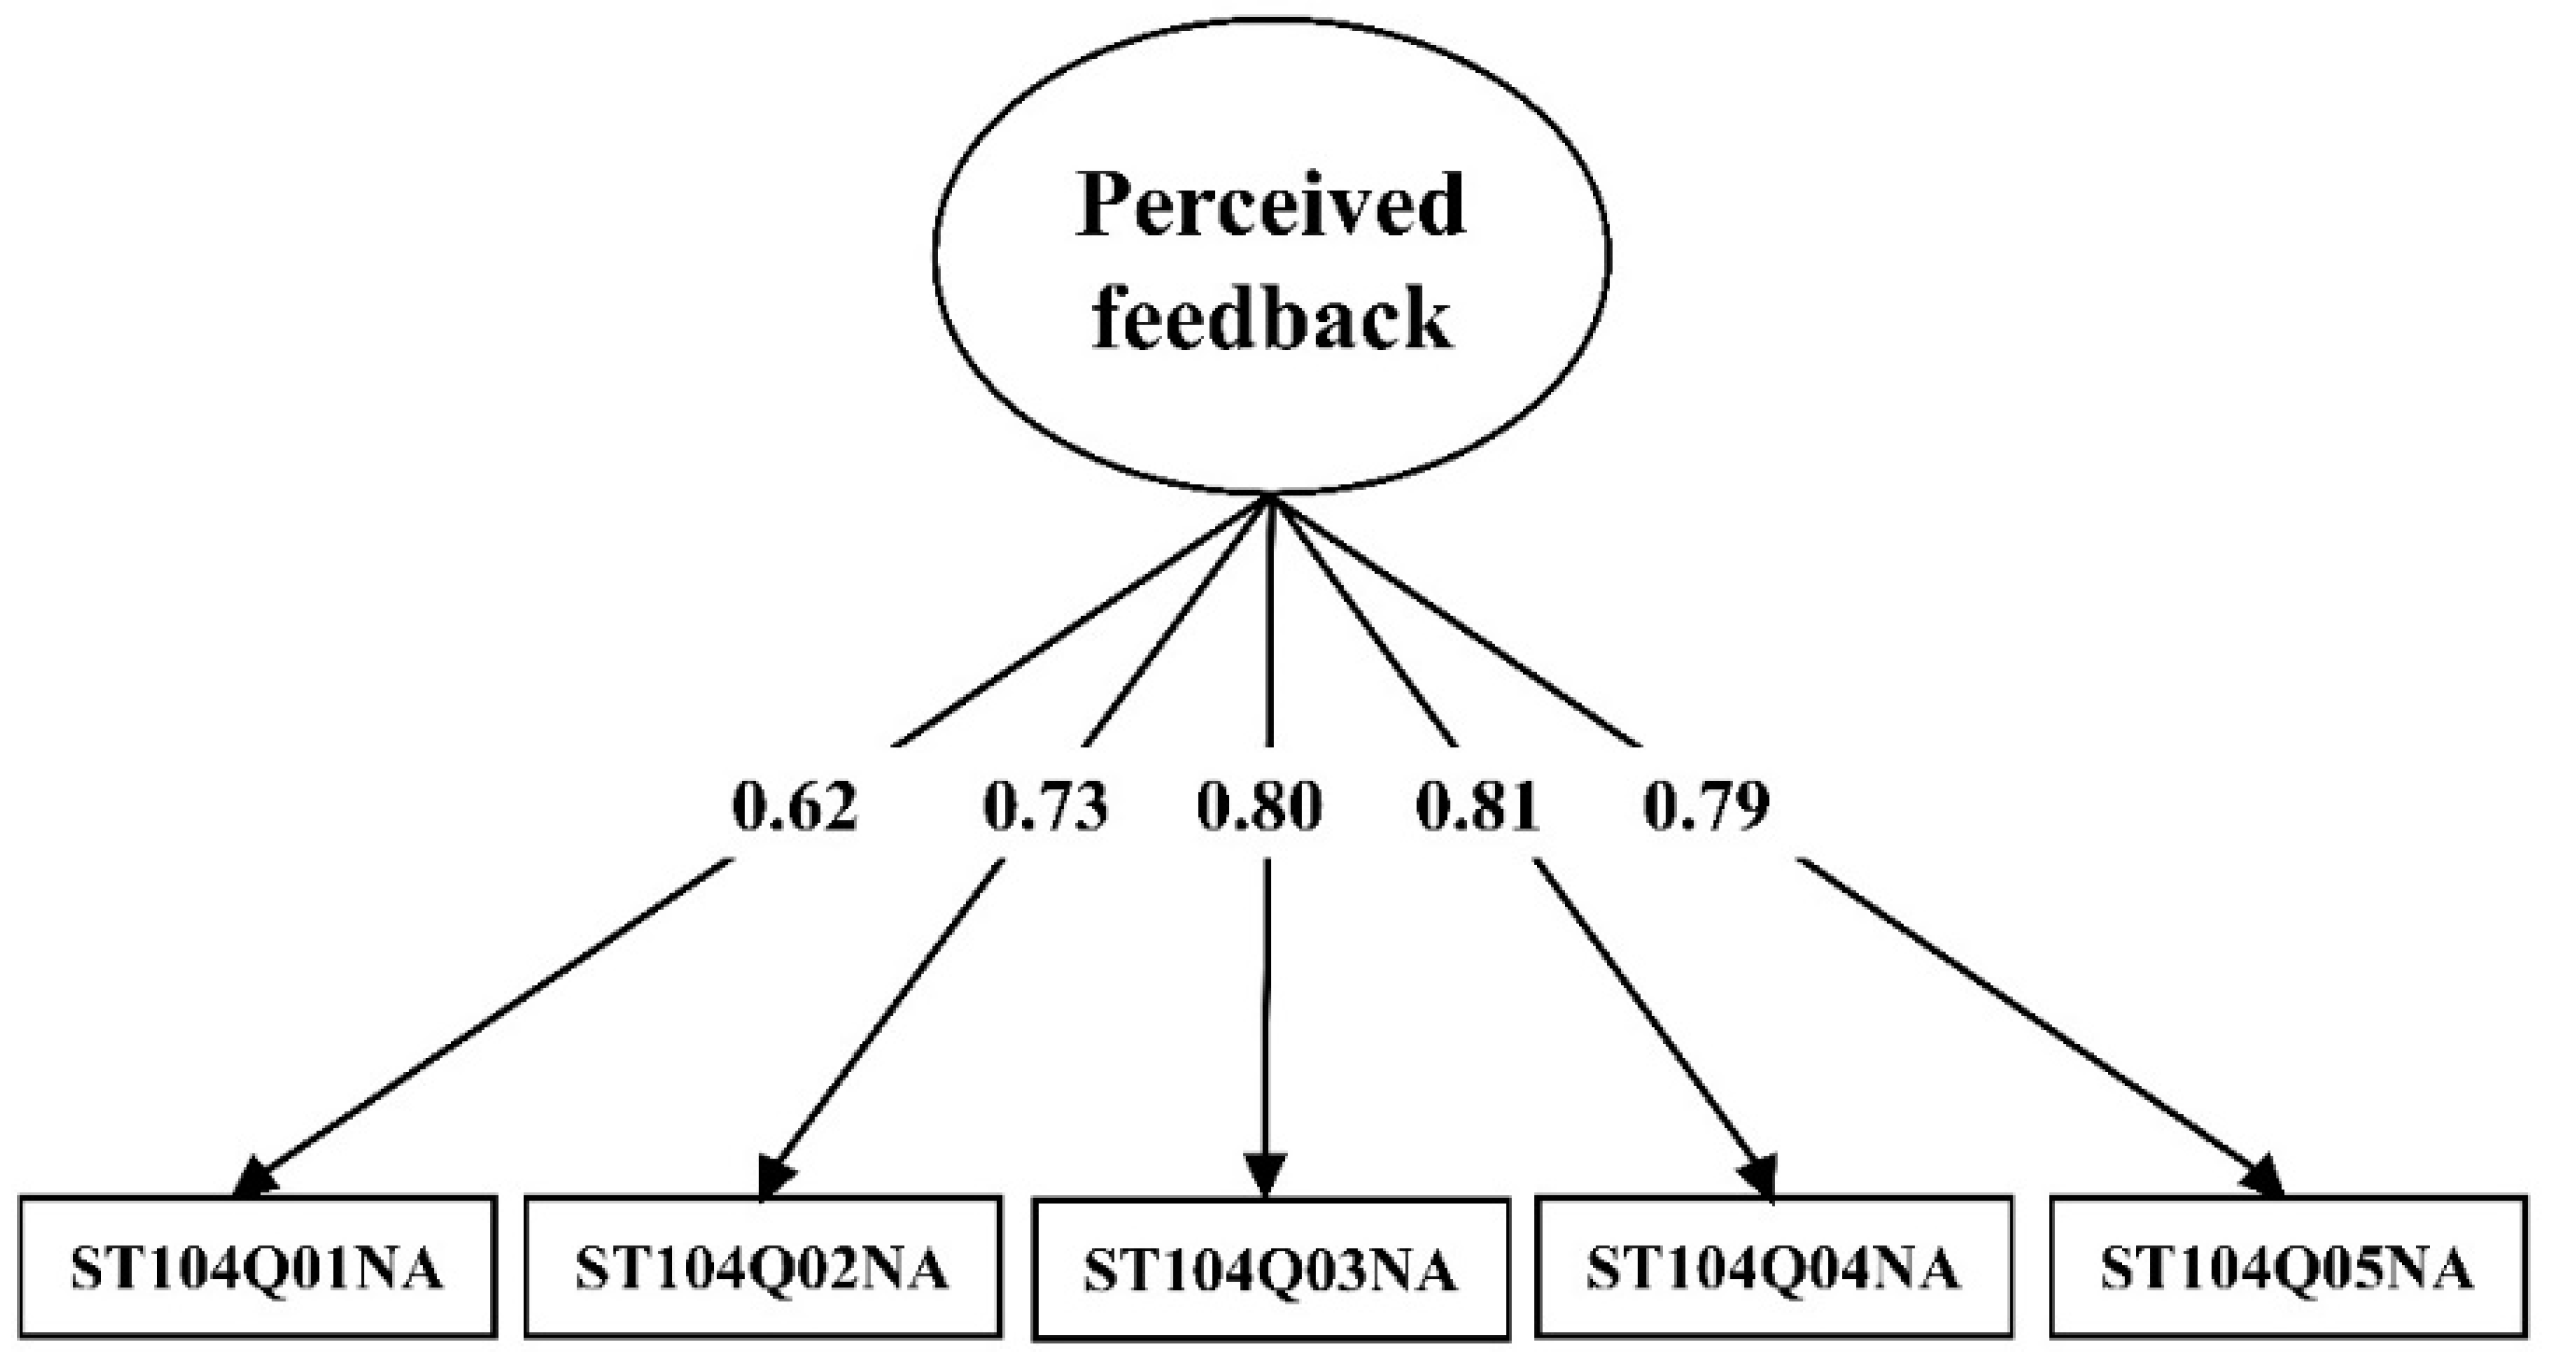
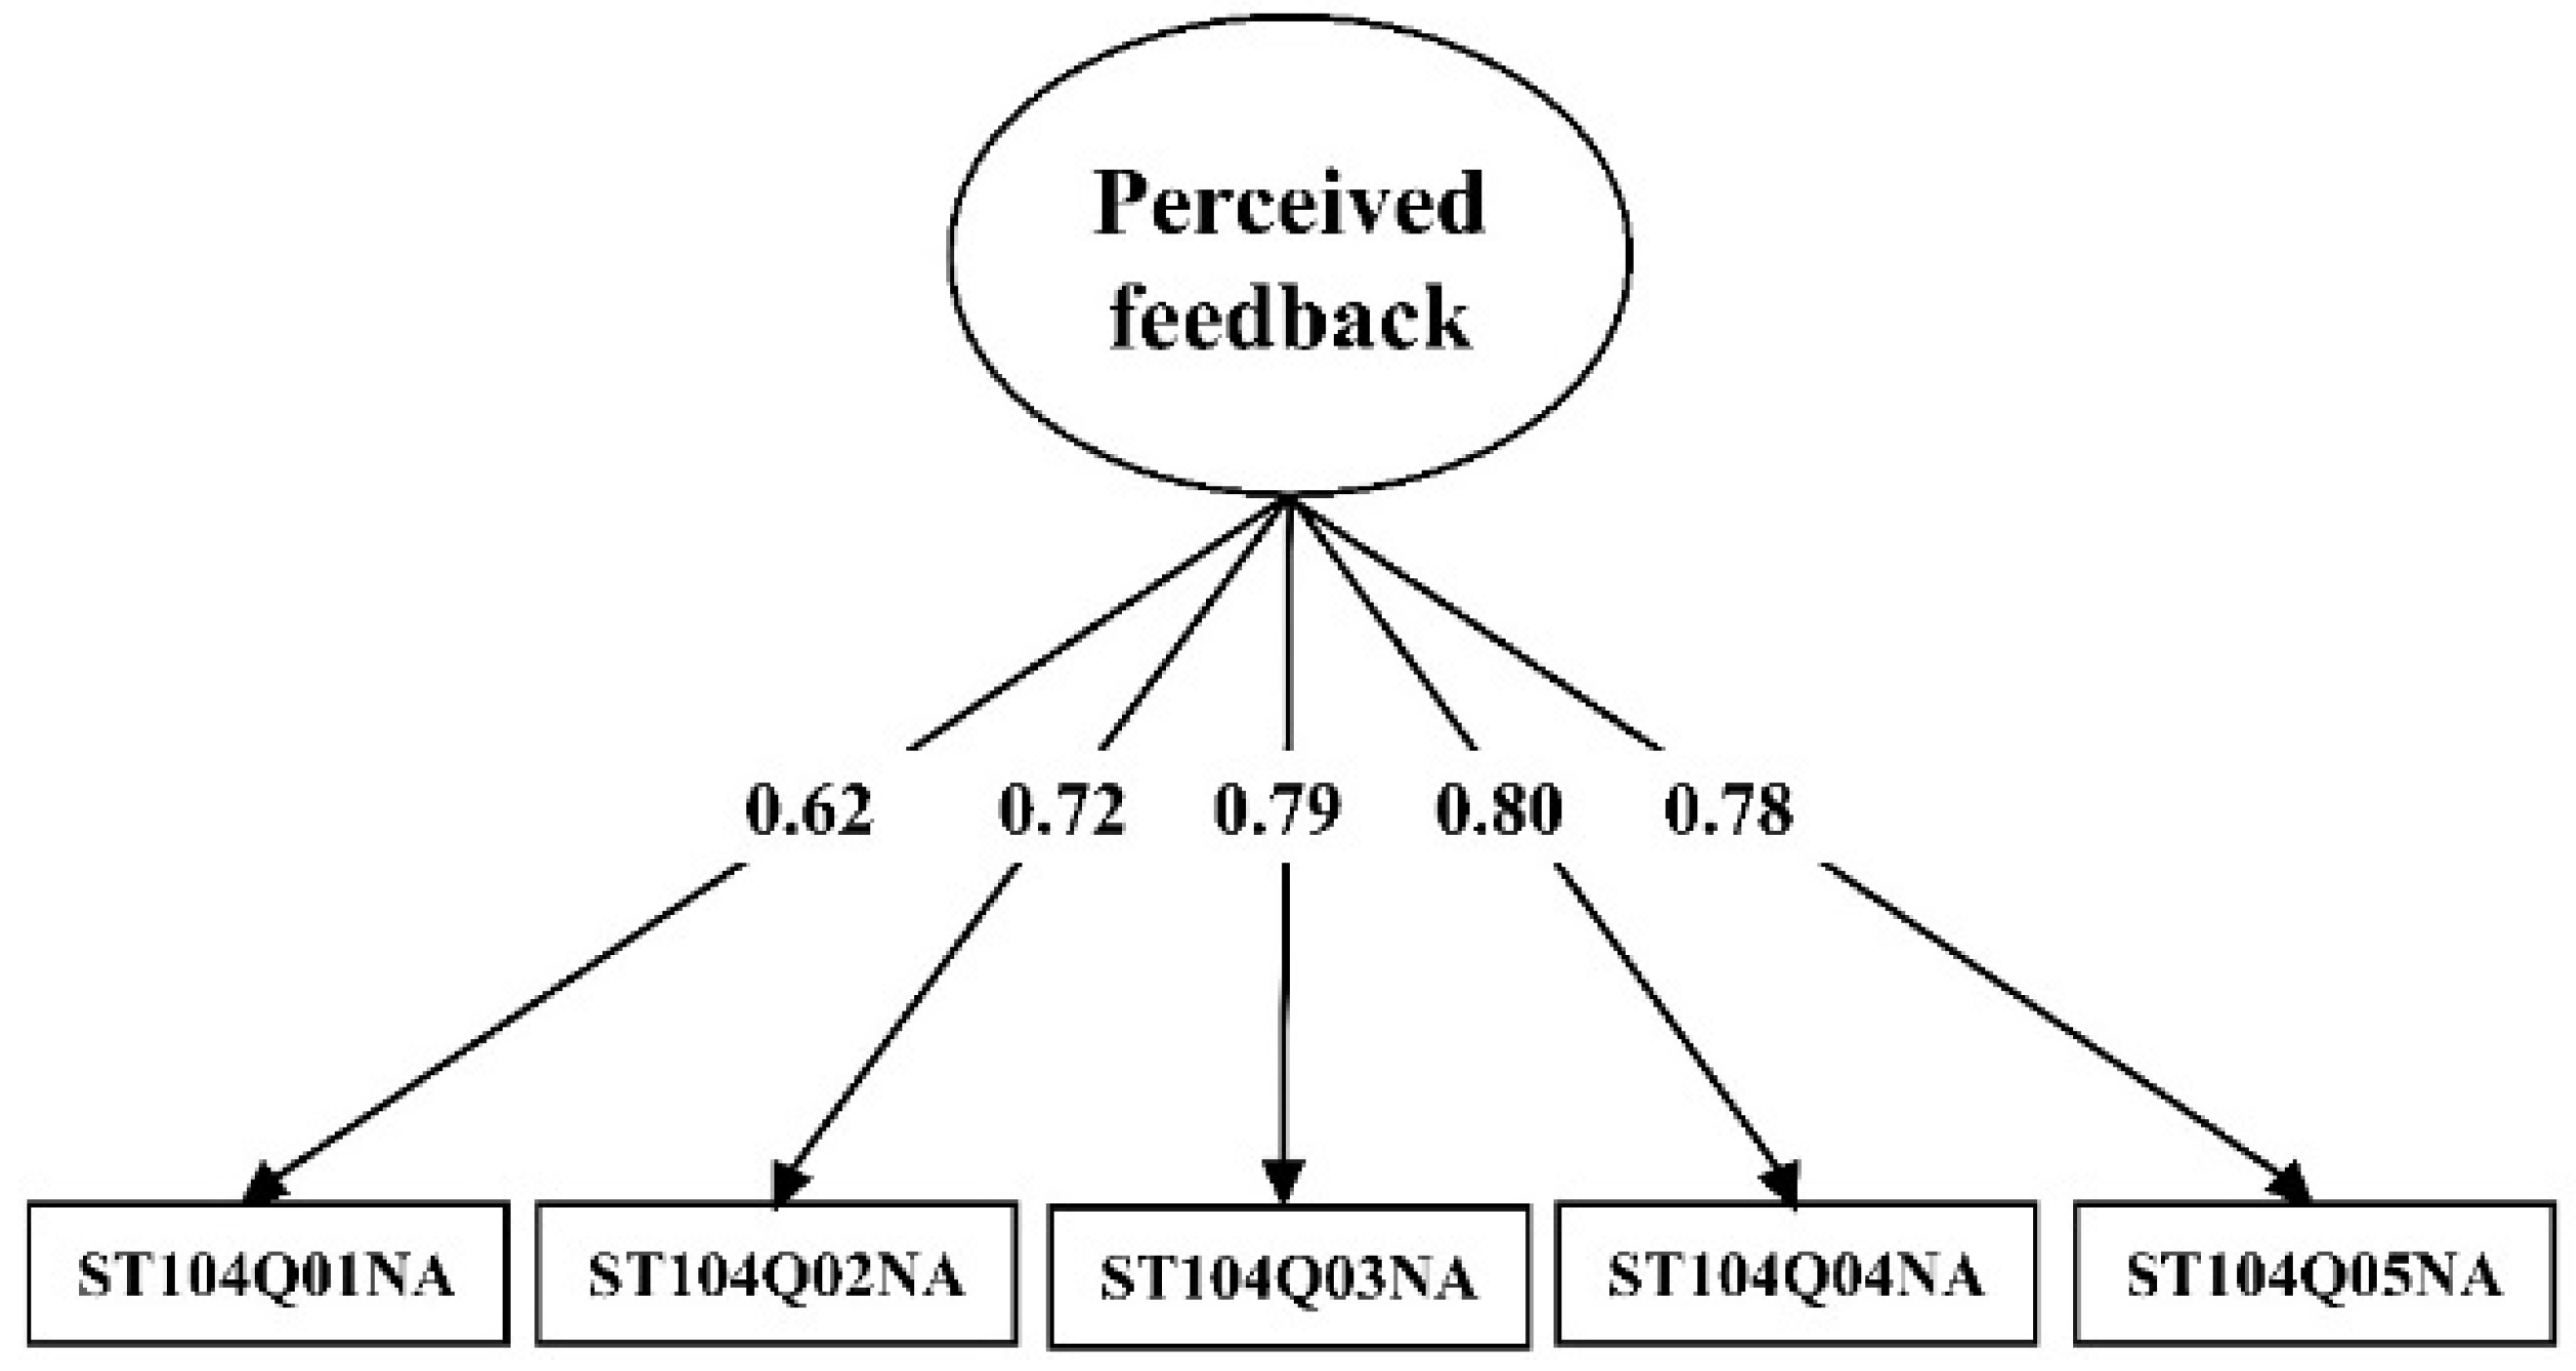
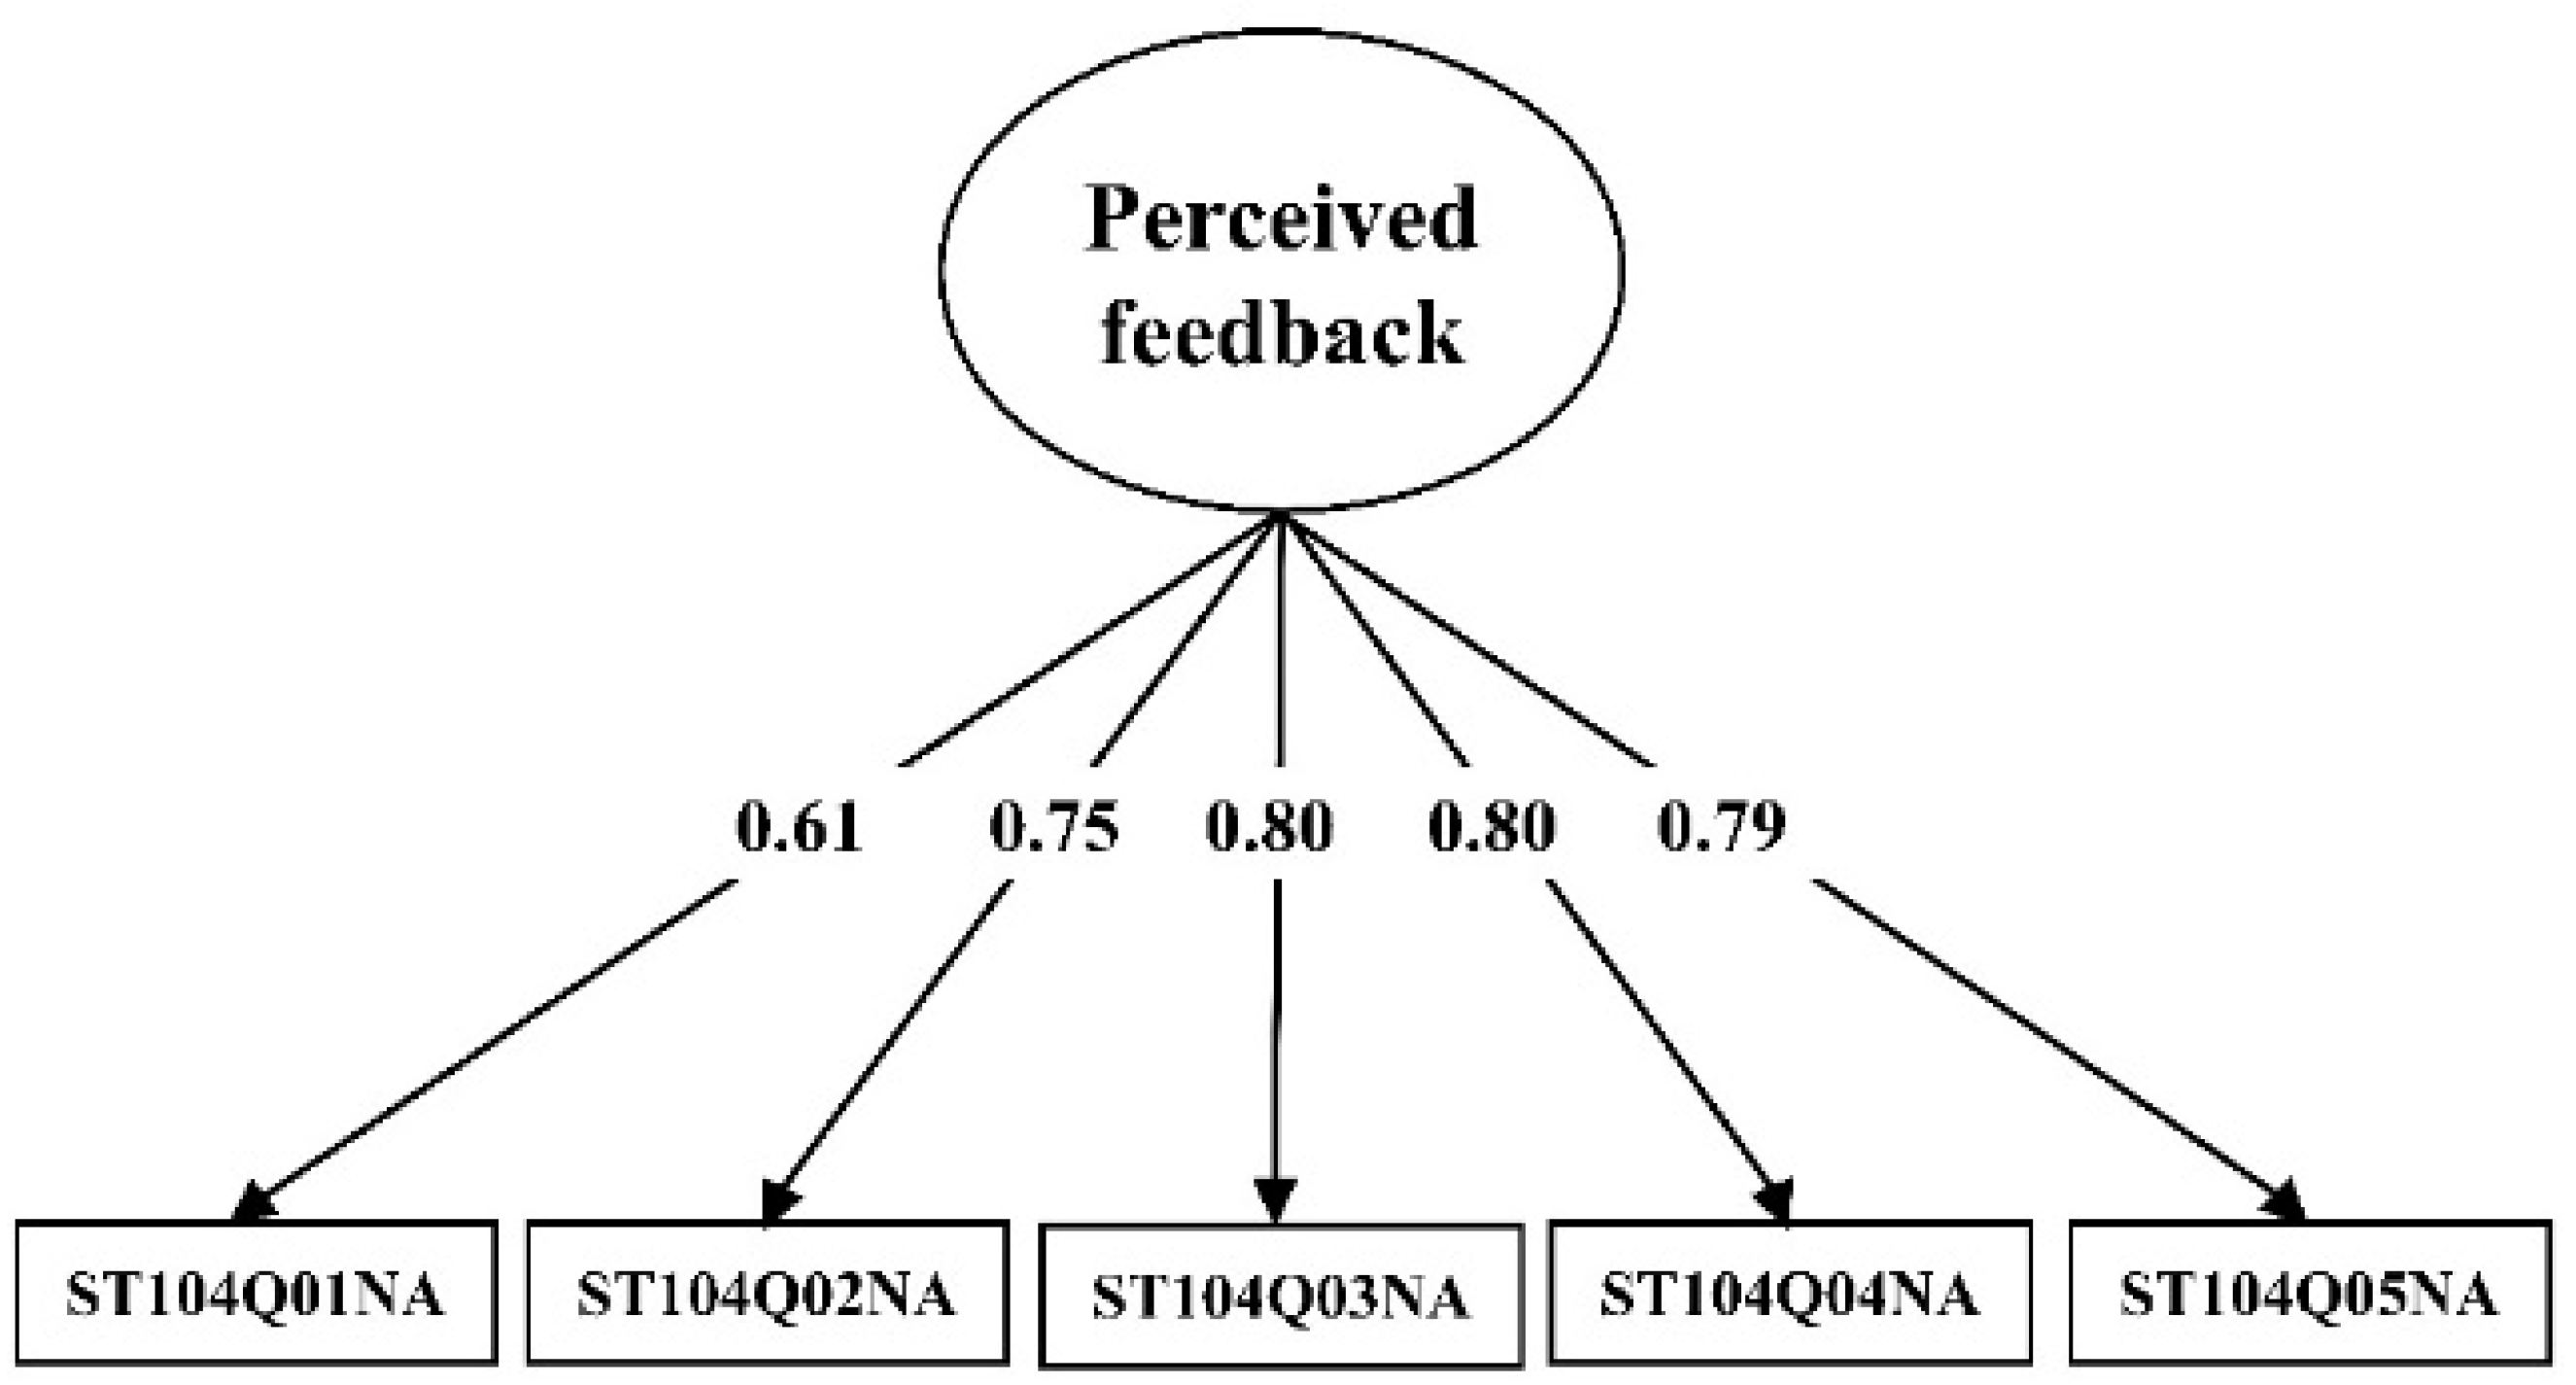
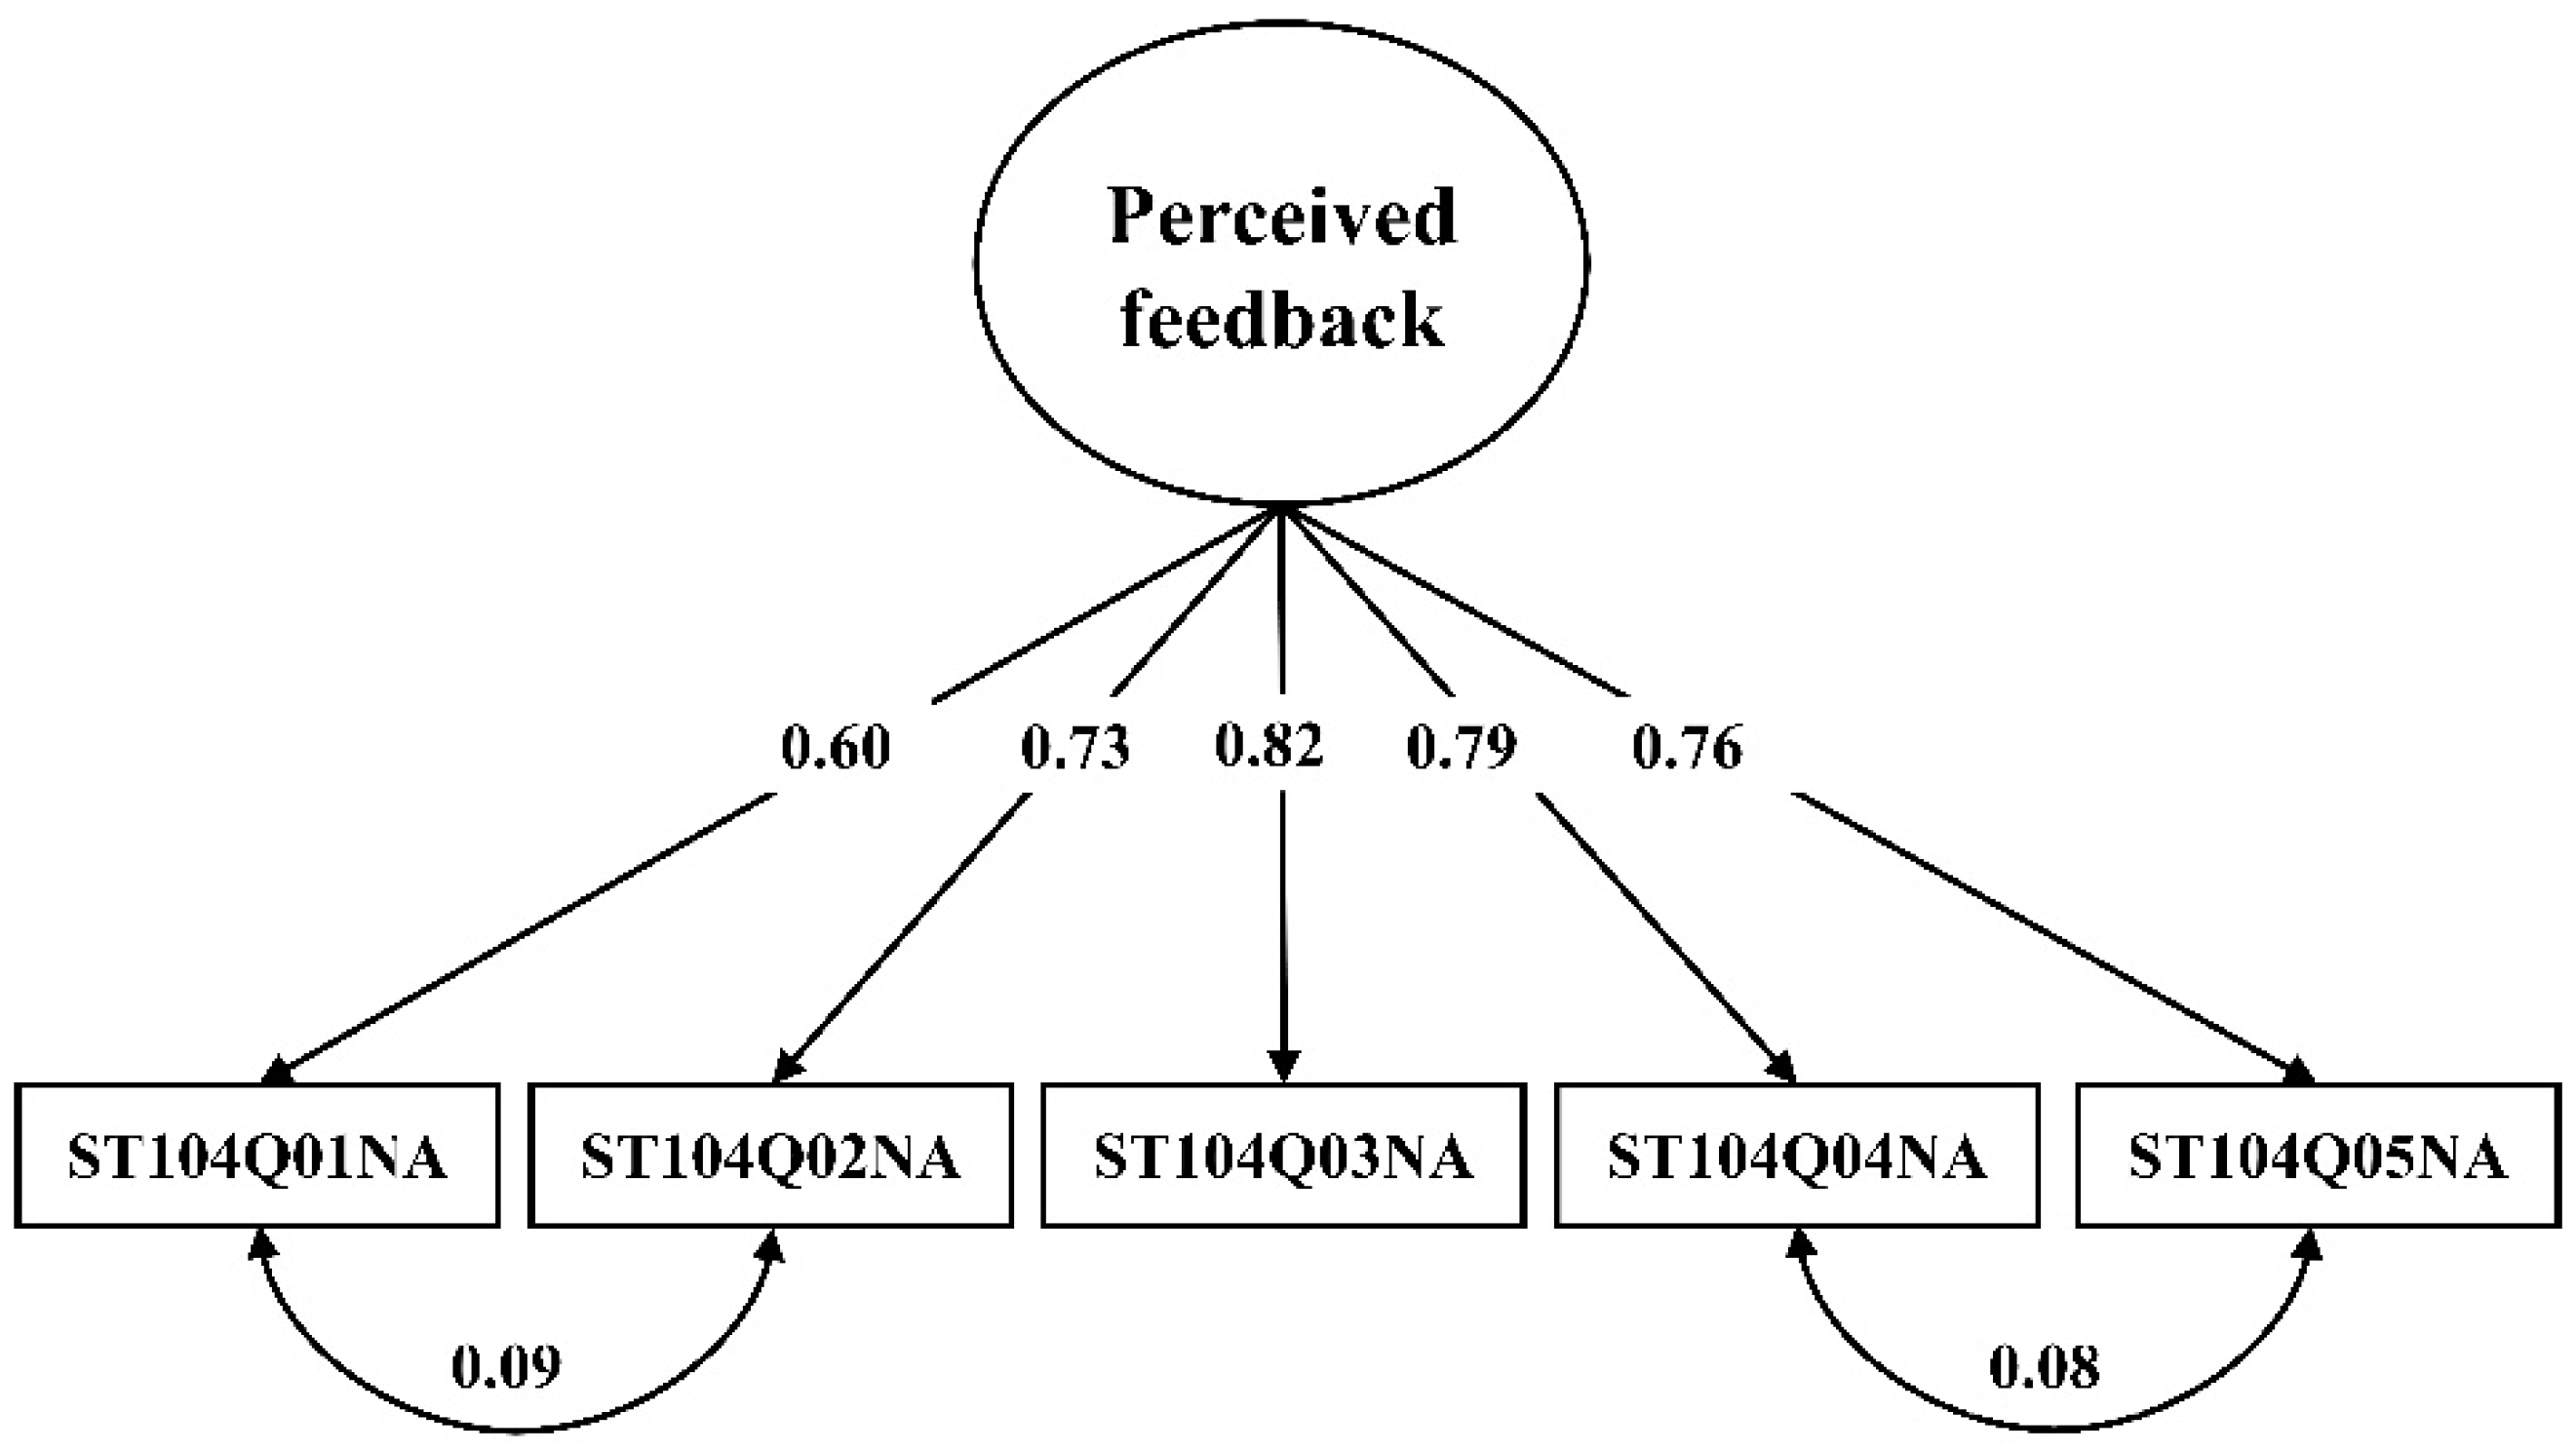
Comparing feedback across countries can only be performed meaningfully if the latent variable, which is feedback in this case, has the same meaning in these diverse countries. In other words, to enable meaningful cross-country comparisons, the latent variable needs to meet the assumption of measurement invariance. In this study, we assessed whether this assumption of measurement invariance holds for the feedback construct across culturally diverse countries, as we expected that feedback might be conceptually different across these countries. We expected, for example, that the feedback construct in PISA 2015, completely focused on teacher–student feedback, might be a better indicator for individualism-oriented countries compared to collectivism-oriented countries. We therefore investigated two aspects related to the validity of the PISA 2015 scale for measuring feedback. The main research question was:
Research Question 1 (RQ1).
To what extent is feedback comparable across culturally diverse nations?
The two sub-questions were:
Research Question 1a (RQ1a).
To what extent are the feedback scores in PISA 2015 subject to measurement variance across the more collectivism- and more individualism-oriented countries?
Research Question 1b (RQ1b).
What is the impact of cultural diversity on the observed relationship between feedback and science achievement scores?

2. Methods

2.1. Feedback in PISA

Feedback in PISA 2015 was conceptualized as perceived feedback in science classes, as outlined in the items below [6]. The purpose of including this construct in PISA 2015 was to measure the degree to which students perceived feedback to occur in the classroom, as feedback is considered to be very complex and is, in the more individualism-oriented countries, expected to differ based on individual student needs [22]. The items in PISA 2015 measuring perceived feedback were [6]:
  • The teacher tells me how I am performing in this course. (ST104Q01NA).
  • The teacher gives me feedback on my strengths in this <school science> subject. (ST104Q02NA).
  • The teacher tells me in which areas I can still improve. (ST104Q03NA).
  • The teacher tells me how I can improve my performance. (ST104Q04NA).
  • The teacher advises me on how to reach my learning goals. (ST104Q05NA).
Students were asked to respond to the items using a 4-point Likert scale, where higher scores indicated more frequent feedback: ‘Every lesson or almost every lesson’, ‘Many lessons’, ‘Some lessons’ and ‘Never or almost never’. To scale the items, a partial credit model was used [23]. In order to facilitate interpretation, these scale indices were transformed to have an international mean of 0 and standard deviation of 1 [6,24]. Reliability analysis for these items shows very high Cronbach’s alpha values across almost all countries (>0.90).

2.2. Participants

This article presents a secondary analysis of PISA 2015 data. PISA 2015 was administered to approximately 540,000 students, representing about 29,000,000 15-year-old students across 72 participating countries. For the purpose of this study, we checked and ranked the 72 PISA countries against the individualism index (IDV) developed by Hofstede et al. [25]. This IDV ranges from 0 (for countries that are most collectivism-oriented) to 100 (those that are most individualism-oriented). Ten PISA countries that did not have a IDV score or did not participate in the student background questionnaire for PISA 2015 were excluded from this study. Next, from the IDV ranking list, we selected the countries within the lowest quartile (e.g., those most collectivism-oriented) and countries within the highest quartile (e.g., those most individualism-oriented). This led to the selection of the 16 most collectivism-oriented countries and the 16 most individualism-oriented countries (see Table 1), with the exclusion of the remaining 30 countries that fell in the middle of the IDV ranking list. Data from all of the participating students in these 32 countries were used in the analyses.

2.3. Measurement Invariance Analysis

The general framework of structural equation modelling (SEM) [26,27] was used to assess whether students from the most collectivism-oriented countries interpreted the perceived feedback items in the same way as students from the most individualism-oriented countries. SEM allows the combination of a measurement model and a structural model, and is, therefore, a very useful tool with which to assess the assumption of measurement invariance. The measurement part of our analysis was a confirmatory factor analysis (CFA) for the latent variable of perceived feedback as measured by the five observed variables included in the student background questionnaire (see also Section 2.1). The assumption of strict measurement invariance in PISA 2015 across these two groups of countries was tested by evaluating the perceived feedback scale with the use of the checklist developed by Van de Schoot et al. [28]. This means that several measurement models were compared, each with a different, increasingly weaker set of constraints on factor loadings, intercepts and residuals. Table 2 outlines the steps for the measurement invariance analysis. All models have been estimated using a maximum likelihood estimator.
The models were compared with each other using Likelihood Ratio tests, which compare the significance of the difference of the Chi-square value between the models. The significance determined whether the model fit is worse than the previous one and, therefore, whether the assumption of measurement invariance can hold.
To answer the second research question, the measurement model was fitted for the groups of countries separately, and finally, the modification indices of the current perceived feedback scale were evaluated in order to signal possible improvements for the scale. Each model was evaluated with several absolute, relative and comparative goodness-of-fit indices. Goodness-of-fit indices indicate the fit between the statistical model and the observed values [30]. All of these indices are a function of the Chi-square goodness-of-fit value and degrees of freedom [31].
First, absolute goodness-of-fit indices assume that the best fitting model has a fit of 0 [32]. The absolute index that was used in the current study was the root mean square error of approximation (RMSEA). RMSEA values below 0.05 indicate a good fit, whereas RMSEA values between 0.05 and 0.8 indicate a mediocre fit. An RMSEA value above 0.10 indicates a poor fit [33]. Second, relative goodness-of-fit indices compare the model to a null model (i.e., the baseline model in which all variables are uncorrelated). The relative indices that were used in the current study were the comparative fit index (CFI) and the Tucker–Lewis index (TLI). CFI and TLI values higher than 0.90 indicate an appropriate fit [33]. Third, comparative goodness-of-fit indices are useful when comparing multiple models with each other. The comparative indices that were used for this study were the Akaike information criterion (AIC) and the Bayesian information criterion (BIC). The choice of indices was based on the checklist for measurement invariance developed by Van de Schoot et al. [28].
Next, the impact of a possible lack of measurement invariance on science achievement scores was assessed by analysing the structural relationship between the model measuring perceived feedback and science achievement scores, and the impact of a possible lack of measurement invariance on this relationship. Within this analysis, we made use of the full advantages of SEM, in which a measurement model and a structural model are combined. For this analysis, a model in which the meaning of perceived feedback was assumed to be similar for all participants was compared with a model in which perceived feedback was estimated separately for the most individualism- and the most collectivism-oriented countries. The difference between these models enabled the identification of the impact of culture on the observed relationship between perceived feedback and science achievement scores, as the perceived feedback items were measured in relation to science subjects.
All statistical analyses were carried out using R (2018, R Core Team, Vienna, Austria) [34]. The additional R packages that were used for the SEM analyses were lavaan.survey [35] and lmtest [36].

3. Results

3.1. Measurement Invariance

The first step was to conduct a CFA in order to evaluate the measurement model used by PISA 2015 using all data (i.e., all 32 more collectivism- and more individualism-oriented countries combined); see Figure 1. The goodness-of-fit indices of this model showed mixed results; namely, there were appropriate levels for the relative fit indices (CFI = 0.966, TLI = 0.931), but the absolute fit index was too high (RMSEA = 0.155). These results suggest that the fit of the PISA 2015 model for the perceived feedback scale could potentially be improved. On the other hand, the factor loading of the first item of the scale (ST104Q01NA, ‘The teacher tells me how I am performing in this course’) was rather low compared to the other items. This might indicate the unsuitability of this item for the perceived feedback scale and the model’s lack of a satisfactory fit to the data.
In the next step, the equality constraints that were used for this model were progressively weakened. The corresponding goodness-of-fit indices can be found in Table 3. In each model, the relative goodness-of-fit index, the RMSEA, was again found to be too high for an adequate fit (i.e., below 0.05 for a good fit) [32].
To see what the implications of this possible lack of measurement invariance (as seen in Table 3) were for the measurement model used by PISA 2015, CFAs were carried out separately for the most individualism- and most collectivism-oriented countries. The RMSEA was again found to be too high for both models, but with a somewhat better fit for the most individualism-oriented countries compared to the most collectivism-oriented countries. For the values of the goodness-of-fit indices for these models, see Table 4. This shows that the perceived feedback scale is probably better suited to measure the frequency of feedback in the most individualism-oriented countries.
Figure 2 and Figure 3 show the factor loadings of the baseline CFA models for both the most collectivism- and the most individualism-oriented countries. Although these loadings appeared similar, they did differ significantly (∆χ² = 10082, ∆df = 9 and p = 0.000).
Last, the modification indices indicated some possible adaptations for improving the model (see Figure 4). These adaptations concerned additional correlations in the measurement model of PISA 2015 between items ST104Q01NA (‘The teacher tells me how I am performing in this course’) and ST104Q02NA (‘The teacher gives me feedback on my strengths in this science subject’) and between items ST104Q04NA (‘The teacher tells me how I can improve my performance’) and ST104Q05NA (‘The teacher advises me on how to reach my learning goals’).
After adapting the measurement model of PISA 2015 in this way, the measurement invariance analysis was conducted again for all data according to the previously used method. After this step, the goodness-of-fit indices for the measurement invariance analysis for the modified model were all at an appropriate level (see Table 5).
To see whether these models significantly differ from each other, Likelihood Ratio tests were carried out. First, model 1 was compared with model 2, and this resulted in a significant difference: ∆χ² = 4342, ∆df = 0, p = 0.000. Second, model 2 was compared with model 3, and this resulted in a significant difference: ∆χ² = 271.55, ∆df = 4, p = 0.000. Third, model 3 was compared with model 4, and this resulted in a significant difference: ∆χ² = 5468.3, ∆df = 5, p = 0.000. This indicates that each model is worse than the previous one, and this indicates that the assumption of measurement invariance might not hold for the ‘perceived feedback’ scale across culturally different nations.
In addition, we investigated whether the model of perceived feedback would benefit from the adaptations that were indicated by the modification indices. After adjusting the model of the perceived feedback scale according to the modification indices (i.e., extra correlations between the first and second items and between the fourth and fifth items), the SEM analyses were repeated. The SEM analyses did not show any differences between the adjusted model and the prior model (see Table 4 for the prior model).

3.2. Model Fit and Science Achievement Scores

The next step was to assess the impact of cultural diversity for the perceived feedback scale. We investigated the effect of grouping together culturally diverse nations based on the observed relationship between perceived feedback and science achievement scores. This was performed by comparing a model in which the meaning of perceived feedback was assumed to be the same for all participants with a model in which perceived feedback was estimated separately for each group of countries. The results of these comparisons can be found in Table 6.
The correlations showed significant differences, p = 0.000, between the most collectivism- and most individualism-oriented countries, with somewhat steeper negative correlations for the most individualism-oriented countries than the most collectivism-oriented countries. The PISA 2015 measurement model was compared with the same model, in which the groups of countries were estimated separately using Likelihood Ratio tests. This resulted in a significant difference: ∆χ² = 154091, ∆df = 61, p = 0.000. On the other hand, the goodness-of-fit indices of both models were all of an appropriate level for the models to be used (see Table 7). For this reason, it can be assumed that the cultural impact on the observed relationship between the scores on the PISA 2015 perceived feedback scale and science achievement scores was negligible, and that the first model is appropriate for the analysis of perceived feedback in science classes.

4. Conclusion and Discussion

This study aimed to assess whether it is meaningful to compare perceived feedback in the classroom as measured in PISA 2015 across culturally diverse countries, by investigating the measurement invariance of the perceived feedback scale in PISA 2015. The analysis revealed some validity issues in the perceived feedback scale. As a result, student responses on this scale are not fully comparable across culturally diverse nations (i.e., research question 1a). Specifically, the analysis of the measurement invariance of this scale showed that not all of the fit measures were at an acceptable level. This reveals that feedback was not comparable across culturally different countries. The lack of measurement invariance can explain why a negative relationship was found between perceived feedback and student achievement (i.e., more frequent feedback is associated with lower student achievement) [13]. Moreover, our results showed a better fit of the feedback scale for the more individualism-oriented countries, as expected. This can likely be explained by different foci for feedback across culturally different countries, such as the stronger focus on the individual student in the more individualism-oriented countries. It is also important to note that this difference can also have occurred through translation, a process that often changes the meaning of items [37].
The perceived feedback scale used in PISA 2015 may very well have lacked some important aspects of feedback, which is a complex construct to measure with only five items. This can be specifically noticed from the relatively low factor loadings of the items, while at the same time having very high reliability, suggesting a narrow focus of the feedback scale. This can show that the content of those items might not have measured feedback in science classes very well. Essentially, the survey only measured the frequency of certain types of feedback. In a more student-centred model of feedback [38], feedback is partly given by the students themselves. For example, students can check their own work, which results in immediate feedback. Such feedback will be difficult to discern with items such as ‘The teacher tells me how I can improve my performance’. The student’s role in feedback and other relevant forms of feedback seemed to be neglected in the perceived feedback scale used in PISA 2015. This can explain why feedback, as measured in 2015, was not related to improved student achievement. It might, therefore, be better to focus on measuring feedback elements that contribute to student achievement, instead of focusing on the frequency of various kinds of feedback. Otherwise, it might be better not to measure feedback at all, as a limited conceptualization of feedback might lead one to draw the conclusion that feedback has a negative impact on student achievement, whereas, in reality, it is feedback that is only “told” to students and is not linked to learning objectives, for example, that will not be likely to lead to enhanced student achievement [39].
Despite the lack of measurement invariance across these culturally diverse countries (i.e., research question 1a), there was little effect on the observed relationship between perceived feedback and science achievement scores (i.e., research question 1b). The model in which the meaning of perceived feedback was assumed to be the same for all participants (i.e., measurement invariant) hardly differed from the model in which perceived feedback was estimated separately for both groups of countries. Based on the lack of measurement invariance of the PISA 2015 perceived feedback model, we modified the measurement model for the perceived feedback scale based on the modification indices. These indices suggested that a correlation between the first two items of the scale and the last two items of the scale should be included. After modifying the measurement model with these extra correlations, improvement only occurred in the fit of the model (i.e., meeting the assumption of measurement invariance); there was not a stronger relation between perceived feedback and science achievement scores. This means that the perceived feedback scale can still be used for comparisons across culturally different countries, despite the lack of congruent meaning of the feedback construct across these countries. However, the lack of measurement invariance does indicate that it would be advisable to be cautious in interpreting the negative relations of perceived feedback with achievement in PISA 2015, as the perceived feedback scale may not measure several important aspects of feedback.

4.1. Limitations

In interpreting the results of this study, it is important to take note of some debate about the individualism–collectivism culture characterization. Some researchers [40,41] have questioned this categorization, saying that it is too coarse-grained and does not capture the nuances within the more collectivism- and more individualism-oriented cultures. On the other hand, Hofstede et al. [25] were convinced of its validity, and the categorization has helped cultural psychology to advance [42]. Another possible limitation is that the choice of goodness-of-fit indices for the interpretation of the models was subjective; therefore, some caution in the interpretation of the results of the models is advised.

4.2. Future Research and Practice

In order to improve the perceived feedback scale of PISA 2015, it would be desirable to replace some of the highly similar items of the scale, as was pointed out by the modification indices, and add some other more relevant aspects of feedback, such as peer feedback. However, further improvement of the perceived feedback scale had not yet occurred in the new administration of PISA in 2018 [43]. The scale was even reduced to three items, ST104Q02NA, ST104Q03NA and ST104Q04A, which makes the measurement of feedback in the classroom even narrower. This also reveals the issue of a five-item scale that seems to need two pairs of items to be correlated above and beyond the latent trait. We therefore recommend that the scale needs to focus on measuring aspects of feedback that have been demonstrated to contribute to student achievement. The improvement of the scale, by including peer feedback, for example, is essential in order to adequately measure the relevant, but complex, aspects of feedback in the classrooms of both the more collectivism- and more individualism-oriented countries. Despite being better able to capture the feedback through including other forms of feedback, it is important to note that a potential drawback of replacing items is that the comparability of the scale across countries will be reduced.
Further research could further zoom in on measuring feedback and its different types and levels in the classroom. In addition, more research across culturally diverse nations is needed. Findings from such research can provide much-needed insights into how aspects of effective feedback practices across culturally diverse nations can be meaningfully captured in PISA to inform policy recommendations across the world. This fits with the suggestion of Bayer et al. (2016), who also mentioned that further investigation of the levels and types of feedback across nations would be useful. For example, other large-scale datasets can be analysed, such as the Trends in International Mathematics and Science Study (TIMSS) context questionnaire. Currently, TIMSS measures feedback with similar items as PISA, such as ‘My teacher tells me how to do better when I make a mistake’ [44]. Measurement-invariant scales for how students perceive feedback in classrooms are necessary to enable meaningful cross-cultural comparisons.

Author Contributions

Conceptualization, J.d.V.; formal analysis, J.d.V.; supervision, R.F. and J.K.; writing — original draft, J.d.V.; writing—review&editing, J.d.V., R.F., J.K. and F.v.d.K. All authors have read and agreed to the published version of the manuscript.

Funding

This research received no external funding.

Institutional Review Board Statement

Ethical review and approval were waived for this study due to the fact that this is a secondary data analysis, based on PISA data, for which there already is approval.

Informed Consent Statement

Informed consent was obtained by PISA 2015 from all subjects involved in the study.

Data Availability Statement

The dataset used for this study was acquired on the official PISA website: https://www.oecd.org/pisa/data/2015database/ (accessed on 15 February 2022).

Conflicts of Interest

The authors declare no conflict of interest.

References

  1. Hattie, J.; Timperley, H. The power of feedback. Rev. Educ. Res. 2007, 77, 81–112. [Google Scholar] [CrossRef]
  2. Nicol, D. The power of internal feedback: Exploiting natural comparison processes. Assess. Eval. High. Educ. 2021, 46, 756–778. [Google Scholar] [CrossRef]
  3. Black, P.J.; Wiliam, D. Developing the theory of formative assessment. Educ. Assess. Eval. Account. 2009, 21, 5–31. [Google Scholar] [CrossRef] [Green Version]
  4. Kluger, A.N.; DeNisi, A. The effects of feedback interventions on performance: A historical review, a meta-analysis, and a preliminary feedback intervention theory. Psychol. Bull. 1996, 119, 254–284. [Google Scholar] [CrossRef]
  5. Shute, V.J. Focus on formative feedback. Rev. Educ. Res. 2008, 78, 153–189. [Google Scholar] [CrossRef]
  6. OECD. PISA 2015 Assessment and Analytical Framework: Science 2017, Reading, Mathematic, Financial Proficiency and Collaborative Problem Solving; OECD Publishing: Paris, France, 2017. [Google Scholar] [CrossRef]
  7. Schimmack, U.; Oishi, S.; Diener, E. Individualism: A valid and important dimension of cultural differences between nations. Personal. Soc. Psychol. Rev. 2005, 9, 17–31. [Google Scholar] [CrossRef] [PubMed]
  8. Hwang, A.; Francesco, A.M. The influence of individualism–collectivism and power distance on use of feedback channels and consequences for learning. Acad. Manag. Learn. Educ. 2010, 9, 243–257. [Google Scholar] [CrossRef]
  9. Kaur, A.; Noman, M. Exploring classroom practices in collectivist cultures through the lens of Hofstede’s model. Qual. Rep. 2015, 20, 1794–1811. Available online: https://nsuworks.nova.edu/tqr/vol20/iss11/7 (accessed on 15 February 2022). [CrossRef]
  10. Hofstede, G. Dimensionalizing cultures: The Hofstede model in context. Online Read. Psychol. Cult. 2011, 2. [Google Scholar] [CrossRef]
  11. Prosser, M.; Trigwell, K. Teaching for Learning in Higher Education; Open University Press: Milton Keynes, UK, 1998. [Google Scholar]
  12. Staub, F.C.; Stern, E. The nature of teachers’ pedagogical content beliefs matters for students’ achievement gains: Quasi-experimental evidence from elementary mathematics. J. Educ. Psychol. 2002, 94, 344–355. [Google Scholar] [CrossRef]
  13. Cothran, D.J.; Kulinna, P.H.; Banville, D.; Choi, E.; Amade-Escot, C.; MacPhail, A.; Kirk, D. A cross-cultural investigation of the use of teaching styles. Res. Q. Exerc. Sport 2005, 76, 193–201. [Google Scholar] [CrossRef] [PubMed]
  14. Lau, K.C.; Lam, T.Y.P. Instructional practices and science performance of 10 top performing regions in PISA 2015. Int. J. Sci. Educ. 2017, 39, 2128–2149. [Google Scholar] [CrossRef]
  15. Lam, R. Assessment as learning: Examining a cycle of teaching, learning, and assessment of writing in the portfolio-based classroom. Stud. High. Educ. 2016, 41, 1900–1917. [Google Scholar] [CrossRef]
  16. Thanh Pham, T.H.; Renshaw, P. Formative assessment in Confucian heritage culture classrooms: Activity theory analysis of tensions, contradictions and hybrid practices. Assess. Eval. High. Educ. 2015, 40, 45–59. [Google Scholar] [CrossRef]
  17. Wang, J. Confucian heritage cultural background (CHCB) as a descriptor for Chinese learners: The legitimacy. Asian Soc. Sci. 2013, 9, 105–113. [Google Scholar] [CrossRef] [Green Version]
  18. Suhoyo, Y.; van Hell, E.A.; Prihatiningsih, T.S.; Kuks, J.B.; Cohen-Schotanus, J. Exploring cultural differences in feedback processes and perceived instructiveness during clerkships: Replicating a Dutch study in Indonesia. Med. Teach. 2014, 36, 223–229. [Google Scholar] [CrossRef]
  19. De Luque, M.F.S.; Sommer, S.M. The impact of culture on feedback-seeking behavior: An integrated model and propositions. Acad. Manag. Rev. 2000, 25, 829–849. [Google Scholar] [CrossRef] [Green Version]
  20. Kippers, W.B.; Wolterinck, C.H.; Schildkamp, K.; Poortman, C.L.; Visscher, A.J. Teachers’ views on the use of assessment for learning and data-based decision making in classroom practice. Teach. Teach. Educ. 2018, 75, 199–213. [Google Scholar] [CrossRef] [Green Version]
  21. Van der Kleij, F.M. Comparison of teacher and student perceptions of formative assessment feedback practices and association with individual student characteristics. Teach. Teach. Educ. 2019, 85, 175–189. [Google Scholar] [CrossRef]
  22. Bayer, S.; Klieme, E.; Jude, N. Assessment and evaluation in educational contexts. In Assessing Contexts of Learning. Methodology of Educational Measurement and Assessment; Kuger, S., Klieme, E., Jude, N., Kaplan, D., Eds.; Springer: Cham, Switzerland, 2016; pp. 469–488. [Google Scholar] [CrossRef]
  23. Masters, G.N. A Rasch model for partial credit scoring. Psychometrika 1982, 47, 149–174. [Google Scholar] [CrossRef]
  24. Kaplan, D.; Kuger, S. The methodology of PISA: Past, present, and future. In Assessing Contexts of Learning. Methodology of Educational Measurement and Assessment; Kuger, S., Klieme, E., Jude, N., Kaplan, D., Eds.; Springer: Cham, Switzerland, 2016; pp. 53–73. [Google Scholar] [CrossRef]
  25. Hofstede, G.H.; Hofstede, G.J.; Minkov, M. Cultures and Organizations: Software of the Mind, 3rd ed.; McGraw-Hill: New York, NY, USA, 2010. [Google Scholar]
  26. Bollen, K.A. Structural Equations with Latent Variables; John Wiley & Sons, Inc.: New York, NY, USA, 1989. [Google Scholar] [CrossRef]
  27. Jöreskog, K.G.; Sörbom, D. Recent developments in structural equation modeling. J. Mark. Res. 1982, 19, 404–416. [Google Scholar] [CrossRef]
  28. Van de Schoot, R.; Lugtig, P.; Hox, J. A checklist for testing measurement invariance. Eur. J. Dev. Psychol. 2012, 9, 486–492. [Google Scholar] [CrossRef]
  29. Täht, K.; Must, O. Comparability of educational achievement and learning attitudes across nations. Educ. Res. Eval. 2013, 19, 19–38. [Google Scholar] [CrossRef]
  30. Field, A. Discovering Statistics Using IBM SPSS Statistics, 4th ed.; SAGE: London, UK, 2013. [Google Scholar]
  31. Hox, J.J.; Bechger, T.M. An introduction to structural equation modeling. Fam. Sci. Rev. 1998, 11, 354–373. Available online: http://joophox.net/publist/semfamre.pdf (accessed on 1 June 2018).
  32. Kenny, D.A. Measuring Model Fit. 2000. Available online: http://davidakenny.net/cm/fit.html (accessed on 1 June 2018).
  33. Hu, L.T.; Bentler, P.M. Fit indices in covariance structure modeling: Sensitivity to underparameterized model misspecification. Psychol. Methods 1998, 3, 424–453. [Google Scholar] [CrossRef]
  34. R Development Core Team. R: A Language and Environment for Statistical Computing; R Foundation for Statistical Computing: Vienna, Austria, 2015; ISBN 3-900051-07-0. Available online: http://www.R-project.org (accessed on 1 May 2018).
  35. Rosseel, Y.; Oberski, D.; Byrnes, J.; Vanbrabant, L.; Savalei, V.; Merkle, E.; Chow, M. Lavaan Package. 2017. Available online: https://cran.r-project.org/web/packages/lavaan/lavaan.pdf (accessed on 1 May 2018).
  36. Hothorn, T. Lmtest Package. 2018. Available online: https://cran.r-project.org/web/packages/lmtest/lmtest.pdf (accessed on 1 May 2018).
  37. International Test Commission. The ITC Guidelines for Translating and Adapting Tests, 2nd ed.; 2017; Available online: www.InTestCom.org (accessed on 1 February 2022).
  38. Brooks, C.; Burton, R.; van der Kleij, F.; Ablaza, C.; Carroll, A.; Hattie, J.; Neill, S. Teachers activating learners: The effects of a student-centred feedback approach on writing achievement. Teach. Teach. Educ. 2021, 105, 103387. [Google Scholar] [CrossRef]
  39. Carless, D.; Boud, D. The development of student feedback literacy: Enabling uptake of feedback. Assess. Eval. High. Educ. 2018, 43, 1315–1325. [Google Scholar] [CrossRef] [Green Version]
  40. Oyserman, D.; Coon, H.M.; Kemmelmeier, M. Rethinking individualism and collectivism: Evaluation of theoretical assumptions and meta-analyses. Psychol. Bull. 2002, 128, 3–72. [Google Scholar] [CrossRef]
  41. Voronov, M.; Singer, J.A. The myth of individualism-collectivism: A critical review. J. Soc. Psychol. 2002, 142, 461–480. [Google Scholar] [CrossRef]
  42. Fiske, A.P. Using individualism and collectivism to compare cultures–A critique of the validity and measurement of the constructs: Comment on Oyserman et al. Psychol. Bull. 2002, 128, 78–88. [Google Scholar] [CrossRef] [Green Version]
  43. OECD. PISA 2018 Assessment and Analytical Framework; OECD Publishing: Paris, France, 2019. [Google Scholar] [CrossRef]
  44. Eriksson, K.; Helenius, O.; Ryve, A. Using TIMSS items to evaluate the effectiveness of different instructional practices. Instr. Sci. 2019, 47, 1–18. [Google Scholar] [CrossRef] [Green Version]
Figure 1. Factor loadings of the PISA 2015 model of the perceived feedback scale.
Education 12 00145 g001
Figure 2. Factor loadings in the most collectivism-oriented countries.
Education 12 00145 g002
Figure 3. Factor loadings in the most individualism-oriented countries.
Education 12 00145 g003
Figure 4. Factor loadings and correlations according to the modification indices.
Education 12 00145 g004
Table 1. Categorization of most collectivism- and most individualism-oriented countries.
Most Collectivism-Oriented Countries or RegionsIDV ScoreMost Individualism-Oriented Countries or RegionsIDV Score
Indonesia13United States of America91
Columbia14Australia90
Costa Rica15United Kingdom89
Trinidad and Tobago16Canada80
Peru16Netherlands80
Taiwan17Hungary80
Korea18New Zealand79
B-S-J-G (China)20Italy76
Thailand20Belgium75
Vietnam20Denmark74
Singapore20France71
Chile23Sweden71
United Arab Emirates25Ireland70
Hong Kong25Latvia70
Puerto Rico27Norway69
Portugal27Switzerland68
The IDV scale ranges from 0 (most collectivism-oriented) to 100 (most individualism-oriented).
Table 2. Equality constraints on model parameters; cf., Täht and Must [29].
ModelFactor LoadingsInterceptsResiduals
1 (Strict MI)InvariantInvariantInvariant
2 (Scalar invariance)InvariantInvariantFree
3 (Intercept invariance)FreeInvariantFree
4 (Metric invariance)InvariantFreeFree
Table 3. Results of the measurement invariance analyses.
Modelχ²dfpCFITLIRMSEABICAIC
1 (Strict)35,134230.0000.9520.9580.1212,058,5022,058,327
2 (Scalar)29,665180.0000.9600.9550.1252,053,0942,052,869
3 (Intercept)29,394140.0000.9600.9430.1422,052,8722,052,605
4 (Metric)25,052140.0000.9660.9510.1312,048,5302,048,263
Table 4. Goodness-of-fit indices of the CFA.
Group of Countriesχ²dfpCFITLIRMSEABICAIC
Most collectivism-oriented countries14,33150.0000.9550.9100.1701,013,0071,012,864
Most individualism-oriented countries10,44650.0000.9750.9490.1381,035,2771,035,133
Table 5. Results of the measurement invariance analysis for the adapted model.
Modelχ²dfpCFITLIRMSEABICAIC
1 (Strict)121,378190.0000.9830.9830.0782,035,5552,035,339
2 (Scalar)6950140.0000.9910.9860.0692,030,4272,030,161
3 (Intercept)6681100.0000.9910.9820.0802,030,2082,029,900
4 (Metric)2927100.0000.9960.9920.0532,026,4542,026,147
Table 6. Correlation coefficients between perceived feedback and science achievement scores for the two models.
ModelGroup of CountriesCorrelation Coefficient
PISA 2015 measurement modelAll 32 countries (N = 247,367)N.A.
Most collectivism-oriented countries (n = 115,460)−0.10
Most individualism-oriented countries (n = 131,907)−0.13
PISA 2015 measurement model—estimated separately Most collectivism-oriented countries (n = 115,460)−0.10
Most individualism-oriented countries (n = 131,907)−0.13
Table 7. The goodness-of-fit indices for the SEM analyses of the relationship of perceived feedback with science achievement scores.
Modelχ²dfpCFITLIRMSEABICAIC
PISA 2015 measurement model159,215890.0000.9690.9630.09222,988,90522,988,587
PISA 2015 measurement model—estimated separately25,6881780.0000.9950.9940.03722,835,56122,834,618
Publisher’s Note: MDPI stays neutral with regard to jurisdictional claims in published maps and institutional affiliations.

