Abstract
Before COVID-19, digital divide research among college students was scarce, reinforcing the idea that technology access was nearly universal, with few demographic differences. Pandemic-era research found some technical challenges, but most studies were conducted nationally or at research-intensive (R1) universities, indicating a paucity in research among underrepresented populations, notably at Hispanic-Serving Institutions (HSI). This mixed-methods study aimed to assess digital inequities and pandemic-related technological challenges at an HSI, with high percentages of low-income and first-generation students. This study also sought to determine if findings were consistent with national and R1 research. We surveyed a representative sample of 2188 undergraduates and conducted semi-structured interviews with 26 students. Results showed many students had inadequate technology. Just 79% had the optimal combination of smartphone plus laptop or desktop, with first-generation, low-income, Black, and older students significantly less likely to have this combination and often having to share devices within their households. Internet quality significantly affected all coursework-related challenges, as almost half of students with unstable internet reported trouble completing assignments compared to 20% with stable internet. Finally, results suggest the digital divide may be more prevalent at HSIs than at previously studied institutions, while also offering insight into how these challenges affect similar universities.
1. Introduction
As COVID-19 turned homes into classrooms nearly overnight in Spring 2020, the magnitude of the impact of remote instruction became a pressing concern at every university. Along with concerns about basic needs, questions about the adequacy of students’ computers and internet connections became urgent and continued to be so into the following academic year. Pre-pandemic digital divide research among college students, although sparse, suggested device access was no longer a problem. Although, for underserved students in particular, reliable internet remained an issue. How these findings on connectedness would translate to a Hispanic-Serving Institution (HSI) in the United States, where more than half of students are low-income enough (i.e., family income of $60,000 or less) to qualify for Pell Grants remained unknown. [1]. Raising further questions was that most pre-pandemic research on the adequacy of technology among college students was conducted nationally or at research-intensive universities (R1) [2], which collectively may fail to properly portray the technological inequities faced by underserved students.
Campus computing resources have offered an avenue for students who have poor internet or lack the necessary devices (for context, during the fall 2019 semester, our library computer lab recorded 132,996 sessions totaling almost 100 h). However, once pandemic restrictions eliminated campus Wi-Fi and computer labs and other places offering Wi-Fi were closed, we launched an in-depth study of undergraduates’ reported barriers at an HSI to completing coursework and the extent to which the students were affected by the digital divide, i.e., the inequitable access to technology and its effective use.
1.1. Literature
The awareness of, and concerns about, inequalities in access to information, and the means to produce and disseminate information, is hardly new [3,4,5]. With the dawning of the internet age, “digital divide” became a well-known phrase, one that has evolved significantly as information technology has become embedded in day-to-day life [6]. Today, scholars view the digital divide as having multiple levels. Although this study focuses on the first-level divide, some background on the other two levels is important for context.
1.1.1. First-Level Divide
The “first-level” of this divide, i.e., inequality in access to devices and internet connections, has received significant attention from researchers during the past three decades [7,8,9,10,11,12]. However, as the price of computing devices dropped and ownership of smartphones and tablets became widespread, an annual survey by the United States Census Bureau (though over the years different methodologies have been used to collect data) found that between 1980 and 2018, the number of homes in the United States with access to a device capable of connecting to the internet grew from 8% to 92%, and at least 85% of households have broadband internet connection [13].
Although inequalities in device ownership and internet access have lessened, a first-level divide still exists, primarily for low-income or ethnically and racially diverse families, especially concerning internet access. For example, more than 40% of households with incomes below $30,000 have neither broadband service nor a traditional computer [14]. Moreover, according to the U.S. Census Bureau, although 92.3% of Asian households have access to broadband internet, only 77.7% of Black households enjoy that same access [13]. As concerning as this is, it is only part of a larger picture. Katz [15] has argued that, in contrast to the dichotomous framing of the digital divide, a state of “under-connectedness” exists because of any number of factors including inadequate devices, device sharing, and a loss of internet service because of financial circumstances. This was further exacerbated by the pandemic [16].
As information and communication technologies (ICT) have advanced, access definitions expanded to include the means to maintain devices (e.g., broken hardware, data limits, and connectivity problems). For those unable to sustain access to ICTs equal to the task of utilizing the modern internet, the digital divide has persisted [12,17,18,19,20]. Given the increasing importance and integration of technology into education, research into the impact of this first-level divide on academic achievement is well documented, primarily at the K–12 level [21,22,23,24,25,26]. Over time a consensus has emerged that access to devices, though not without some drawbacks, is an important factor to academic success in the increasingly digitized classrooms of most colleges and universities.
1.1.2. Second-Level and Third-Level Divides
Viewing the digital divide as simply a matter of access to technology “is too narrow at best and quite problematic at worst” [27]. As Chen observed, there is more than one single divide, and although access to the internet is undoubtedly important, “what [individuals] use it for, and the returns they gain” represent “multidimensional and multilayered” digital divides of their own [28]. As a result, two other levels at which the divide may be found are as follows: a second-level inequality in “skills to use technologies in ways that enhance professional practices and social life” [29] (para. 86), that may be even more significant than that of access [8,30,31,32]; and a third-level inequality of outcomes related to social status and connectedness which are tied to internet access [28,33,34].
Indeed, some of the same factors that contribute to inequalities in internet access (e.g., race and ethnicity, educational attainment, and socioeconomic status) also contribute to disparities in the adoption, use, acquisition of skills, and outcomes of technology use [5,28,35,36,37,38,39,40]. Moreover, it has been argued that “existing social stratifications may even be reinforced” [8] (p. 2704).
1.1.3. Higher Education Research
Digital divide research in higher education, though sparse before the pandemic [41,42], has reported device ownership among U.S. students as exceeding 90% in recent years, with few demographic differences [20,24,43,44,45,46]. However, reliance on smartphones has been shown to be greater among non-White, lower income and first-generation students [43,45]. Pre-pandemic research findings on internet access and quality have been more uneven. Educause, which has been surveying tens of thousands of U.S. students for more than a decade, has found 61–72% of students living off campus rating their internet quality as good or excellent compared to 46–51% of those living on campus. Although most students report excellent Wi-Fi experiences in libraries and classrooms, outdoor Wi-Fi and dormitory connections are reported as subpar [43,47].
Pre-pandemic higher education research has also found a new aspect of the first-level divide: technology maintenance problems. Gonzales et al. found that about 20% of students “had difficulty maintaining access to technology (e.g., broken hardware, data limits, connectivity problems, etc.). Students of lower socioeconomic status and students of color disproportionately experienced hardships, and reliance on poorly functioning laptops was associated with lower grade point averages” [20] (p. 750).
Since the pandemic, more technology access challenges have emerged despite campus programs to loan equipment. For example, administrators surveyed by Educause in April 2020 reported that 36% of students had moderate to extreme difficulty accessing the internet [48]. Furthermore, two recent California studies found that more than 12% of students lacked either adequate devices or internet access with higher proportions among Black and Latinx (we use Latinx, Hispanic/Latino/Latina, or Hispanic alone consistent with the source’s terminology) students, community college students, and low-income students [49,50]. Other studies also uncovered technology access challenges which more severely affect first-generation students and/or underrepresented groups [42,51,52].
However, beyond device and internet access, and maintenance challenges, technology barriers continue amongst college students at the second and third levels of the divide, including use in the classroom, technology proficiency, and differing achievement in online courses, with underserved groups more commonly on the “wrong” side of the divide [51,53,54,55,56,57].
This study was prompted by research suggesting that data differ by types of institutions. For example, Galanek et al. found that undergraduates at masters-level and doctorate-level private universities were less likely to report good or excellent overall technology experiences [47], whereas recently, Jaggars et al. found more inadequate technology at non-R1 campuses than at R1 institutions [42]. Meanwhile, Buzzetto-Hollywood et al. reported lower device access at historically Black universities [58]. Although we could find no pre-pandemic research on technology adequacy at Hispanic-Serving Institutions (HSI), substantial numbers of students in two recent studies in California, which has a large number of HSIs, reported technology challenges [49,50].
2. Methods
2.1. Study Aims and Research Questions
Past literature has shown that technology inequities and the digital divide affect underrepresented groups of college students, but most studies regarding this topic were conducted nationally or at R1 universities. The paucity of research focusing on Hispanic-Serving Institutions, both before and during the pandemic, prompted our overall research goal: determining whether undergraduates at an HSI with large numbers of low-income and first-generation students had adequate device access and internet quality. We also sought to understand how the pandemic created technology-access challenges for both coursework and remote learning. More specifically, we addressed the following three areas:
- RQ1: Access to devices, device reliability and internet quality.
- RQ2: Coursework-specific technology challenges.
- RQ3: Challenges related to attending school from home.
We also sought to understand if these issues were comparable to those found in studies nationally and at R1 institutions. Finally, we wanted to explore how specific demographic factors affected technology challenges, which may shed light on issues facing these underserved and understudied populations. To explore this topic, the following demographic items were key for our analysis:
- Race and ethnicity;
- Gender;
- Age (e.g., traditional vs. non-traditional students);
- Enrollment status (e.g., part-time vs. full-time);
- First-generation status (whether the student was the first in their family to attend college);
- Pell Grant eligibility, as a proxy for low-income;
- Academic success risk (low-income and first-generation students).
2.2. Participants and Procedures
This study utilized a mixed-method approach through an online survey (Appendix A) and semi-structured interviews. The quantitative portion is a subsection of a campus-wide student survey conducted in December 2020. Emails with the study link were sent to the nearly 40,000 enrolled students. Unduplicated responses were received from 2543 undergraduate and 460 graduate students (total response rate of 8%) who answered all or part of the survey and provided a campus identification number. The survey had three sections: satisfaction with campus responses to the pandemic and issues related to housing and financial assistance; issues with technology and working from home; and student learning and academic readiness for the upcoming spring semester.
Because a portion of the digital divide includes technology access, only responses from undergraduates who indicated which devices they used during the online academic year were analyzed. Demographic data were compiled through the campus office of Institutional Research & Analytics. In total, this study assessed responses from 2188 undergraduates.
To complement the quantitative responses, 26 undergraduates, recruited via convenience sampling, participated in semi-structured interviews during the fall semester. Participants were asked questions on technology and working from home similar to those in the survey, but they were prompted to elaborate on any issues. The interviews averaged 14.8 min, not including informed consent and introductions. All responses were audio recorded and transcribed for data analysis. Participants were not offered an incentive for either the quantitative or qualitative portion of this study. All procedures were approved by the Institutional Review Board at California State University, Long Beach.
2.3. Measures
The following outcomes were assessed in both the survey and semi-structured interviews. In the survey, participants were presented the question and response options in a close-ended format in which they could select their best response(s). For the interviews, participants were read questions (e.g., “What type of technology-related issues do you have with completing schoolwork?”) and asked to elaborate on their experiences through an open-ended dialogue.
2.3.1. Access to Technology
Participants were asked what devices were available to them; if they shared their devices with others; their awareness and usage of the campus’ Student Laptop/Hotspot Loan Program; device-specific issues; and the quality of their internet.
2.3.2. Technology-Specific Challenges
Participants were asked to select technology-specific challenges that resulted in difficulties completing coursework. Options included accessing live lectures (e.g., Zoom calls), communicating with instructors and classmates, watching pre-recorded videos (e.g., asynchronous courses), completing assignments and readings, and using the campus learning management system (LMS). Furthermore, participants were asked to rate their comfort in using the LMS based on the following items, “Very confused”; “Comfortable”; and “Proficient.”
2.3.3. Challenges of Working at Home
Participants were asked to select specific challenges they encountered while working from home. These included assuming responsibility for childcare or family needs, dealing with unanticipated noises or distractions, and having insufficient workspace.
2.4. Data Analysis
All data analysis was completed using SPSS version 27. Descriptive statistics and frequencies were calculated for relevant study variables. Chi-squared tests were calculated to determine possible disparities in key study variables that may have existed between predictors.
This study had 1538 females and 648 males. Classification included 18% freshmen, 16% sophomores, 26% juniors, and 40% seniors, with 87% enrolled full time. Ages ranged from 17 to 67 (M = 23.04; SD = 6.42), and 79% of the sample were considered traditional students (under 25). Additionally, 34% of participants were first-generation and 56% of the overall sample were Pell-eligible students. Students who identify as Hispanic/Latino/Latina had the highest representation, at 45%. Compared to the university population, our sample was representative across all categories, except for gender, with this study’s sample consisting of 70% females against 57% for the university (Table 1).

Table 1.
Study sample demographics compared to university population.
3. Results
3.1. Access to Technology
RQ1 aimed to understand students’ access to technology during the transition to alternative modes of instruction, with a particular focus on the types of devices, their reliability, and the quality of their internet (Table 2). The vast majority of our sample had access to either a laptop (89%) or smartphone (82%). Less than a third (31%) of participants had access to a tablet or Chromebook, and 27% had a desktop computer. Past literature has suggested that students with access to a smartphone and a laptop or desktop computer found their technology to be best for academic success [44,45,54]. Thus, we operationalized those with a smartphone and either a laptop or desktop computer as those with “optimal technology,” accounting for 79% of our sample. Additionally, 84% had access to more than one device, and 15% of participants shared their device. For device reliability, 30% indicated that their devices stopped working at one point during the semester, and 36% reported equipment needs or Wi-Fi issues at home.
Table 2.
Technology Access.
Although results from the survey suggest that device access is high, the qualitative portion uncovered potential issues regarding device access, even if students have technology at their disposal. Some remarked that their device did not have the proper hardware or software to be successful in their courses (e.g., the lack of a camera or necessary programs such as word processors, statistical packages, or presentation tools). For software issues, students who normally relied on university resources, such as the library or on-campus computer labs for their work, now had to resort to using personal devices that were not up to par. One student expressed, “I just wish my software would be fast. I used to rely a lot on the computers [on campus]. They were more updated; they had the latest software all the time.” Another key finding from the interviews was that students suddenly needed to purchase newer equipment. As one student explained: “I’ve had my laptop since 2014, but I upgraded this year because I couldn’t get Zoom to download… I really did not want to upgrade my old laptop functioned enough if I needed to write a paper but working online 24/7 just wasn’t doing it.” Another student who bought a new laptop echoed these sentiments: “I used an older laptop that I guess wasn’t really cutting it. I was using a Chromebook.”
Although concerns about the quality of devices and software were expressed, only 8% of students borrowed equipment from the university, despite 79% being aware of the university’s Student Laptop/Hotspot Loan Program. When looking at outcomes that are influenced by demographic predictors, sharing and borrowing devices were impacted by income, first-generation status, and age. Pell-eligible (𝜒2 (1, N = 211) = 11.52, p < 0.001) and first-generation students (𝜒2 (1, N = 141) = 33.45, p < 0.001) had greater incidences of sharing their devices with someone else. Furthermore, Pell-eligible (𝜒2 (1, N = 124) = 25.77, p < 0.001) and first-generation students (𝜒2 (1, N = 77) = 31.05, p < 0.001) were more reliant on borrowing equipment from the university program. Conversely, very few continuing-generation students (5%) and non-Pell-eligible students (4%) utilized these resources. Students 25 and older had higher percentages of sharing devices (𝜒2 (1, N = 85) = 4.79, p < 0.05) and utilizing the university’s equipment-loan program (𝜒2 (1, N = 70) = 47.27, p < 0.001).
Furthermore, internet quality varied greatly across our sample. In total, 29% of participants described their internet as either bad or unpredictable, 57% deemed it as OK, whereas only 14% considered their internet quality to be great. To better understand the impact of internet quality, we operationalized those with “unstable” internet as either bad or unpredictable and “stable” internet as either OK or great. Students who were of traditional age (𝜒2 (1, N = 517) = 7.07, p < 0.01), female (𝜒2 (1, N = 469) = 9.41, p < 0.01), or full-time (𝜒2 (1, N = 564) = 6.22, p < 0.05) were significantly more likely to report unstable internet quality compared to their counterparts. During interviews, students often mentioned internet quality issues. As one student observed: “So it’s supposed to be high-speed, but it’s really not. It lags, it stops... it’s really annoying.” Another bemoaned, “I’m trying to do so much, it’s gotten to the point where half of the time my Zoom freezes it goes out probably once or twice a week.” In addition, students said there were more people on the connection than before, with students’ siblings, parents, or roommates simultaneously working from home. Sample responses included, “Although [the internet connection] is good, if there are a lot of people in the house, it tends to slow down” and “I have two roommates, so all three of us are in school and we’re all doing online learning.”
3.2. Coursework-Specific Technology Challenges
RQ2 aimed to assess coursework-specific technology challenges students faced (Table 3). Across the sample, only 17% reported no coursework-specific technology challenges. The most common challenge was accessing live lectures (e.g., Zoom lectures during synchronous courses), which affected more than half the sample (58%). Other, less common challenges included communicating with instructors or classmates (42%), viewing videos (e.g., pre-recorded lectures) (29%), and completing assignments (27%), using the campus LMS (20%) or required readings (14%).
Table 3.
Coursework-Specific Technology Challenges.
Similar to access to technology, income was a key predictor for technology-specific challenges. Those who were Pell-eligible had more difficulties in viewing videos needed for courses (𝜒2 (1, N = 370) = 5.88, p < 0.05), completing assignments (𝜒2 (1, N = 362) = 10.17, p < 0.01), and using the LMS (𝜒2 (1, N = 262) = 5.80, p < 0.05). A higher proportion of traditional-aged students had challenges accessing live lectures (𝜒2 (1, N = 1041) = 25.10, p < 0.001) and using LMS (𝜒2 (1, N = 360) = 5.41, p < 0.05) compared to non-traditional students. Similarly, more full-time students had issues accessing live lectures (𝜒2 (1, N = 1118) = 6.13, p < 0.05), viewing videos (𝜒2 (1, N = 567) = 10.16, p < 0.01), and using LMS (𝜒2 (1, N = 397) = 8.90, p < 0.01. Regarding gender, females reported more issues accessing live lectures (𝜒2 (1, N = 916) = 8.97, p < 0.01) than males.
In addition to the demographic predictors, we sought to investigate how internet quality may be linked to the technology-specific challenges. Across all technology-specific challenges, those with unstable internet were significantly more affected than students whose internet was stable. Accessing live lectures was a challenge for 58% of the sample, but 80% of participants with unstable internet reported this to be problematic compared to 49% with stable internet. Moreover, a greater proportion of users with unstable internet reported issues with communicating with others (𝜒2 (1, N = 326) = 35.70, p < 0.001); watching videos (𝜒2 (1, N = 265) = 83.13, p < 0.001); using the LMS (𝜒2 (1, N = 207) = 98.04, p < 0.001); and reading required materials for their courses (𝜒2 (1, N = 139) = 48.45, p < 0.001). Perhaps most worrying is that only 20% of those with stable internet reported issues in completing assignments, whereas nearly half (46%) with unstable internet had struggles doing so. When looking at the total sample, 27% had problems completing assignments, which appears modest; however, it is clear that completing assignments may be linked to the quality of the students’ internet. In addition to negative impacts on grades, being unable due to complete assignments can also lead to distress. As one student explained, “... if my Wi-Fi drops and I’m in the middle of something and it doesn’t save or something like that. Doing every single thing online, you’re always like, ‘Oh God, is it going to drop in between?’”
3.3. Challenges of Working at Home
RQ3 aimed to assess the challenges students experience while attending class at home (Table 4). A majority of participants (72%) reported unanticipated noise as a challenge. Over half (52%) experienced insufficient workspace, and 31% expressed challenges regarding childcare or other family-related obligations. Only 18% of our sample reported zero working from home challenges.
Table 4.
Working from Home Challenges.
Inequities from working at home were highly prevalent for Pell-eligible, first-generation, female, or Hispanic/Latino/Latina students. Pell-eligible students had a higher incidence of unanticipated noise challenges (𝜒2 (1, N = 912) = 13.06, p < 0.001) compared to non-Pell-eligible students, as well as more concerns about insufficient space (𝜒2 (1, N = 681) = 17.86, p < 0.001). Furthermore, Pell-eligible students were more likely to experience childcare or family challenges (𝜒2 (1, N = 451) = 56.41, p < 0.01). Similarly, a higher proportion of first-generation students experienced issues with insufficient space (𝜒2 (1, N = 372) = 7.45, p < 0.01) and childcare or family needs (𝜒2 (1, N = 269) = 53.61, p < 0.001). Students who are deemed most at risk for academic success (i.e., Pell-eligible and first-generation students) were twice as likely to report childcare or family challenges (𝜒2 (1, N = 229) = 69.23, p < 0.001) compared to students who were not at risk. Collectively, female students had more issues with childcare or family needs (𝜒2 (1, N = 499) = 7.07, p < 0.01), unanticipated noise (𝜒2 (1, N = 1150) = 15.54, p < 0.001), and insufficient space (𝜒2 (1, N = 838) = 10.48, p < 0.01). Finally, across all racial and ethnic demographics, Hispanic/Latino/Latina students had the highest percentage of challenges of working at home.
Interviews offered insight into how these challenges negatively impacted students’ ability to complete their coursework. Unanticipated noise and distractions often came from others in the home. Not only was this problematic for concentration, but it also affected students’ participation during live lectures. Several students remarked that there was so much going on in the background that they were forced to have their camera off or be muted, which often complemented issues of insufficient space. One student explained, “Because I live with my family, when I’d work outside in a kitchen or the dining room, my family would try to talk to me, or they’d be doing their other work and we’d be disrupting each other.” Another elaborated on the lack of space, but also mentioned that other obligations interfered with their work:
“There’s a lot of chaos in my house. You have the dogs, you have other people working, and there’s a lot of noise and the TV. There’s a lot of distractions, so being able to focus on what you need to do isn’t always easy. Also, not having a dedicated space for work can be difficult because it’s uncomfortable or it’s too comfortable. It’s not the best environment for necessarily focusing on what you need to do. And of course, if you look around the house like, ‘Oh gosh, I need to do this or I need to do that.’ There’s always something else that needs to be done when you’re in this space.”
Finally, one key theme emerged from the qualitative data that was not captured in the survey: students struggled separating their academic and personal lives. As one student mentioned, “Working from home, there’s no separation. You don’t feel relaxed, and your room is no longer sacred, or your home is no longer relaxing.” Another said, “It’s hard to focus… pretty much my whole life is in this one room.”
4. Discussion
The purpose of this study was to better understand the technology challenges undergraduates faced at a large, Hispanic-serving public university where 57% of students are low-income and almost a third are first-generation. We also aimed to determine how the results from our study compared to those reported among college students in national studies and at R1 universities. The results from this study offer insight into the digital divide inequities faced by the students at the 87 public, four-year Hispanic-serving campuses in the United States, which have a combined enrollment of more than 1.5 million students [59]. Additionally, we hope to open the door for future research involving universities that primarily serve underrepresented populations. This is especially important in light of the expectation that institutions of all stripes will continue to expand online learning options.
Students in our study were most affected by internet quality and device reliability and adequacy, with close to a third of them reporting problems with one or more of these issues. Although measures vary among studies, this high incidence of the first-level of the digital divide is more comparable to that found in a national study of college-bound high school students [23] or among K–12 households in California [60], than what is found among college students in nationwide studies and at R1 institutions.
More specifically, 21% of students in our sample lacked the optimal device combination of a smartphone and either a laptop or desktop, and 3% reported having only a phone and/or tablet. Comparatively, a recent study (N = 86,236) of higher education in California reported that 10% of students across 23 California State University campuses, 15 of which are HSIs and none of which are R1s, reported “not having a computer readily available” [50] (p. 11). Meanwhile, that same study reported that 8% of students at the nine undergraduate University of California (UC) campuses, all but one of which is an R1 institution and five of which are HSIs, lacked computers.
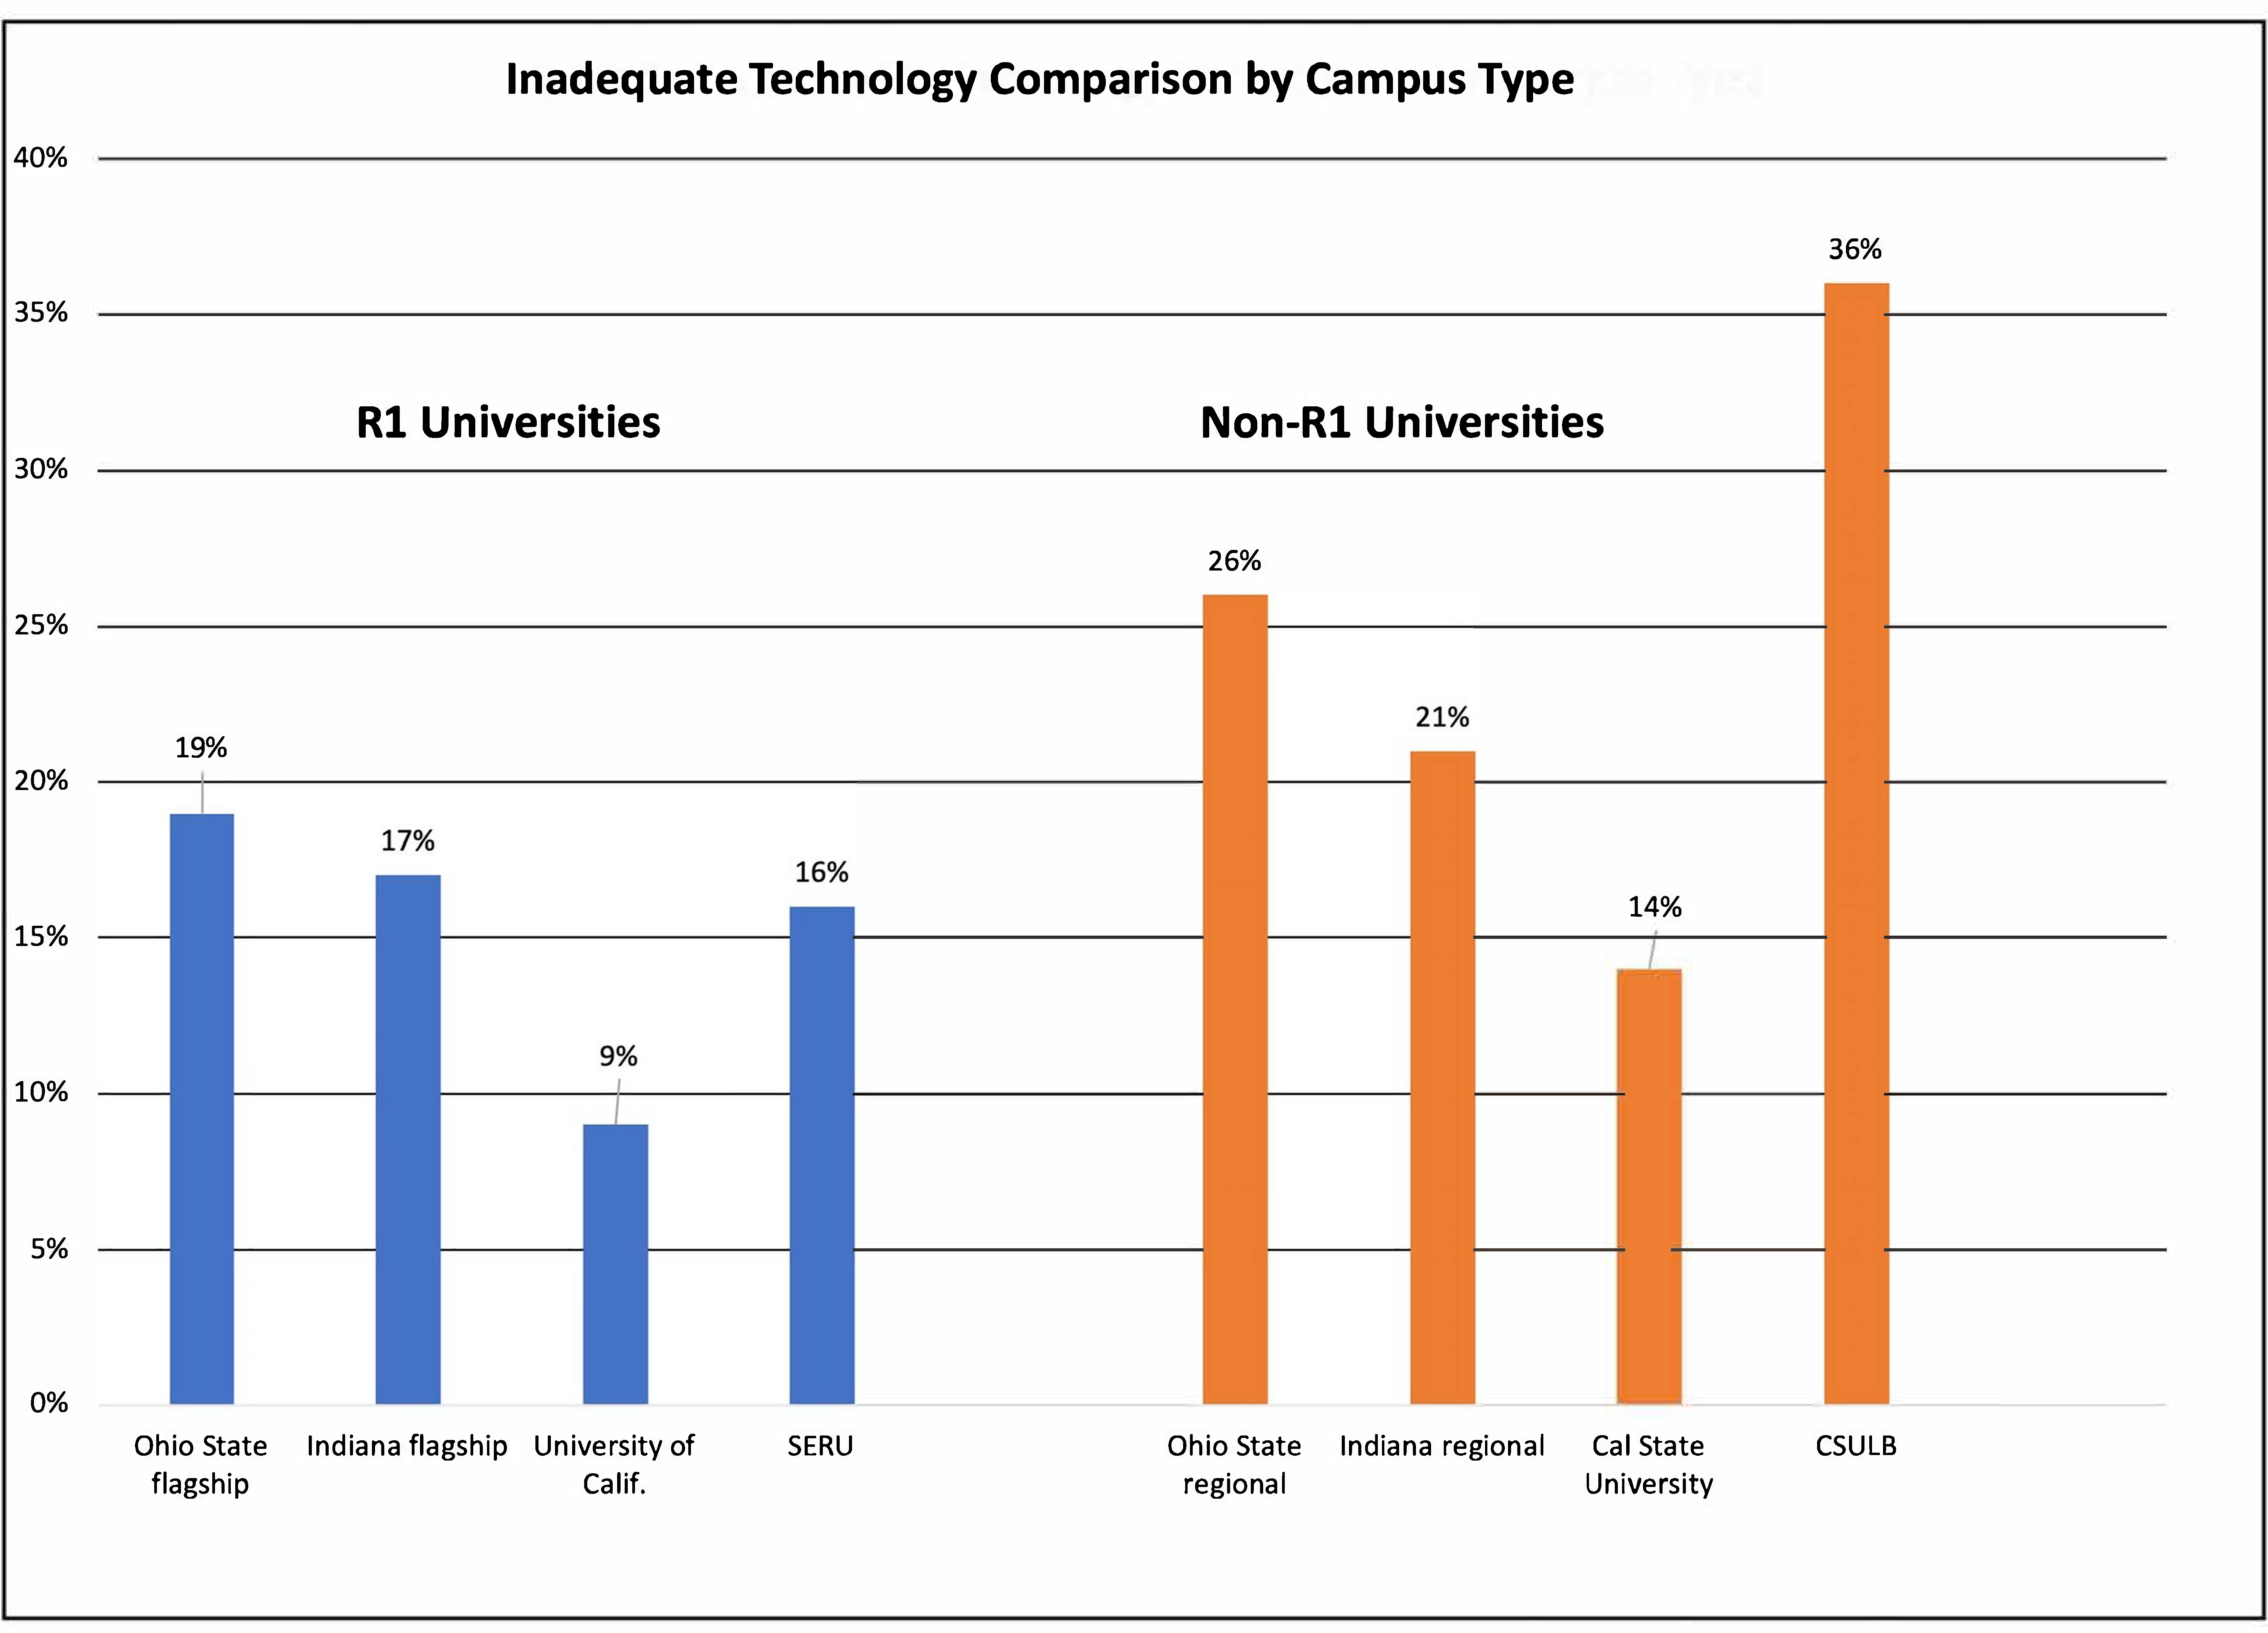
Furthermore, the gap in internet quality was considerably greater but directionally consistent. Unstable internet access was reported by 29% of students in our study, compared to 17% of students nationally [61], 14% of students at other California State University campuses and 9% of students at UC campuses [50]. The nonprofit Education Trust—West found just 12% of students nationally (N = 1010), and overall, in California (N = 321), reporting “no, limited, or sporadic access to the internet” [49] (p. 4). Although it is hard to compare results of studies with differently worded questions and different sample sizes, there appears to be a consistent difference for device access and internet connectivity at HSI campuses with high percentages of low-income students relative to studies at R1 institutions (see Figure 1).
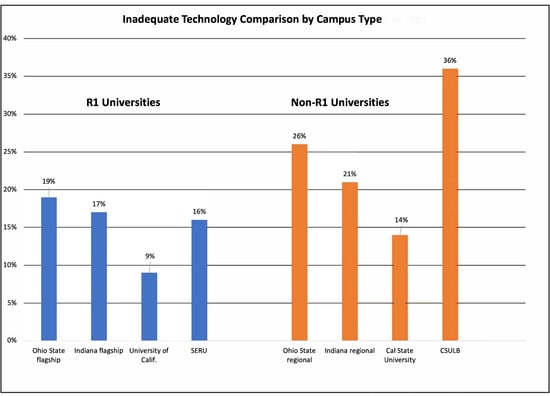
Figure 1.
Inadequate Technology Comparison by Campus Type. Sources: Jaggars et al. [42], Reed et al. [50], Soria et al. [62]. SERU: Student Experience in the Research University Consortium.
Although specific technology challenges were more prevalent among some demographic groups, coursework-related challenges were especially apparent among students with unstable internet access and the academically most at-risk students (those who are both low-income and first-generation). Significantly fewer at-risk students had access to the device combination that students say they consider optimal (i.e., a smartphone for convenience plus either a laptop or desktop for videos and learning management systems) than students who were higher income and whose parents went to college. These vulnerable students were also almost twice as likely to share devices. Even more troubling was that those with unstable internet had significantly more coursework-related struggles than those with stable internet. This was most apparent when accessing live lectures, where 80% of participants with unstable internet reported this to be a problem compared to 58% with stable internet.
In addition to the key results noted above, in contrast to the 2018 Galanek et al. study which found that “U.S. students. appear to have overcome the problem of access to internet-enabled devices and reliable Wi-Fi” [45] (p. 7), we found significant percentage differences by gender, age, enrollment status, first-generation, and income:
- Gender: More women reported unstable internet.
- Age: More students under 25 had the optimal combination of devices, but they also reported more incidences of their devices not working and unstable internet. Older students were more likely to share a device or borrow technology from the university.
- Enrollment status: Full-time students were more likely to have the optimal device combination, but less likely to have stable internet access.
- First-generation: Students who were first in their family to attend college were less likely to have the optimal technology combination and more likely to share devices or borrow technology.
- Income: Pell-eligible students were less likely to have the optimal devices, and more likely to share or borrow technology.
Problems prompting the sharing of devices and the burdens of it were aptly described by one student, “Midway through the semester, I broke my computer, so I’ve been surviving on my iPad and trying to borrow my brother’s computer, but he’s also a full-time student.” Comments such as this illustrate the concept of the technology maintenance construct introduced by Gonzales in 2015 [19]. The construct proposes that “as access to information and communication technology peaks, the digital divide is increasingly characterized by the (in)ability to maintain access,” especially for lower income students and students of color [20] (p. 750). Thirty percent of our study respondents reported problems with devices not working, with the issue more prevalent among younger students and Black students.
Given the high incidence of technology inadequacy, coursework-specific technology challenges could be part of either the access-driven first level of the digital divide, or the skills-driven second level. This study found significant percentage differences in the challenges among several groups, especially for the most frequent problem, accessing live lectures:
- Gender: Women reported more difficulties accessing live lectures than men.
- Age: Younger students reported more problems accessing live lectures than older students.
- Race/Ethnicity: More Hispanic/Latino/Latina students and those of two or more races reported problems accessing live lectures.
- Enrollment status: Full-time students were more likely to report problems accessing live lectures and videos than part-time students.
- First-generation: These students were less likely to report difficulties communicating with instructors and classmates than students whose parents went to college.
- Income: Pell-eligible students were more likely to report challenges viewing videos and completing assignments than higher income students.
Limitations and Future Directions
The data in this study are cross-sectional; thus, we are unable to determine how challenges related to access to technology, technology-specific items, and working from home changed over time. Future studies should take a longitudinal approach to better assess how issues surrounding the digital divide develop, as well as a more in-depth analysis into the approaches that students take to overcome any barriers. In addition, this study took place during nearly universal remote classes. Although some of the technology issues are undoubtedly ameliorated by campus computing labs and Wi-Fi for students attending class in-person, the increasing move to hybrid and online classes raises many questions about whether students at universities with high numbers of low-income and first-generation students have the technology resources to thrive in hybrid and online courses.
Future studies would benefit from looking at the nuances within each level of the digital divide, as well as a clearer focus on, and the operationalization of, particular issues with access to technology. For example, our survey found that access to laptops was relatively high at 89%, but specific issues about these devices were only uncovered during the qualitative portion. Furthermore, more research is needed to better understand students’ perceptions surrounding the quality of internet access.
Additionally, the literature suggests that lending equipment was a step taken by many universities in response to the pandemic [63,64]. Our university had a similar initiative, yet only 8% of our sample used the program, despite 79% being aware and about a third of students mentioning problems with devices not working (30%) or equipment challenges (36%). Although this lack of participation may only be applicable to this university, future research could examine the steps taken by universities to create effective equipment programs, as well as conduct studies with students to understand why they utilize such programs or not.
Our sample is limited to current undergraduates. Prior research has shown that the digital divide is a predictor for students’ likelihood of attending college. Studies have found that access to high-speed internet is related to students’ college application decisions and outcomes and their performance on the SAT [21,65], especially considering the recent decision to take the SAT all-digital by 2024. We recommend that future research investigates multiple education levels to better understand how access to technology, and its effective use, can lead to informed decision-making regarding higher education. Training in the effective use of these 21st-century tools, at all education levels, along with reliable, adequate, universal internet access is paramount if there is to be an equitable technological future because “digital access and proficiency [has] become essential for competitiveness in nearly every aspect of life” [66].
Finally, the national and R1 studies used in this study are not perfect comparisons and were used to provide context. Future research would benefit from looking at the differences among R1 universities, HSIs, and other institutions comprising a variety of demographics.
Author Contributions
Conceptualization, T.B., J.W.A. and Carol Perruso; formal analysis, T.B.; methodology, T.B., J.W.A. and C.P.; project administration, J.W.A. and C.P.; software, T.B.; Supervision, T.B. and C.P.; validation, T.B.; visualization, T.B. and C.P.; writing—original draft, T.B., J.W.A. and C.P.; writing—review & editing, T.B., J.W.A. and C.P. All authors have read and agreed to the published version of the manuscript.
Funding
This research received no external funding.
Institutional Review Board Statement
Project 1682149-2 and 1682149-3 Digital Divide: How CSULB Students Are Affected REFERENCE #: 21-158 were approved per 45 CFR 46 Exempt 104(d)(2) on 22 November 2020 and 19 April 2021.
Informed Consent Statement
Informed consent was obtained from all subjects involved in the study.
Data Availability Statement
The data presented in this study are openly available on Figshare at doi: 10.6084/m9.figshare.17283842.
Acknowledgments
The authors would like to thank Sharlene Sayegh, Institutional Assessment & Accreditation Liaison Officer; Kerry Klima, Assessment and Educational Partnerships, in the Division of Student Affairs; Mahmoud Albawaneh, Institutional Research & Analytics; Erin Jacobs, Student Success Analytics at San Diego State University; J.D. Aubele, UC Irvine; the students in the Fall 2020 JOUR 494 Research Methods course who conducted the qualitative interviews; and all of the study participants.
Conflicts of Interest
The authors declare no conflict of interest.
Appendix A
Technology Survey
- Which of the following concerns have you encountered in navigating and completing your courses during alternative course delivery during the Fall 2020 term? (Select all that apply):
- ○
- Accessing technology (computer, internet, headphones, microphones, etc.) needed for your online classes
- ○
- Social/Political environment
- ○
- Academic advising
- ○
- Workload
- ○
- Food insecurity
- ○
- Housing insecurity
- ○
- Emergency grant aid
- Are you aware that {redacted} has a program to assist students with access to technology (including internet access and devices)? (Yes/No)
- Are you currently using technology provided by {redacted}? (Yes/No)
- Which of the following types of devices do you have access to? Please choose all that apply:
- ○
- Chromebook
- ○
- Laptop
- ○
- Smartphone
- ○
- Tablet
- ○
- Desktop
- ○
- Other
- Do you share your principal device with others? (Yes/No)
- How much time per day do you usually have available to use your principle device?
- ○
- 1–2 h
- ○
- 3–4 h
- ○
- 5–6 h
- ○
- Unlimited time
- If you found it challenging to work from your home, please indicate why (please select all that apply):
- ○
- Childcare/Family needs
- ○
- Economic hardship
- ○
- Equipment/Wi-Fi/Technology needs
- ○
- Unanticipated noise/disturbances
- ○
- Insufficient workspace
- At home, which of the following methods gives you access to the internet? Please choose all that apply.
- ○
- Cellular data plan
- ○
- High-speed internet
- ○
- Hotspot
- ○
- I do not know how I have home internet access
- ○
- I do not access the internet at home
- How would you describe the quality of the internet connection where you do most of your academic work that requires online access?
- ○
- Bad. My internet access is slow and works poorly most of the time.
- ○
- Unpredictable. Sometimes the internet connection is good; sometimes it is bad.
- ○
- Ok. Most days I have a good internet connection.
- ○
- Great. I never have problems.
- Have you had technological difficulties completing any of the following school-related activities? Please check all that apply.
- ○
- Accessing live lectures (e.g., Zoom)
- ○
- Checking grades/homework (accessing, doing, submitting)
- ○
- Required readings
- ○
- Problems with device not working
- ○
- Writing essays or papers
- ○
- Using learning management system {name redacted}
- ○
- Communicating with classmates
- ○
- Watching videos (recorded lectures, assigned movies, etc.)
- ○
- Communicating with instructor
- ○
- Researching/Finding information
References
- Dortch, C. Federal Pell Grant Program of the Higher Education Act: Primer; CRS No. R45418; Congressional Research Service: Washington, DC, USA, 2018. Available online: https://crsreports.congress.gov/product/pdf/R/R45418/1 (accessed on 3 October 2021).
- The Carnegie Classification of Institutions of Higher Education. Basic Classification Description. (No Date). Available online: https://carnegieclassifications.iu.edu/classification_descriptions/basic.php (accessed on 20 December 2021).
- Eastin, M.S.; Cicchirillo, V.; Mabry, A. Extending the digital divide conversation: Examining the knowledge gap through media expectancies. J. Broadcast. Electron. Media 2015, 59, 416–437. [Google Scholar] [CrossRef]
- Peacock, A. Human Rights and the Digital Divide; Routledge: Abingdon-on-Thames, UK, 2019. [Google Scholar]
- Yu, L. Understanding information inequality: Making sense of the literature of the information and digital divides. J. Libr. Inf. Sci. 2006, 38, 229–252. [Google Scholar] [CrossRef] [Green Version]
- Jaegar, P.T.; Bertot, J.C.; Thompson, K.M.; Katz, S.M.; DeCoster, E.J. The intersection of public policy and public access: Digital divides, digital literacy, digital inclusion, and public libraries. Public Libr. Q. 2012, 31, 1–20. [Google Scholar] [CrossRef]
- Atske, S.; Perrin, A. Home Broadband Adoption, Computer Ownership Vary by Race, Ethnicity in the U.S—Pew Research. Available online: https://www.pewresearch.org/fact-tank/2021/07/16/home-broadband-adoption-computer-ownership-vary-by-race-ethnicity-in-the-u-s/ (accessed on 16 August 2021).
- Büchi, M.; Just, N.; Latzer, M. Modeling the second-level digital divide: A five-country study of social differences in Internet use. New Media Soc. 2016, 18, 2703–2722. [Google Scholar] [CrossRef]
- Hoffman, D.L.; Novak, T.P. Bridging the Racial Divide on the Internet. Science 1998, 280, 390–391. [Google Scholar] [CrossRef]
- Katz, J.; Aspden, P. Motivations for and barriers to Internet usage: Results of a national public opinion survey. Internet Res. 1997, 7, 170–188. [Google Scholar] [CrossRef]
- Ragnedda, M.; Kreitem, H. The Three Levels of Digital Divide in East EU Countries. World Media J. Russ. Media J. Stud. 2018, 1, 5–26. [Google Scholar] [CrossRef]
- van Deursen, A.J.; van Dijk, J.A. The first-level digital divide shifts from inequalities in physical access to inequalities in material access. New Media Soc. 2019, 21, 354–375. [Google Scholar] [CrossRef] [Green Version]
- United States Census Bureau. Computer and Internet Use in the United States: 2018. Available online: https://www.census.gov/content/dam/Census/library/publications/2021/acs/acs-49.pdf (accessed on 1 June 2021).
- Vogels, E.A. Digital Divide Persists Even as Americans with Lower Incomes Make Gains in Tech Adoption—Pew Research. Available online: https://www.pewresearch.org/fact-tank/2021/06/22/digital-divide-persists-even-as-americans-with-lower-incomes-make-gains-in-tech-adoption/ (accessed on 20 August 2021).
- Katz, V.S. What it means to be “under-connected” in lower-income families. J. Child. Media 2017, 11, 241–244. [Google Scholar] [CrossRef]
- McClain, C. 34% of Lower-Income Home Broadband Users Have Had Trouble Paying for Their Service amid COVID-19—Pew Research. Available online: https://www.pewresearch.org/fact-tank/2021/06/03/34-of-lower-income-home-broadband-users-have-had-trouble-paying-for-their-service-amid-covid-19/ (accessed on 2 July 2021).
- Chandra, S.; Chang, A.; Day, L.; Fazlullah, A.; Liu, J.; McBride, L.; Mudalige, T.; Weiss, D. Closing the K-12 digital divide in the age of distance learning. Broadband Communities Mag. 2020, 60–63. Available online: https://www.bbcmag.com/pub/doc/BBC_Nov20_DigDivide.pdf (accessed on 9 April 2021).
- Anderson, M.; Perrin, A. Nearly One-in-Five Teens Can’t Always Finish Their Homework Because of the Digital Divide—Pew Research. Available online: https://www.pewresearch.org/fact-tank/2018/10/26/nearly-one-in-five-teens-cant-always-finish-their-homework-because-of-the-digital-divide/ (accessed on 2 April 2021).
- Gonzales, A. The contemporary US digital divide: From initial access to technology maintenance. Inf. Commun. Soc. 2015, 19, 234–248. [Google Scholar] [CrossRef]
- Gonzales, A.L.; Calarco, J.M.; Lynch, T. Technology Problems and Student Achievement Gaps: A Validation and Extension of the Technology Maintenance Construct. Commun. Res. 2020, 47, 750–770. [Google Scholar] [CrossRef] [Green Version]
- Dettling, L.J.; Goodman, S.F.; Smith, J. Every Little Bit Counts: The Impact of High-Speed Internet on the Transition to College; Finance and Economics Discussion Series; Divisions of Research & Statistics and Monetary Affairs, Federal Reserve Board: Washington, DC, USA, 2015. Available online: https://www.federalreserve.gov/econresdata/feds/2015/files/2015108pap.pdf (accessed on 19 March 2021).
- Dolan, J.E. Splicing the Divide: A Review of Research on the Evolving Digital Divide among K–12 Students. J. Res. Technol. Educ. 2015, 48, 16–37. [Google Scholar] [CrossRef]
- Moore, R.; Vitale, D.; Stawinoga, N. The Digital Divide and Educational Equity: A Look at Students with Very Limited Access to Electronic Devices at Home; Insights in Education and Work; ACT Center for Equity in Learning: Iowa City, IA, USA, 2018. Available online: https://files.eric.ed.gov/fulltext/ED593163.pdf (accessed on 22 March 2021).
- Reisdorf, B.C.; Triwibowo, W.; Yankelevich, A. Laptop or Bust: How Lack of Technology Affects Student Achievement. Am. Behav. Sci. 2020, 64, 927–949. [Google Scholar] [CrossRef]
- Selwyn, N. Degrees of Digital Division: Reconsidering Digital Inequalities and Contemporary Higher Education. RUSC. Univ. Knowl. Soc. J. 2010, 7, 33–42. Available online: https://www.redalyc.org/pdf/780/78012953011.pdf (accessed on 2 August 2021). [CrossRef] [Green Version]
- Slate, J.R.; Manuel, M.; Briston, K.H., Jr. The “Digital Divide”: Hispanic college students’ views of educational uses of the Internet. Assess. Eval. High. Educ. 2002, 27, 75–93. [Google Scholar] [CrossRef]
- Bertot, J.C. The multiple dimensions of the digital divide: More than the technology ‘haves’ and ‘have nots’. Gov. Inf. Q. 2003, 20, 185–191. [Google Scholar] [CrossRef]
- Chen, W. The Implications of Social Capital for the Digital Divides in America. Inf. Soc. 2013, 29, 13–25. [Google Scholar] [CrossRef]
- Kling, R. What is social informatics and why does it matter? D-Lib Mag. 1999, 5, 1–32. Available online: https://www.dlib.org/dlib/january99/kling/01kling.html (accessed on 9 December 2020). [CrossRef]
- Aguilar, S.J. Guidelines and tools for promoting digital equity. Inf. Learn. Sci. 2020, 121, 285–299. [Google Scholar] [CrossRef]
- Jones, S.; Johnson-Yale, C.; Millermaier, S.; Pérez, F.S. U.S. College Students’ Internet Use: Race, Gender and Digital Divides. J. Comput. Commun. 2009, 14, 244–264. [Google Scholar] [CrossRef] [Green Version]
- Seiden, P.A. Bridging the digital divide. Ref. User Serv. Q. 2000, 39, 329. [Google Scholar]
- Howland, J.S. The ‘Digital Divide’: Are we becoming a world of technological ‘haves’ and ‘have-nots?’. Electron. Libr. 1998, 16, 287–289. [Google Scholar] [CrossRef]
- Wei, L.; Hindman, D.B. Does the Digital Divide Matter More? Comparing the Effects of New Media and Old Media Use on the Education-Based Knowledge Gap. Mass Commun. Soc. 2011, 14, 216–235. [Google Scholar] [CrossRef]
- Blank, G.; Grošelj, D. Dimensions of Internet use: Amount, variety, and types. Inf. Commun. Soc. 2014, 17, 417–435. [Google Scholar] [CrossRef]
- Garg, R.; Sengupta, S. ”When you can do it, why can’t I?”: Racial and socioeconomic differences in family technology use and non-use. Proc. ACM Hum. Comput. Interact. 2019, 3, 63. [Google Scholar] [CrossRef] [Green Version]
- Jackson, L.A.; Zhao, Y.; Kolenic, A.; Fitzgerald, H.E.; Harold, R.; Von Eye, A. Race, Gender, and Information Technology Use: The New Digital Divide. Cyberpsychol. Behav. 2008, 11, 437–442. [Google Scholar] [CrossRef]
- Scheeder, A.; van Deursen, A.; van Dijk, J. Determinants of Internet skills, uses and outcomes. A systematic review of the second- and third-level digital divide. Telemat. Inform. 2017, 34, 1607–1624. [Google Scholar] [CrossRef]
- Watkins, S.C. The Digital Edge: How Black and Latino Youth Navigate Digital Inequality; New York University Press: New York, NY, USA, 2018. [Google Scholar]
- Zillien, N.; Hargittai, E. Digital Distinction: Status-Specific Types of Internet Usage. Soc. Sci. Q. 2009, 90, 274–291. [Google Scholar] [CrossRef]
- Katz, V.S.; Jordan, A.B.; Ognyanova, K. Digital inequality, faculty communication, and remote learning experiences during the COVID-19 pandemic: A survey of U.S. undergraduates. PLoS ONE 2021, 16, e0246641. [Google Scholar] [CrossRef]
- Jaggars, S.S.; Motz, B.A.; Rivera, M.D.; Heckler, A.; Quick, J.D.; Hance, E.A.; Karwischa, C. The Digital Divide among College Students: Lessons Learned from the COVID-19 Emergency Transition; Policy Report; Midwestern Higher Education Compact: Minneapolis, MN, USA, 2021. Available online: https://files.eric.ed.gov/fulltext/ED611284.pdf (accessed on 8 February 2021).
- Dahlstrom, E.; Brooks, D.C.; Grajek, S.; Reeves, J. ECAR Study of Students and Information Technology, 2015; Research Report; Educause Center for Analysis and Research: Louisville, CO, USA, 2015; Available online: https://library.educause.edu/resources/2015/8/~/media/24ddc1aa35a5490389baf28b6ddb3693.ashx (accessed on 6 August 2021).
- Dello Stritto, M.E.; Linder, K.E. Student Device Preferences for Online Course Access and Multimedia Learning; Oregon State University, Ecampus Research Unit: Corvallis, OR, USA, 2018; Available online: https://ecampus.oregonstate.edu/research/study/student-device-preferences/student-device-preferences-study.pdf (accessed on 6 August 2021).
- Galanek, J.D.; Gierdowski, D.C.; Brooks, D.C. ECAR Study of Undergraduate Students and Information Technology, 2018; Educause Center for Analysis and Research: Louisville, CO, USA, 2018; Available online: https://www.educause.edu/ecar/research-publications/ecar-study-of-undergraduate-students-and-information-technology/2018/introduction-and-key-findings (accessed on 23 June 2021).
- Kwakye, I.; Kibort-Crocker, E.; Lundgren, M.; Pasion, S. The Digital Divide: Examining High-Speed Internet and Computer Access for Washington Students; Washington Student Achievement Council: Olympia, WA, USA, 2021. Available online: https://files.eric.ed.gov/fulltext/ED613330.pdf (accessed on 17 June 2021).
- Galanek, J.D.; Gierdowski, D.C.; Brooks, D.C. 2018 Students and Technology Research Study; Educause Center for Analysis and Research: Louisville, CO, USA, 2018; Available online: https://library.educause.edu/resources/2018/10/2018-students-and-technology-research-study (accessed on 23 June 2021).
- Grajek, S. Educause COVID-19 QuickPoll Results: Help for Students; Research Notes. Available online: https://er.educause.edu/blogs/2020/4/educause-covid-19-quickpoll-results-help-for-students (accessed on 30 April 2020).
- Global Strategy Group. Higher Ed Survey Highlights the Academic, Financial, and Emotional Toll of Coronavirus on Students; Memo; Global Strategy Group: New York, NY, USA, 2020; Available online: https://edtrustmain.s3.us-east-2.amazonaws.com/wp-content/uploads/sites/3/2017/11/27120859/Higher-Ed-Nationwide-CA-Memo-F05.27.20.pdf (accessed on 6 July 2021).
- Reed, S.; Friedmann, E.; Kurlaender, M.; Martorell, P.; Rury, D.; Moldoff, J.; Fuller, R.; Perry, P. California College Students’ Experiences during the Global Pandemic; California Student Aid Commission: Rancho Cordova, CA, USA, 2021. Available online: https://www.csac.ca.gov/sites/main/files/file-attachments/fall_2020_covid19_student_survey_results_presentation.pdf?1623427361 (accessed on 21 July 2021).
- Barber, P.H.; Shapiro, C.; Jacobs, M.S.; Avilez, L.; Brenner, K.I.; Cabral, C.; Cebreros, M.; Cosentino, E.; Cross, C.; Gonzalez, M.L.; et al. Disparities in Remote Learning Faced by First-Generation and Underrepresented Minority Students during COVID-19: Insights and Opportunities from a Remote Research Experience. J. Microbiol. Biol. Educ. 2021, 22, 1–25. [Google Scholar] [CrossRef]
- Means, B.; Neisler, J. Langer Research Associates. Suddenly Online: A National Survey of Undergraduates during the COVID-19 Pandemic; Digital Promise: San Mateo, CA, USA, 2020; Available online: https://digitalpromise.org/wp-content/uploads/2020/07/ELE_CoBrand_DP_FINAL_3.pdf (accessed on 18 January 2021).
- Gierdowski, D.C. ECAR Study of Undergraduate Students and Information Technology, 2019; Educause Center for Analysis and Research: Louisville, CO, USA, 2019; Available online: https://library.educause.edu/-/media/files/library/2019/10/studentstudy2019.pdf?la=en&hash=25FBB396AE482FAC3B765862BA6B197DBC98B42C (accessed on 22 January 2021).
- Gierdowski, D.C.; Brooks, D.C.; Galanek, J. Educause 2020 Student Technology Report: Supporting the Whole Student; Educause Center for Analysis and Research: Louisville, CO, USA, 2020; Available online: https://www.educause.edu/ecar/research-publications/student-technology-report-supporting-the-whole-student/2020/introduction (accessed on 22 January 2021).
- Guzman, A.; King, C.A. Reaching Individual Success and Empowerment (RISE): A First-generation, Co-curricular, Academic, and Social Engagement Model. J. Bus. Divers. 2018, 18, 43. [Google Scholar] [CrossRef]
- Lee, K.S.; Chen, W. A long shadow: Cultural capital, techno-capital and networking skills of college students. Comput. Hum. Behav. 2017, 70, 67–73. [Google Scholar] [CrossRef]
- Lu, C.; Straubhaar, J.D. The influence of techno-capital and techno-disposition on the college-going processes of Latina/o college students in Central Texas. Learn. Media Technol. 2014, 39, 184–198. [Google Scholar] [CrossRef]
- Buzzetto-Hollywood, N.A.; Wang, H.C.; Elobeid, M.; Elobaid, M.E. Addressing Information Literacy and the Digital Divide in Higher Education. Interdiscip. J. e-Skills Lifelong Learn. 2018, 14, 77–93. [Google Scholar] [CrossRef] [Green Version]
- United States Department of Education, National Center for Education Statistics. Table 312.40: Enrollment and Degrees Conferred in Hispanic-Serving Institutions, by Institution Level and Control, Percentage Hispanic, Degree Level, and Other Selected Characteristics: Fall 2018 and 2017–2018; Table; National Center for Education Statistics: Washington, DC, USA, 2019. Available online: https://nces.ed.gov/programs/digest/d19/tables/dt19_312.40.asp (accessed on 18 March 2021).
- University of Southern California, Annenberg Research Network for International Communication. Connected Cities and Inclusive Growth: The Distance Learning Gap in California; Policy Brief; University of Southern California, Annenberg Research Network for International Communication: Los Angeles, CA, USA, 2020; Available online: http://arnicusc.org/wp-content/uploads/2020/04/Policy-Brief-6.pdf (accessed on 13 August 2021).
- Gierdowski, D.C. Student Experiences with Connectivity and Technology in the Pandemic; Research Report; Educause Center for Analysis and Research: Louisville, CO, USA, 2021; Available online: https://www.educause.edu/ecar/research-publications/2021/student-experiences-with-connectivity-and-technology-in-the-pandemic/introduction-and-key-findings (accessed on 30 June 2021).
- Soria, K.M.; Chirikov, I.; Jones-White, D. The Obstacles to Remote Learning for Undergraduate, Graduate, and Professional Students; SERU Consortium, University of California: Berkeley, CA, USA; University of Minnesota: Minneapolis, MN, USA, 2020; Available online: https://conservancy.umn.edu/handle/11299/215275 (accessed on 20 December 2021).
- Yeager, A.; Research Libraries Redeploy Loaner Laptops to Aid Students during COVID-19 Closures. Association of Research Libraries. Available online: https://www.arl.org/blog/research-libraries-redeploy-loaner-laptops-to-aid-students-during-covid-19-closures/ (accessed on 23 November 2020).
- Berkley Student Technology Fund. Technology Access Program (TAP) and Student Technology Equity Program (STEP). Available online: https://techfund.berkeley.edu/impact/response-covid-19/technology-access-program-tap-and-student-technology-equity-program-step (accessed on 16 August 2021).
- Corwin, Z.; Maruco, T.J. Navigating the tension between scale and school context in digital college guidance. J. Inf. Commun. Ethics Soc. 2018, 16, 303–310. [Google Scholar] [CrossRef]
- Office of Policy Development and Research. Community Development and the Digital Divide; Evidence Matters; Office of Policy and Research Development: Washington, DC, USA, 2016. Available online: https://www.huduser.gov/portal/periodicals/em/fall16/highlight1.html (accessed on 21 October 2021).
Publisher’s Note: MDPI stays neutral with regard to jurisdictional claims in published maps and institutional affiliations. |
© 2022 by the authors. Licensee MDPI, Basel, Switzerland. This article is an open access article distributed under the terms and conditions of the Creative Commons Attribution (CC BY) license (https://creativecommons.org/licenses/by/4.0/).