1. Introduction
Educational assessments are increasingly being delivered via computer and collect a wide variety of information from students during the testing process. The end result for most students is a single test score, or perhaps several sub-scores, describing students’ performance on specific domains within a subject area. These overall scores and sub-scores are used to make inferences about students’ knowledge, skills, and abilities. However, these scores are only coarse indicators of the proficiencies we are trying to measure. Therefore, there is great interest in gaining a better understanding of students’ proficiencies from educational assessments. Part of that interest is in improving assessments to better capture student behaviors that are reflective of their knowledge and skills on the constructs targeted by the assessments.
When educational tests are administered on a computer, students exhibit behaviors that can be digitally captured—some of which are related to their proficiency, and some are not. These potentially informative behaviors are ignored by traditional views of assessing students. Some researchers have proposed models for using the amount of time students take to respond to test items in scoring (e.g., van der Linden [
1,
2]), but clearly there are other behaviors students exhibit on computer-based tests (CBTs) that could be of interest. Such behaviors include accessing available reference or resource material (e.g., on-screen calculators), navigating between and back to items, changing responses, and skipping items. These data can be referred to as “response process data” because they describe the actions students exhibit as they navigate through a testing experience [
3,
4,
5,
6].
Response process data can take a variety of forms, only some of which are relevant to the constructs intended to be measured. In principle, there are many ways in which these processes could be categorized.
Figure 1 illustrates one theoretical model of the universe of test-taker behaviors that can be captured in a CBT; only some are considered to reflect the targeted construct, and typically only a subset of these are captured in scoring. Traditionally, scored behaviors are limited to direct responses to items (e.g., selecting an answer option); however, behaviors that are not traditional item responses can also be defined and evaluated according to a rubric (e.g., how appropriately a student interacts with a simulated task or effectively plots points on a graph). These two types of scorable response processes include everything that falls within the inner two ellipses in
Figure 1.
Other types of student actions and events are not scored but may still be related to the constructs measured, and hence they have the potential for increasing representation of the construct (the grey ellipse in
Figure 1). For example, the
order in which a student makes selections in a multiple-response item (rather than the selections per se) may reveal something about their cognitive processes in relation to the target construct. Finally, other test-taker actions and events not considered to be related to the target construct(s) may still reflect cognitive, affective, and behavioral phenomena that impact test scores (e.g., confidence, motivation, prior technological experience, strategies, self-regulation, etc.). Such cognitions can be revealed in observable processes, such as how students navigate through the testing system. Thus, the entire set of students’ responses to items on CBTs can be partitioned into those that are construct-relevant and those that are not; not all of the construct-relevant responses students exhibit are leveraged in gauging students’ proficiencies.
In addition to providing information about student proficiency, response process data may be helpful for providing “forensic” information for evaluating the design characteristics of the test itself. This information may be helpful for identifying threats to validity or design strengths, including low-level general issues such as usability of the interface or the use of tools and supports. Other process information that arguably falls into this category includes the interactivity patterns observed for the different CBT item formats. For example, if some item formats are responded to more (or less) quickly by students, or facilitate more student engagement, they may contribute to a more valid and efficient assessment. Thus, there is great potential in exploring students’ response process behavior for both gauging students’ proficiencies and evaluating the effectiveness of various item formats. In this article, we analyze students’ log data from a computer-based test to learn more about their response processes and how they can be used to better understand student proficiencies and assessment characteristics. Before describing our exploration of these potentials in the present study, we first present a brief review of some relevant research in this area.
2. Previous Research on Analyzing Students’ Response Process Data
Research into students’ response behaviors while taking CBTs is relatively recent. Some research has focused on the total amount of time students take to respond to an item, while other research has focused on the amount of time it takes students to make a first response to an item. The consistency of these behaviors across item formats has also been studied. In addition, some researchers have looked at the total number of response actions as well as answer changing behavior.
2.1. Response Time
Li et al. [
7] claimed response time (RT) “offers a promising window into test takers’ cognitive processes and hence the construct(s) being measured… [and] offers an opportunity to build validity evidence for a test” (p. 159). RT has been used to evaluate validity by examining RT differences across various item formats. For example, multiple-choice (MC) items are frequently used because they are efficient for measuring a wide variety of content in a short amount of time. However, MC items are often limited to eliciting lower levels of cognitive processes [
8]. For this reason, many CBT item formats have been proposed to address the limitations of MC items while maintaining their advantages [
9,
10].
Some studies have explored RT across different item formats, such as MC and technology-enhanced items (TEIs). Jodoin [
11] explored the time test takers spent on solving traditional MC items and two TEI formats (drop-and-connect and create-a-tree items). He found examinees spent less time responding to MC items, and the TEIs provided less information per unit of testing time than the MC items, suggesting MC items had greater relative efficiency. Wan and Henly [
12] explored the average time test takers spent on answering different item formats, using data from a statewide science achievement test. They focused on three TEI formats: figural response, short constructed response (SCR), and extended constructed response (ECR). The results indicated the figural response items were equally efficient to MC items, whereas CR items, and in particular ECRs, were less efficient overall due to the longer completion time.
Other research has examined how more fine-grained design features within an item format affect RT. For example, Moon et al. [
13] examined how long test takers spent responding to different item formats under uncertainty. They focused on response behavior for variations of the “grid” item format (see
Appendix A), which requires test takers to select appropriate grid cells, with options presented in a table of rows and columns. Grid items were presented in three formats: forced choice (FC), which allows only one selection per row (similar to true–false items); non-forced choice (NFC), which allows more than one selection per row; and all possible options (APO), which includes all possible options as grid cells. Test takers spent significantly more time on the FC relative to the NFC and APO formats, suggesting that, even within the same grid item format, fine-grained design features such as visual layouts of answer options affect test takers’ response processes. Similarly, Arslan et al. [
14] investigated the effect of drag-and-drop item design features on test-taker macro-level (e.g., RT) and micro-level (first response latency, transition pauses, dragging time) measures by constructing different design variants of content-equivalent mathematics items. They found test-taker macro- and micro-level performance measures were significantly affected by design variants. They concluded that some observed process differences reflected low-level effects of design changes, such as the need for longer mouse movements to complete the necessary steps, whereas others reflected the cognitive effects of design changes, altering the cognitive steps in which test takers engaged.
2.2. First-Response Latency (FRL)
Several studies have investigated whether students who take a longer amount of time to make their first response to an item have higher overall proficiency. In addition to reading the item stem and constructing a mental representation of the problem, first-response latency (FRL) may include the time test takers use to plan how to solve questions. In this view, longer planning time, reflected in longer FRL, may lead to better performance in the response portion of the task, with more efficient strategies and fewer trials and errors (e.g., Albert and Steinberg [
15]; Mitchell and Poston [
16]; see Eichmann et al. [
17] for considering planning interval beyond FRL). Alternatively, longer FRLs may reflect greater difficulty due to construct-relevant factors such as prior knowledge or construct-irrelevant factors such as reading load. In this view, longer FRL should be associated with poorer item performance.
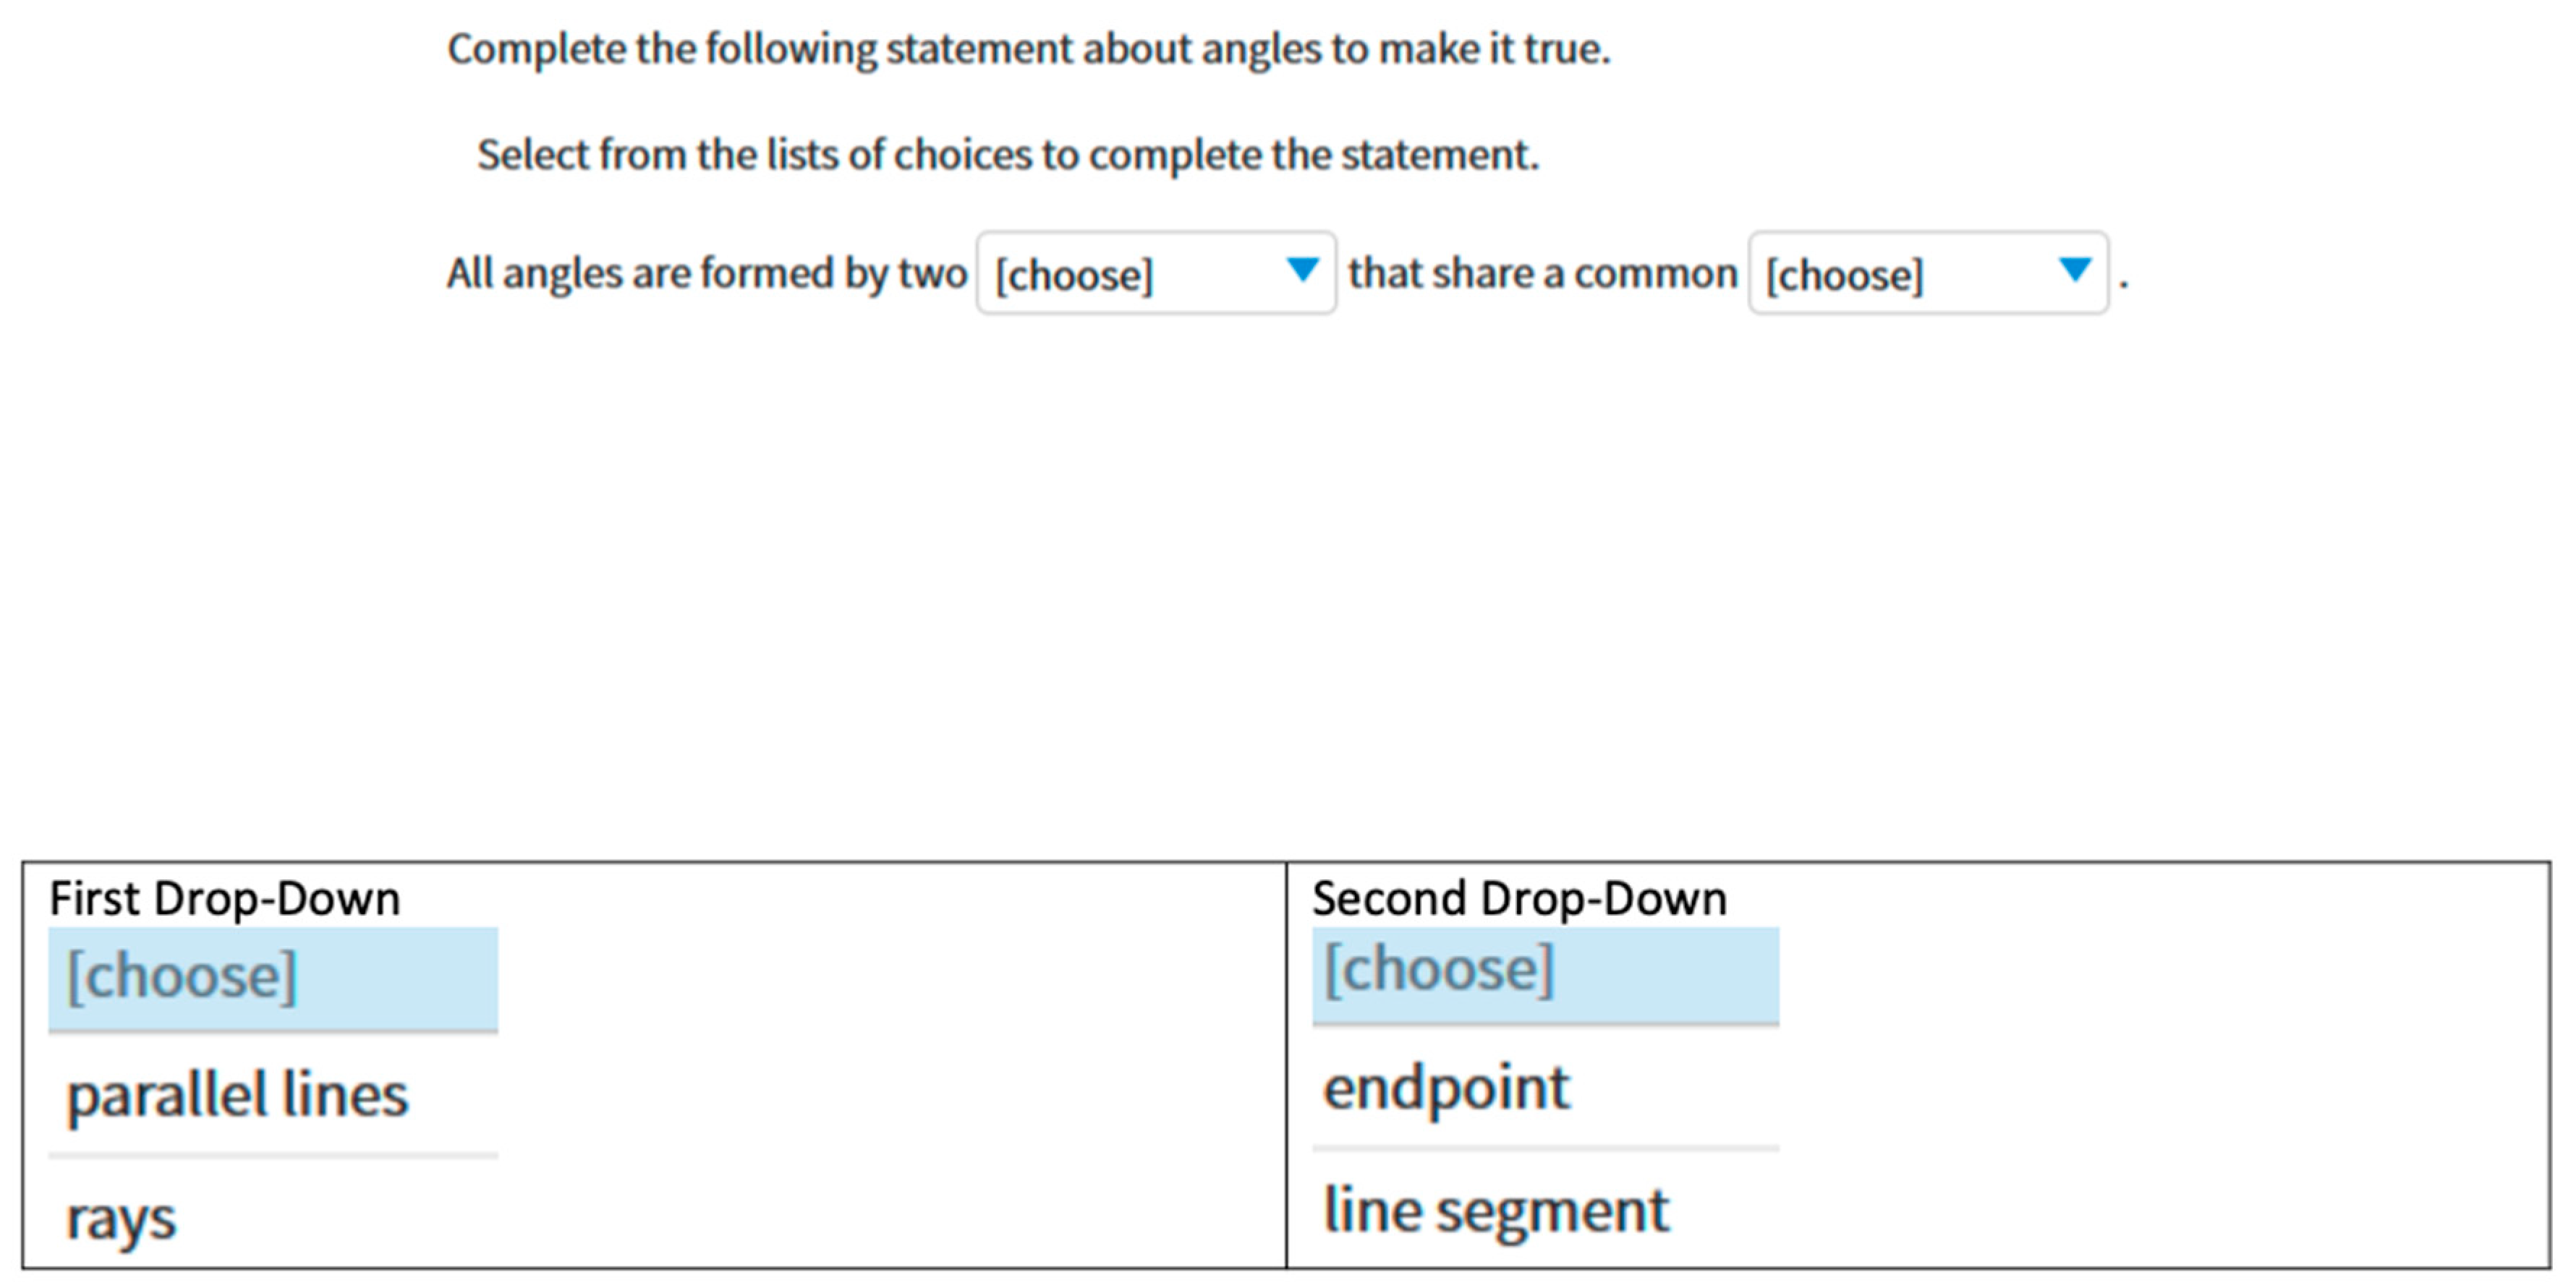
In the present study, we were interested in whether FRL differs systematically across item formats, which, to our knowledge, has not been previously studied. We hypothesized test takers might spend different amounts of time before making an initial response, depending on the item format, and that these differences may be related to particular cognitive or behavioral affordances of the item formats. For instance, test takers may take longer to plan their response in item formats requiring more complex actions than in those requiring simpler actions. Some item formats such as “inline choice” (see
Appendix A) may elicit relatively shorter FRL compared with other item formats, because answer options in inline choice items are initially hidden within a “closed” interactive drop-down menu, forcing test takers to quickly initiate an “open menu” action to view the answer options. The magnitudes of the differences between item formats, if found, may also differ for students of different ages. For example, they may be greater for lower grade levels, assuming that students at this level are relatively less familiar with the technology.
2.3. Number of Actions
Some research in the domain of complex problem solving suggests the number of actions test takers perform on an item is related to item difficulty. For example, Goldhammer et al. [
18] investigated the relationship between the number of actions performed during task completion and task success using process data from the Programme for the International Assessment of Adult Competencies (PIAAC). They hypothesized that number of actions is an indicator of test takers’ engagement to the task. They further hypothesized that performance should be low for test takers who performed either a very small or a very large number of actions—those who were less engaged and therefore performed few actions—and those who worked hard on solving the tasks but became disoriented as time went by, resulting in a high number of actions. In contrast, those who were moderately engaged in the task, and who therefore performed a moderate number of actions, should perform well because they concentrated on the task more efficiently. These hypotheses specify a nonlinear relationship between number of actions and task performance (performance increases with more actions but decreases after a certain number of actions). Their results showed an inverted U-shape relationship between number of actions and task performance for low complexity tasks, which was consistent with their hypothesis. However, the relationship showed a monotonically increasing S-shape for high-complexity tasks, implying more actions were related to a higher probability of correctly answering tasks.
In the present study, we examined a similar relationship by comparing proficiency versus mean number of actions performed by each student across all items, and across items of a given format. The stimuli in our research were discrete TEIs, not complex PIAAC-like tasks. We also investigated whether the relationship between proficiency and number of actions was consistent across item formats. If a systematic relationship was found, it may indicate different levels and types of engagement with the items, and if it differed according to item format, it may be informative with respect to the factors influencing engagement in digital assessment.
2.4. Summary and Introduction to the Present Study
Previous research into test takers’ response behavior has suggested differences in the amount of time it takes them to respond to different item formats, as well as nonlinear relationships between the number of actions on an item and performance. We note that the degree to which these response behaviors are consistent across different CBT item formats has not been widely studied, and it is possible there are differences in FRL across item formats. Therefore, in the present study, we analyze data from a computer-based mathematics achievement test at two grade levels. We explore various hypotheses to understand student cognition and behavior and to evaluate the quality of different item formats. The specific research questions addressed were as follows:
What is the relationship between students’ proficiency, response time, response time latency, and other response behaviors?
Do students take different amounts of time to respond to different item formats?
Do students take different amounts of time to make an initial response to different item formats?
Are the relationships among students’ response behaviors consistent across grade levels?
3. Method
3.1. Data
The data analyzed here come from a field test for a summative mathematics assessment administered to students in grades 3 (5854 students, mean age 9.2 years, SD = 0.67) and 4 (4568 students, mean age 10.2 years, SD = 0.65). A summary of the item formats investigated is presented in
Table 1. Examples of item formats are provided in
Appendix A. We focused on item formats that had at least five items that were field-tested in each grade. The grade 3 exam comprised 232 items, and the grade 4 exam comprised 237 items. Items were grouped into different test forms, with students responding to only 22–24 items on a form. There were 23 test forms for grade 3 and 25 forms for grade 4. The sample sizes for each item ranged from 212 to 1629. The median sample size for each item format within each grade is reported in the last column of the table (see
Figure A1 and
Figure A2). Although the sample sizes for some items were in the low 200s, the average sample sizes for items were all above 400. Items on the test were presented individually (one item per screen). Students could skip an item entirely or give a partial answer, could return to previous items using arrow buttons or via a “review” panel, or change a previous response. Unfortunately, no data were available for interactions with the review panel; however, we could trace students’ navigation across items in consecutive and nonconsecutive orderings.
3.2. Defining Response Process Variables
As described by Keehner and Smith [
19], it is difficult to identify and create construct-relevant variables from the myriad of log data available from a CBT. In this study we created several variables for investigation. Operational definitions are as follows.
Item response time (RT): Response time (RT) was defined as the total amount of time a student spent on an item. If a student visited an item multiple times, the time spent on the item was aggregated across visits. Time spent on specific visits was also calculated and was used in calculating other variables.
Number of visits: Given that students could view an item, move to another item without responding to it, and circle back to the item at a later time, students could return to an item more than once. Each time a student viewed an item, we marked it as a “visit”. We calculated a “number of visits” variable to record the number of times a student navigated to an item.
Number of actions: An action is a register in the process data file that reports a choice made by the student in response to an item. Examples of actions include selecting or unselecting an option in a MC multiple select item, dropping a drag element in a drag-and-drop item, selecting an option in an inline choice item, etc. All such actions were summed for a student interacting with an item. Actions across multiple visits to an item were included. It should be noted the number of actions required to answer an item differed across item formats and items within a format. This minimum number of actions required to answer an item was used as a covariate in the statistical analyses.
Number of changes: This variable is a subset of the number of actions variable, but it does not include the first click on each option of an item. Given that students were allowed to change their answers to an item, we calculated the total number of changes to an item across all items to which a student responded, as well as the mean number of changes per item.
First-response latency: We computed first-response latency (FRL) by calculating the amount of time between when a student viewed an item and conducted a first action on the item. Thus, FRL represented the latency between first viewing an item on a visit and making a first response to an item. If a student merely viewed an item and went on to the next item without making a response, that time was not counted in FRL.
Proficiency: Proficiency was computed using item response theory (IRT). Students’ responses to the selected-response items were scored dichotomously and calibrated using the one-parameter IRT model (Hambleton, Swaminathan, and Rogers [
20]), which is of the form
where X
ij is the response of student
j to item
i,
is the proficiency estimate of student
j, and
bi is the difficulty of item
i. The multiple-select selected-response items (e.g., select all correct options) were amenable to partial credit scoring. We used partial credit scoring in these situations according to “multiple true/false” (MTF) scoring, where each option is dichotomously scored, and the item score is the total number of correct responses to options divided by the number of options in an item. However, we added two adjustments to the MTF scoring: if a student did not select any response option, or if the student selected all response options, they received a score of zero. For multiple-select items that were amenable to partial credit scoring and for the constructed-response items, the partial credit IRT model was used [
21]. This model is of the form
where
k is a given score on item
i,
m is the maximum score on the item, and
bik is the step difficulty of score
k. All IRT scoring was conducted using FlexMIRT [
22].
4. Data Analyses
Our analyses of the students’ data involved computing descriptive statistics, correlations, and conducting statistical tests of mean differences. For the analyses regarding students’ RT, we took the log of the students’ RT before conducting statistical analyses, due to the extreme positive skewness of the data.
Linear Mixed-Effects Model Analyses
Linear mixed-effects models (LMEMs) were used to test hypotheses involving differences in a dependent variable (i.e., RT, FRL) by item formats and dichotomized item score (i.e., whether a student correctly or incorrectly answered an item). For polytomous items, students who earned less than half the maximum points on the item were scored zero, and students who earned at least half of the maximum points were scored as 1.0.
Two LMEMs were used—one for total item RT, the other for FRL. The models included item format and dichotomized item score as fixed effects and random intercepts for examinees and items. This model is essentially equivalent to a repeated measures two-way ANOVA when there are no missing data. The minimum number of responses required to answer an item varied across the multiple-select items, and so we included that variable as a covariate in the analysis (number of expected choices). For total item response time, the model was
where
= one, if item format of item = , zero if not.
= one, if examinee responded correctly item , zero if not.
= number of expected choices marked in the correct response of item .
= random effect linked to examinee .
= random effect linked to item .
= set of all item formats considered in the analysis
For FRL as the dependent variable, the model was
where the same notation is used as for the previous equation.
The R package lme4 was used in all analyses [
23]. For the ANOVA analyses, we used Satterthwaite’s method for the approximation of degrees of freedom. Models with random slope on the item type by examinee were explored, but all those models failed either because they were singular or because they were not achieving convergence. The alpha level for statistical significance was set at
p < 0.01.
A procedure for outlier removal was performed as well, to improve the normality of the residuals. We removed all outliers outside the area between the first quartile minus 1.5 times the interquartile range and the third quartile plus 1.5 times the interquartile range.
5. Results
In this section, we summarize the results conducted for all analyses. We begin with the relationships among response process behavior and proficiency and then report results regarding comparisons across RT, FRL, and item format.
5.1. Students’ Proficiency and Response Actions
Table 2 presents the correlations among proficiency and response process variables for grade 3 (lower triangle) and grade 4 (upper triangle). The pattern of correlations was largely consistent across grade levels. The highest correlations were between number of actions and number of changes, which is not notable since the latter is a subset of the former. After that, the highest observed correlations were for FRL and RT (r = 0.81 for grade 3 and 0.78 for grade 4). Proficiency was moderately correlated with both RT and FRL (ranging from 0.11 to 0.13 across grades), which provides modest support for the hypothesis that students who take longer to make their first response action have higher overall proficiency. RT, but not FRL, was moderately correlated with mean number of actions, visits, and changes for each grade level (ranging from r = 0.11 to 0.19 across variables and grades). FRL was not correlated with mean number of actions, visits, or changes. These relationships were expected, given that actions, visits, and changes will add to the RT for an item, but not to FRL.
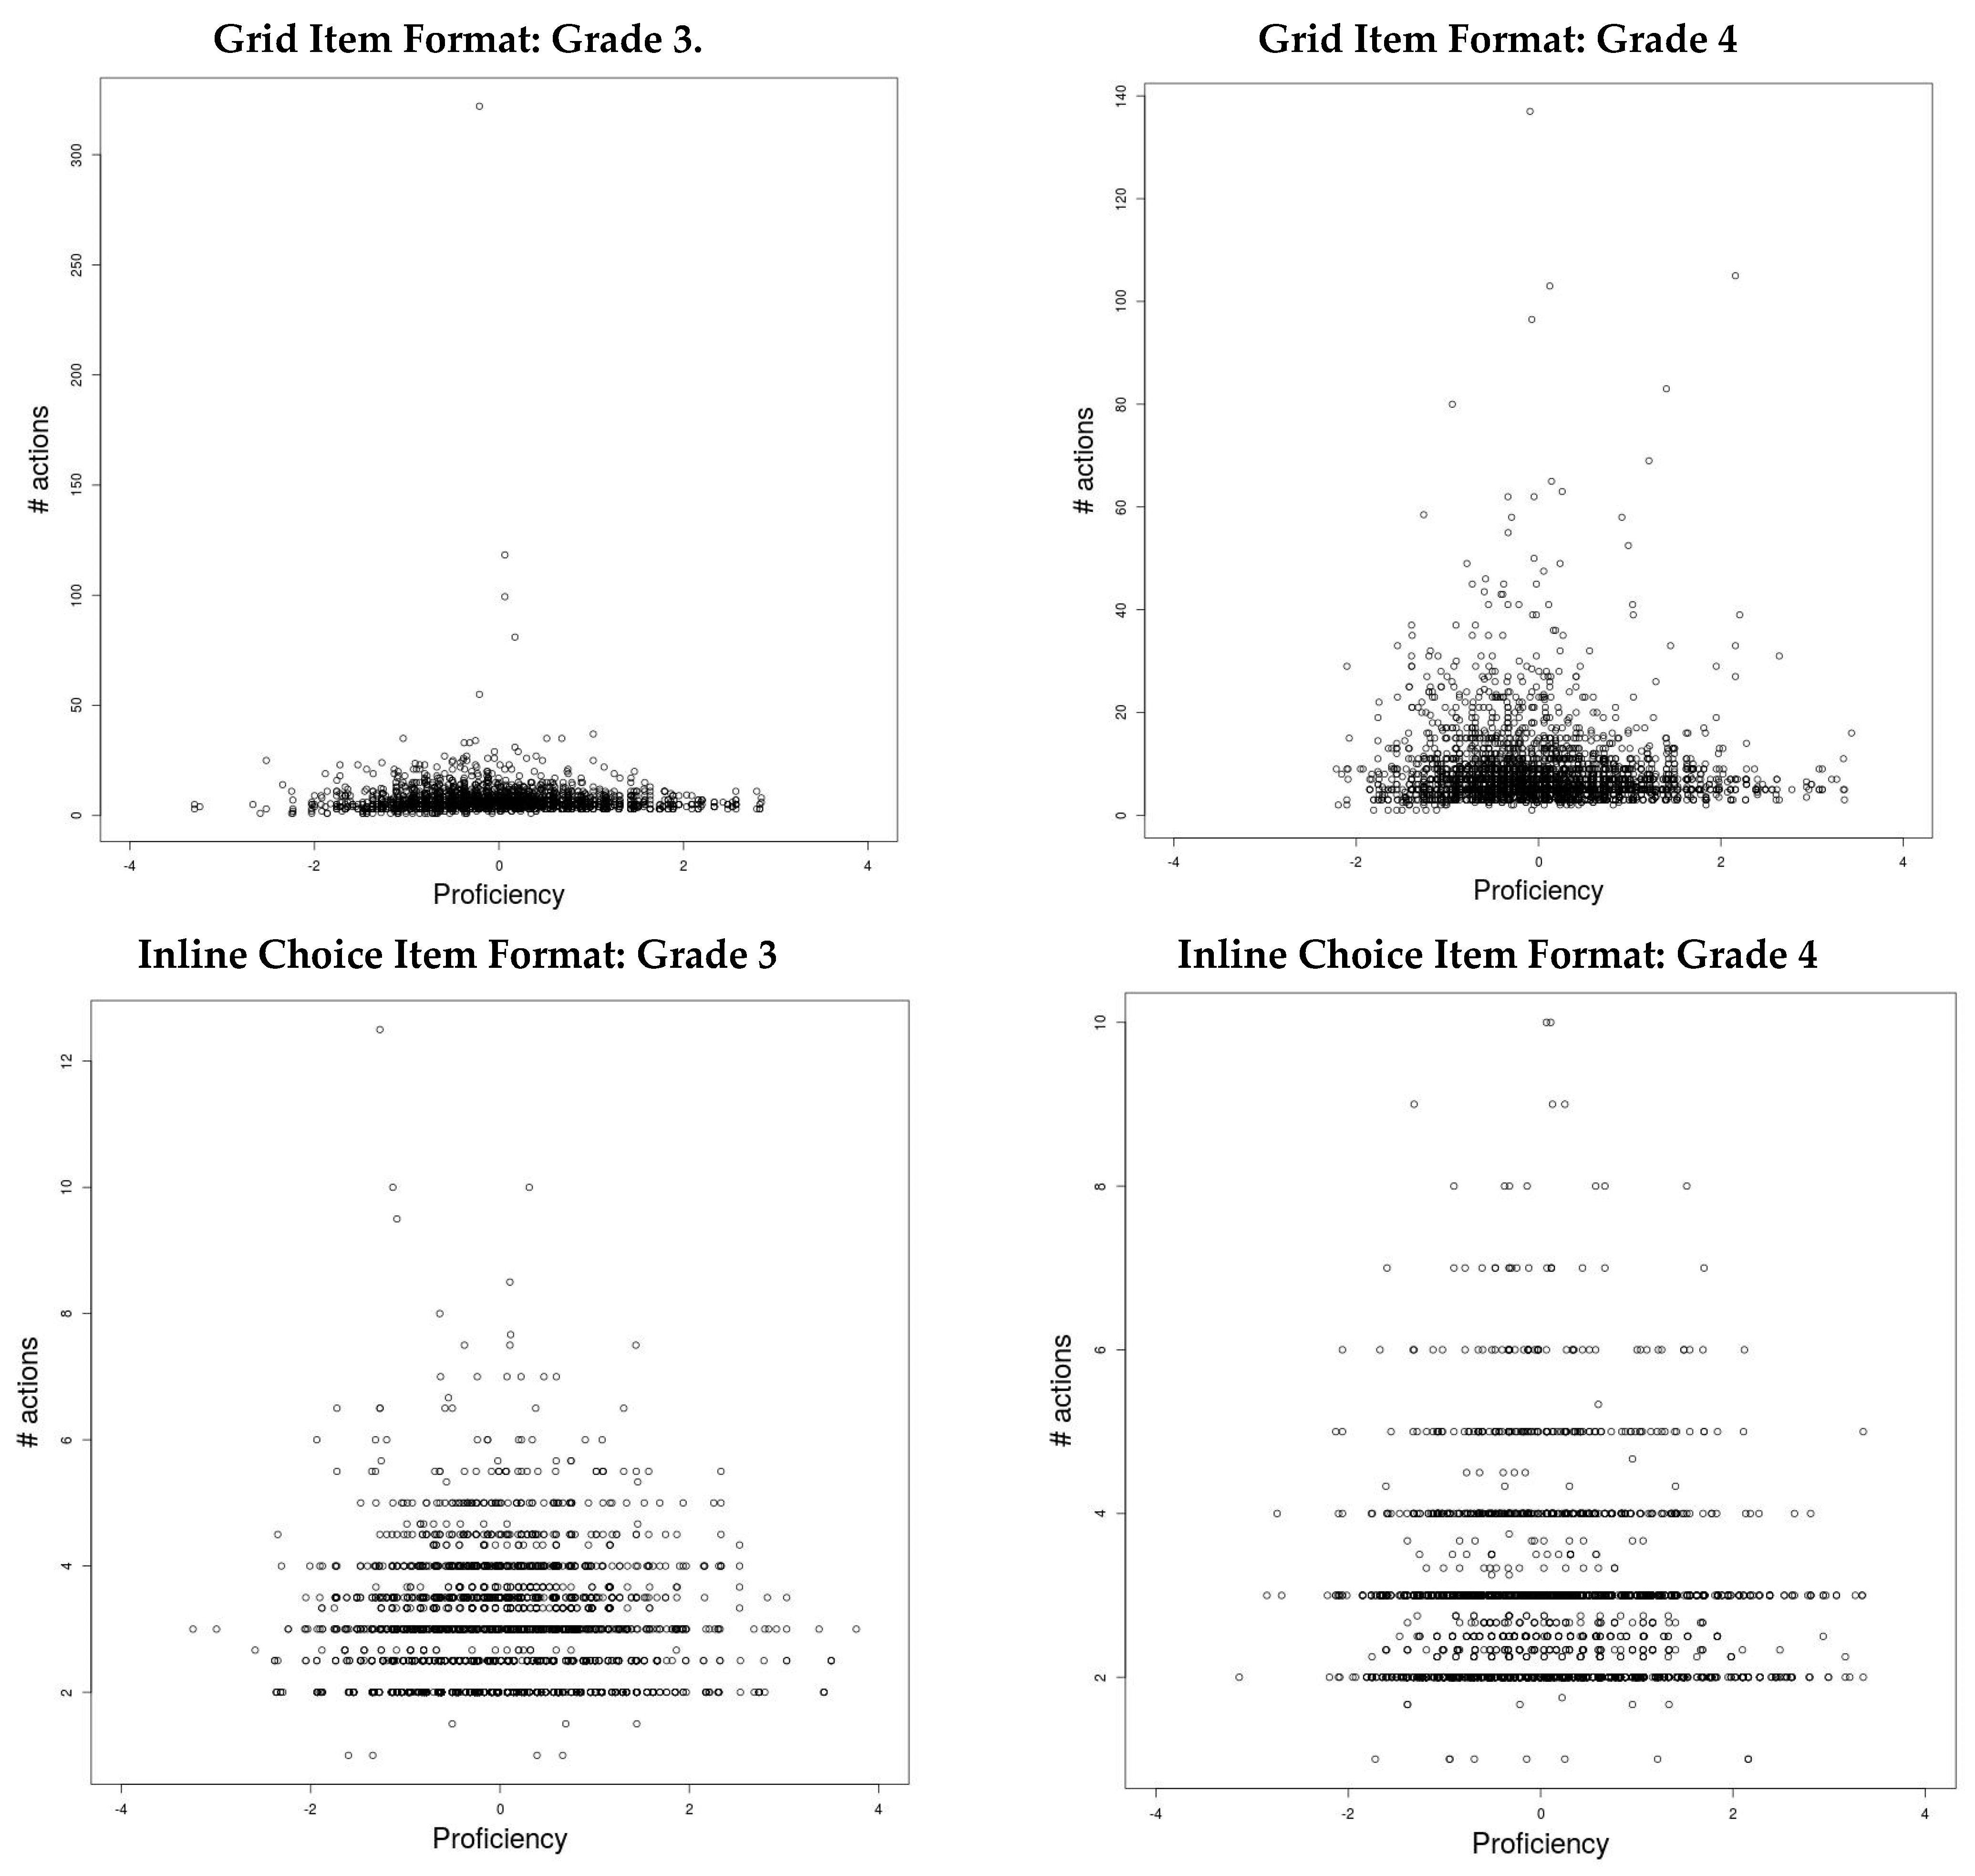
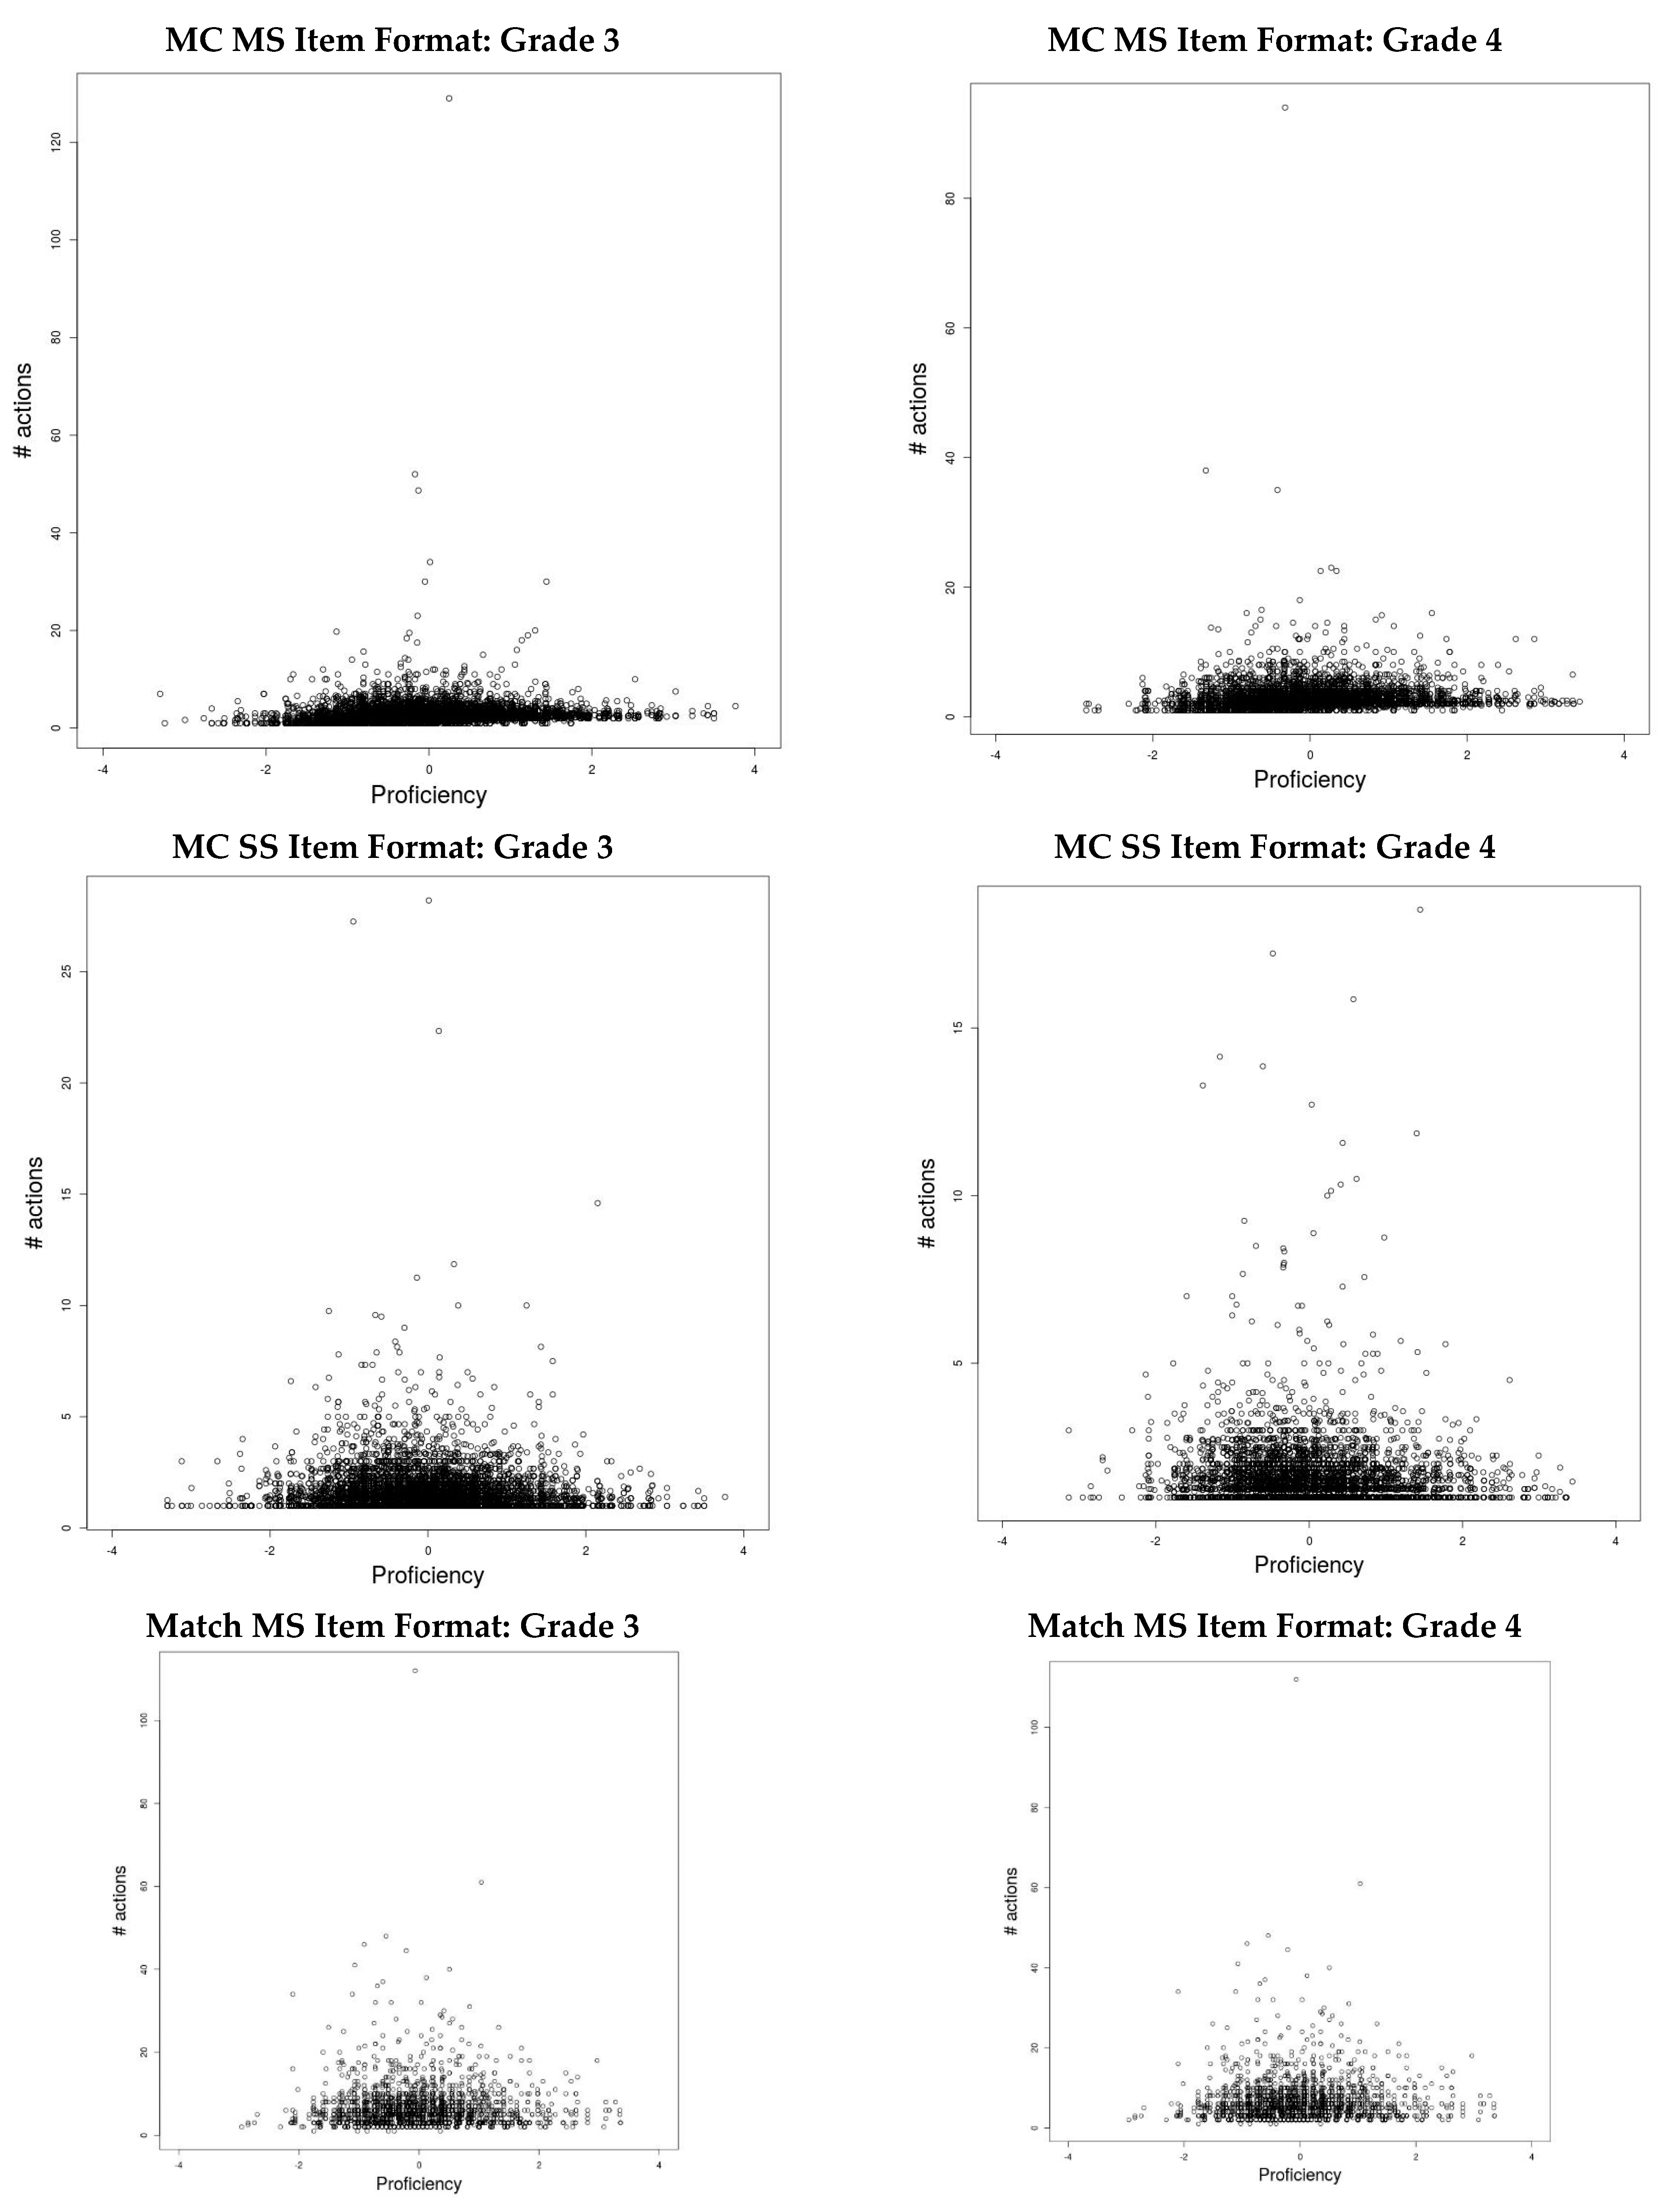
Scatterplots of the variables were evaluated for nonlinear relationships. None were noted in the scatterplots of the relationships among proficiency, FRL, and RT and thus are not presented here. However, nonlinear relationships were observed between proficiency and number of actions. These scatterplots are presented in
Figure 2, with a separate plot for each item format. A nonlinear pattern, where students of low and high proficiency had relatively fewer actions than students of middle proficiency, was consistent across grades and item formats. The Inline Choice, MC-SS, and Match MS item formats best illustrated this non-linear, quadratic relationship. The grid item format had the least conformity to this pattern, particularly for grade 3.
5.2. Linear Mixed-Effects Modeling Results
In this section, we report the results related to whether students took longer to respond to different item formats, took longer to make an initial response across different item formats, and whether there were differences across students who correctly answered the item versus those who did not. Before reporting the results of these LMEMs, we first report the descriptive statistics. The descriptive statistics for total item RT are reported in
Table 3 and
Table 4 for grades 3 and 4, respectively. Both raw and log-transformed average item RT is reported. For both grades, multiple-choice single-select (MC-SS) items had the shortest mean RTs (results were nearly identical using the median), and the match multiple-select (Match-MS) items had the longest, with the difference in median response time across these two formats being about 35 s for both grades. The grid item format had the second-shortest average response time for 4th grade, but had the second-longest average response time for 3rd grade. Thus, some differences are noted in the rank-order of average RT for different item formats across grades.
Descriptive statistics for total RT, broken down by correct and incorrect response for grade 3, are presented in
Table 5. The rank-ordering across item formats was identical for correct and incorrect responses. Correct answers had shorter average response times for the MC-SS and Match-MS items but not for the other item formats.
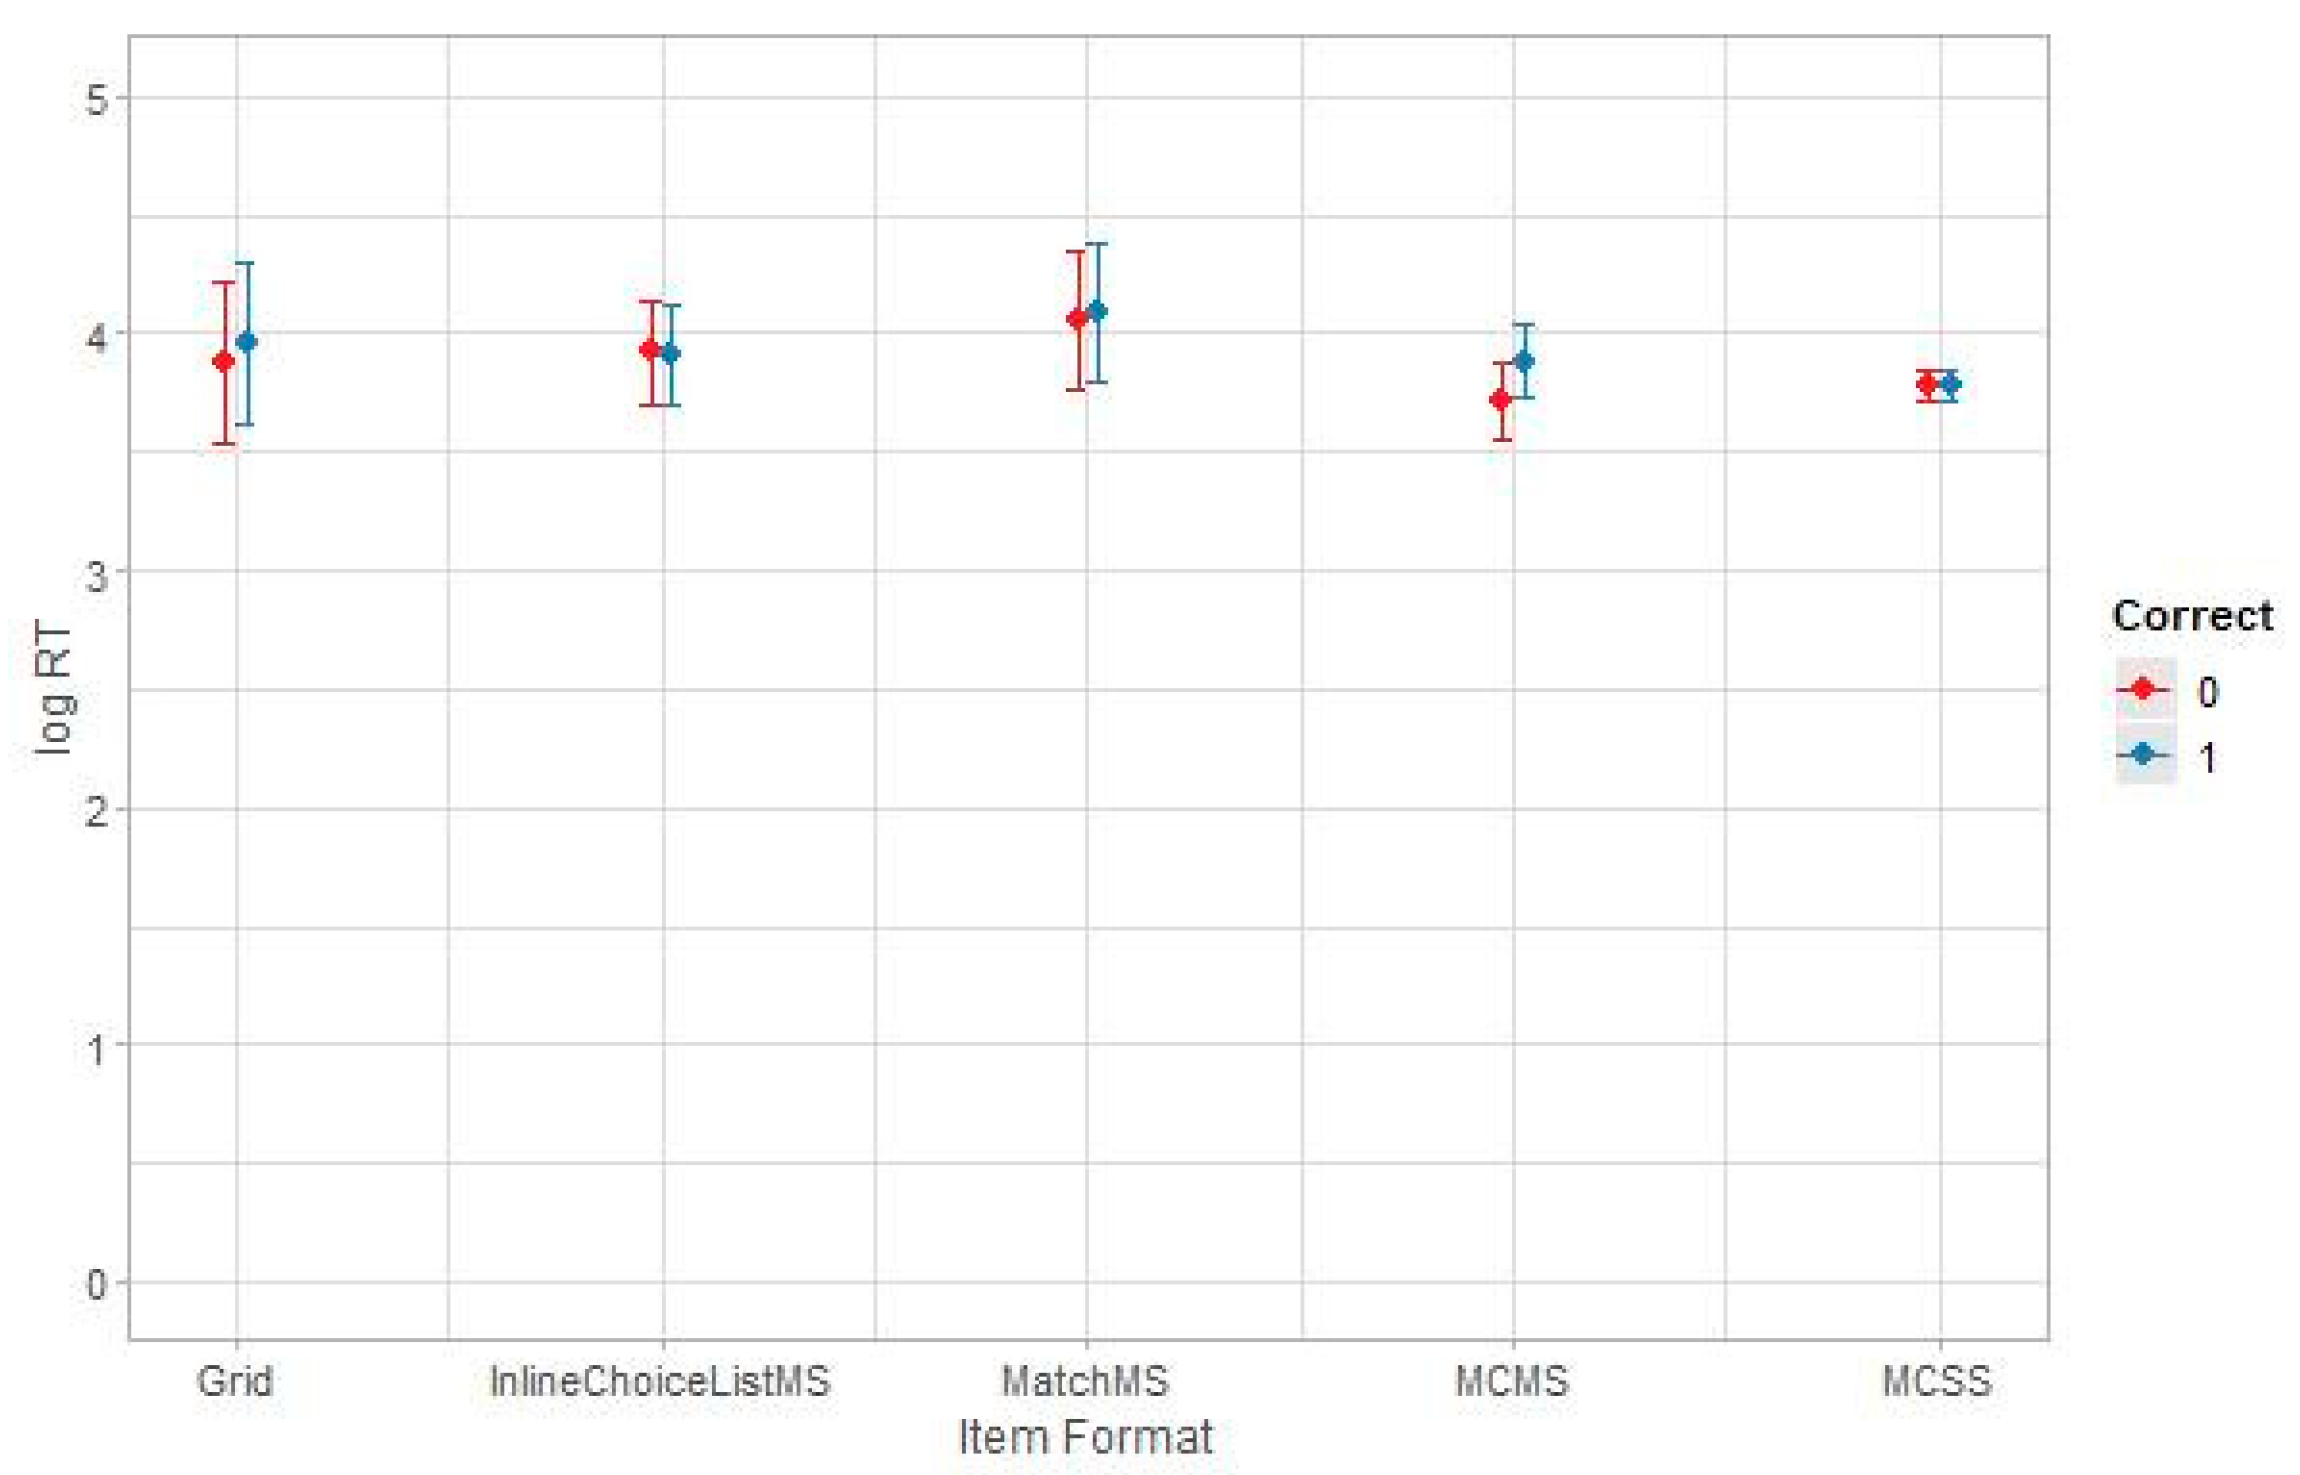
The results of the LMEM analysis for Grade 3 are summarized in
Table 6. The main effect for item format approached, but did not reach, statistical significance (
p = 0.03); however, the correct answer main effect and interaction of correct answer and item format were statistically significant. As seen in
Figure 3, the largest difference across students who got the item correct or incorrect were for the MC-MS item format, with students who correctly answered the item taking longer to answer.
Descriptive statistics for RT, broken down by correct/incorrect response for grade 4, are presented in
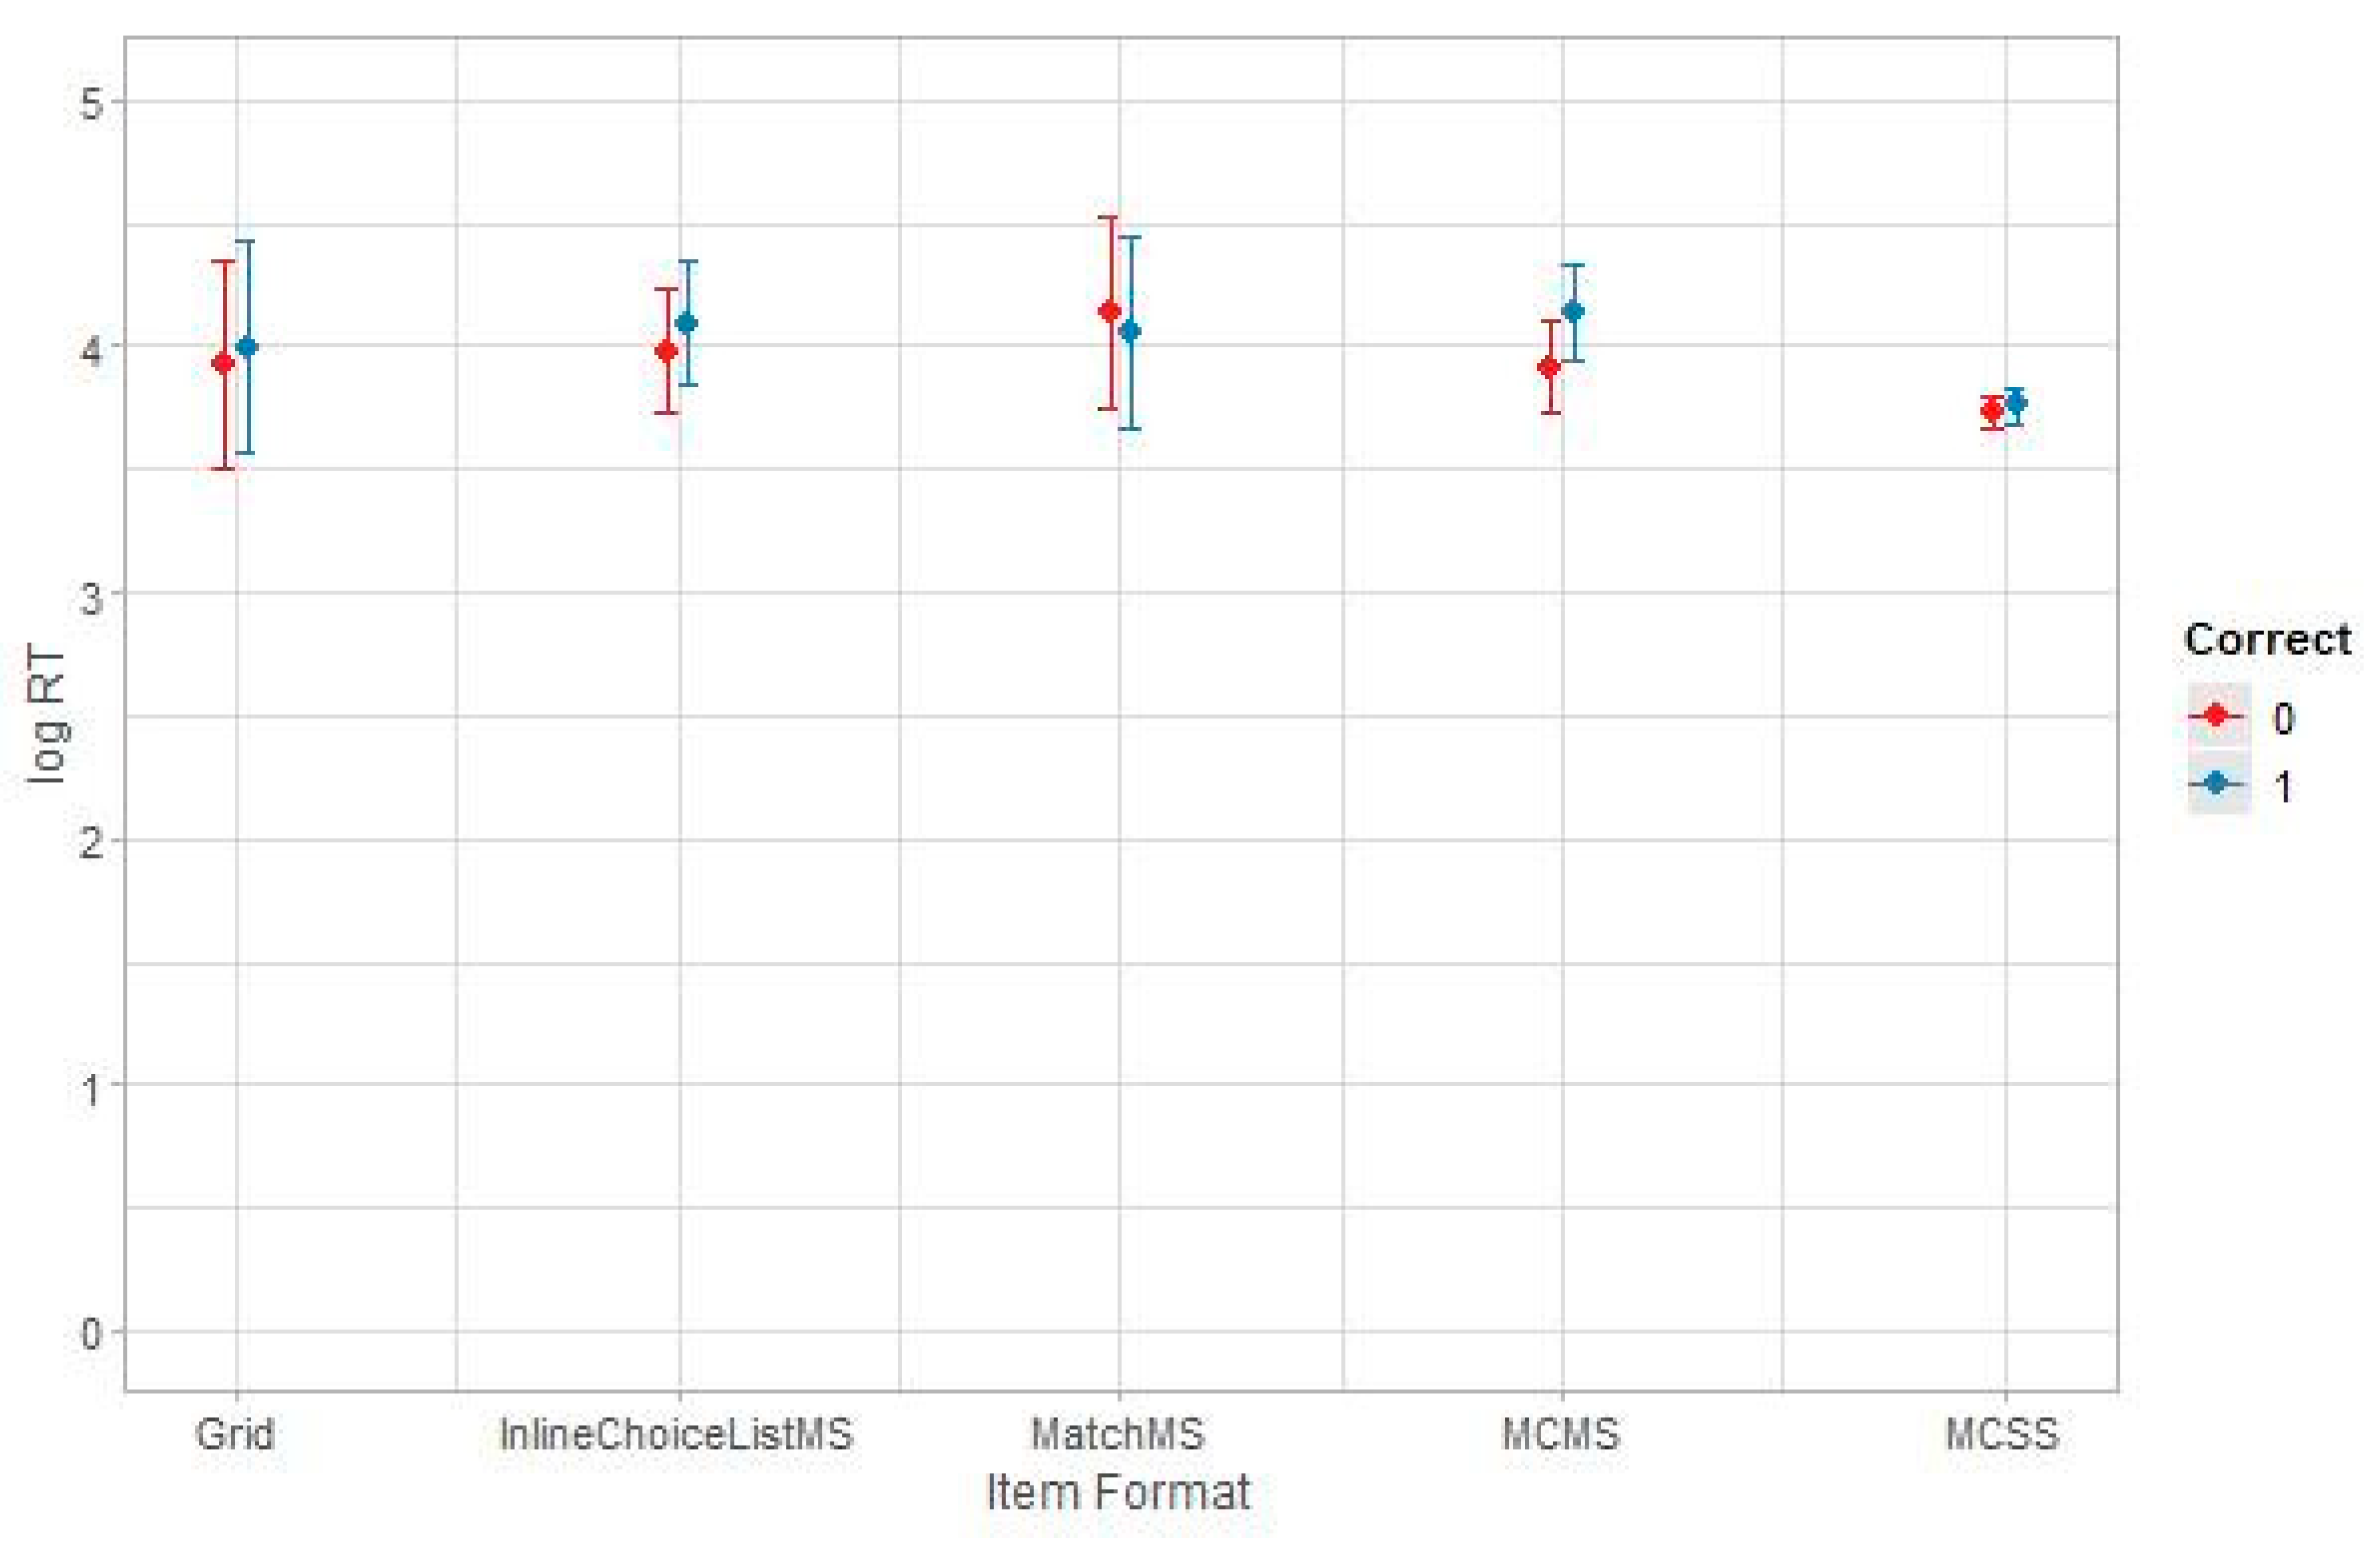
Table 7. Only the Match-MS item format had shorter average RT for students who correctly answered the item. The results of the LMEM analysis for grade 4 are summarized in
Table 8. The main effect for item format was not statistically significant, but statistically significant differences were found for the main effect for correct answer and the interaction. Similar to grade 3, the MC-MS format had the largest difference across students who got the item correct/incorrect, with students who correctly answered taking longer (see
Figure 4).
5.3. First Response Latency
Descriptive statistics for FRL for each item format are presented in
Table 9 and
Table 10 for grades 3 and 4, respectively. Although MC-SS had the shortest average RT for grade 3 (
Table 3), it had the longest FRL (
Table 9). The same observation was noted for grade 4 (
Table 3 and
Table 10). Thus, although students in both grades had shorter average RTs for this traditional item format, they took longer to make their first response. The grid item format had the shortest FRL for both grades. On average, FRL was about 18 seconds shorter for grid items than MC-SS for grade 3, and about 23 seconds shorter for grade 4. Similar to average response time, FRL was relatively shorter for the Match-MS item format for grade 4 than it was for grade 3.
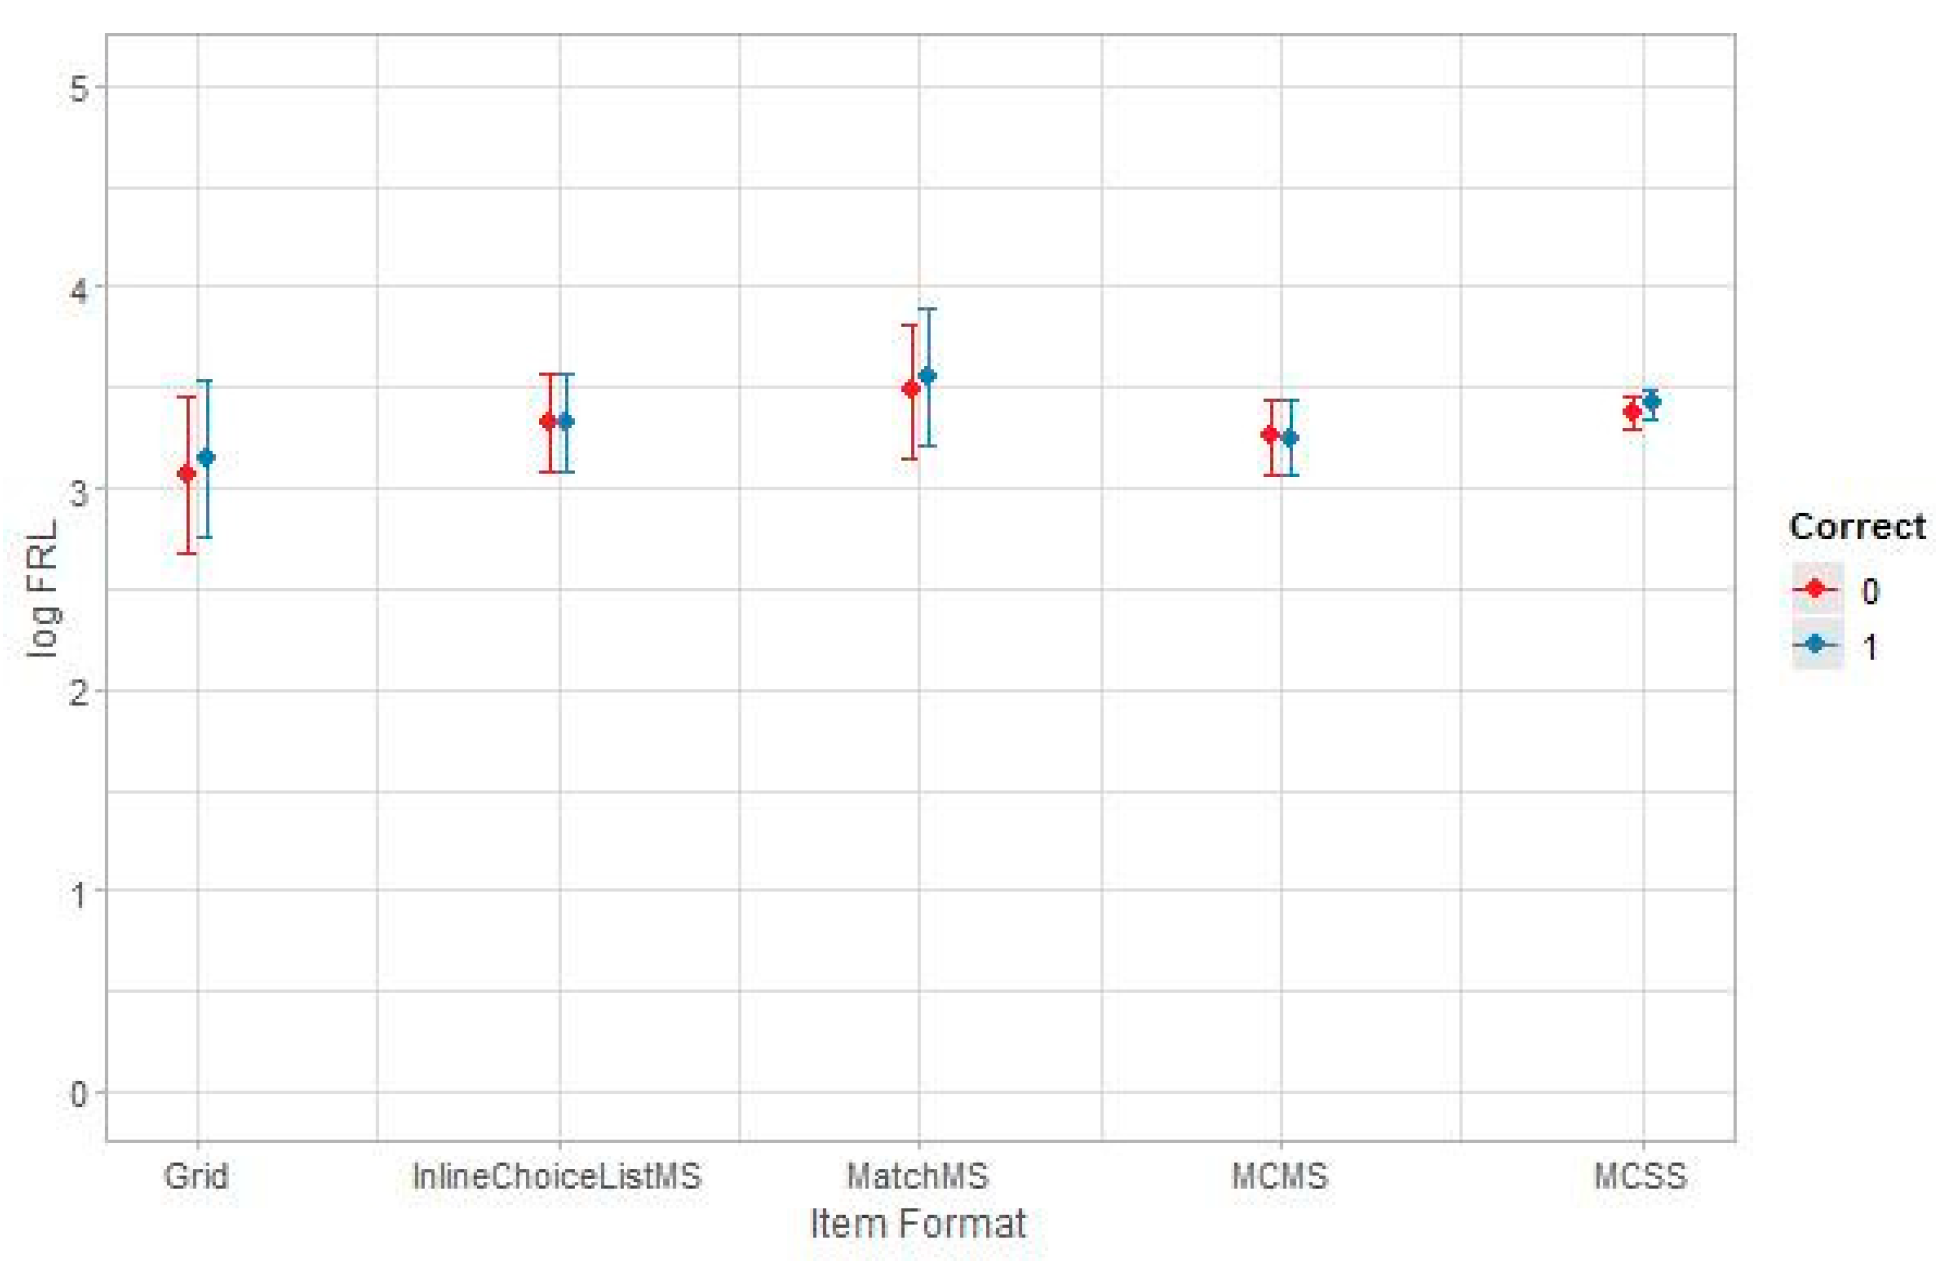
Descriptive statistics for FRL broken down by response correctness for grade 3 are presented in
Table 11, and the results of the LMEM for this analysis are summarized in
Table 12. For all item formats, students who correctly answered the item had longer FRL (see
Figure 5). The only statistically significant finding was the main effect of correct response.
Descriptive statistics for FRL broken down by correct/incorrect response for grade 4 are presented in
Table 13; the results of the LMEM analysis are summarized in
Table 14. Students who correctly answered the items had longer FRL for all item formats, except the Match-MS item format. In this case, the only statistically significant finding was the interaction effect of correct response and item format. The box plot summarizing these results is presented in
Figure 6.
6. Discussion
In this study, we analyzed data from a computer-based mathematics assessment across two elementary school grade levels to better understand the potential utility of a subset of students’ response behaviors. Specifically, we were interested in (a) the amount of time it took students to respond to items, (b) the amount of time they took to make an initial response to an item, (c) the numbers of actions taken on items, (d) the degree to which these variables provided information about proficiency, and (e) the similarity of these relationships across the two grades.
With respect to our first research question (relationship between proficiency and response actions), we found moderate, positive correlations between total RT and proficiency (r = 0.13 for grade 3, r = 0.11 for grade 4) and between FRL and proficiency (r = 0.13 for grade 3, r = 0.12 for grade 4). These findings are similar to Albert and Steinberg [
15] and Mitchell and Poston [
16]. We also found for all item formats, except Match-MS in grade 4, students who correctly answered the item had longer FRL. This finding could indicate students who were more engaged with the items did better on them.
With respect to the relationship between number of actions on items and proficiency, the correlations were essentially zero, but there was clear evidence of nonlinear relationships. Goldhammer et al. [
18] also found nonlinear relationships, where test takers with less success on low complexity tasks exhibited many fewer or many more actions on low-complexity tasks than students with greater success on the task. We found a more quadratic relationship, where students of relatively low and high proficiency exhibited a fewer number of actions relative to students of moderate proficiency. It should be noted we did not focus on single tasks as in Goldhammer et al.; instead, we collapsed across all items within an item format family, but it is still notable that nonlinearities were observed across all item formats.
With respect to our second and third research questions (differences across item formats), differences of up to 35 s on average were noted for RT, and up to 20 s for FRL. However, when focusing on the statistical results, the main effect for item format was diluted by the variations in RT or FRL within an item format due to our inclusion of the random effect for items in the models. There were some interesting interactions in that the MC-MS format had the longest average RT for both grade levels (see
Figure 3 and
Figure 4) for students who correctly answered the item. This finding may indicate students who did not answer correctly did not spend sufficient time responding to the MC-MS items, possibly because the MC-MS items indicated the number of required selections (e.g., select the two correct responses), which may require more engagement to confirm the multiple selections. It is possible that students who had less engagement or less prior knowledge selected answer options that satisfied the number of options required by the item but did not invest the time needed to further evaluate those selections. The only other statistically significant finding was the Match-MS format had shorter FRL for grade 4 students who correctly answered the item. This item format may have been more familiar to grade 4 students, which allowed them to focus on solving the item rather than interacting with it to figure out how to record their responses.
With respect to differences across grade levels, the pattern of correlations among the process variables and proficiency was similar across grades, but as noted earlier, students who correctly answered Match-MS items had longer average FRL in grade 3, but shorter FRL in grade 4. In addition, for grade 3, students who correctly answered the grid items had relatively longer FRL than students who did not answer them correctly. In grade 4, students who correctly answered the inline choice items had relatively longer average FRL than students who incorrectly answered these items.
FRL may capture different cognitive processes, depending on the item format, and the cognitive processes employed by students may differ across grade levels. For some item formats, FRL may primarily reflect the time spent on solution processes, but in other item formats the time spent on planning and solution processes may extend well beyond the FRL period. For example, in the inline choice format, where answer options are initially hidden from view, we can speculate FRL will be relatively short because students are likely to make the first action (e.g., click a menu to view answer options) in the early phase when they are actively building a mental representation of the given problem. Thus, the action of clicking the menu is by definition part of the planning process.
If this assumption is true, one should be cautious when interpreting FRL results. For example, Albert and Steinberg [
15] interpreted longer FRL as reflecting planning on how to solve items. Although the positive correlations between FRL and proficiency measures in the current study are consistent with prior research, the cognitive interpretation of the results may differ if FRL contains more than pure planning time. Conversely, for TEIs in which critical information must be actively discovered through interacting with the display (as in inline-choice items) or where the test taker can (re)organize or (re)construct the representation of information shown in the display (as in match items), the notion that planning is represented only or primarily by an initial period that does not contain external actions seems inadequate. If planning includes steps such as perceiving, processing, and building a mental representation of the information needed to respond, as well as doing the mental work involved in formulating and preparing a response, behavioral interactions with the external display are just as much part of planning and reasoning as non-visible internal mental processes such as reading the item stem or inspecting and interpreting a diagram. Future research could usefully investigate whether the current results hold when item content is controlled across item formats and explore the detailed cognitive processes captured by FRL in different item formats.
A corollary of this view is that different process metrics gathered from interactive items may belong in different parts of the theoretical model presented in
Figure 1, depending on both the item format and the hypothesized phase of the solution process. For example, a click may represent simply accessing all of the information for an item (e.g., opening and inspecting a drop-down menu), it may represent an attempt to reason about the targeted construct (e.g., by comparing information across two semantically related menus), or it may represent the action of making the final selection. Thus, this same action can be categorized as not construct-related, or construct-related but not scorable, or potentially scorable target-construct evidence, depending on the specific context of the response process phase, the content of the item, and the affordances of the item format. Think-aloud protocols or other probes of response processes may be illuminating in this regard.
7. Limitations and Future Research
Our study analyzed process data gathered during the field-testing of a mathematics test, which included different item formats with varying degrees of interactivity and unique features. Therefore, an unavoidable limitation of the study was an inability to control the content and context of the items presented. An experimental study, with parallel items presented in the different formats, would control for the effects of item content. Such a controlled study would make it easier to see commonalities across items within each format category and to infer the effects of format differences (when content is held constant) on student cognition and behavior (e.g., see Arslan and Lehman [
24], for a controlled experiment study in the ELA domain).
Our study also focused on only five item formats—those that were consistent and sufficiently numerous across grade levels. Other TEI formats used on the assessment, such as “composite” items, were not studied, since there were too few of them to draw conclusions. It is likely our choice of items focused only on item formats measuring lower complexity tasks, as opposed to the universe of possible TEIs that could be explored.
It is also possible students’ response behaviors differ substantially by characteristics such as race, language, and culture. Thus, future research should explore the degree to which subgroups of students defined by demographic characteristics (e.g., race, sex, ethnicity, SES, disability, language proficiency) differ with respect to RT, FRL, and other test behaviors.
Another potential limitation of our study is the degree to which students were motivated to do well on the assessments. There may not have been strong motivation for students to try their best, or differential motivation across grades. The students who responded to these items were in elementary school, which may make this potential limitation less of a concern compared to higher grades, when students may become more easily bored or resistant; however, differential motivation could have affected the results. In our study, we did not exclude responses that could be considered disengaged.
With respect to future studies, evaluating the relative measurement precision of the different item formats would be informative. For example, the amount of item information provided per unit of testing time would be an important criterion for evaluating the relative precision of the different item formats that could be used to represent the construct tested in a given amount of testing time. Content validity studies evaluating the differential content representativeness of the item formats would also be illuminating, as would external evaluations of students’ cognitive process while responding to items such as think-aloud protocols and cognitive interviews.
Another study of future interest would be to use the information learned in evaluating the different item formats to construct a new test using the most efficient formats from a measurement precision perspective, and those that maximize construct representation. The degree to which scores from this (presumably improved) test correlate more highly with other measures of the construct, and do not correlate with sources of construct-irrelevant variance, would be of interest.
Although our study had limitations, our goals, and the constraints under which we had to work, were more analogous to those encountered by assessment researchers seeking to draw useful conclusions from log data captured in operational settings. Thus, we hope our findings are helpful to practitioners and serve to complement controlled experimental studies on students’ response process behaviors and item format effects.


 ,
, 


