Article

Student Mobility between Charter and Traditional Public School Sectors: Assessing Enrollment Patterns among Major Charter Management Organizations in Texas

College of Education, University of Washington, Seattle, WA 98195, USA
*
Author to whom correspondence should be addressed.
Educ. Sci. 2022, 12(12), 915; https://doi.org/10.3390/educsci12120915
Submission received: 22 October 2022 / Revised: 29 November 2022 / Accepted: 7 December 2022 / Published: 13 December 2022

Abstract

:
Student enrollment and transfer patterns between the traditional public and charter school sectors help shape the role of charter schools in the broader educational ecosystem, especially as related to the enrollment and segregation of low-income students, English learners, students of color, and students in special education. We examine patterns of student transfer between traditional public schools and charter schools among four of Texas’s largest charter networks, which cumulatively make up over one-third of Texas charter students. We find that these schools serve fewer special education students than traditional public schools, but a greater share of low-income and English learners. Transfers between sectors contribute to enrollment gaps in special education and other classifications, but the findings do not apply uniformly across charter districts, student enrollment classifications, or grade levels. These findings highlight nuanced enrollment patterns between the charter sector and traditional public schools, suggesting that differences in student characteristics between sectors likely stem from a range of sources. Policymakers should acknowledge this nuance, consider alternatives to blanket enrollment regulation policies, and conduct similar analyses of enrollment patterns among charter districts.

1. Introduction

The United States public school system is open to all U.S. residents and serves over ninety percent of the nation’s age-eligible children [1]. State laws require that children receive some form of education through either public schools, or a state-approved private or home school. Beginning in the late 1990s, states began passing laws allowing charter schools, which receive public funding but are privately managed and face fewer labor regulations and public reporting requirements [2]. Since the initial passage of charter school laws, enrollment in charter schools has grown rapidly. While total charter school enrollment nationally remains less than 10 percent, charters serve a far greater percent of students in several metropolitan areas such as New Orleans, New York, Denver, Detroit, and Los Angeles. In most states, charter schools have some autonomy over their curriculum, governance, and student enrollment process but face the same test-based accountability requirements as other public districts, where schools face sanctions when student test scores do not meet a pre-determined threshold.
The existence of charter schools creates a parallel public education system that may affect enrollment patterns in the traditional system [3]. If charter schools serve a more academically prepared student population, or a lower share of students who require special services, than neighboring traditional public schools will face financial or academic challenges [4,5,6]. State school finance systems are rarely designed to fully compensate districts for especially high rates of special education [7]. Relatedly, many state school finance systems, including Texas and California, fund districts based on average daily attendance, so districts with especially high rates of absenteeism receive less funding relative to their headcount enrollment [8,9]. In short, student enrollment patterns into and out of the charter school sector play an important role for the academic and financial health of traditional public school districts.
Texas has the second largest number of charter schools among U.S. states (second to California). The state is also home to several large charter school networks that operate many schools in different locations across the state and nationally, but fall under the same charter management organization, or CMO. The four largest CMOs in Texas are the KIPP, Harmony, IDEA, and Uplift charter school networks. These organizations have been in operation in Texas for over 20 years and together enroll nearly 40 percent of all charter students in Texas (see Table 1). The scale of these CMOs makes them more effective advocates and lobbyist, and studies show larger CMOs in Texas benefit from more favorable state school finance policies compared to smaller, or stand-alone charter schools [10,11]. Because of their power and presence in the charter school market, analysis should be directed at this subset of large charter networks as compared to both traditional public schools and other charter schools within the state.
This study compares student characteristics and student mobility patterns in large charter school networks and traditional public school (TPS) districts in Texas. As described further below, motivation for the study stems from research showing that different governance structures or “bottom lines” create different incentives between traditional public and charter schools, affecting what type and how a student is served in either sector [12,13,14]. We examine overall differences in student populations and use individual-level student data to track transfers between sectors. We focus on three student characteristics specifically tied to school finance and accountability: special education enrollment, math achievement, and attendance rates. For additional context, we explore student enrollment and transfer patterns by student race/ethnicity, income level and enrollment in bilingual programs. We compare these student characteristics for TPS districts and for the largest four charter networks in the state, IDEA, Harmony, KIPP, and Uplift.
In preview, we find that on average across the state, charter schools serve fewer students eligible for special education, but a greater share of students classified as low-income or as English learners. Charter schools have higher rates of grade retention and absenteeism and serve a more racially diverse student population. When examining transitions between sectors, we find that the rate of student “leavers” and “arrivers” in charter schools is systematically related to specific student enrollment classifications, outcomes, and demographics. In our discussion of the findings, we highlight variation in these trends within and between the four charter districts we analyzed. While prior research explores student mobility and characteristics in charter schools extensively, our contribution is unique in two ways. First, by focusing on large charter school districts and comparing them to all other smaller charter districts and traditional schools, we highlight heterogeneity within the charter sector. Second, instead of analyzing a specific student characteristic, we focus on a range of student characteristics, some of which are school based such as enrollment in special education or bilingual programs, while others are based on student background (e.g., household income and race/ethnicity).

2. Literature Review

2.1. Research on the Charter School Sector in the U.S.

The literature on charter school’s impact on student enrollment and student outcomes provides mixed results. Proponents of charter schools argue that flexibility outside of the traditional public school system allows for greater innovation in terms of curriculum and workforce management. By allowing families to choose their schooling among an array of potential options, advocates assert the introduction of charter schools will improve student match to particular learning environments and school contexts, and lead to quality improvement through competition for students [15,16]. Charters can also improve student fit through engagement in specialized recruitment of certain student populations [17,18]. In the American urban context, this is perhaps most prevalent for low-income, Black and Latinx communities who make up a higher share in public charter enrollments than in TPS districts [19]. Many charter schools have been found to promote their programs to families who have felt “stuck” in underperforming schools, or school environments that might not work for them [20,21]. However, decades of research in school choice have demonstrated that the existence and practices of charter schools do not necessarily relate to more equitable outcomes for students of color [22,23,24,25]. Students in special education also face unique challenges as it relates to the services and educational opportunities offered by charter schools [26,27], in part because special education students require more resources, and thus more financial support to educate, compared to non-special education students [28,29,30,31,32]. However, prior research shows these students do not necessarily leave charter schools at higher rates than their TPS peers [33,34]. Additionally, research suggests that enrolling in a charter school may lead to higher likelihood of declassification out of special education but does not necessarily impact a student’s likelihood of classification into special education [35].
Critics of charter schools point to enrollment practices that can lead to “counseling out”, “cream-skimming” or “cropping” of students from charter schools. This is a process in which charters schools, acknowledging that they may face consequences of market demand, attempt to cull the highest performing students, and pressure currently enrolled low-performing students, or students with Individualized Education Plan needs, to enroll in a different school [14,36]. Several empirical research studies measure the level of “cream-skimming” and “cropping” in which charter schools may engage [13,14,37]. For example, to test the hypothesis that charter schools are selective about their admission for “higher-cost” students, Bergman and McFarlin [12] sent fictitious emails posing as enrollment inquiries for students with varying student needs and found that charter schools were less likely to respond to students with significant special education needs. Scholars have largely concluded that while there is evidence that some schools engage in this type of behavior with some groups of students, it is difficult to generalize across the entire charter sector and some evidence suggests these effects are concentrated in more market-oriented charter school organizations [14,38,39]. Other analyses find no empirical evidence of selective enrollment practices among charter district administrators [40,41,42].

2.2. Research on the Charter School Sector in Texas

The state of Texas is central to the charter school industry nationally. There are over 750 operating charter school campuses that enroll over 336,000 students [43]. Some scholars attribute Texas’s extensive system to a “supportive charter law environment” [44]. Analyses of Texas charter school student skimming are limited, but some studies find evidence of systematically minimized options for special education students (e.g., [45]), higher rates of Black student transfers into charters [46], and lower achievement among students transferring into charter schools [47]. Additionally, research has focused on enrollment trends in the KIPP charter school network, the largest CMO in the nation and one of the four networks in our analysis. One study found that KIPP middle schools across state contexts enroll students with backgrounds similar to those of other local schools, but often replace exiting students with higher achieving ones [48]. Other studies have found that even though KIPP does enroll a significant number of higher achievers, academic gains were observed in special education and multilingual English learner student populations [49,50].
While prior work highlights important differences in enrollment and curricular practices across all charter contexts, few studies disaggregate enrollment practices by specific a charter district or network, and some studies compare student demographics without tracking student movement between sectors. Yet, concerns about charter school practices often center on a particular charter management organization, or school, rather than the sector at large. This gap in the literature is important because large charter networks have distinguishing characteristics from smaller single-campus charters. For example, many charter networks operate in multiple states and benefit from large economies of scale. The largest charter networks can lobby state policymakers to push favorable charter school policy. Within large charter networks, individual charter districts may adopt different approaches to enrollment regulations and student discipline and suspension. Relatedly, compared to studies that simply compare student demographics between sectors, studies that leverage individual-level data to track student mobility between sectors provide a clearer analysis of how charter districts might manipulate enrollment. In sum, analyses of enrollment patterns of student mobility across charter and TPS districts sectors, disaggregated by the largest charter networks, would provide important new insights to inform further charter school regulations and reforms [51].

3. Enrollment in Charter Schools in Texas

The top portion of Table 1 provides a snapshot of the four largest charter networks in Texas. Harmony and KIPP are comprised of multiple districts, each of which operate multiple schools, while IDEA and Uplift, and all other charter networks in the state, operate a single district with one or more schools. The largest four networks represent 35.8 percent of all charter school students. Charter school growth from 2016–17 to 2017–18 is concentrated in the largest four networks, which grew 22,754 students (25.7 percent), compared to 2695 for all other charters (1.7 percent). This pattern is in part a result of Texas charter policy, which caps the number of new charter districts each year, but not the number of schools an established charter district can open and operate [52]. In the section below, we describe the data sources and analytic approach used to assess student transitions between sectors. Prior to describing our data and methods, we provide a theoretical framework and present our key hypotheses.

4. Theoretical Framework

Student transfers between sections can result from either school or family actions, representing demand and supply factors for different types of students. From the school’s perspective, charters may have different levels of “demand” for different students. Given accountability pressure to maintain higher scores on state standardized tests, we assume schools face incentives to enroll students who are more likely to score higher on state tests. Based on prior literature (see above), we assume charter schools have at least some control over their enrollment, through selective application procedures and counseling students and families in and out of their schools and (perhaps) back to the traditional sector. We can define two types of students that charter schools serve: those who tend to score higher on state tests S h , who require fewer services and generate lower costs, and are therefore desired among charter school leaders, and those who score lower on state tests S l , require more services and are higher cost, and are thus less desired among charter school leaders. For charter schools, the achievement maximizing conditions is as follows:
M a x   F S h , S l , X B
S t .   B B ¯ ,   f S h A _ , f S l A _
where S h , S l   indicates two types of students—high performing and low performing students, respectively, X is a set of school inputs which is a function of budget, B that cannot exceed budget contrariant B ¯ , and A _ refers to the state accountability requirements. These relationships lead us to a few basic hypotheses. Specifically, we suspect that compared to current enrollment in a given charter district, students entering a charter district will have lower rates of special education enrollment, lower math and English language arts (ELA) achievement, and greater past absenteeism.
Students and families have a different set of considerations. Students may be more likely to transfer across sectors if they have lower academic achievement relative to peers. We may therefore expect greater transfer rates both into and out of the charter sector among students with lower attendance or achievement rates. Enrollment patterns for students receiving special education services also relate to perceived quality and fit. Students receiving special education services may be discouraged from seeking out charter schools (or encouraged to exit charter schools) if they perceive lower-quality special education services in charter schools. Conversely, greater transferring into charters (and fewer transfers out) among students receiving special education services could imply that families perceive superior special education services in charter schools.
While trends in transfer rates among different student enrollment classifications provide insights into charter and family behavior, we are not able to differentiate between these supply and demand factors, which are determined simultaneously each school year. Results therefore do not provide definitive evidence of selective recruitment or enrollment practices within charter schools, or specific preferences of families. Instead, by focusing on students who transfer between sectors, especially among major charter management organizations, the analyses provide a deeper understanding of enrollment patterns beyond simple comparisons of demographics across sectors. We discuss the specific methodology and underlying assumptions in the following section.

5. Data and Methods

5.1. Data

We use individual-level student data from the Texas Education Agency for school years 2016–17 and 2017–18. For both years, the data include indicators for a student’s current school location, race/ethnicity, gender, grade level, and attendance rates. The data also include each student’s classification as an English learner, whether they receive special education services, and whether they are classified as a low-income student. Finally, the data include scores on the State of Texas Academic Assessment of Readiness, the state’s standardized test, for grades three to eight. For each year, the data include approximately five million students from grades K-12 across approximately 10,000 schools.

5.2. Analytic Approach

We first calculate average student characteristics at each school for the 2016–17 school year, differentiating between TPS districts and charters and disaggregating across the four largest charter management organizations in Texas: KIPP, Harmony, IDEA, and Uplift (37% of charter students, collectively), and separately for all other charters (63% of charter students). We then use 2017–18 data to compare 2016–17 student characteristics to the average characteristics of two types of students, “leavers”, and “arrivers.” Leavers are those who exit a charter district between the 2016–17 and 2017–18 school years and transfer to the TPS sector. Arrivers are students who transfer to a charter district from the TPS sector from 2016–17 to 2017–18. Our analysis of leavers assesses the extent to which students associated with higher cost or lower achieving students in charter districts might disproportionately transfer out. We would reach this conclusion if, for example, the percent of leavers for a given charter district receiving special education services is greater than the percent of current student receiving special education services for the same charter district. For leavers, we focus only on students who exit the charter sector completely and enter the traditional sector. This means our estimates of transfer out rates omit those who transfer from one charter district to another. We take this approach to isolate each charter district’s influence on the cross-sector differences in student characteristics. Results that include leavers to other charters are qualitatively similar to the results obtained from our preferred approach.
Analyses of arrivers shed light on charter recruitment and family and student enrollment, for different types of students. For example, recruitment and student enrollment decisions would contribute to a gap in special education enrollments between the charter and traditional public sectors if special education enrollment rates among arrivers is significantly lower than for currently enrolled students in the same district. In addition to students in special education, we examine student transfer patterns by mean lagged student achievement and absenteeism. As with leavers, we focus only on charter students who arrive from the traditional sector, through results that include cross-charter district transfers are qualitatively similar. For additional context (though not directly tied to our theoretical frame), we also explore transfer patterns by student race/ethnicity and income level. In sum, for each of these student characteristics, we present three statistics: (a) mean values among charter and TPS districts during the 2016–17 school year; (b) mean values for students who transfer into a charter school district from the TPS sector; and (c) mean values for students who transfer from a charter school district to the TPS sector.
We conduct all analyses separately by individual grade to control for differences in enrollment patterns across grades. The percent of students in various enrollment classifications differs across grades, and each charter district serves a different mix of grade levels. For example, middle elementary grades enroll a higher percentage of students enrolled in special education compared to early elementary or high school grades. Comparisons of enrollment patterns across sectors must therefore account for differences in the mix of grade levels, which we address simply by comparing students in the same grade level.

6. Findings

We present findings by student enrollment classifications, starting with students enrolled in special education. Subsequent sections present results for student transfer patterns between charter and TPS sectors based on students’ mean achievement on standardized tests, rates of absenteeism, as well as student race/ethnicity and household income level.

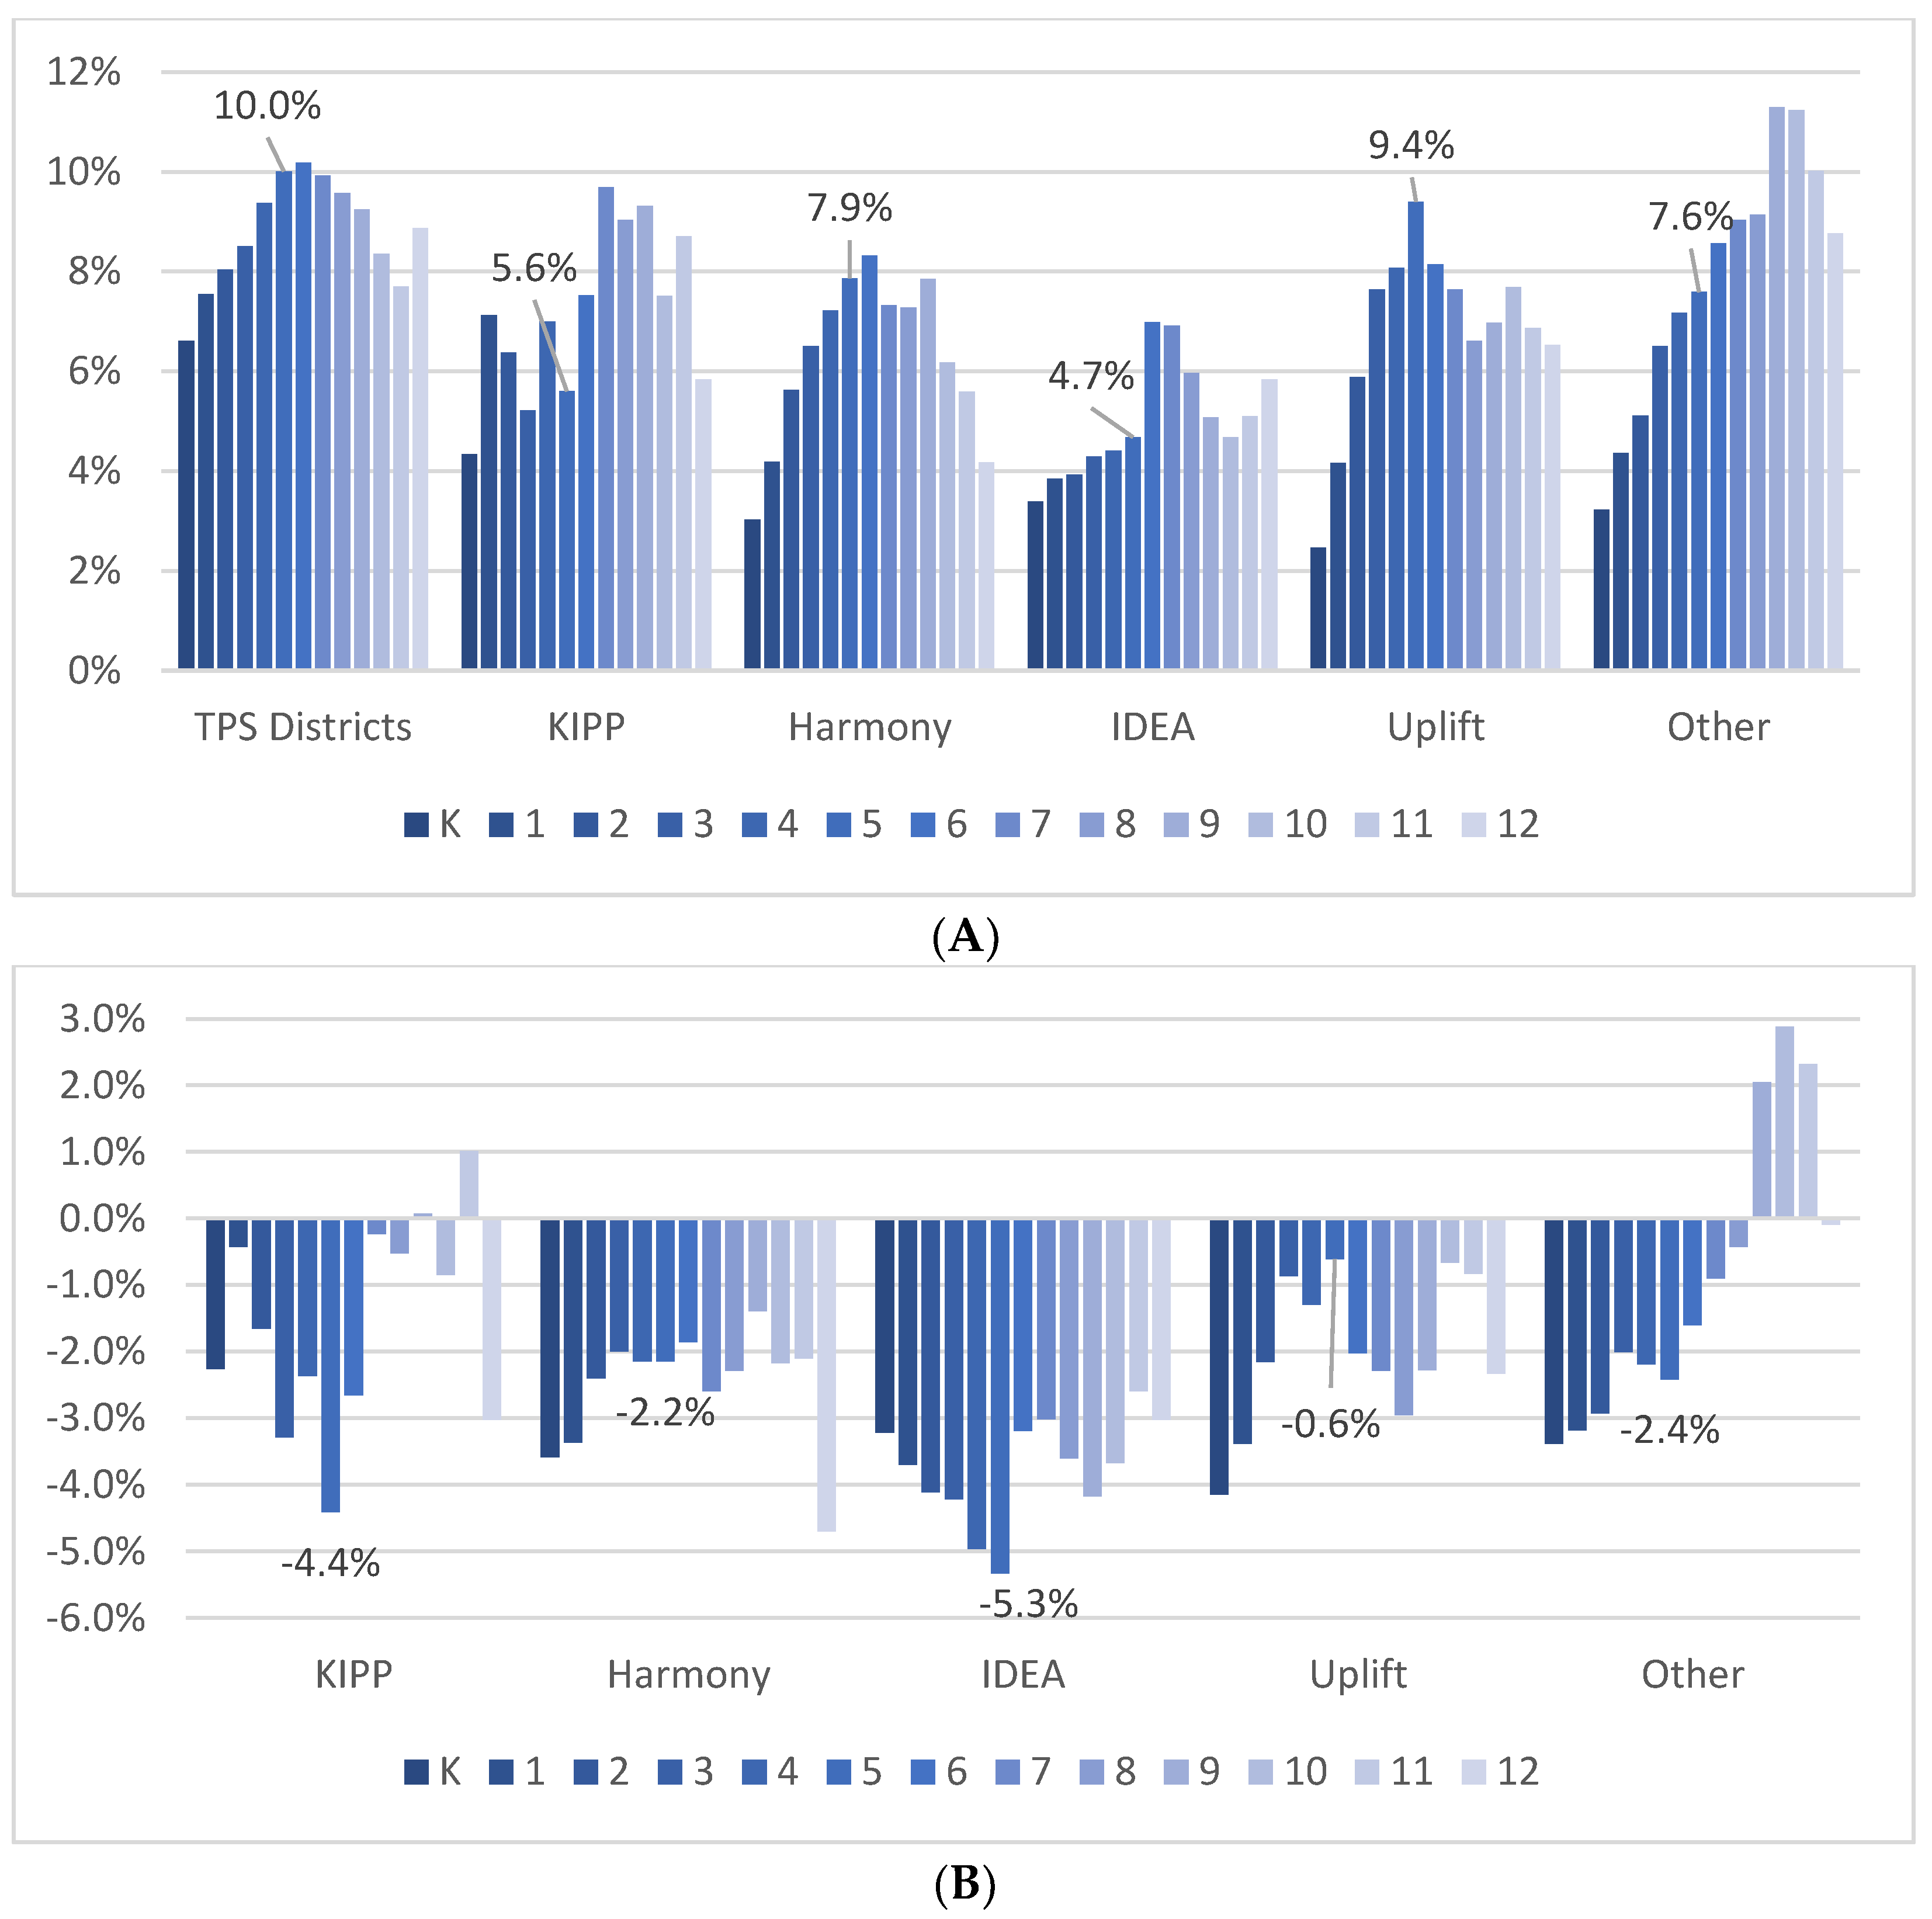
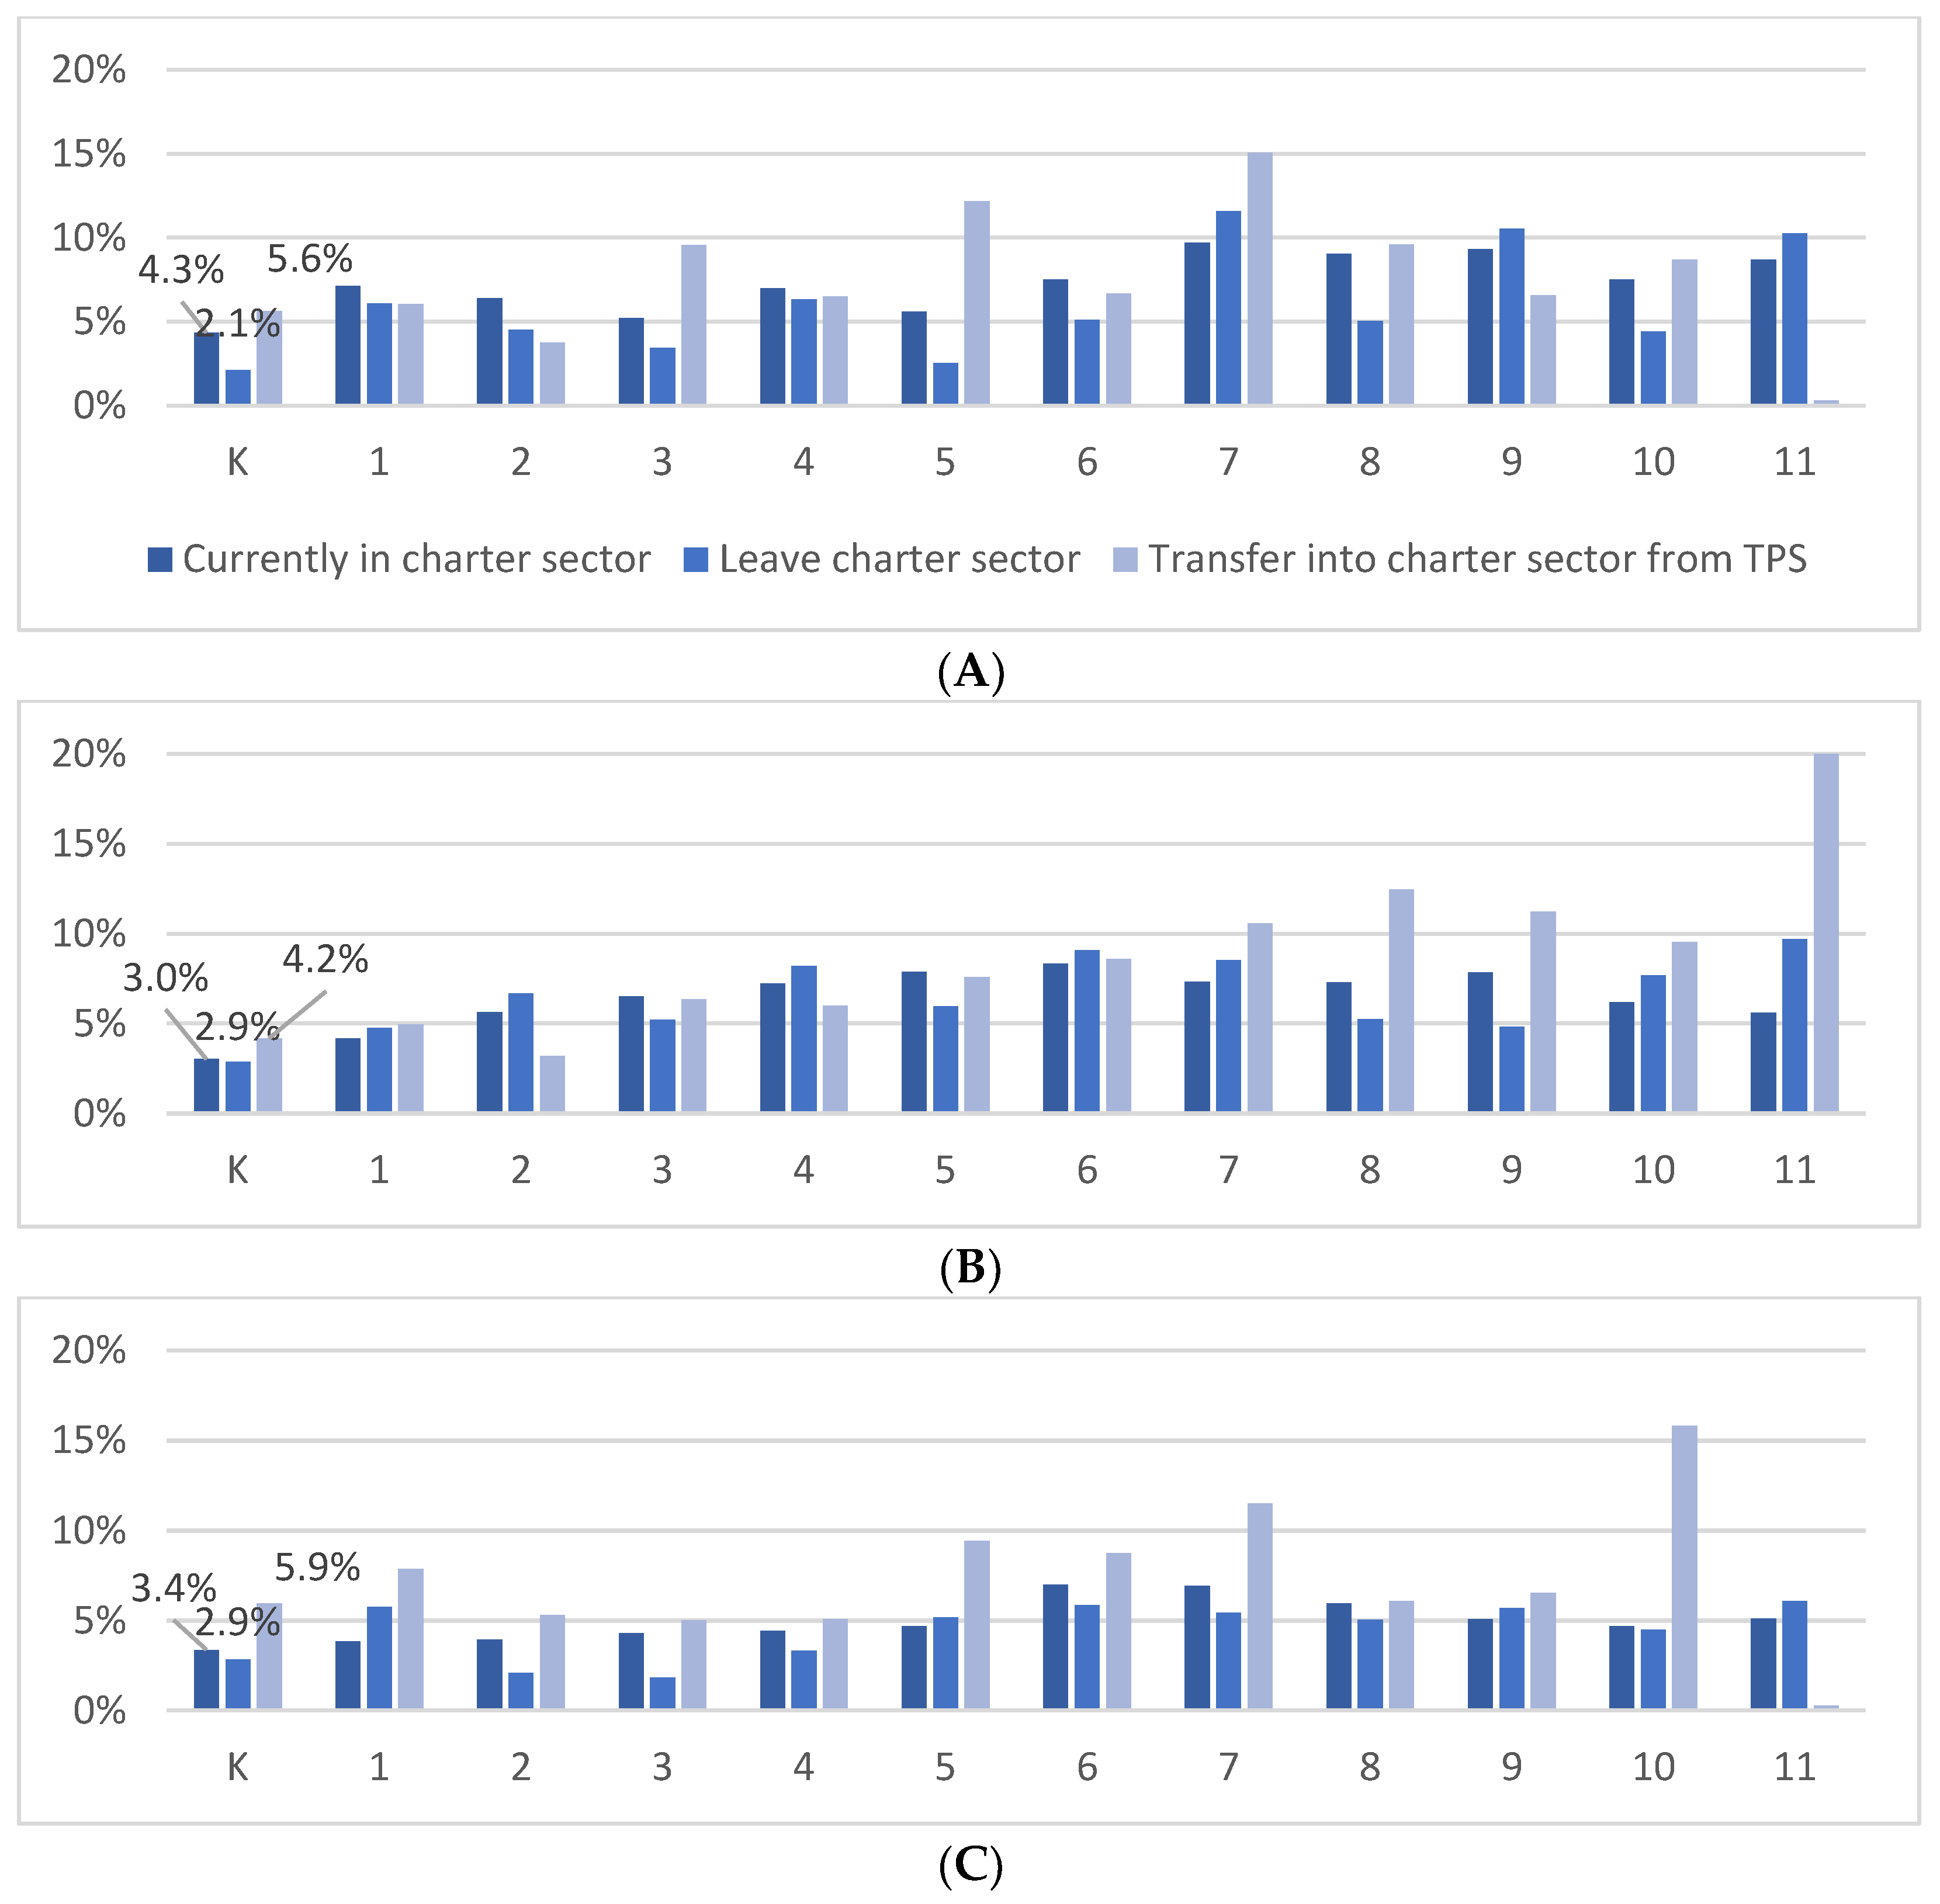
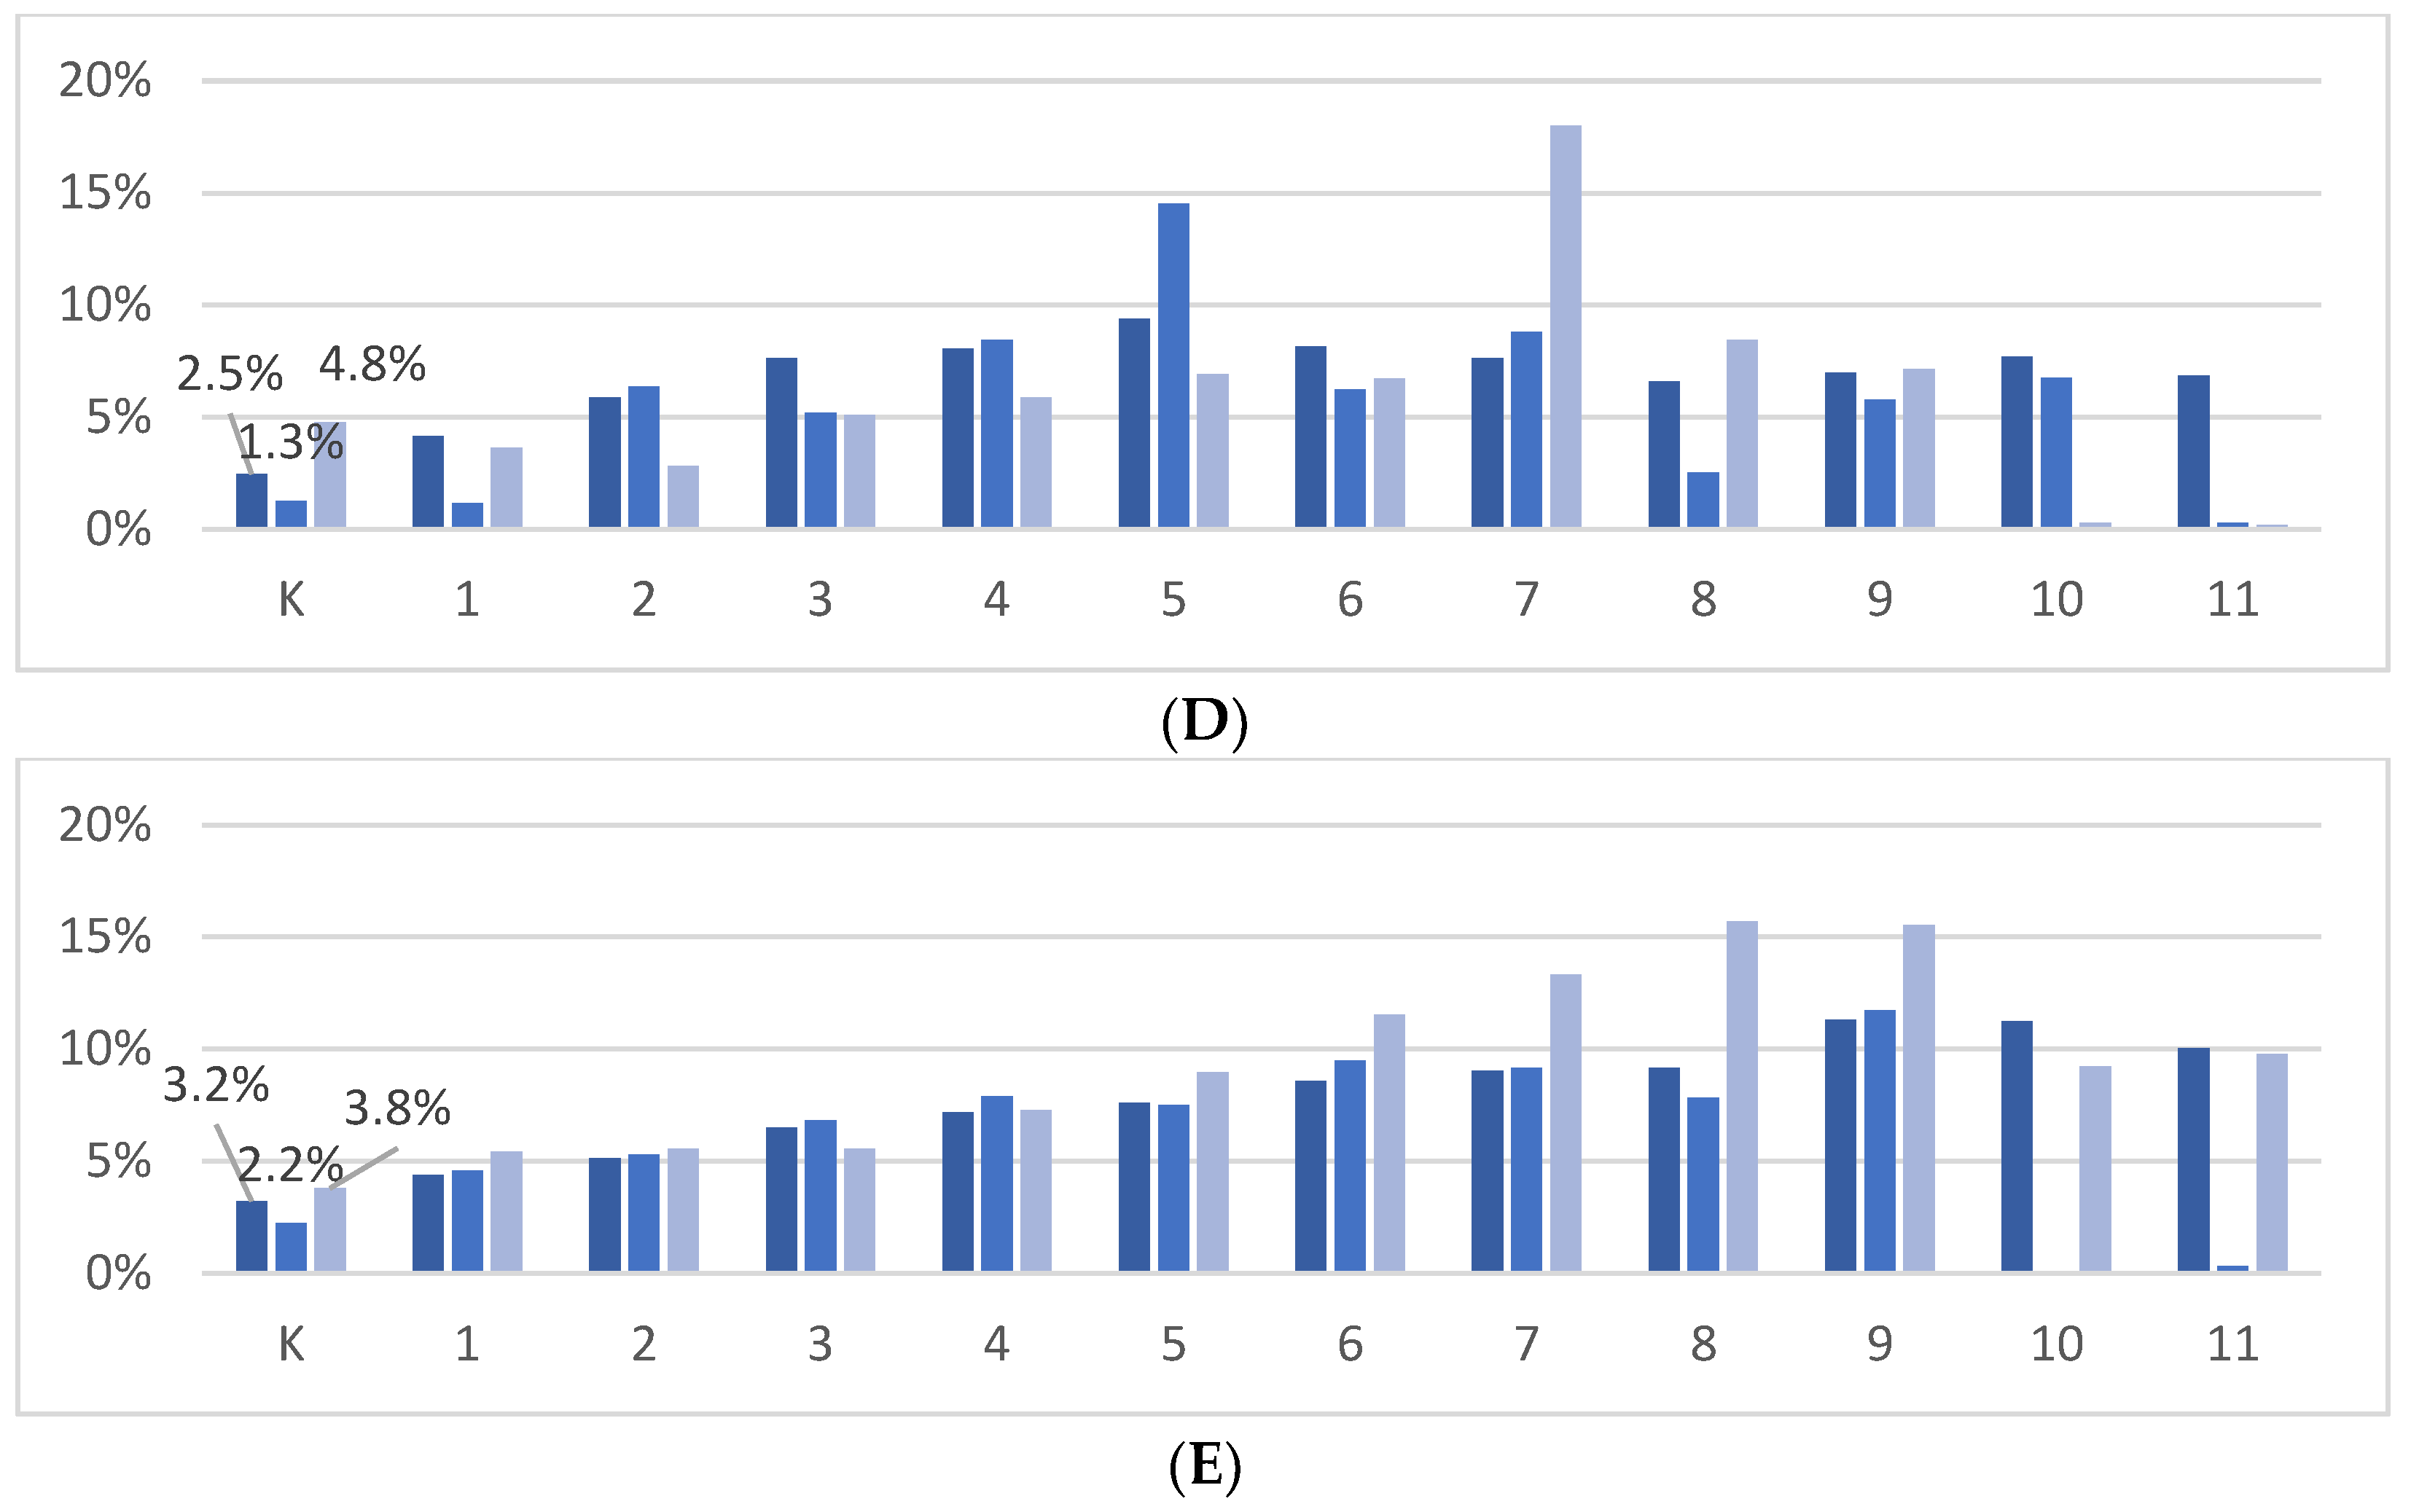
6.1. Special Education

Figure 1 shows rates of special education (SPED) enrollment in 2016–17. At almost every grade level, TPS districts serve a greater percent of students in SPED than other major charter networks. For example, in kindergarten, 6.6 percent of TPS students are in special education, compared to 4.3, 3.0, 3.4, 2.5, and 3.2 in KIPP, Harmony, IDEA, Uplift, and all other (smaller) charter networks, respectively. By grade 5, 10.0 percent of TPS students receive SPED services, compared to 5.6, 7.9, 4.7, 9.4, and 7.6 percent for the four largest charter networks and all other charters, respectively. Figure 1B shows SPED enrollment gaps between charter and TPS districts, which vary substantially across grades. KIPP enrolls a lower percent of students in SPED than TPS districts in all but grade 11, but especially for grades 3 through 6, where the SPED enrollment gap hovers around 3.2 percentage points, 34 percent lower than TPS districts, whereas KIPP is closer to SPED enrollment parity with TPS districts in grades 7 through 11. By contrast, SPED enrollment gaps are largest for Uplift charter schools in kindergarten and first grade as well as grades 6 to 9 (averaging about 2.4 percentage points, 25 percent lower than TPS districts for those grades). SPED enrollment gaps also vary across grades for Harmony and IDEA, with both having the largest gaps in the upper elementary grades.
As noted, special education enrollment gaps could result from transferring of students between charter and TPS sectors. “Transfer out” factors refer grade levels in which charter students in SPED are more likely to transfer to the TPS sector compared to charter students not in SPED. Another explanation relates to “transfer in” factors for students in SPED, in which TPS students in SPED are less likely to transfer into charter districts compared to TPS students not in SPED. Figure 2 explores these two issues for each charter district.
Figure 2A shows results for KIPP. The darkest shaded bars describe current enrollments (2016–17), the lighter shade bars describe the population of students in that grade transferring out of the charter sector into the TPS sector, and the lightest shade describes the population of students in each grade transferring into the charter sector from the TPS sector. While 4.3 percent of KIPP kindergarten students are enrolled in SPED in 2016–17, only 2.1 percent of the students who transfer out of KIPP schools and into the TPS sector the following year are enrolled in SPED, implying that kindergarten students exiting KIPP are less likely to be enrolled in SPED than the current population of KIPP kindergarteners (and KIPP kindergarteners in SPED are not more likely to leave than KIPP kindergarteners not in SPED). The same pattern holds for grades 1 to 6, 8 and 10 (but not for grades 7, 9 and 11). This finding suggests KIPP enrollment patterns are not associated with “transfer out” factors for students in SPED, for most grades. Meanwhile, 5.6 percent of TPS kindergarteners who transfer into KIPP for the 2017–18 school year are enrolled in SPED, suggesting that from kindergarten to first grade, a higher percent of students in SPED transfer into KIPP schools for grade one relative to KIPP’s current SPED enrollments. Similarly, the SPED enrollment rate for students transferring into KIPP from the TPS sector exceeds SPED enrollment rates in that grade for grades 3, 5, 7, 8 and 10. For grades 1, 2, 4, 6, 9, and 11, fewer students in SPED transfer into KIPP, relative to current enrollments in that grade (i.e., the lightest shade bar is lower than the darkest shade in Figure 2).
Figure 2B–E show the same results for Harmony, IDEA, Uplift, and all other charter districts. Results for both Harmony and IDEA again paint a mixed story. For Harmony, leavers are more likely to be in SPED than are currently enrolled students in grades 1 and 2, 4, 6, 7, 10, and 11, (i.e., the middle-shaded bars are higher than the darkest shade in Figure 2B). However, in kindergarten and grades 3, 5, 8 and 9, leavers have lower rates of special education enrollments than current enrollments in those grades (or differences are not statistically significant). In terms of “transfer in” factors, Panel B shows that in grades 2 through 5, students transferring into Harmony from the TPS sector are less likely to be enrolled in SPED relative to current Harmony enrollment, while the opposite is true for kindergarten, grade 1, and grades 6 to 11 (where the lightest shade bars exceed the darkest shade in Figure 2B). Similarly, while IDEA maintains lower SPED enrollments at every grade level compared to TPS districts, this gap does not seem to be caused by disproportionate exit rates, since IDEA leavers have lower rates of SPED enrollment than current IDEA students in most grades (all but grades 7, 9, and 11). This gap also is not likely caused by selective transfers in, since SPED enrollment rates for TPS students transferring into IDEA are relatively similar to current IDEA SPED enrollment rates, depending on the grade (the lightest shade bar is equal to or above the darkest shade bar for most grades in Figure 2C).
Transfer patterns into and out of Uplift, as well as all other charters, have a more direct influence on the SPED enrollment gap (Panels D and E). SPED enrollment rates among Uplift leavers are, on average, similar to current enrollments (higher in grades 2, 4, 5, and 7, but lower in kindergarten and grades 1, 3, 6, and 8 to 11); however, students entering Uplift charters from the TPS sector have significantly lower SPED enrollment rates compared to students currently enrolled in Uplift charters in most grades (grades 1 to 6, 10 and 11), suggesting that “transfer in” factors contribute to the SPED enrollment gap for Uplift charters. In contrast, among all other charters, leavers to the TPS sector have higher SPED enrollment rates than current enrollments in those schools, while students transferring in have similar SPED enrollment rates.
In summary, the findings from Figure 1 and Figure 2 suggest that charter schools in Texas enroll fewer special education students when compared to TPS districts, yet the underlying cause appears to differ across charter districts. A large portion of the gap starts in kindergarten. As Figure 2 shows, charter districts have SPED enrollment rates for kindergarteners that range from 2.3 to 4.1 percentage points lower compared to TPS districts, equating to 53% to 164% fewer students enrolled in SPED. The kindergarten SPED enrollment gap could result either from differences in parents’ initial enrollment decisions or from differences in SPED identification practices for kindergarteners. Student transfers between sectors contribute to the SPED enrollment gap for Uplift and for smaller charter districts, but not for KIPP, Harmony, or IDEA.

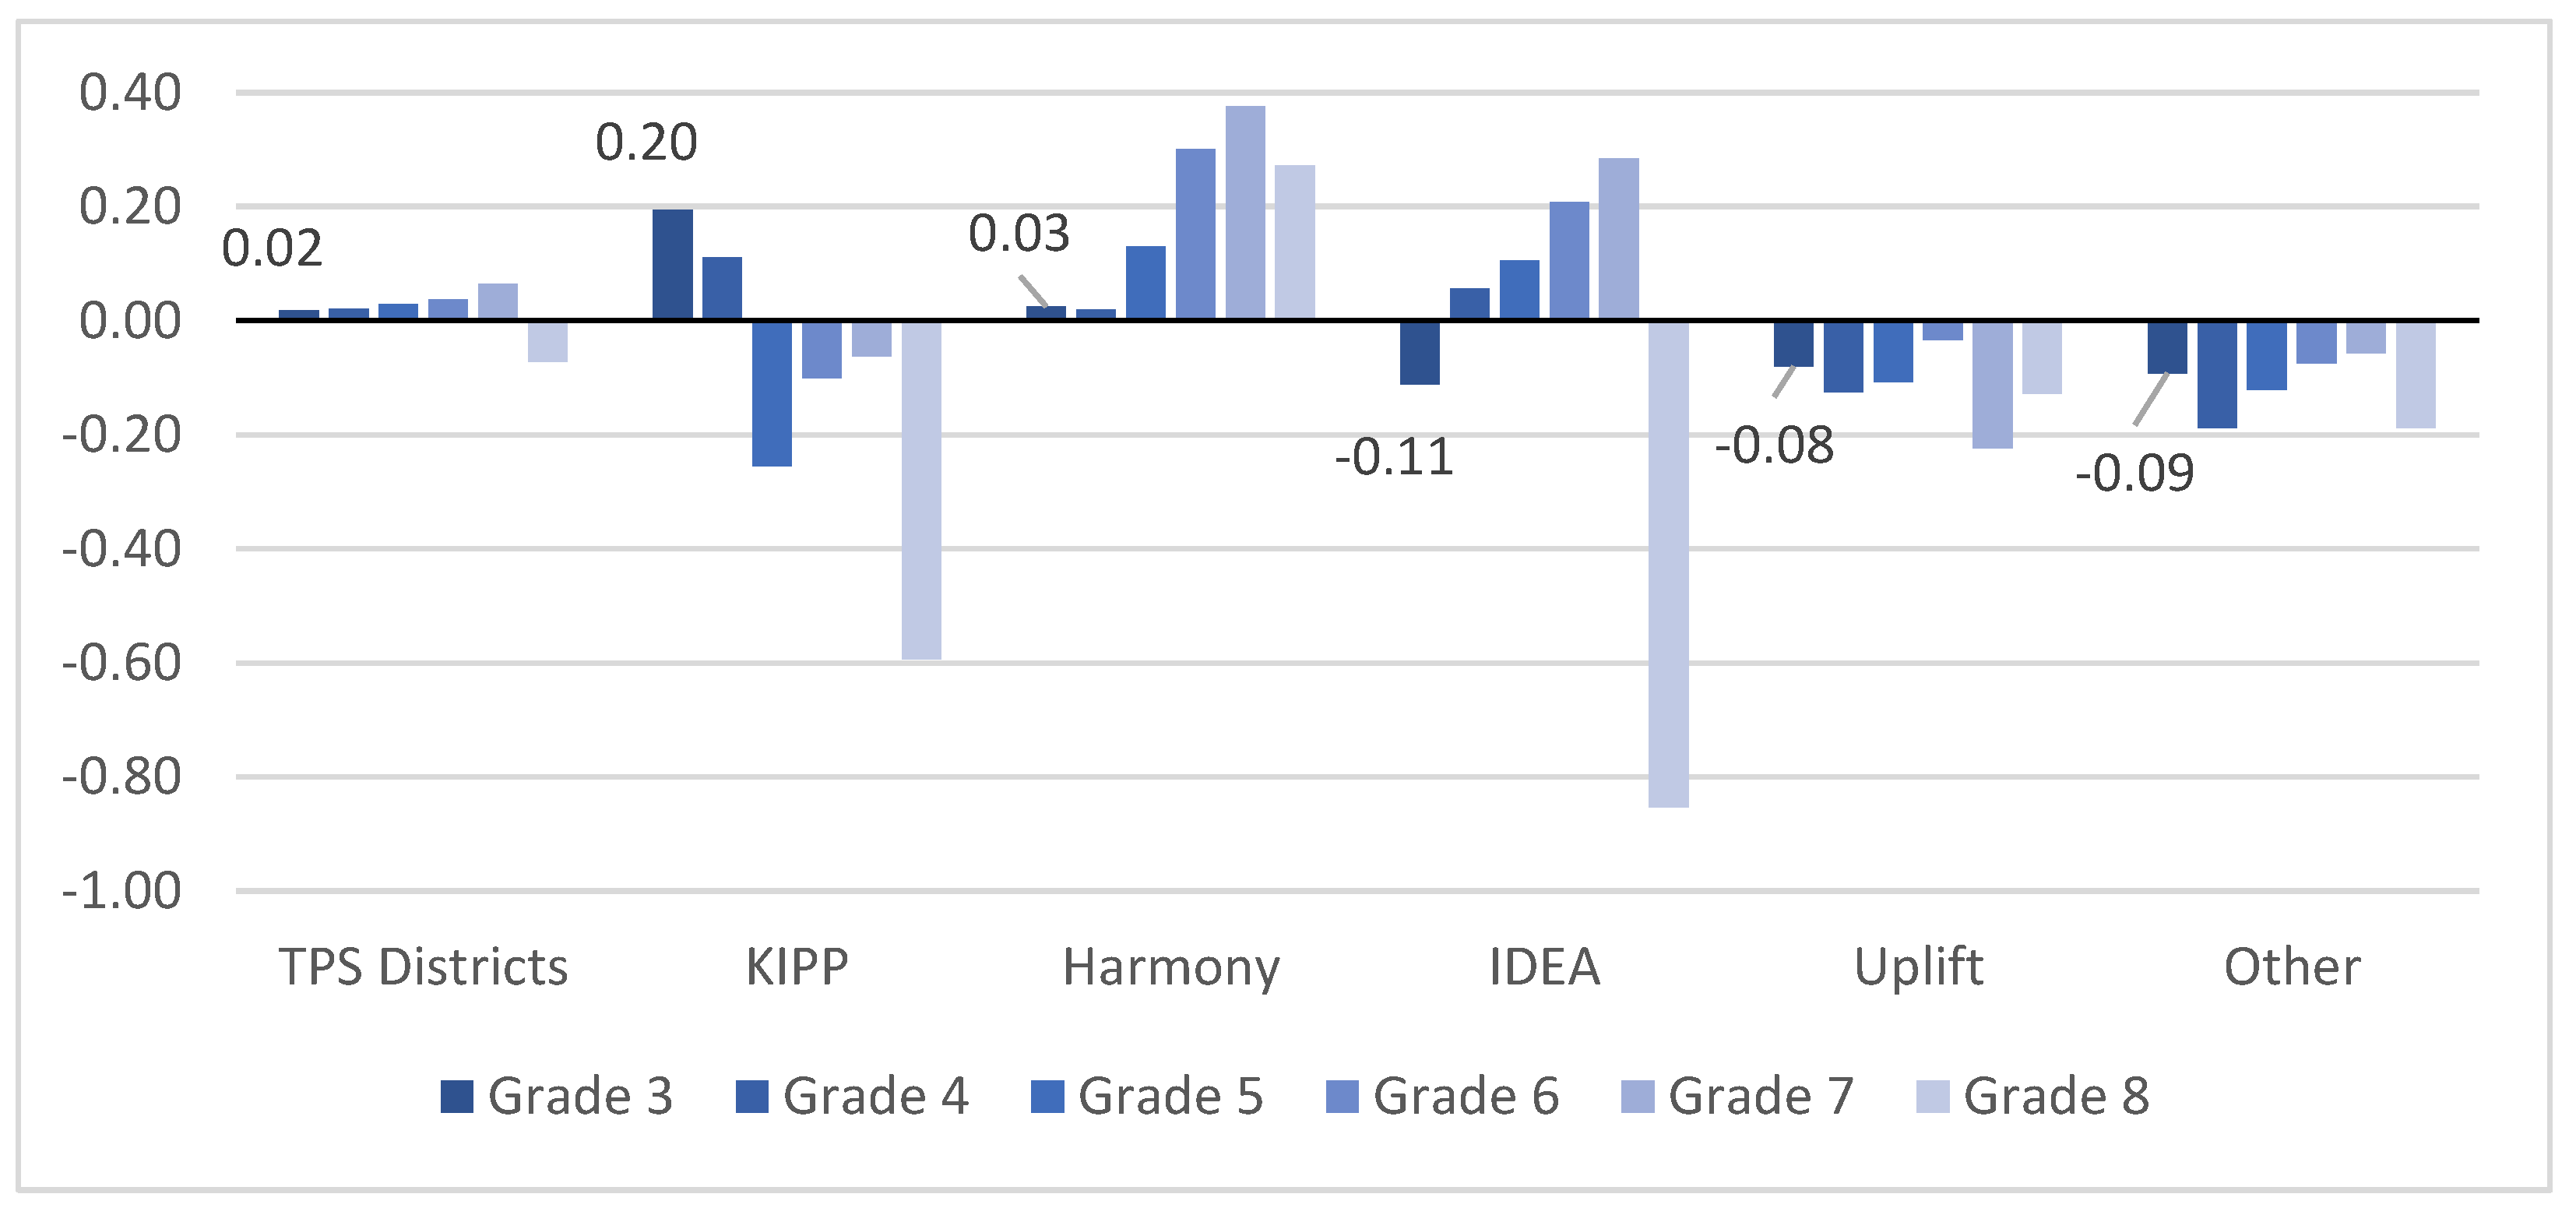
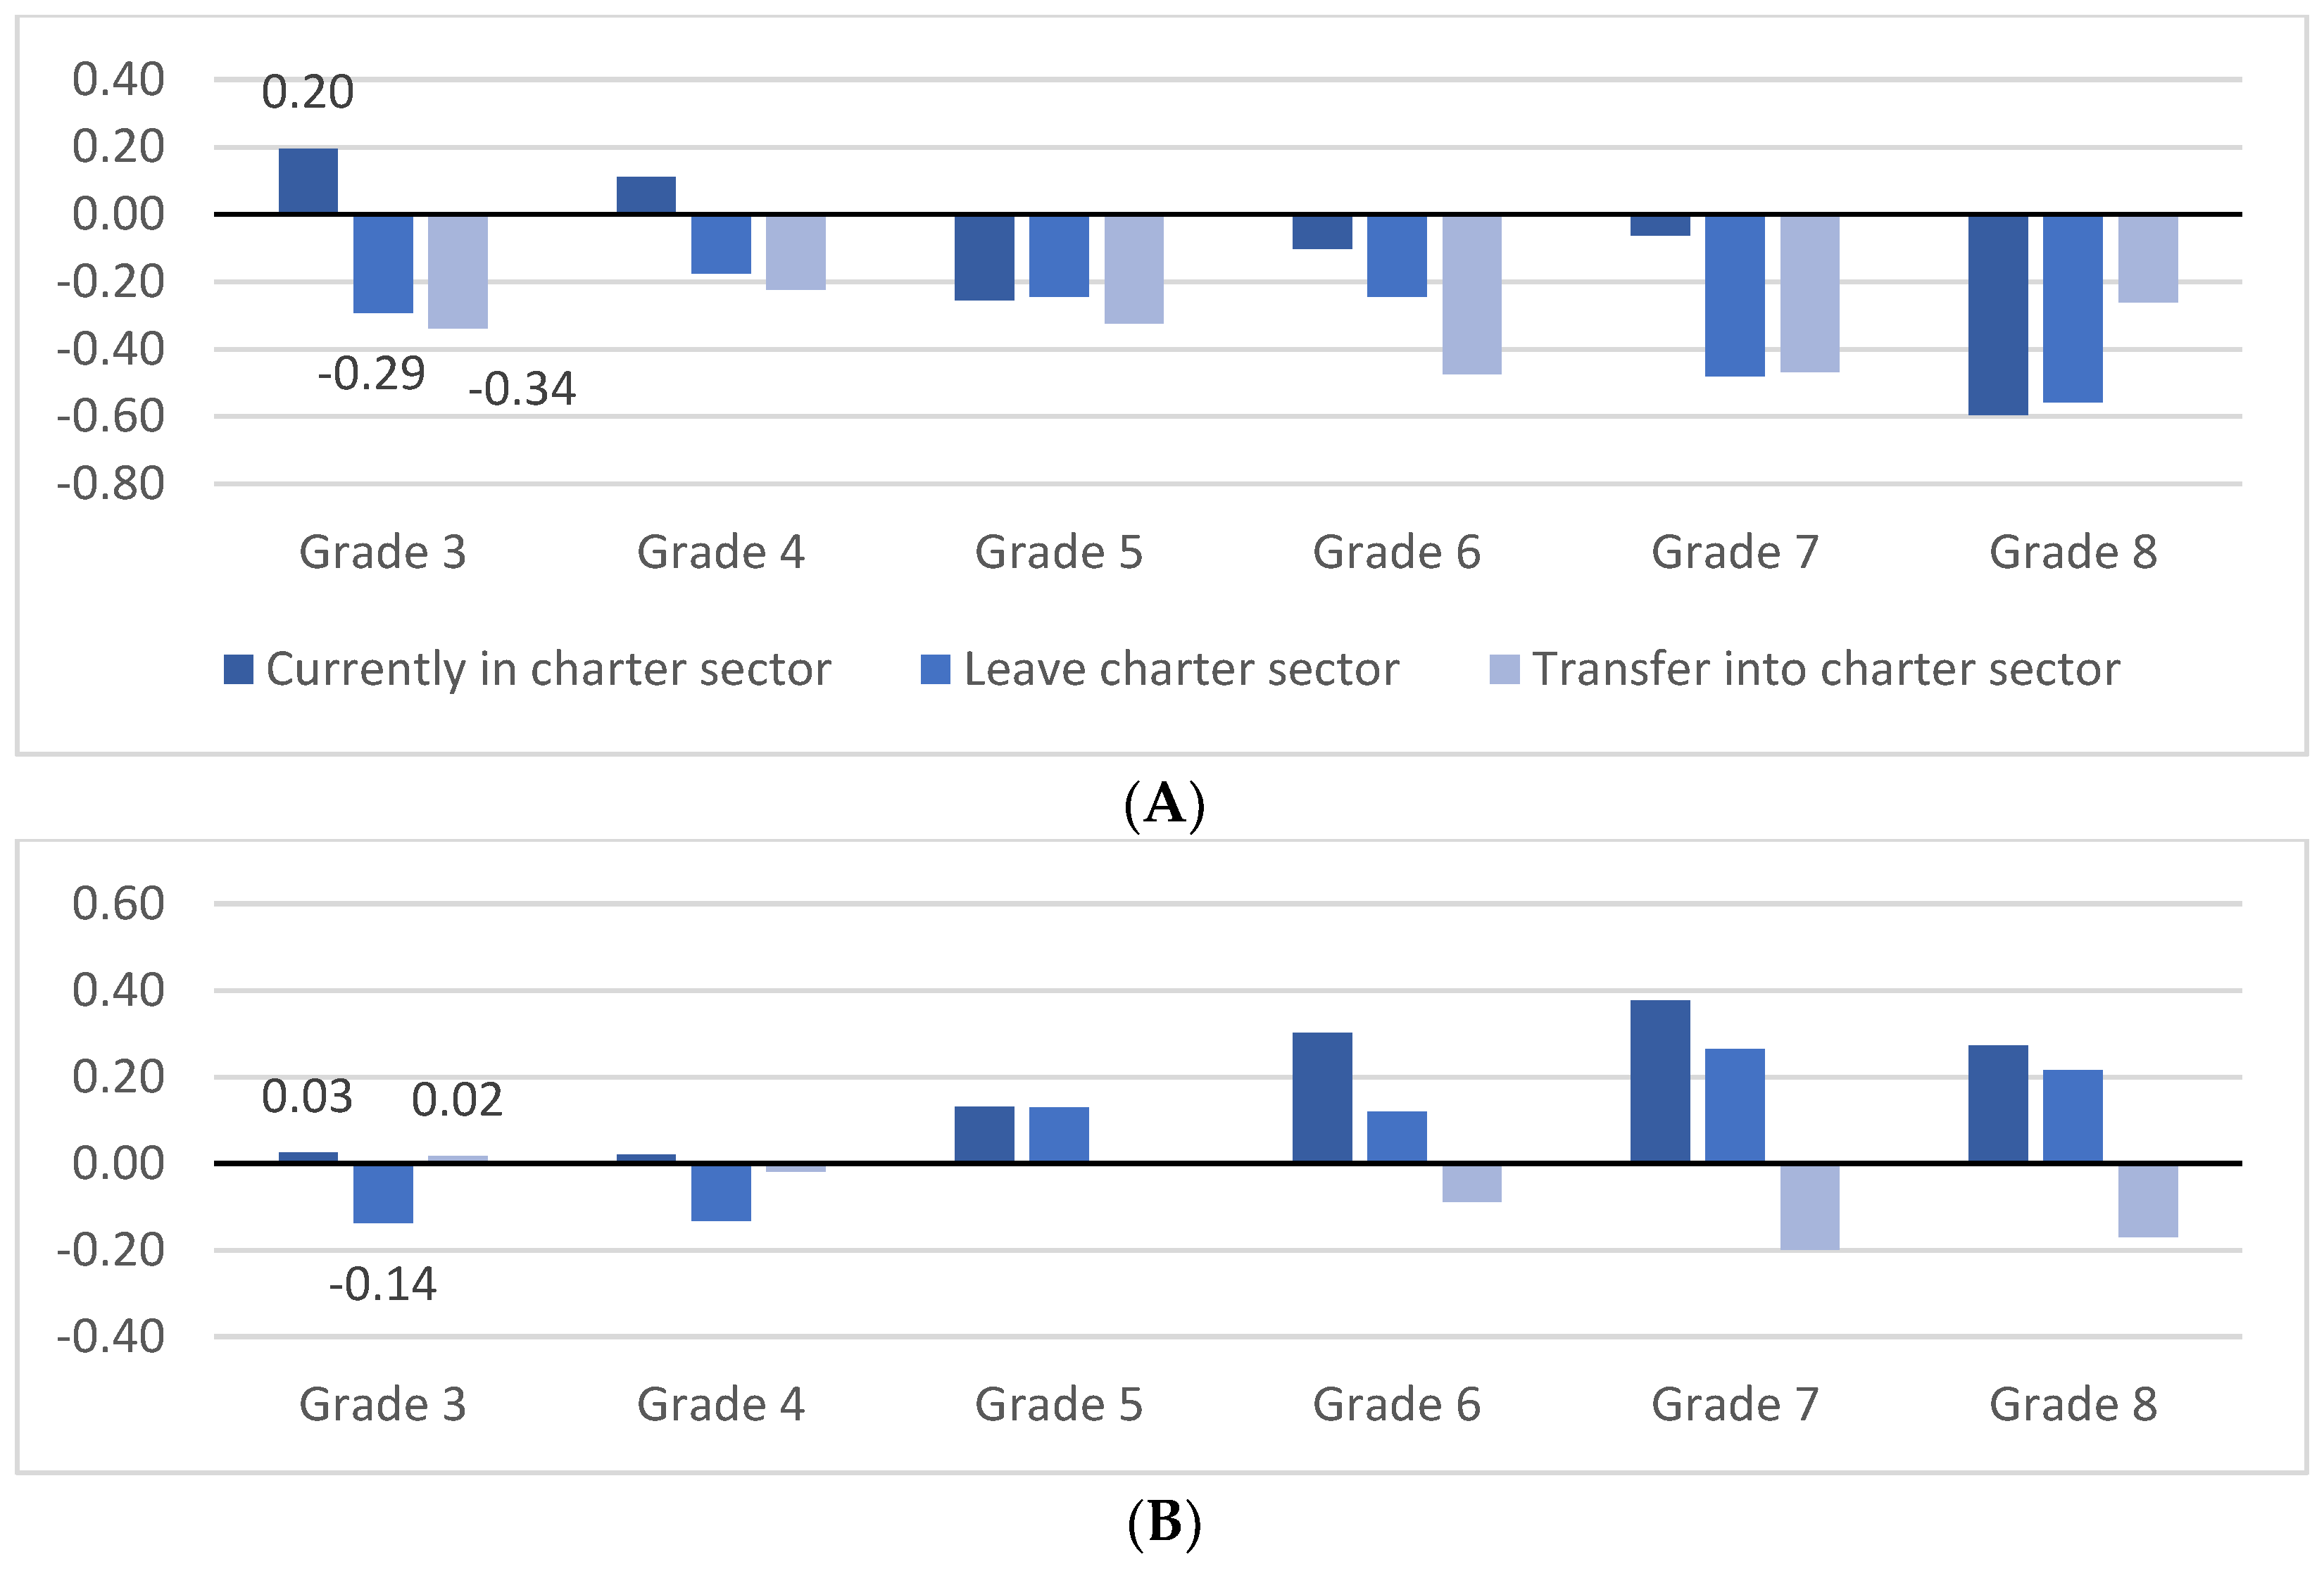
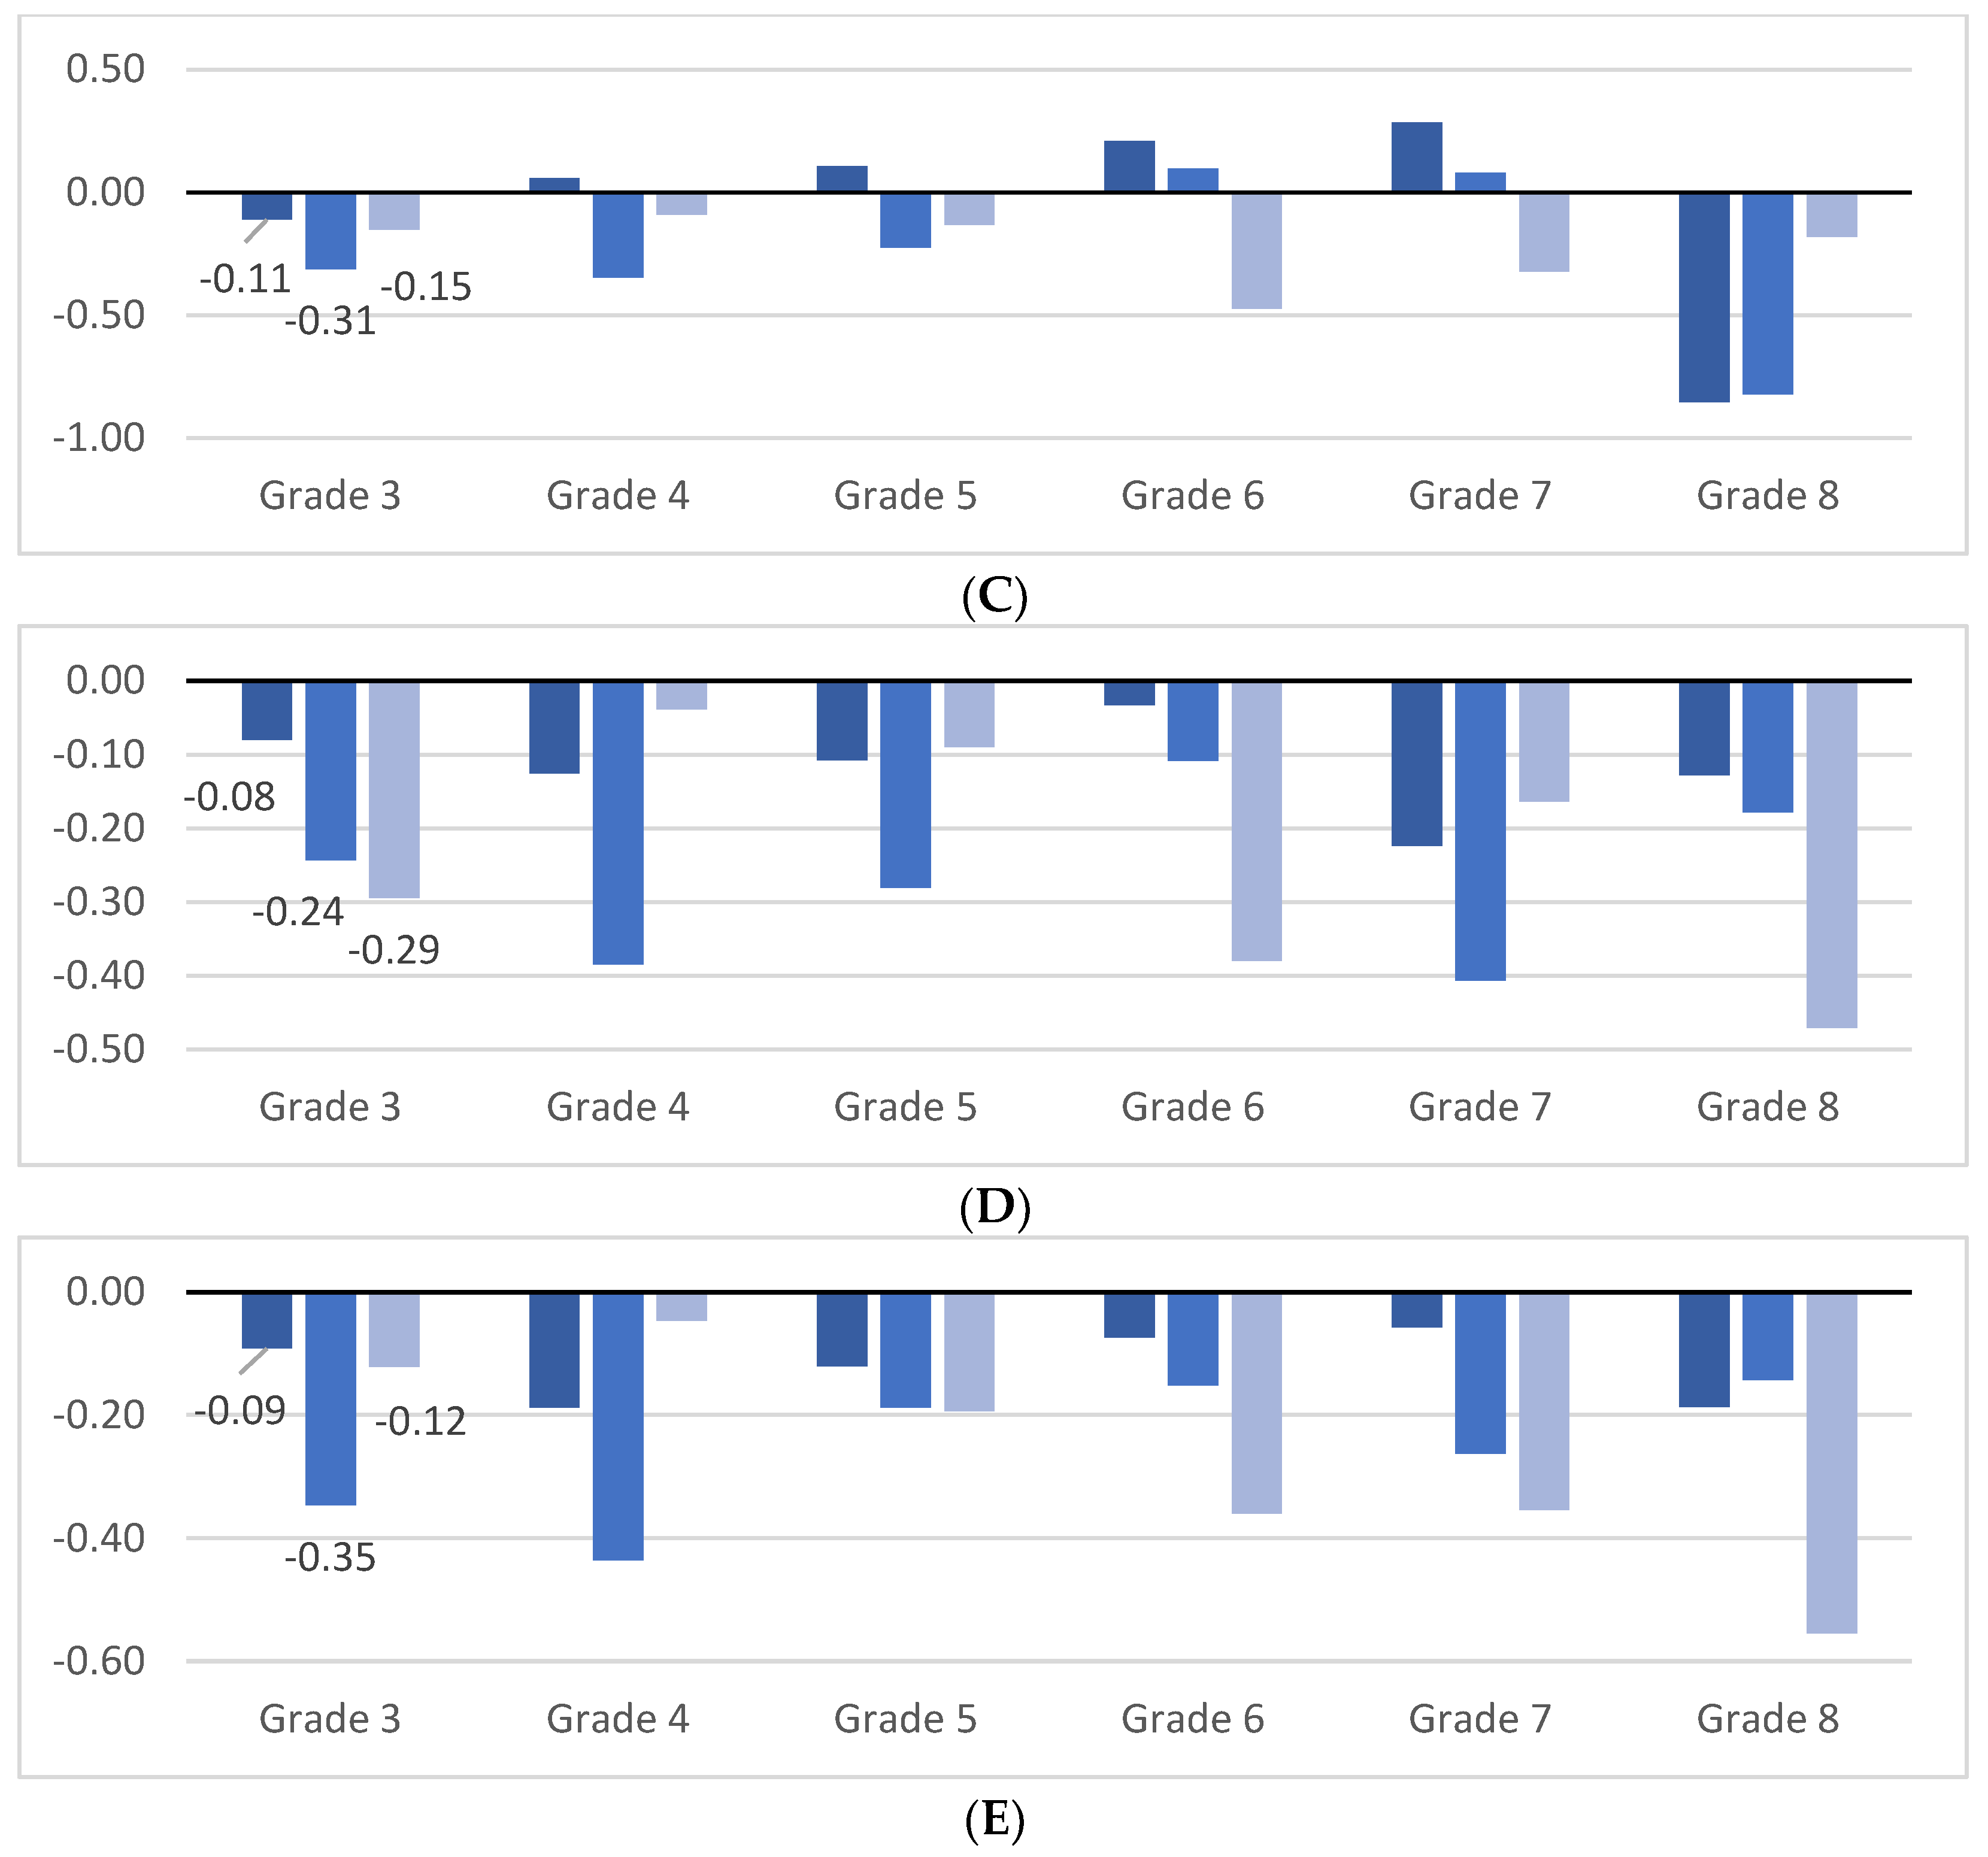
6.2. Prior Achievement in Grades 3 to 8

We next turn to similar analyses for student achievement on the Texas State Assessment of Academic Readiness (STAAR) for grades 3 to 8. We focus our discussion on math achievement but note that results for English language arts are similar (and available from the authors upon request). Figure 3 shows that on average students in TPS districts have slightly higher than average math test scores. Grade 3 students in TPS districts score 0.02 standard deviations (SD) above the mean and average achievement in grades 4 through 8 is within 0.07 SD of the mean. In KIPP schools, grade 3 and 4 students score 0.20 and 0.11 SD above the mean, respectively, while students in grades 6, 7 and 8 score below the state mean. Math achievement at Harmony is about average among grade 3 students, and math achievement generally increases at each grade. Grade 3 students in IDEA schools score 0.11 SD below the mean, but, as with Harmony, average achievement increases in each successive grade level. Uplift charters show the opposite trend, where grade 3 students score below average and achievement declines in the upper grades.
Differences in achievement may result from systematic differences in school quality, but student transfers into and out of charter networks may also play a role. To assess this possibility, Figure 4 compares 2016–17 math achievement for each charter network to 2017–18 student “leavers” and “arrivers” for the same charter networks. Across almost every grade level and charter network, exiting students have lower average test scores than students who remain at their current charter networks. For example, Panel A shows that current KIPP grade 3 students score 0.20 SD above the mean, while exiting grade 3 students have an average math achievement score so 0.29 SD below the mean. For KIPP, exiting students have higher scores than remaining students for grades 5 and 8, but for grades 3, 4, 6, and 7 in KIPP schools, lower-performing students are more likely to exit for the TPS sector. Panel B, C, and D show that this is true for every grade in Harmony, IDEA, and Uplift except for grade 8 in IDEA charter schools. At the same time, students who transfer in to charters from the TPS sector tend to have lower math achievement than the current enrollment for each charter district. For example, grade 3 TPS students who transfer into KIPP at the end of the 2016–17 school year have an average math score of −0.34 SD, while the average score for KIPP grade 3 students in 2016–17 is 0.20 SD. These findings may suggest students are more likely to transfer between sectors when they are lower performing, regardless of whether they are transferring from charters to TPS districts or vis versa. The finding algins with the hypothesis that families are motivated to switch sectors when students are underperforming.

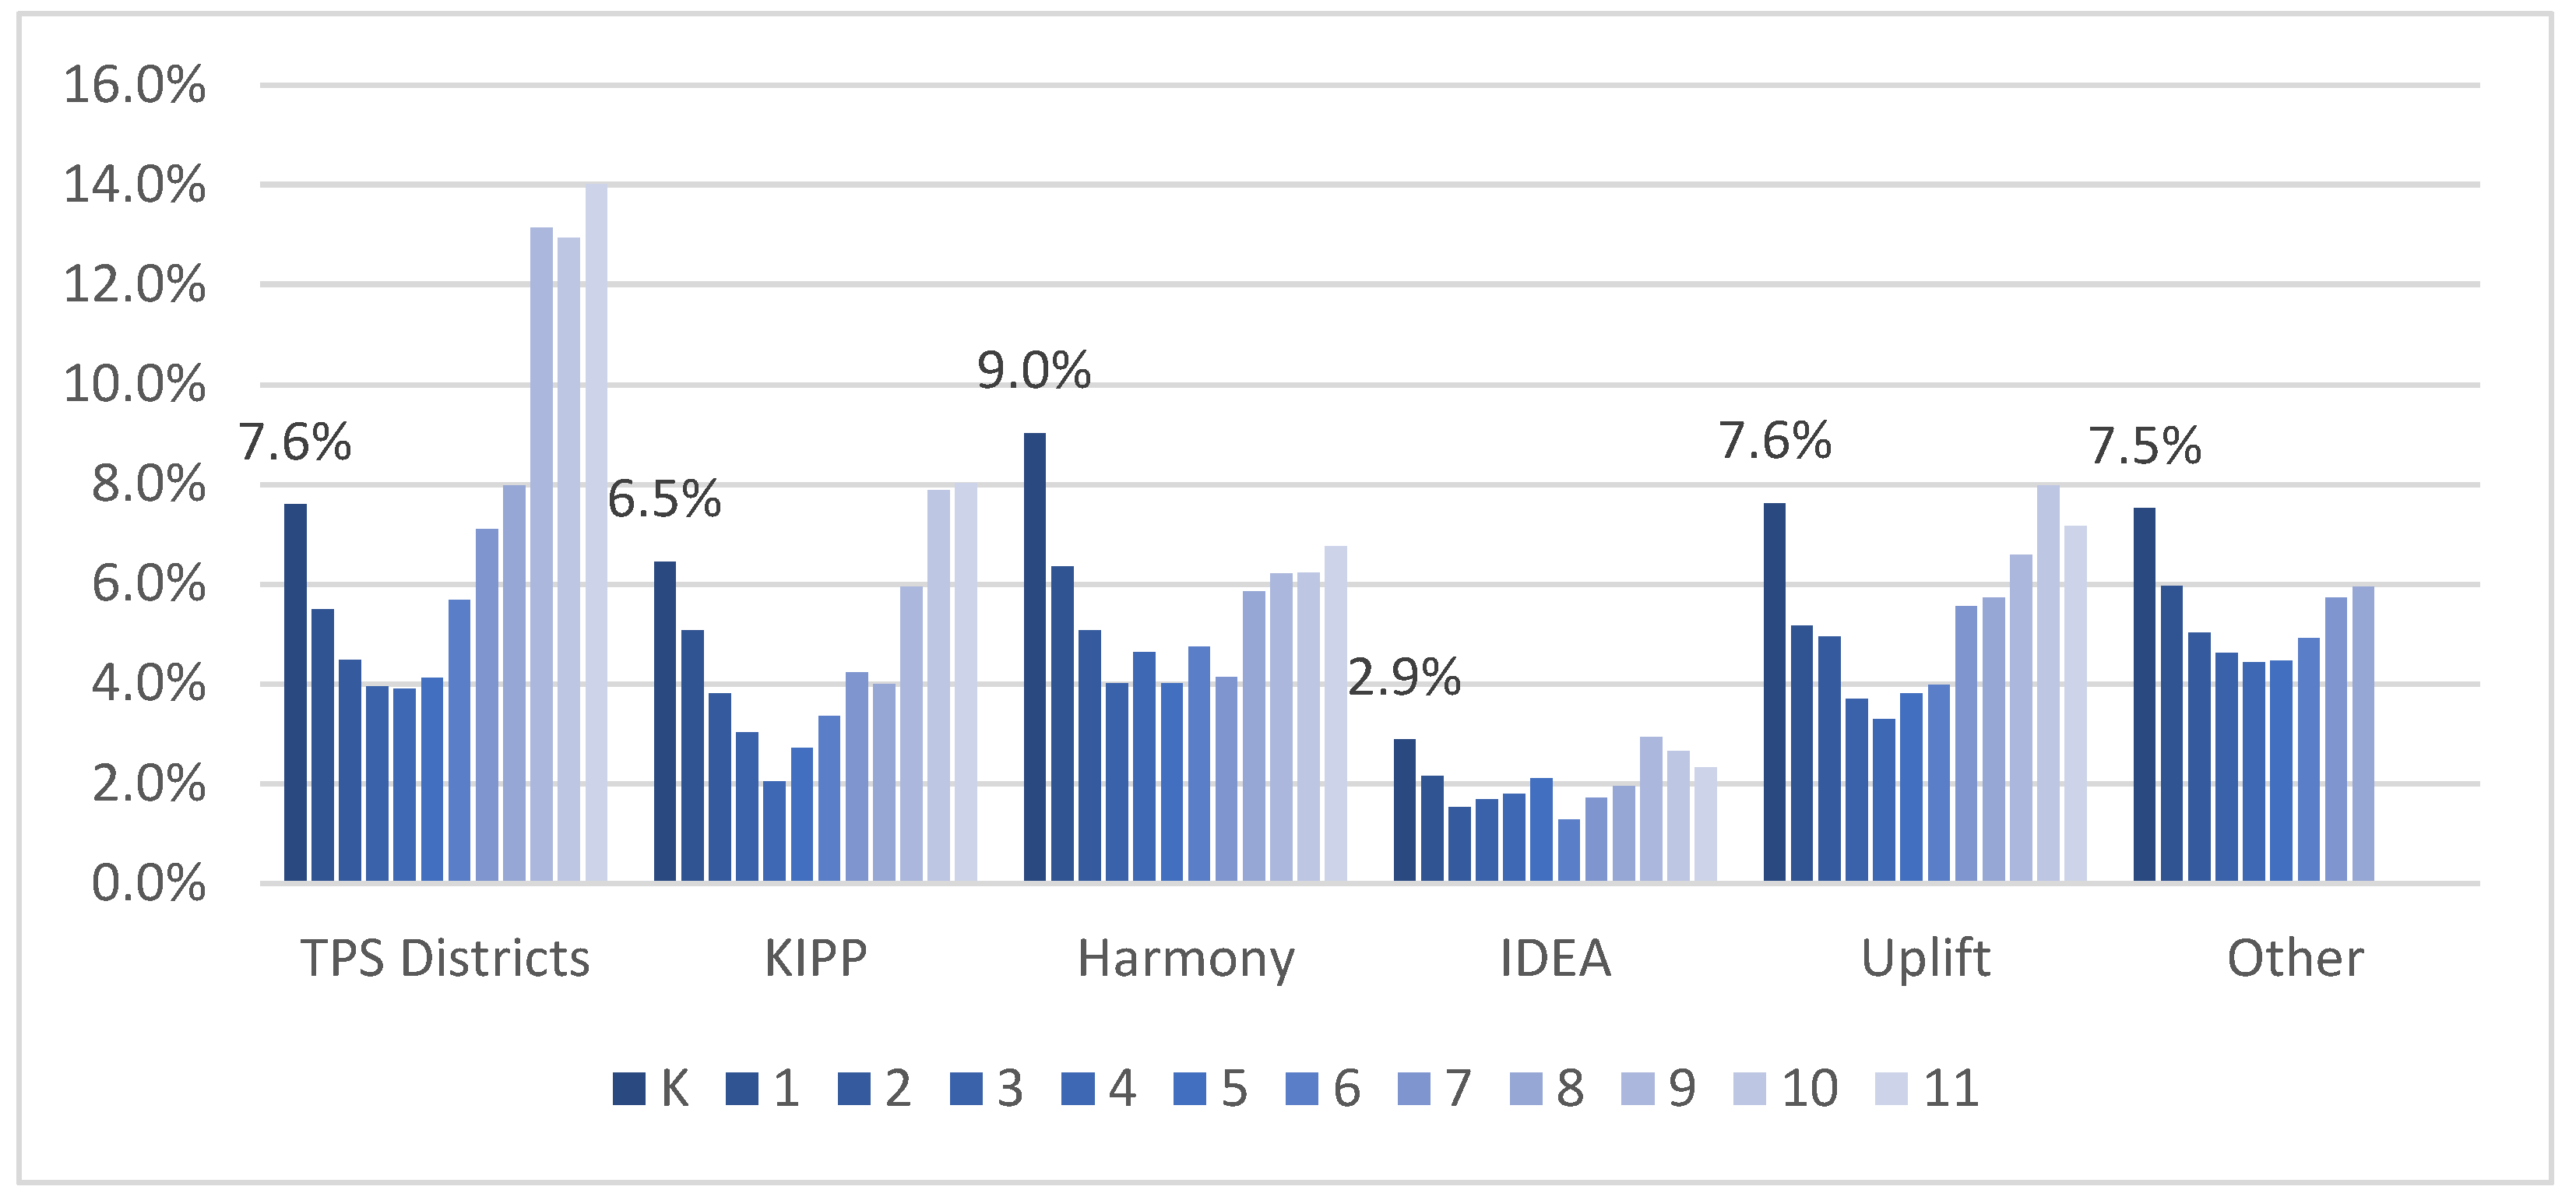
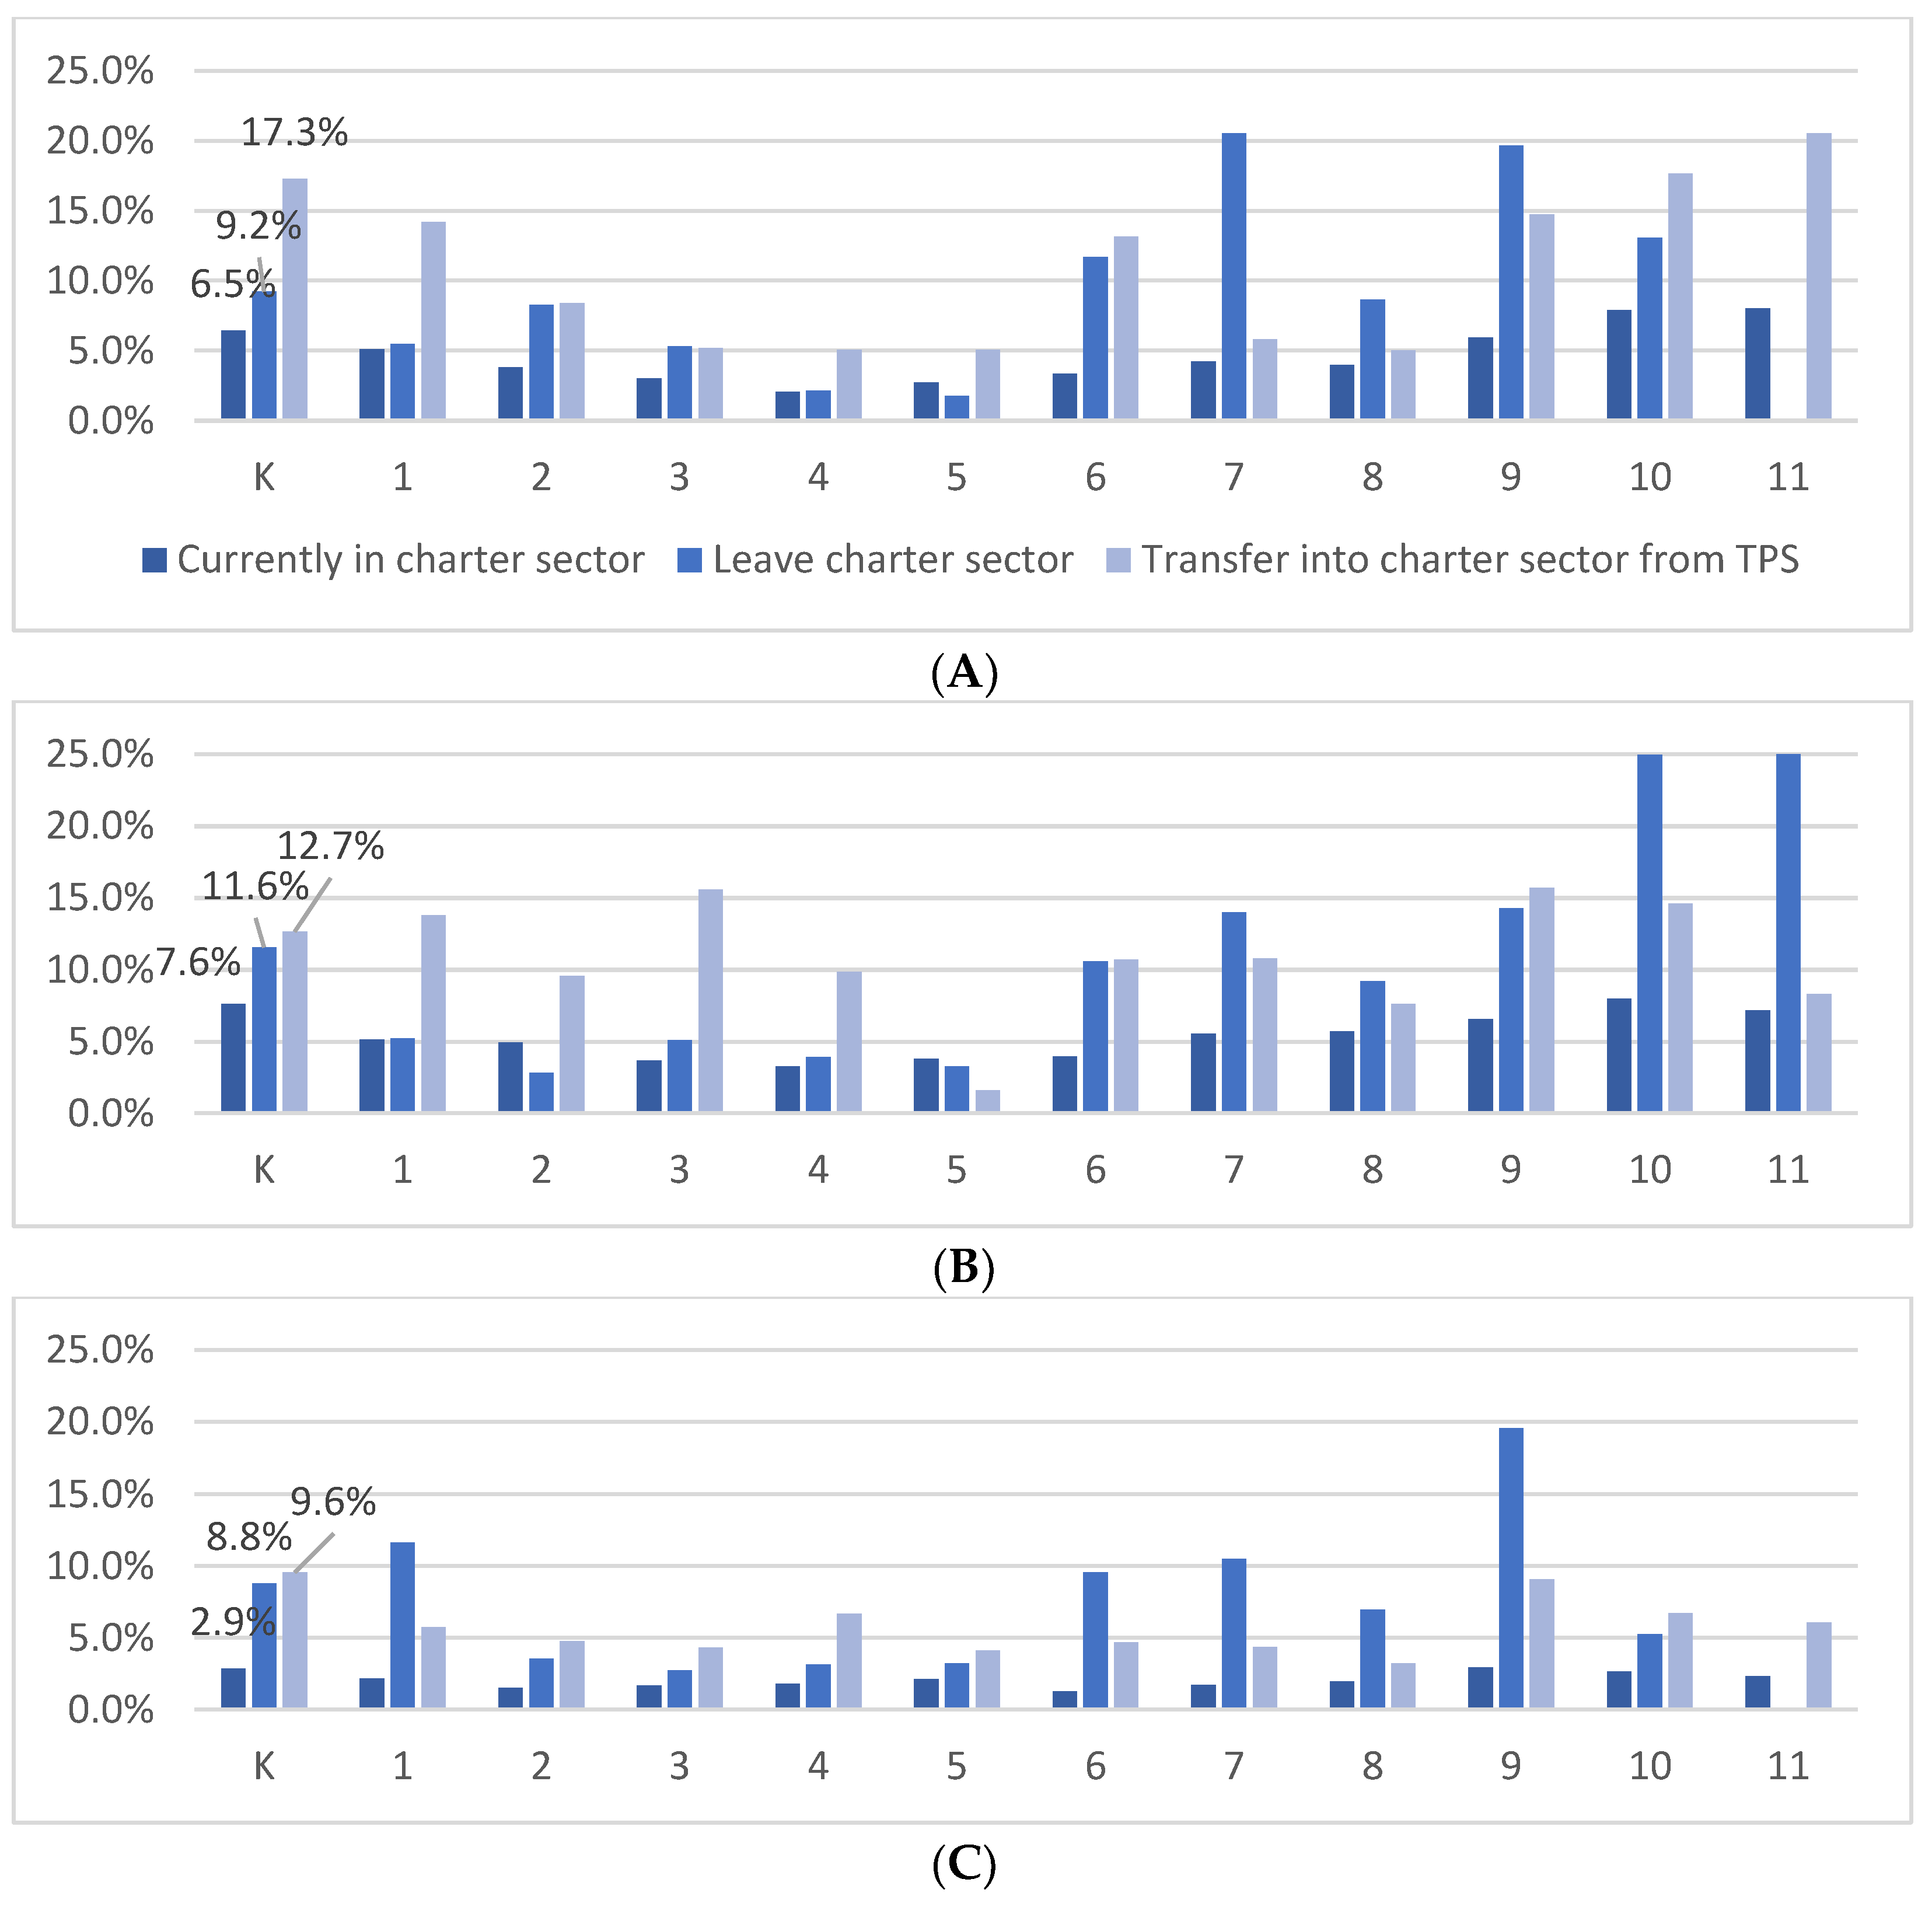
6.3. Other Student Characteristics

Next, we make the same calculations based on attendance and absenteeism. Figure 5 shows average rates of absenteeism in TPS districts and the four largest charter districts in 2016–17. Students in TPS districts tend to have higher rates of absenteeism, especially in the high school grades. As with achievement, this may result from differences in school practices across TPS and charter networks, but this pattern may result in part from student transfer patterns. Figure 6 shows the same set of bar graphs as before, this time for absenteeism. As with test scores, the data show that students with lower attendance are more likely to exit the charter sector. For example, Figure 6A shows that current KIPP kindergarten students miss an average of 6.5 percent of school days in 2016–17, but KIPP kindergarten students who transfer into the TPS sector the following year are absent an average of 9.2 percent of the school year. This general trend holds for other grade levels and charter networks—students leaving charters tend to have lower average daily attendance rates than those who stay, with especially large gaps for smaller charter districts (Panel E). At the same time, student arrivers—those transferring from the TPS sector into a charter district—also tend to have lower attendance rates than current enrollment. This pattern mirrors that of test scores, where students with lower attendance at charters may transfer out, but those charters also accept students with lower attendance, relative to their current enrollment. This pattern again supports the theory that students are actively selecting schooling options based on their experiences under different systems. The pattern also provides evidence of selective attrition out of charter districts, where charters are less likely to continue enrolling lower performing or “higher cost” students.
Additional analyses make similar comparisons based on student race/ethnicity and household income. KIPP, IDEA, and Uplift generally serve a higher percent of students classified as low-income than TPS districts (about 90% compared to about 65%), while Harmony and all other smaller charter districts, on average, serve roughly similar proportions of low-income students as TPS districts. Low-income students are more likely than non-low-income students to transfer into charter schools, but they are also more likely to transfer out (except for Harmony and Uplift, for whom the population of exiting students includes a lower percentage of low-income students than these charter networks currently enroll). Enrollment patterns and mobility rates vary substantially across racial/ethnic groups and across charter networks. Harmony and Uplift serve a far greater percent of Asian or Pacific Islander students than TPS districts. KIPP, Harmony, and Uplift enroll a higher percent of Black students compared to TPS districts, while IDEA charters, which are especially concentrated along the U.S.-Mexico border, enroll a greater share of Latinx student relative to TPS districts. Similar to low-income students, those who identify as Black or Latinx have higher transfer rates, both into and out of the charter sector, but there is not a clear selection pattern (results for income and race/ethnicity are available from the authors upon request).

7. Discussions

These findings illustrate the importance of disaggregating and analyzing student-level data on charter school enrollment patterns. While our results are consistent with previous findings that transfers between education sectors are challenging to generalize [14,38], our analyses offer some unique observations within and between these four large charter school networks in Texas.

7.1. Synthesizing Results

When looking across student classifications—special education, math and ELA achievement, and absenteeism—results suggest that in most grades, students leaving KIPP for TPS sector schools have lower rates of special education than current KIPP students, but also have lower math and ELA achievement, and higher absenteeism. These findings suggest that students in special education are not disproportionately leaving KIPP schools, but students with lower test scores and lower attendance are all more likely to leave KIPP charters compared to typical students at those schools. Yet, students entering KIPP schools have generally higher rates of special education enrollment, lower prior math and ELA scores, and greater absenteeism, relative to current KIPP enrollment in the same grades and schools.
Students transferring out of Harmony schools tend to have higher rates of enrollment in special education compared to those staying in seven of the twelve grade levels from grades K-11, but the reverse is true in the other five grades. Student “leavers” have lower math and ELA scores in every tested grade and have greater absenteeism in most grades from K-11 compared to Harmony students who return the following year. In grades K-6, exiting students are less likely to be retained after leaving Harmony than those who stay, but are more likely to be retained in the upper grades. Characteristics of students transferring into Harmony schools vary across grade levels; entering students have higher special education enrollment in kindergarten and first grade and grades 6–11 than those currently enrolled but have lower math and ELA achievement in all grades. Entering students have greater absenteeism in most grades compared to Harmony’s current student population. These trends may be linked with formal or informal school policies, or with parental preferences.
Students exiting IDEA schools have lower rates of special education, but also have lower math and ELA achievement, and greater absenteeism compared to those who stay. Particularly in the later grades, students who transfer to the TPS sector have substantially higher rates of absenteeism. Students entering IDEA schools have higher rates of special education enrollment and lower math and ELA scores, but also have greater absenteeism.
Comparing “stayers” and “leavers” within Uplift charter schools, we find “leavers” have higher rates of special education enrollment in four grades (2, 4, 5, and 7), but lower special education rates in all other grades. Exiting students have lower math and ELA achievement in every grade and absenteeism is also substantially higher among student “leavers” than “stayers”, especially in the upper grades. Students entering Uplift generally have similar characteristics as those currently enrolled.
When looking between the four charter management organizations, some patterns emerge. Our analysis shows that charter leavers, especially in high school, are more likely to have higher absenteeism than the current class of students. This trend across charter schools could be connected to several factors including strict school policies such as “no excuses”, or the desire by a school to maintain high achievement statistics such as graduation rates, college placements, AP/SAT scores, or other educational outcomes. Moreover, Texas funds schools based on student attendance, where higher rates of attendance generate greater revenues for any given level of enrollment [10], so schools face financial incentives to enroll students with higher prior attendance rates.

7.2. Limitations

A few limitations of our study are noteworthy. First, without direct communication with families or direct observation of district processes, we are not able to disentangle supply and demand factors. Although the study shows substantial gaps in the proportion of students with disabilities served in charter schools, we are not able to isolate a specific cause for this trend. Second, we rely on variables in administrative datasets, and are not able to consider other attributes or characteristics of students that may be related to enrollment patterns. To the extent that charter schools face incentives to enroll “lower cost” students, we may be interested in other student characteristics related to academic preparation or service needs. Finally, the study focuses on charter schools operating only within the Texas education policy framework. While this focus helps simplify the state policy context for the study, it may limit generalizability, especially to states where the charter school sector is more strictly regulated.

7.3. Future Research Directions

While our study does contribute meaningfully to an understanding of how student-level factors influence transfer patterns between TPS and charter schools, there are additional avenues of research we would recommend to enhance understanding of this issue. First, because this dataset only captures two years of student data, we do not have a complete sense of the trends of student-level transfer over the course of a student’s education. By analyzing multiple cohorts of students, studies could better understand changes in transfer patterns over time. Second, additional studies can further isolate supply and demand factors by specifically examining charter enrollment processes (e.g., [35]) or by communicating directly with families to understand educational preferences and needs (e.g., [53]).

8. Conclusions

Scholars and policymakers should continue to critically examine patterns of student transfer between educational sectors as it provides a unique insight into trends that may be closely related to policies and practices at schools. By examining the four largest charter networks in Texas we have found that while there may not be generalizable evidence of movement patterns, there is still valuable and possibly concerning trends within and among charter schools. While charter school advocates and critics may still disagree on whether “cream-skimming” or “cropping” of students occurs among charter school enrollment, our hope is that this analysis shines light on the practices of these specific, powerful, charter organizations in Texas, and provides important information on the movement of student groups who continue to need robust school support.

Author Contributions

Conceptualization, D.S.K. and J.S.; methodology, D.S.K.; data curation, J.S.; formal analysis, J.S.; writing—original draft preparation, D.S.K., C.M. and J.S.; writing—review and editing, C.M. and D.S.K.; visualization, D.S.K.; supervision, D.S.K.; project administration, C.M.; All authors have read and agreed to the published version of the manuscript.

Funding

This research received no external funding.

Data Availability Statement

Study uses restricted-use data from the University of Texas Education Rsereach Center. For more information about these data, please visit: https://texaserc.utexas.edu/.

Conflicts of Interest

The authors declare no conflict of interest.

References

  1. National Center for Education Statistics. Digest of Education Statistics, 2020: Table 105.30., Enrollment in Elementary, Secondary, and Degree-Granting Postsecondary Institutions, by Level and Control of Institution: Selected Years, 1869–1870 through Fall 2029; Washington, DC, USA. 2021. Available online: https://nces.ed.gov/programs/digest/d20/tables/dt20_105.30.asp (accessed on 1 December 2021).
  2. Baker, B.D.; Dickerson, J.L. Charter schools, teacher labor market deregulation, and teacher quality: Evidence from the schools and staffing survey. Educ. Policy 2006, 20, 752–778. [Google Scholar] [CrossRef]
  3. Mungal, A.S. Teach for America, Relay Graduate School, and the charter school networks: The making of a parallel education structure. Educ. Policy Anal. Arch. 2016, 24, 1–30. [Google Scholar] [CrossRef] [Green Version]
  4. Arsen, D.; DeLuca, T. Which districts get into financial trouble and why: Michigan’s story. J. Educ. Financ. 2016, 45, 100–126. [Google Scholar]
  5. Bruno, P. Charter competition and district finances: Evidence from California. J. Educ. Financ. 2019, 44, 361–384. [Google Scholar]
  6. Mann, B.A.; Bruno, P. The effects of charter school enrollment losses and tuition reimbursements on school districts: Lifting boats or sinking them? Educ. Policy 2022, 36, 1078–1107. [Google Scholar] [CrossRef]
  7. Kolbe, T.; Dhuey, E.; Doutre, S.M. More money is not enough: (Re) considering policy proposals to increase federal funding for special education. Am. J. Educ. 2022, 129, 1086. [Google Scholar] [CrossRef]
  8. Baker, B.D.; Corcoran, S.P. The stealth inequities of school funding: How state and local school finance systems perpetuate inequitable student spending. Cent. Am. Prog. 2012, 9, 26. [Google Scholar]
  9. Knight, D.S.; Mendoza, J. Does the measurement matter? Assessing alternate approaches to measuring state school finance equity for California’s Local Control Funding Formula. AERA Open 2019, 5, 2332858419877424. [Google Scholar] [CrossRef] [Green Version]
  10. Knight, D.S.; Toenjes, L.A. Do charter schools receive their fair share of funding? School finance equity for charter and traditional public schools. Educ. Policy Anal. Arch. 2020, 28, 51. [Google Scholar] [CrossRef] [Green Version]
  11. Kretchmar, K.; Sondel, B.; Ferrare, J.J. Mapping the terrain: Teach for America, charter school reform, and corporate sponsorship. J. Educ. Policy 2014, 29, 742–759. [Google Scholar] [CrossRef]
  12. Bergman, P.; McFarlin, I., Jr. Education for All? A Nationwide Audit Study of Schools of Choice; Working Paper; NBER: New York, NY, USA, 2018; Available online: http://www.columbia.edu/~psb2101/BergmanMcFarlin_school_choice.pdf (accessed on 1 December 2021).
  13. Dee, T.S.; Fu, H. Do charter schools skim students or drain resources? Econ. Educ. Rev. 2004, 23, 259–271. [Google Scholar] [CrossRef]
  14. Lacireno-Paquet, N.; Holyoke, T.T.; Moser, M.; Henig, J.R. Creaming versus cropping: Charter school enrollment practices in response to market incentives. Educ. Eval. Policy Anal. 2002, 24, 145–158. [Google Scholar] [CrossRef]
  15. Brighouse, H. School Choice and Social Justice; Oxford University Press: Oxford, UK, 2003. [Google Scholar]
  16. Hoxby, C.M. The Economics of School Choice; University of Chicago Press: Chicago, IL, USA, 2007. [Google Scholar]
  17. Chubb, J.E.; Moe, T.M. America’s public schools: Choice is a panacea. Brook. Rev. 1990, 8, 4–12. [Google Scholar] [CrossRef] [Green Version]
  18. Shanker, A. Restructuring our schools. Peabody J. Educ. 1988, 65, 88–100. [Google Scholar] [CrossRef]
  19. National Center for Education Statistics. Racial/ethnic Enrollment in Public Schools; National Center for Education Statistics: Washington, DC, USA, 2018. Available online: https://nces.ed.gov/programs/coe/indicator/cge (accessed on 1 December 2021).
  20. Archibald, D.A. School choice, magnet schools, and the liberation model: An empirical study. Sociol. Educ. 2004, 77, 283. [Google Scholar] [CrossRef]
  21. Buckley, J.; Schneider, M. Charter Schools: Hope or Hype? Princeton University Press: Princeton, NJ, USA, 2009. [Google Scholar]
  22. Bifulco, R.; Ladd, H. The impacts of charter schools on student achievement: Evidence from North Carolina. Educ. Financ. Policy 2006, 1, 50–90. [Google Scholar] [CrossRef]
  23. Buckley, J.; Schneider, M. Are charter school students harder to educate? Evidence from Washington, D.C. Educ. Eval. Policy Anal. 2005, 27, 365–380. [Google Scholar] [CrossRef] [Green Version]
  24. Gleason, P.; Clark, M.; Tuttle, C.C.; Dwoyer, E. The Evaluation of Charter School Impacts: Final Report; National Center on Education and the Economy: Washington, DC, USA, 2010. [Google Scholar]
  25. Knight, D.S.; Hassairi, N.; Martínez, D. Segregation and school funding disparities in California: Contemporary trends 50 years after Serrano. BYU Educ. Law J. 2022, 2022, 83–111. [Google Scholar]
  26. Waitoller, F.R.; Maggin, D.M.; Trzaska, A. A Longitudinal Comparison of Enrollment Patterns of Students Receiving Special Education in Urban Neighborhood and Charter Schools. J. Disabil. Policy Stud. 2017, 28, 3–12. [Google Scholar] [CrossRef]
  27. Garcy, A.M. High expense: Disability severity and charter school attendance in Arizona. Educ. Policy Anal. Arch. 2011, 19, 1–26. [Google Scholar] [CrossRef] [Green Version]
  28. Chaikind, S.; Danielson, L.C.; Brauen, M.L. What do we know about the costs of special education? A selected review. J. Spec. Educ. 1993, 26, 344–370. [Google Scholar] [CrossRef]
  29. Chambers, J.G.; Perez, M.; Harr, J.J.; Shkolnik, J.; Esra, P. Special education spending estimates from 1969–2000. J. Spec. Educ. Leadersh. 2005, 18, 5–13. [Google Scholar]
  30. McMorris, C.; Knight, D.S. How states prioritize educational needs: Assessing the distribution of the Governor’s Emergency Education Relief Fund. J. Educ. 2022, 48, 5–33. [Google Scholar]
  31. Parrish, T.; Esra, P. The Special Education Expenditure Project (SEEP): Synthesis of findings and policy implications. In Forum, Project Forum; National Association of State Directors of Special Education: Alexandria, VA, USA, 2006; Available online: https://nasdse.org/docs/217_d5fd28bb-dd1f-4b11-abb5-cbdd9e7e1583.pdf (accessed on 1 December 2021).
  32. Knight, D.S.; Hassairi, N.; Candelaria, C.; Sun, M.; Plecki, M. Prioritizing school finance equity during an economic downturn: Recommendations for state policymakers. Educ. Financ. Policy 2022, 17, 188–199. [Google Scholar] [CrossRef]
  33. Winters, M.A. Why the Gap? Special Education and New York City Charter Schools; Manhattan Institute for Policy Research, Center for Reinventing Public Education: New York, NY, USA, 2013. [Google Scholar]
  34. Winters, M.A. Understanding the gap in special education enrollments between charter and traditional public schools: Evidence from Denver, Colorado. Educ. Res. 2015, 44, 228–236. [Google Scholar] [CrossRef]
  35. Gilmour, A.; Shanks, C.; Winters, M.A. The Effect of Charter Schooling on Student Mobility and Classification Status; Working Paper 2021-6; Wheelock Educational Policy Center, Boston University: Boston, MA, USA, 2021. [Google Scholar]
  36. Rhim, L.M.; Ahearn, E.; Lange, C.M.; McLaughlin, M.J. Survey of Charter School Authorizers; Report No. 6; Institute for the Study of Exceptional Children and Youth: College Park, MD, USA, 2007. [Google Scholar]
  37. West, A.; Ingram, D.; Hind, A. “Skimming the cream”: Admissions to charter schools in the United States and to autonomous schools in England. Educ. Policy 2006, 20, 615–639. [Google Scholar] [CrossRef]
  38. Altonji, J.G.; Huang, C.I.; Taber, C.R. Estimating the cream skimming effect of school choice. J. Political Econ. 2015, 123, 266–324. [Google Scholar] [CrossRef]
  39. Cordes, S.A. NEPC Review: New York Charter Schools Outperform Traditional Selective Public Schools: More Evidence That Cream-Skimming is Not Driving Charters’ Success. Natl. Educ. Policy Cent. 2017, 5, 11. Available online: https://files.eric.ed.gov/fulltext/ED579511.pdf (accessed on 1 December 2021).
  40. Zimmer, R.W.; Guarino, C.M. Is there empirical evidence that charter schools “push out” low-performing students? Educ. Eval. Policy Anal. 2013, 35, 461–480. [Google Scholar] [CrossRef]
  41. Winters, M.A. New York charter schools outperform traditional selective public schools: More evidence that cream-skimming is not driving charters’ success. Manhattan Inst. Policy Res. 2017, 16, 579166. Available online: https://www.manhattan-institute.org/html/new-york-charter-schools-outperformtraditional-selective-public-schools-10128.html (accessed on 1 December 2021).
  42. Anderson, K.P. Evidence on charter school practices related to student enrollment and retention. J. Sch. Choice 2017, 11, 527–545. [Google Scholar] [CrossRef]
  43. Texas Education Agency. “Enrollment in Texas Public Schools 2019–20.” Division of Research and Analysis, Office of Governance and Accountability. Available online: https://tea.texas.gov/sites/default/files/enroll_2019–20.pdf (accessed on 1 December 2021).
  44. Booker, K.; Gilpatric, S.M.; Gronberg, T.; Jansen, D. The effect of charter schools on traditional public school students in Texas: Are children who stay behind left behind? J. Urban Econ. 2008, 64, 123–145. [Google Scholar] [CrossRef]
  45. Estes, M.B. Choice for all? Charter schools and students with special needs. J. Spec. Educ. 2004, 37, 257–267. [Google Scholar] [CrossRef] [Green Version]
  46. Booker, K.; Zimmer, R.; Buddin, R. The effect of charter schools on school peer composition. RAND Work. Pap. 2005, 2, 1–38. Available online: http://www.rand.org/pubs/working_papers/WR306.html (accessed on 1 December 2021).
  47. Zimmer, R.; Gill, B.; Booker, K.; Lavertu, S.; Sass, T.R.; Witte, J. Charter Schools in Eight States: Effects on Achievement, Attainment, Integration, and Competition; Rand Corporation: Santa Monica, CA, USA, 2009; Available online: http://www.rand.org/pubs/monographs/MG869.html (accessed on 1 December 2021).
  48. Nichols-Barrer, I.; Gleason, P.; Gill, B.; Tuttle, C.C. Student selection, attrition, and replacement in KIPP middle schools. Educ. Eval. Policy Anal. 2016, 38, 5–20. [Google Scholar] [CrossRef] [Green Version]
  49. Angrist, J.D.; Dynarski, S.M.; Kane, T.J.; Pathak, P.A.; Walters, C.R. Who benefits from KIPP? J. Policy Anal. Manag. 2012, 31, 837–860. [Google Scholar] [CrossRef] [Green Version]
  50. Gleason, P.; Tuttle, C.; Gill, B.; Nichols-Barrer, I.; Teh, B. Do KIPP schools boost student achievement? Educ. Financ. Policy 2014, 9, 36–58. [Google Scholar] [CrossRef]
  51. Knight, D.S.; Karcher, H.; Hoang, T. School finance equity through accountability? Exploring the role of federal oversight of school districts under the Every Student Succeeds Act. Peabody J. Educ. 2022, 97, 458–478. [Google Scholar] [CrossRef]
  52. Baude, P.L.; Casey, M.; Hanushek, E.A.; Phelan, G.R.; Rivkin, S.G. The evolution of charter school quality. Economica 2020, 87, 158–189. [Google Scholar] [CrossRef]
  53. Nickson, D. Embracing the city: Black Families’ place attachments and (Re) imaginings of the city and suburb in search of educational opportunity. AERA Open 2022, 8, 1–14. [Google Scholar] [CrossRef]
Figure 1. Percent of students in special education by grade and charter district, 2016-17. Panel (A) Special education enrollment rates by grade. Panel (B) Special education enrollment gaps between charter and TPS districts by grade. Note. Other category includes all charter school districts with enrollment below 5000 in 2016–17 (see Table 1). Grade 5 is labeled for reference. TPS = traditional public school.
Education 12 00915 g001
Figure 2. Percent of students in special education in 2016-17, by charter and next year school location. Panel (A) KIPP. Panel (B) Harmony. Panel (C) IDEA. Panel (D) Uplift. Panel (E) Other charter networks.
Education 12 00915 g002aEducation 12 00915 g002b
Figure 3. Average prior math achievement (standardized), by grade and charter district, 2016–17. Note. Grade 3 is labeled for clarity. Scores are standardized to a mean of zero. For example, KIPP students in grades 3 and 4 have above average math test scores, but KIPP students in grades 5 to 8 have lower math test scores.
Education 12 00915 g003
Figure 4. Average standardized math test score achievement, by charter district and next year school location, 2016–17. Panel (A) KIPP. Panel (B) Harmony. Panel (C) IDEA. Panel (D) Uplift. Panel (E) Other charter networks.
Education 12 00915 g004aEducation 12 00915 g004b
Figure 5. Average rate of absenteeism, by grade and charter district, 2016–17.
Education 12 00915 g005
Figure 6. Average rate of absenteeism in 2016–17, by grade, charter district, and next year school location. Panel (A) KIPP. Panel (B) Harmony. Panel (C) IDEA. Panel (D) Uplift. Panel (E) Other charter networks.
Education 12 00915 g006aEducation 12 00915 g006b
Table 1. Enrollment by charter school district, 2016–17 and 2017–18.
2016–17 School Year2017–18 Enrollment% Incr. from 2016–17
DistrictsSchoolsEnrollmentPercent of All Charters
A. Charter districts
Harmony74631,98511.7%33,2483.9%
IDEA14429,33410.8%35,59521.3%
KIPP44123,2798.5%25,1548.1%
Uplift12915,7685.8%17,2919.7%
Sub Total (largest four charters)13160100,36636.8%111,28810.9%
All other charters167469172,31963.2%184,9257.3%
Sub Total (largest four + all other charters)180629272,685100.0%296,2138.6%
B. Traditional public school (TPS) districts
All TPS districts102380825,071,149 5,088,7990.3%
Total121691805,343,834 5,385,0120.8%
Note. Total charter school enrollment for 2016–17 and 2017–18 is 272,685 and 296,213, respectively, which represents 4.7% and 5.1% of all students, although the percent of students in charter schools is much higher in some urban areas.
Publisher’s Note: MDPI stays neutral with regard to jurisdictional claims in published maps and institutional affiliations.

