1. Introduction
Most instructors—whether in online classes, large lectures, or facing students increasingly distracted by electronic devices—are interested in better engaging their students in order to help them learn. Keeping students engaged was the number one challenge instructors faced while teaching during the global pandemic, according to a 2020 national survey of college faculties [
1].
Yet engaging students can be difficult. Years of academic research have demonstrated that engaging students results in learning gains and improved academic success [
2,
3], but recommendations for how to engage students are often resource intensive. We know that increased personal contact from faculty members can make a big difference for students, e.g., as described in [
4,
5], but, with class sizes growing [
6,
7], more faculties than ever holding contingent status [
8], and increasing demands for research and service [
9,
10], faculty members often feel stretched thin. Trying to follow recommended practices for personal connection, detailed feedback, and rapport building, among other recommendations in the literature, can seem impossible under such circumstances.
To address these challenges, the goal of this study is to describe and evaluate the effectiveness of a series of collaborative assignments. We designed these assignments to engage students and foster rapport between the students and the instructor even in large classes. We evaluate the efficacy of these assignments using student feedback in four different college courses. These assignments sought to engage students as active participants in data-centric research projects that were bigger than just their contributions. As they contributed to a larger project, they received an individualized report on their input, providing substantive feedback, as well as a signal of each student’s value and importance. These assignments were intended to engage students in their own learning, to give them personal feedback, and to build high-rapport relationships with them. Survey evidence from the courses where the assignments were used demonstrated that students reported that they learned more and found the assignments more enjoyable compared to a typical college assignment. The students also reported that receiving individualized feedback about their contributions made them more interested in the material and made them feel like the instructor was more invested in their learning. These results indicate that the assignments succeeded at both engaging students and at building rapport.
We used R [
11], a statistical software program, to aggregate the students’ data and produce the personalized student reports, but other software applications with a merge feature could accomplish the same goal. Different instructors will likely want to use different software depending on their personal preference and as the most appropriate software applications change over time. The assignment specifics and the software we used are included in the
Supporting Information (SI) so that interested instructors can borrow what they may find useful and adapt our assignments for their own courses.
2. How to Engage Students?
The literature on engaging students in learning is incredibly extensive; for one helpful synthesis, see [
12]. For decades, instructors have known that simply lecturing at passive students is not the best way to facilitate learning [
3,
13,
14]. Teaching and learning journals are filled with creative ideas for getting students to actively participate in their own learning, many with evidence that doing so leads to better outcomes [
15,
16,
17]. For instance, research on flipped classrooms shows that students self-report improvements in learning and tend to enjoy classroom activities over lectures [
18,
19,
20]. Scholars who advocate for project-based learning argue that it engages students’ senses in multiple ways [
21], improving active learning and even the amount of time students spend studying [
22].
Others suggest that students need interactive tools to best engage during class. Sometimes these tools come in the form of response pads, clickers, or smartphones to provide real-time feedback during the class [
23,
24]. However, students tend to be skeptical of these tools because of their additional cost [
25], and limited questions may mean the engagement is somewhat superficial.
Enjoyment and engagement are often linked in literature—the more students enjoy an assignment or learning activity, the more engaged they become [
26]. Gamification literature helps instructors think through ways to turn assignments, activities, and even discussions into games where students earn points, compete against each other, and identify winners, thus, increasing their enjoyment and engagement [
27]. The more students enjoy classes, the more likely they are to retain information and learn [
28].
Another large body of literature examines the value of building rapport in the classroom, which has many benefits for students, including increased engagement [
29,
30]. The community of inquiry model [
31], for instance, emphasizes the importance of instructor and student presence in creating a community in the classroom. Research by Jaggars and Xu [
32] found that, when professors build rapport with their students by demonstrating that they care about their success, students put more effort into their work for the class and end up doing better academically (p. 280). Glazier [
30] quotes a student who said, “the professor was so involved and he made the subject fun…because he cared, I cared” (p. 71). Increased engagement is just one of the benefits of high-rapport relationships between faculty and students [
33]. When students are in high-rapport classes, they are more likely to stay enrolled, earn higher grades, and graduate [
32,
34].
Related to the rapport-building literature is research that specifically focuses on the value of providing students with personalized feedback. Providing students with useful and relevant assignment feedback improves retention and success, helps students to gauge their standing and needed effort in the class, and can engage students more deeply in the material [
35]. Plus, students really appreciate getting specific and helpful feedback from professors [
36,
37,
38,
39]; they especially value feedback that is clear, personal, and positive [
40]. Only about 6% of students say that receiving just the grade on an assignment is good enough—the vast majority want more detailed feedback [
41]. Most students do access the feedback their professors’ provide [
40], including electronic feedback [
42], although they do not access feedback as often when it is provided through a learning management system (LMS) [
43]. However, providing personalized feedback is often resource intensive and cost prohibitive, especially in large classes [
44].
3. A Resource-Effective Method for Engaging Students and Building Rapport
The decision of which method to pursue to engage students in learning partly comes down to personal preference. Some instructors may be more comfortable with recording videos and flipping their classrooms. Others may have experience with problem-based learning and decide to stick with that. However, this decision depends not only on preferences, but also resources—both time and expertise. Giving students detailed feedback on their essays, building personal relationships with every student in a large lecture, or writing interactive simulations specific to the content of each course take a major investment of time. Indeed, most of the studies on techniques that improve student engagement, such as simulations and undergraduate research, are carried out on classes with 40 students or fewer (Ishiyama 2013). Here, we propose a resource-effective and scalable method for engaging students, with the added benefit of also building rapport with them. We provide both the assignment details and software coding information in the
Supporting Information to reduce the start-up costs of implementing this method. The software code makes it possible to provide personalized feedback to students, making them feel seen and valued in the class. Though creating the assignment takes considerable time, once it is ready, it takes no more time to provide a personalized report to one student than to provide personalized reports to hundreds of students. In other words, the assignments are
scalable, allowing an instructor to provide individualized feedback to every student—even in the largest classes. Moreover, after a project has been created, it generates timely course material each semester automatically. Of course, instructors should reflect each semester to determine whether any revisions could improve the assignment for future classes.
In the following sections, we describe the broad structure of the collaborative data-based projects and provide three specific assignment examples. We then describe the data collected from the students in four classes and present evidence of the effectiveness of the method for improving students’ self-reported learning, enjoyment, interest, and view of the instructor.
4. Description of the Data Projects
The possibilities for collaborative data projects are nearly endless, limited only by the instructor’s creativity and the course content. The data projects we describe here were used in three different courses: Media & Politics, Research Methods, and Social Influence in Political Behavior. Although these are courses in the social sciences (political science, specifically), collaborative data projects could be a good fit for courses in any number of disciplines.
Since the most useful software and programs for gathering data for the projects and generating feedback for students vary by instructor expertise and preference, and will undoubtedly change in the future, we focus here on the general structure of the projects rather than the resources we used to create them. For those who are interested, we discuss the resources we find most helpful in our own workflow in
SI-3.
Though the details vary, such projects generally proceed in three steps:
Gather Data: Students enter data, which may represent responses to survey questions, attempted solutions to problems, or results from activities conducted outside of the classroom. The students submit their data through an online form, such as a Google Form, or a website set up by the instructor. By collecting and entering data, the students contribute to a broader project in which the entire class is participating;
Aggregate Results: The instructor analyzes and summarizes the data entered by the students. These data then serve as the basis for a class discussion or video lecture. The instructor can use the data to illustrate important course concepts and refer back to the project throughout the class. Because the course material draws on students’ contributions, it is more likely to seem personally relevant to students [
45], and the students should feel more qualified to contribute to discussion, share their experiences, and recognize sources of confusion;
Provide Personalized Reports: The instructor sends a personalized report to each student, comparing an individual student’s data to class-wide summary statistics. These reports help students to see how their own experiences align or diverge from other students in the class. Since the reports are generated programmatically, they can be easily personalized for each student. This personalization can be as simple as addressing the student by their first name, which can build rapport and connection. It matters to students that their professors know their names; it makes them feel valued and seen when they do [
46], and when students feel like the instructor knows and cares about them, they are more likely to put more effort into their work for the class. The personalization can also be more targeted or conditional. For instance, in classes with objectively correct solutions to prompts, the reports can provide each student with feedback about what they did well and where they need additional practice.
We typically grade these assignments on a pass/fail basis, giving full credit to all students who follow the instructions. This grading scheme allows us to use the projects as a low-stakes opportunity for students to engage with the material and receive feedback. Alternatively, instructors can grade based on the amount of work performed or, for classes with objectively correct answers, the accuracy of the data the students enter. Even when grading on a pass/fail basis, we provide partial credit when students follow some, but not all, of the instructions. For an example, see the instructions in
SI 2.1.2.
5. Examples
This framework can provide students with first-hand experience across a wide range of topics. We discuss four examples we used in our own classes. For more information about each assignment, see the
Supporting Information, which includes the full survey batteries (
SI-1) and instructions (
SI-2) for each example.
5.1. Media & Politics
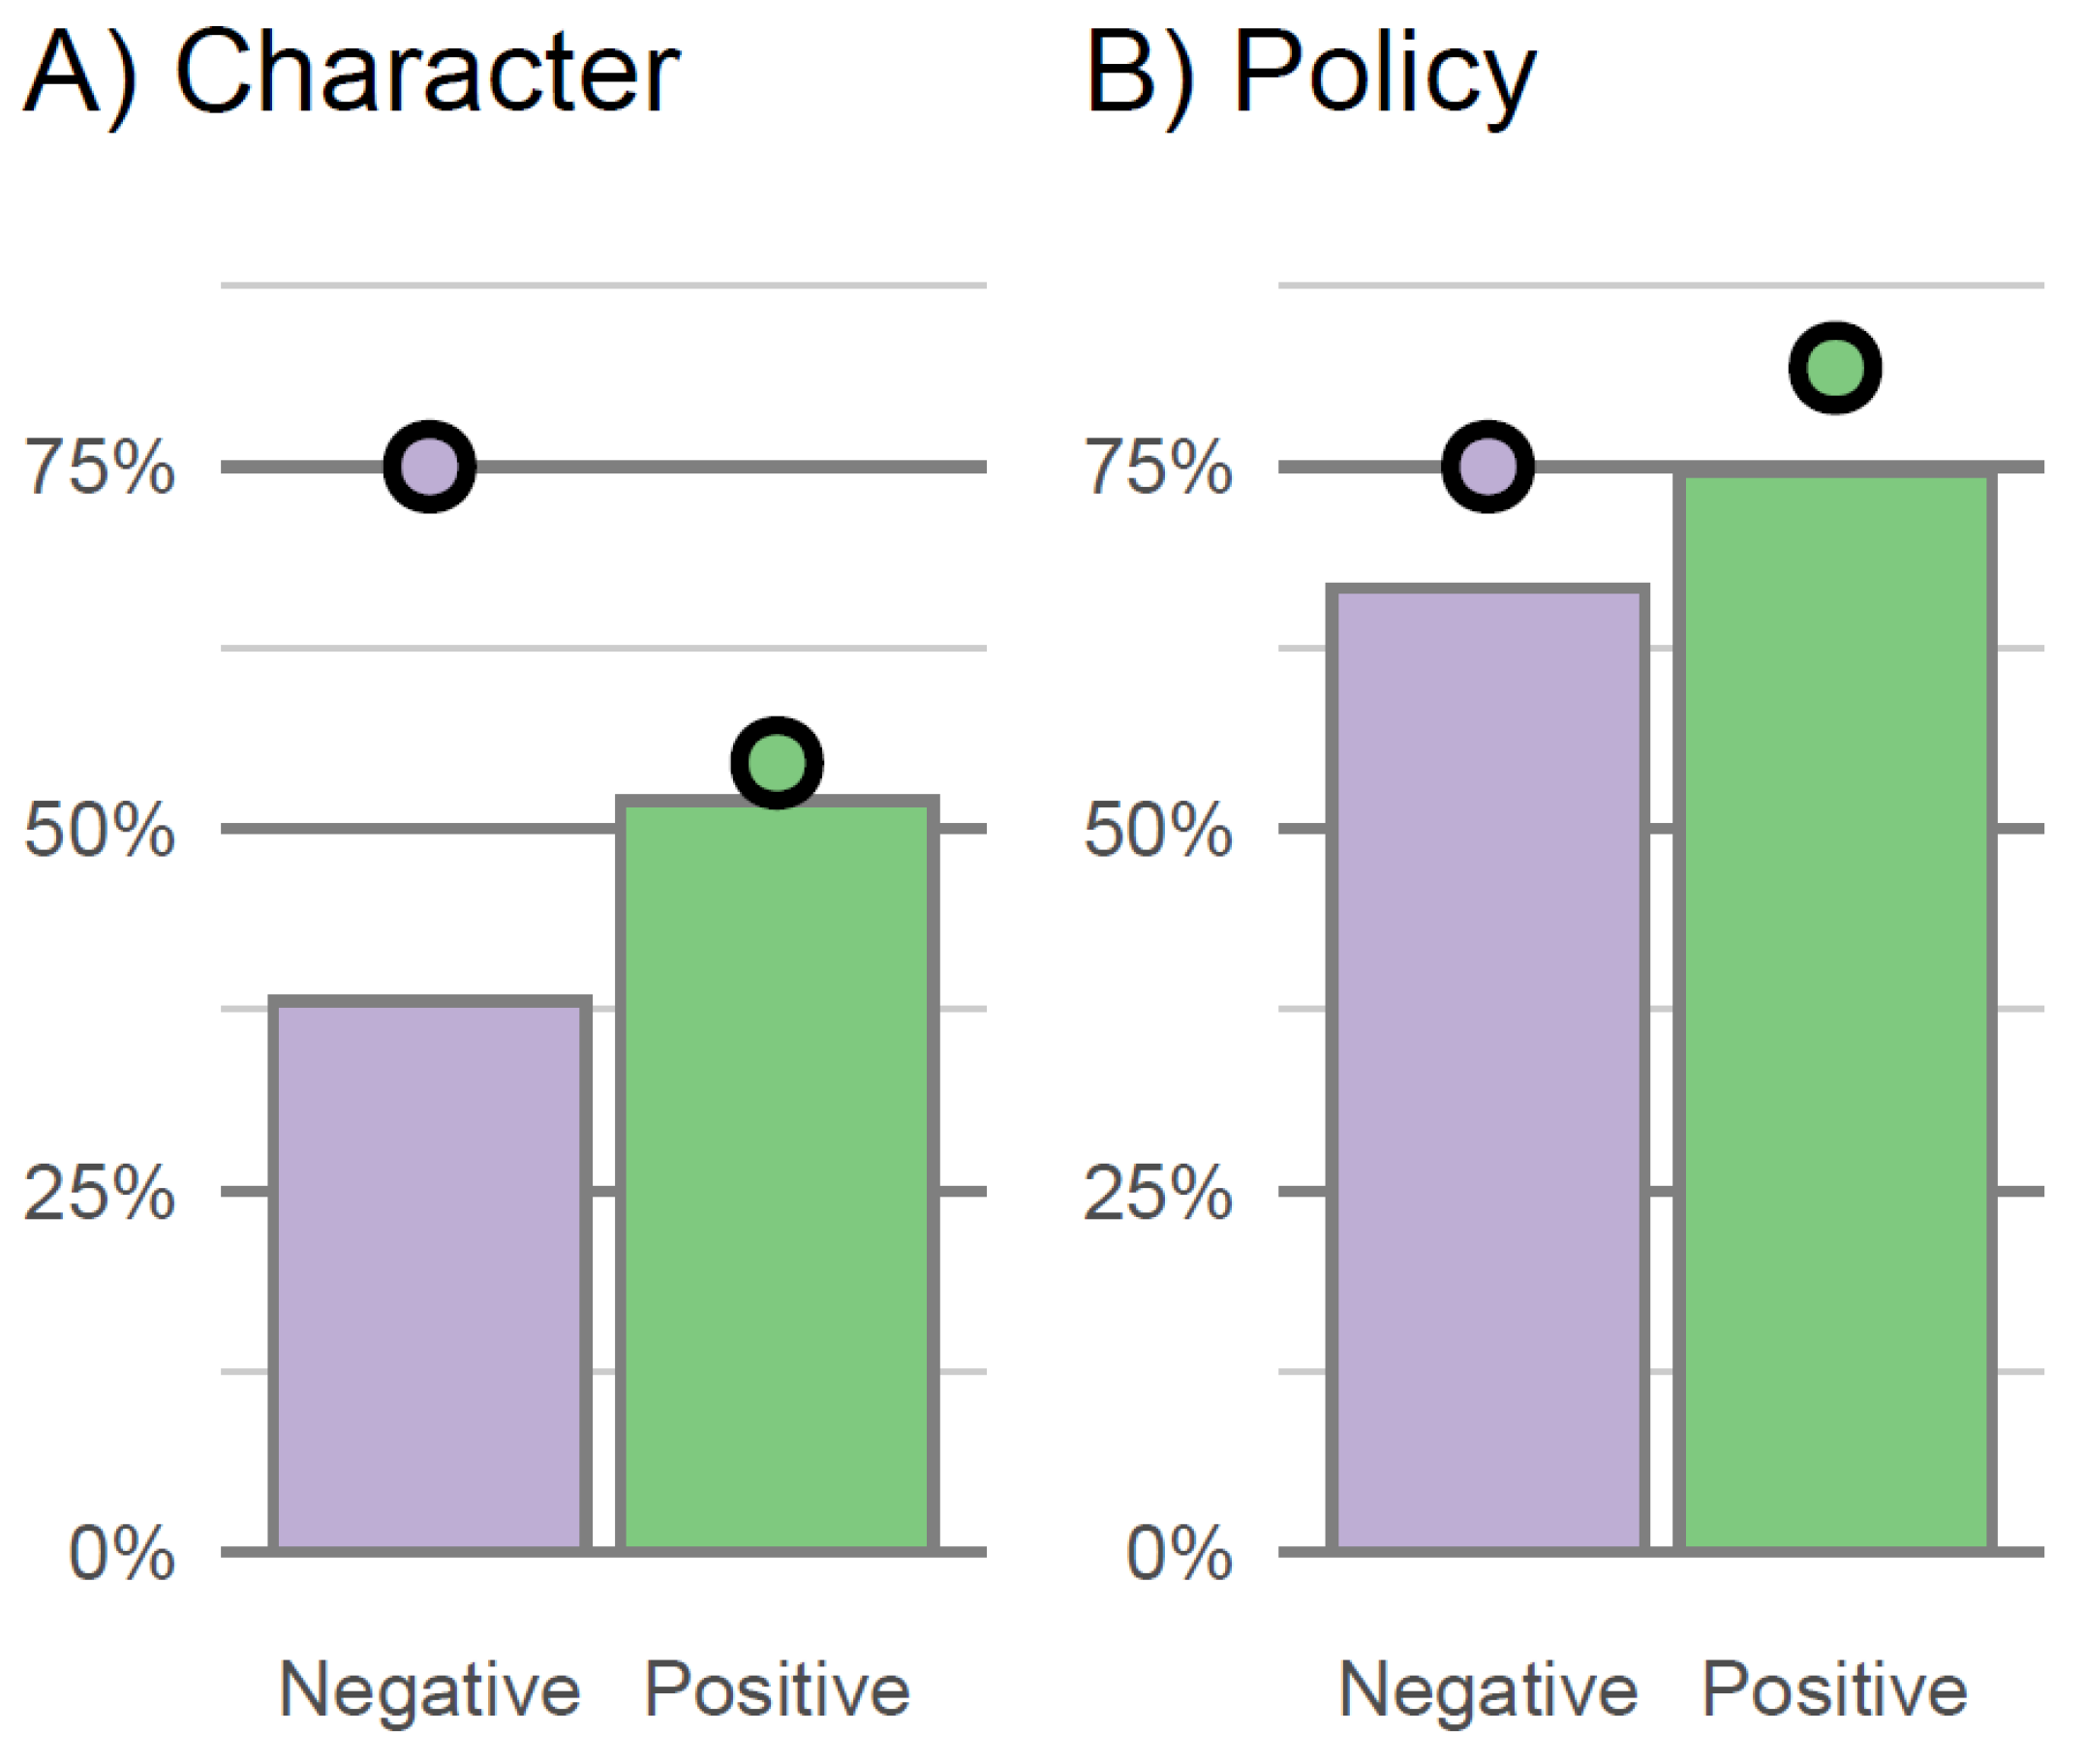
The Ads Project is designed to illuminate the assigned book, “In Defense of Negativity” (Geer 2006), which examines the content of televised political campaign ads. For the project, the three steps above feature the following details:
Gather Data: While reading the book, students use a modified version of Geer’s codebook to analyze the content of political ads from recent campaigns. Geer argues that negative ads (those attacking the opponent) are more useful for voters than positive ads (those promoting the focal candidate) because they focus more on policy and provide more evidence for their claims. In their analysis, students evaluate these claims using advertisements drawn from a recent presidential election. In the most recent version of the project, students are randomly assigned 15 advertisements from the most recent presidential election (selected from those archived at
http://www.livingroomcandidate.org, accessed on 16 November 2022). The random assignment provides a large number of students with the opportunity to evaluate each advertisement without overloading the students with too much repetitive work. For each advertisement they examine, the students rate attention to policy, amount of evidence provided, and other features of the ad;
Aggregate Results: After entering their data, the students and instructor spend a class period discussing the results and comparing what the class found, on average, to what Geer found in his original analysis. The aggregated results act as a springboard to discuss the strengths and limitations of Geer’s study, how US politics has changed since the book was released, and how Geer’s theory might be extended to accommodate those changes;
Provide Personalized Reports: Each student receives a report comparing their ratings to the rest of the class.
Figure 1 shows an example of a plot included in one student’s report. The plot allows the student to compare their average rating to the class’s averages. Similar plots are included in the report, showing how enjoyable and informative they rated the ads to be.
In addition to the Ads Project, the Media & Politics students also conducted a similar News Project.
5.2. News Project
Gather Data: On four consecutive days, students read three articles from two different news sites, entering information about the content of each article. Students select their two sources from a pre-determined list of options to ensure that each source receives enough students to provide useful source-level averages. Students choose the three most prominent news articles at each source based on their own judgement. For details, see the instructions in
SI 2.1.2;
Aggregate Results: By combining many students together, we can compare the average perception students had about articles at different news sources. For instance, we can examine which sources students perceived to be the most informative or which sources exhibited the greatest liberal bias and the greatest conservative bias. We can also examine article-level relationships such as the correlation between article length and perceived ideological bias;
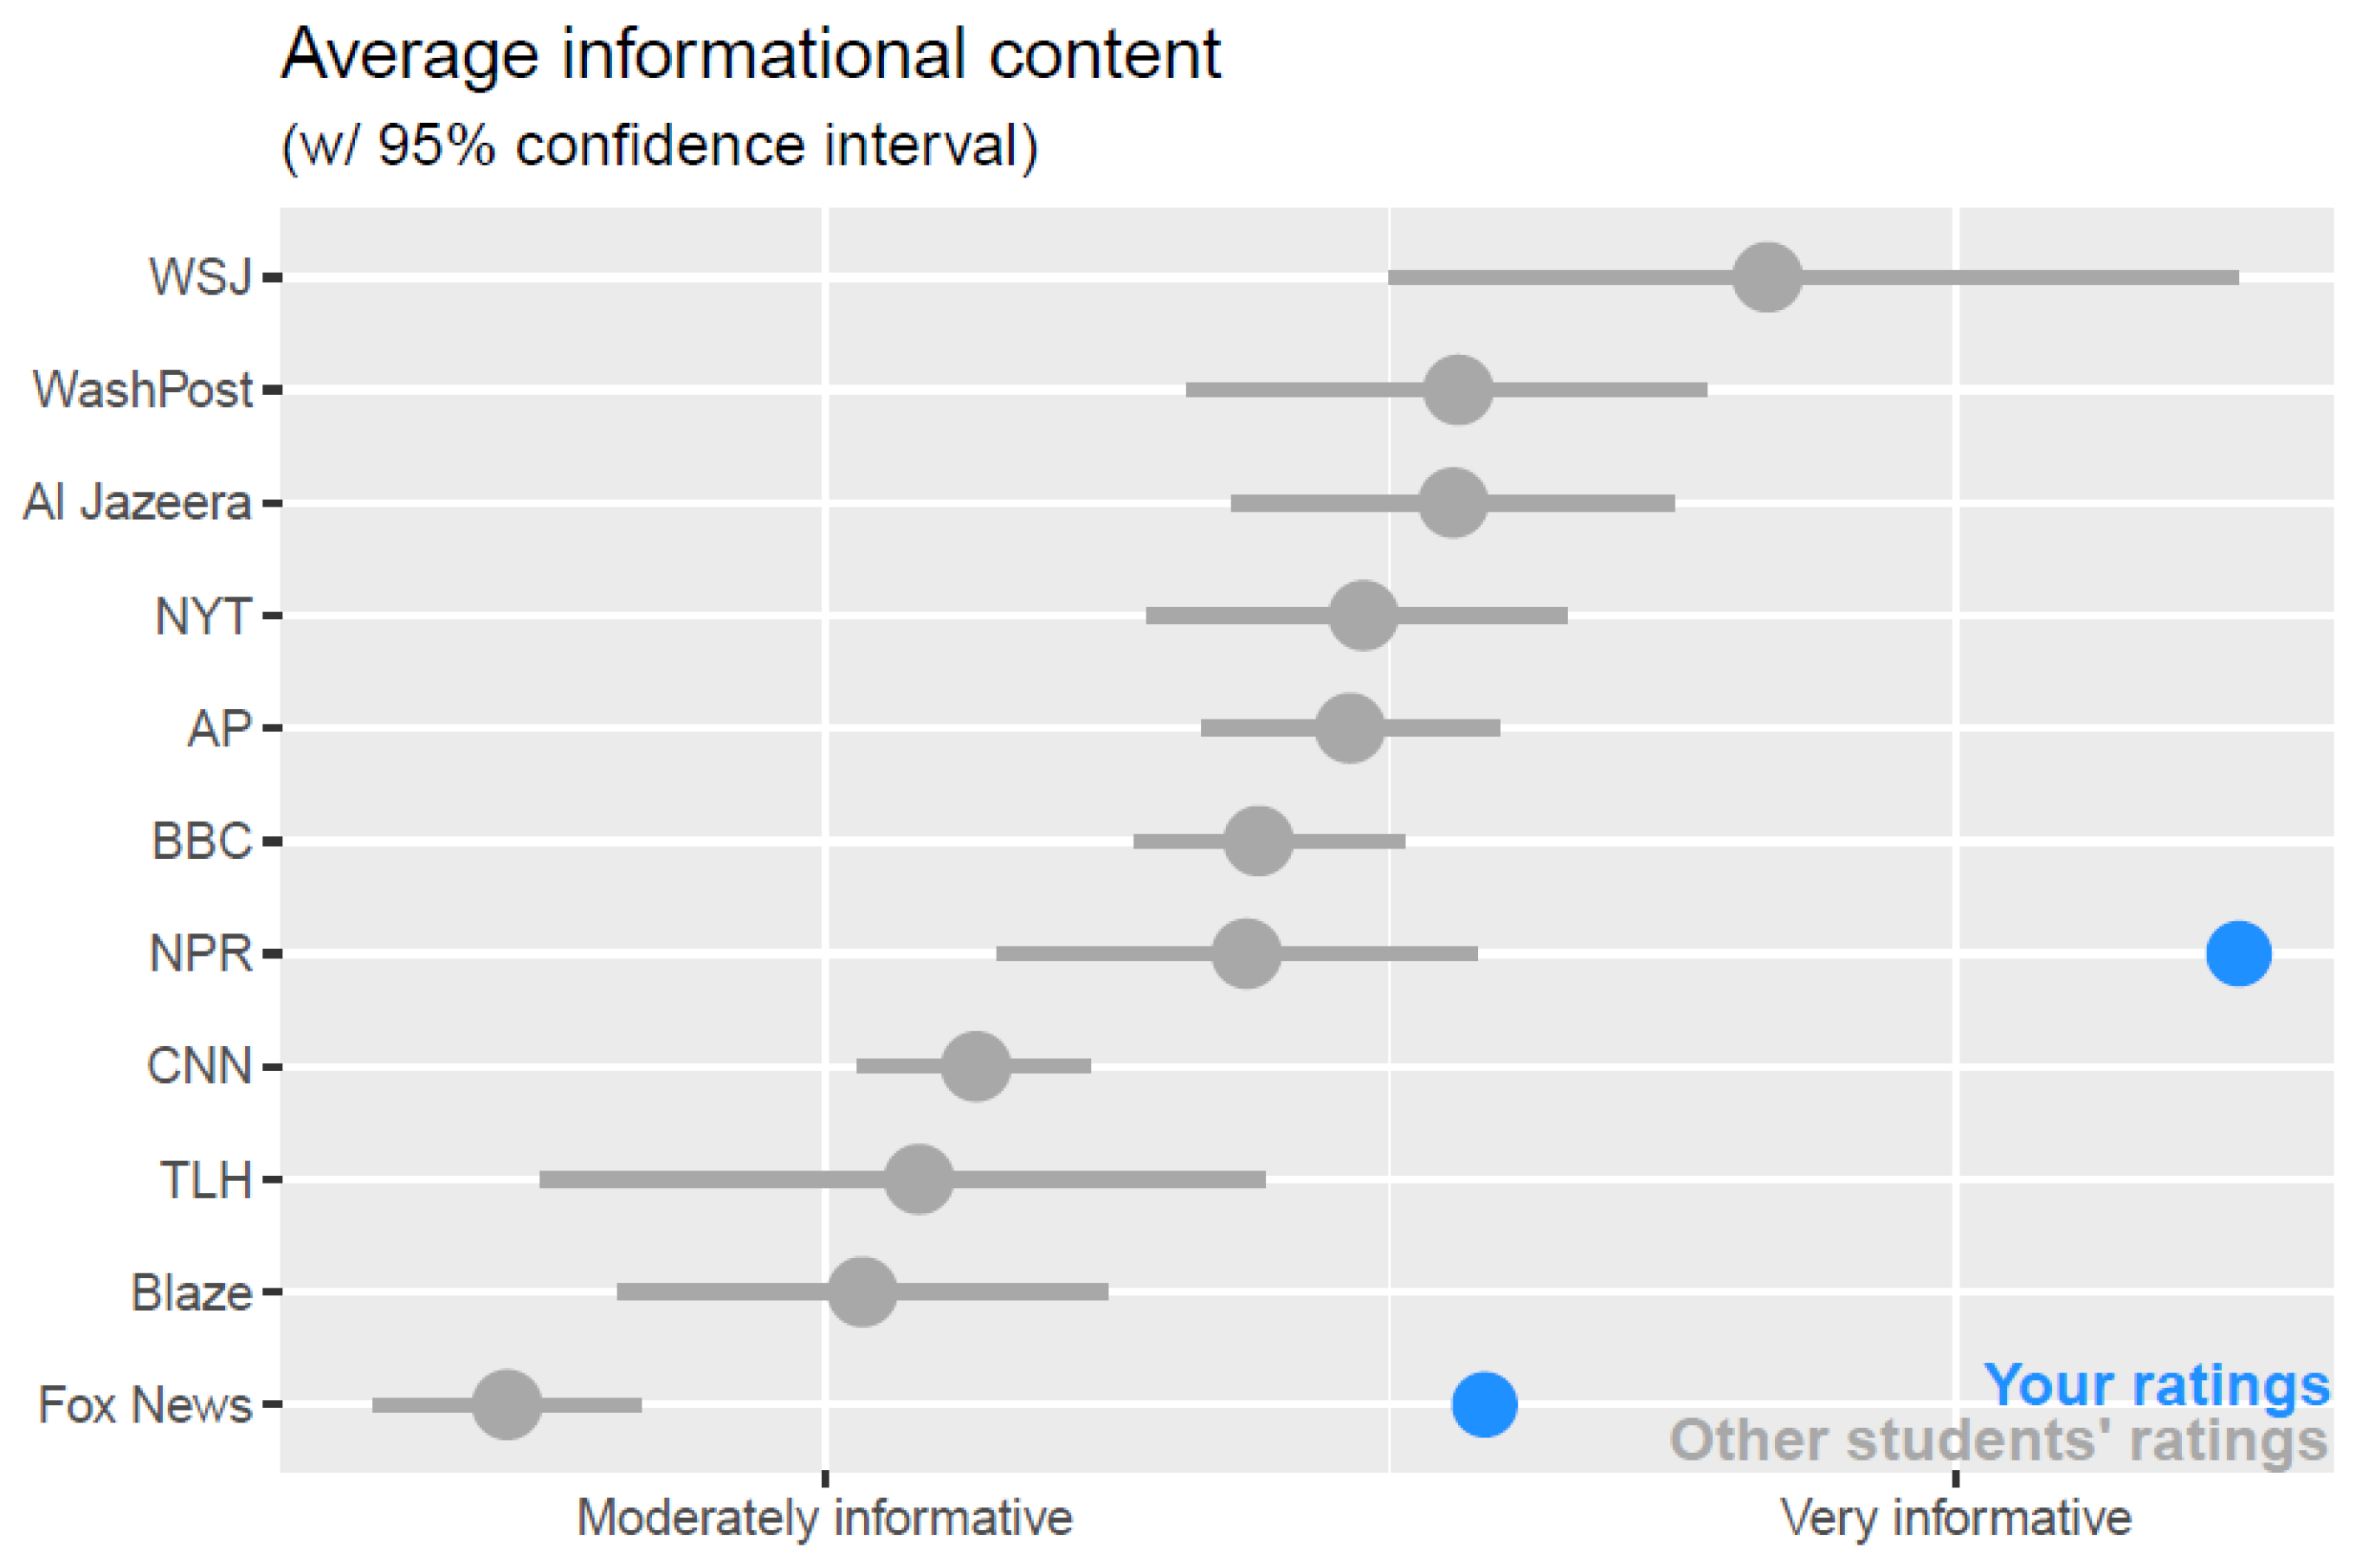
Provide Personalized Reports: The personalized reports allow a student to compare how they perceived a source to how other students in the class perceived the same source. For example,
Figure 2 shows a plot from one student’s personalized report. The student receiving the report can see that they tend to rate both NPR and Fox News as more informative than did their peers. They may use this information to reflect on whether they have different standards than their peers regarding how much information an article
should contain, or they may consider the possibility that students examined different articles on different days, and, thus, the news cycle’s fluctuations might account for the differences in perception. These and other possibilities can then serve as fodder for subsequent class discussion. For students who choose to disclose their partisan identity, the reports break down how the student compares to other students who share their partisan identity and how they compare to students who support the opposing party. This exercise provides students with first-hand experience of course concepts, such as the
hostile media effect, which reflects people’s tendency to perceive the news media as biased against their own views [
47]. By comparing perceptions of bias for each outlet and each party, the reports offer an objective evaluation of the class’s tendency to exhibit this effect and offer each student the ability to examine their own biases.
5.3. Social Influence
This class examines the interdependence of human behavior and, therefore, relies heavily on terms from social network analysis. Since these terms are often new to students, the Network Analysis Project is intended to help students see how the course concepts apply to their daily lives:
Gather Data: Students enter data about who they interact with in different social contexts. These contexts include the last people they spoke with, those they would seek to borrow a large sum of money from, and those who they would seek for career advice. See
SI 1.2.5-8 for the full set of survey items;
Aggregate Results: The instructor combines the data to show the “typical” social networks the students are embedded in. With these real-world networks, the instructor can provide relevant examples of network analysis concepts such as centrality, transitivity, and community detection. As the semester progresses, the data can be used to introduce new concepts;
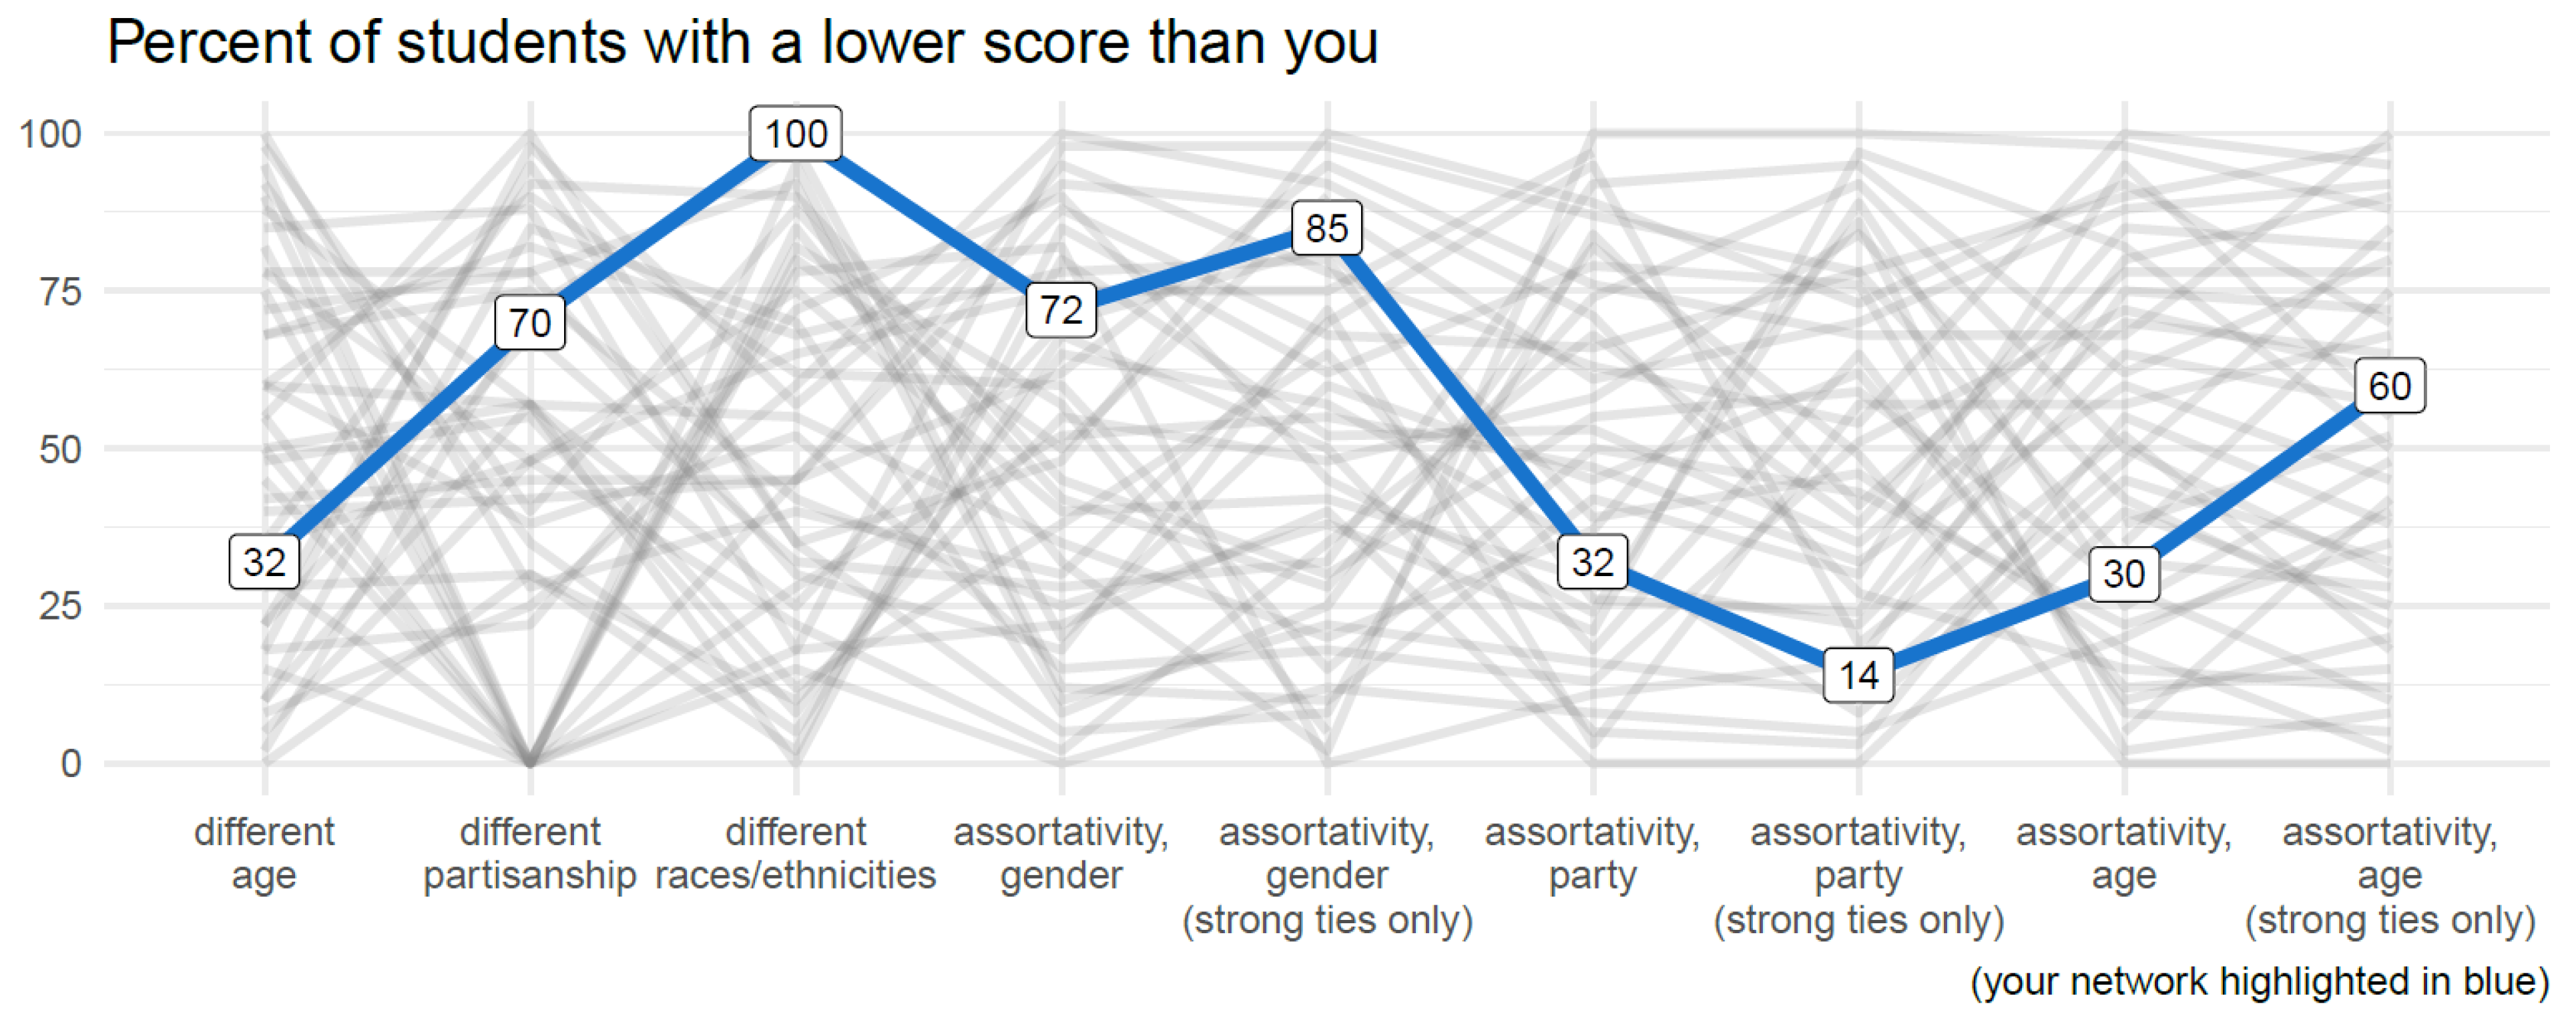
Provide Personalized Reports: The report shows how each member of the student’s social network compares in terms of their network centrality (see
Figure 3). Likewise, the report shows how each student’s social network to the networks of the other students in the class based on various network properties such as the tendency to interact with others who are similar in age, education, political preferences, or other traits. Thus, the student receiving the personalized report containing
Figure 3 can see not only data on their own networks, but also that their network is more racially and ethnically diverse than anyone else’s in the class, while being significantly more homogenous in terms of age than the networks of others in the class.
5.4. Research Methods
Following Dyck and Gee [
48], we used M&Ms to teach students about samples, populations, and statistical inference:
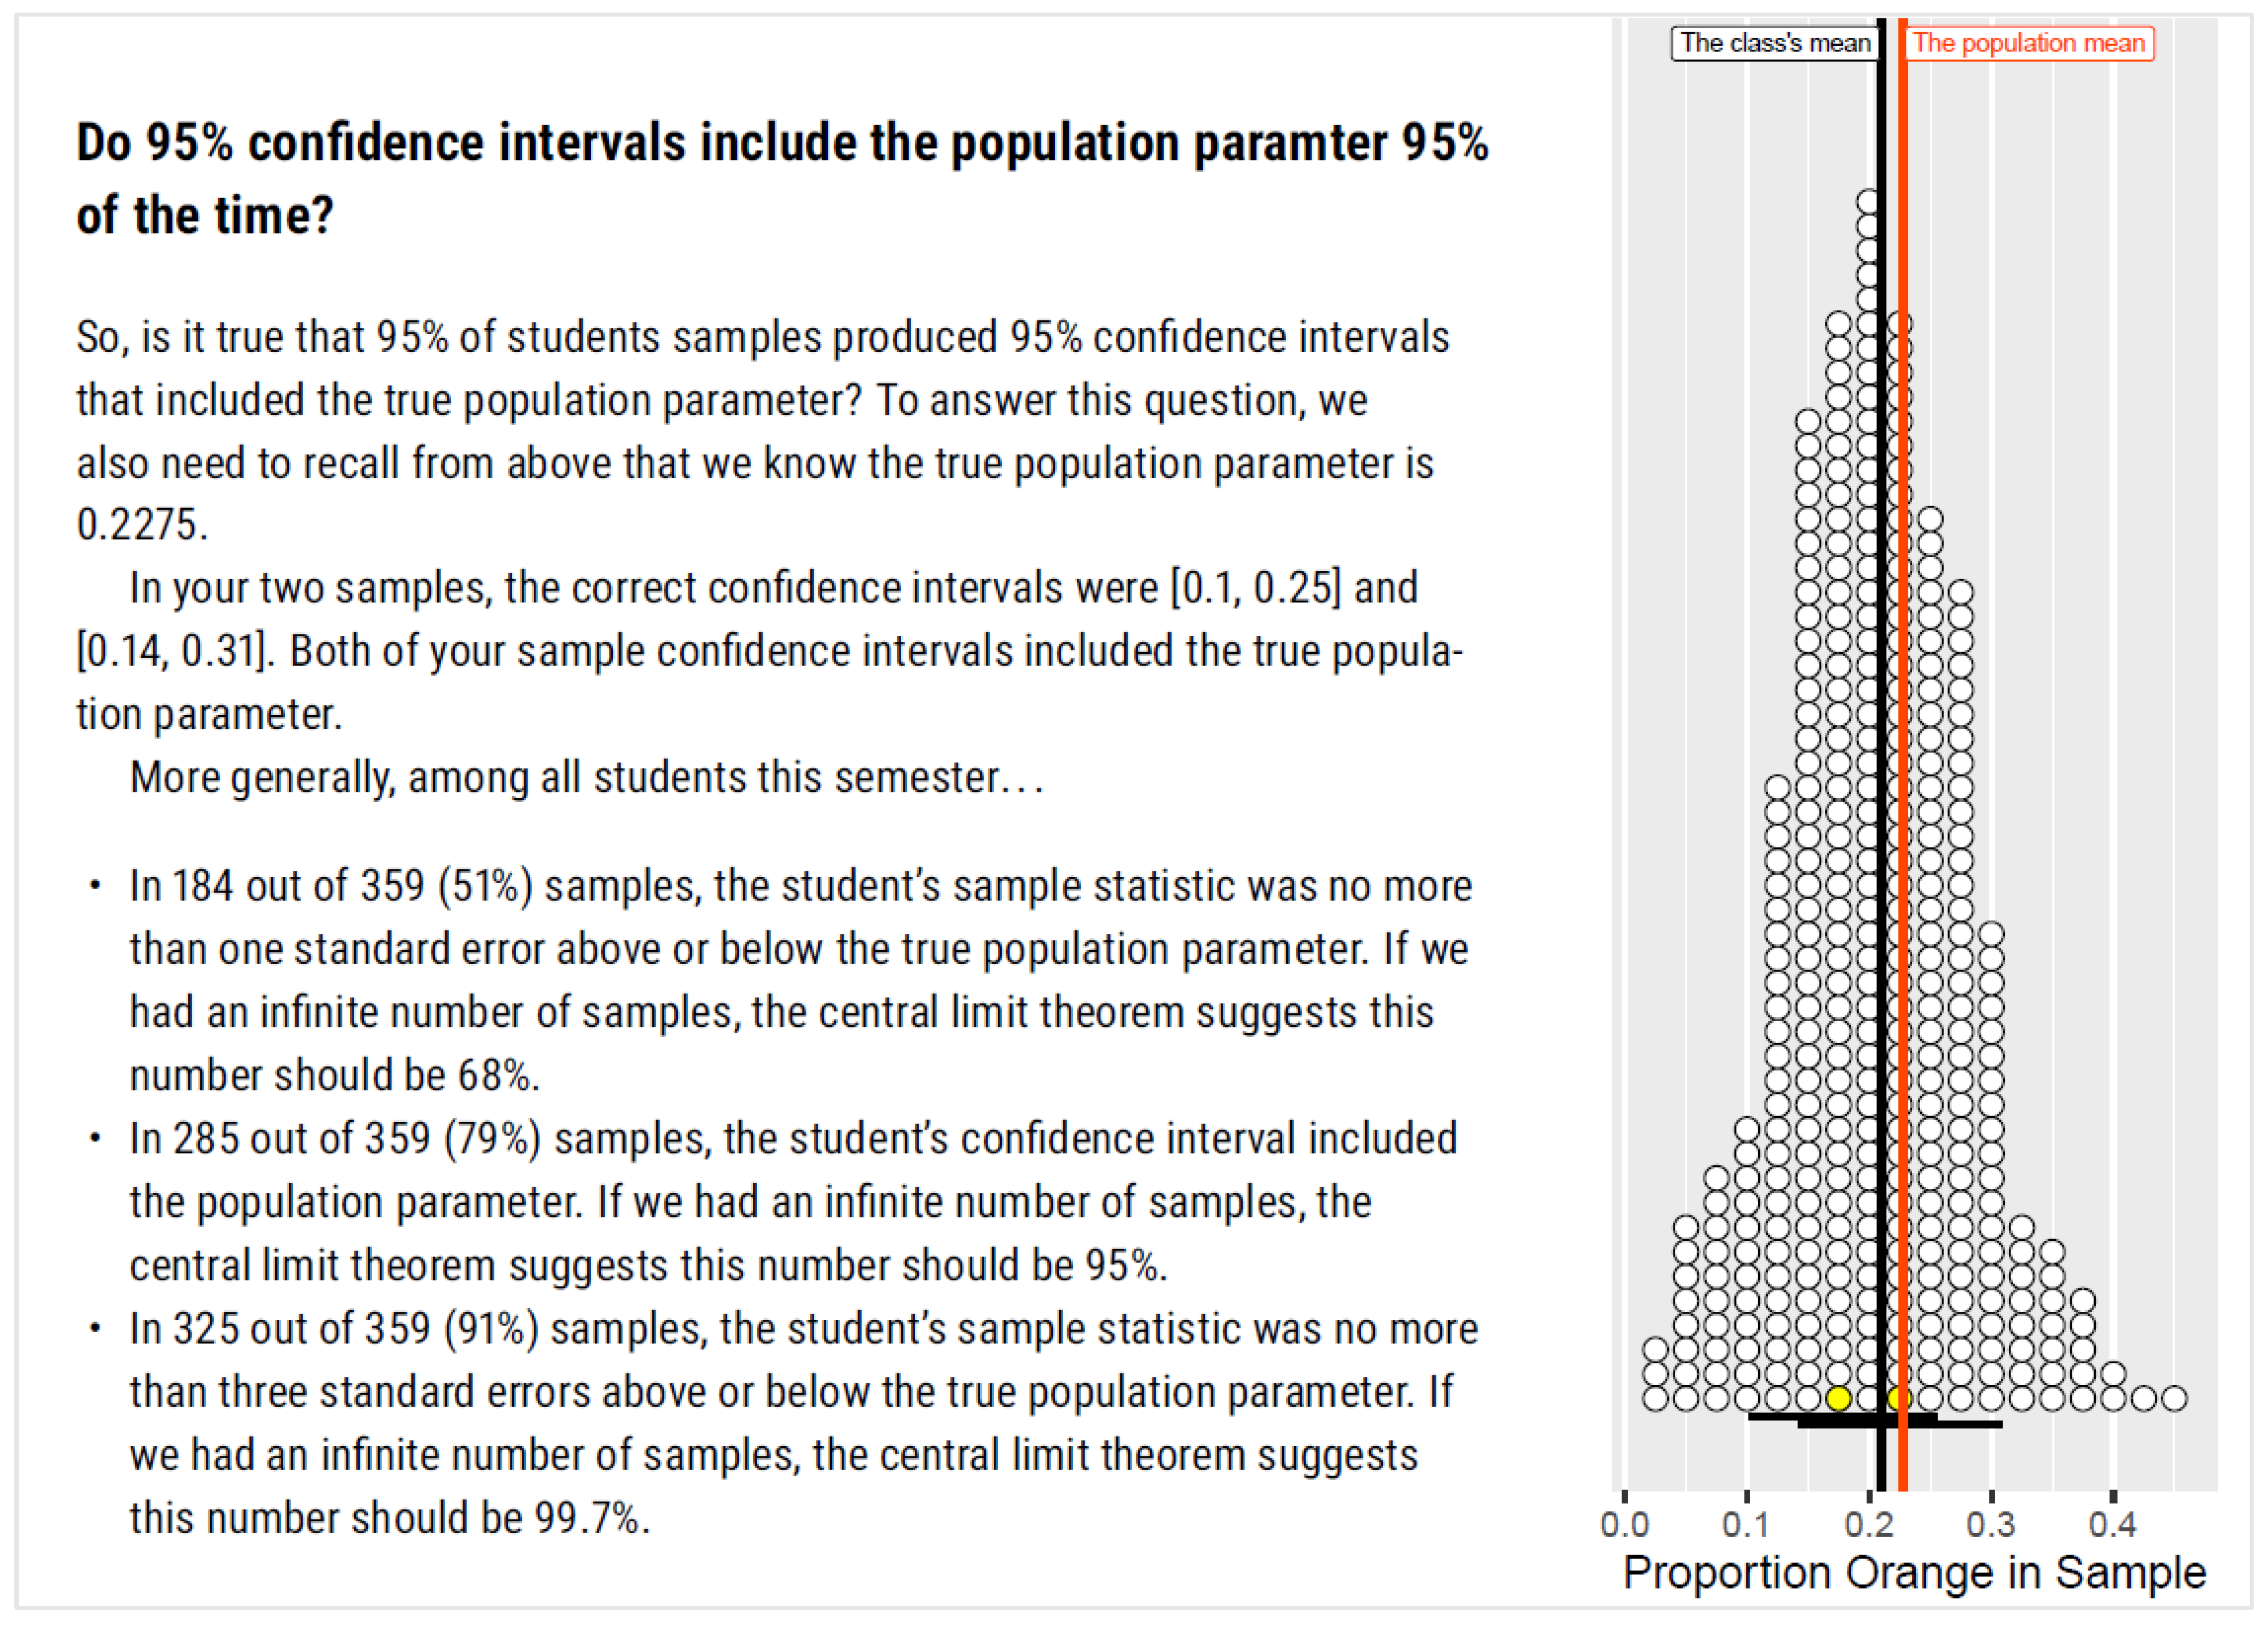
Gather Data: Students obtain one or more bags of M&Ms, calculate a sample statistic, such as the proportion of orange M&Ms, and calculate a confidence interval for each sample statistic;
Aggregate Results: While any single student’s sample mean may be far from the population mean, the average of the class’s sample means will be close to the true population mean. Moreover, a plot of all sample means will increasingly resemble the normal distribution as additional sample means are added. The aggregate results (see
Figure 4) give students first-hand experience with the central limit theorem—a concept that is so abstract that students often struggle to understand it, yet so important that virtually all of the subsequent class material depends on it. The aggregated results provide a means to demonstrate the
empirical rule, which suggests that roughly 68% of all sample statistics should fall within one standard error of the population parameter and 95% of all sample statistics should fall within two standard errors. This demonstration helps students to understand
why the formula for a 95% confidence interval of the mean works and what it means to say we have 95% confidence about an estimate;
Provide Personalized Reports: In addition to showing where a student’s sample statistics falls within the sampling distribution, the reports can also provide a check on the student’s calculations. Using the data the student entered, the report describes described each step required to calculate a confidence interval and highlights any steps where the student’s own calculations went off track. The personalized report containing
Figure 4 not only allows the student to see their contribution to the broader class data project of calculating the proportion of orange M&Ms, but it also provides them with a concrete example—that they contributed to—which will help them to remember these important statistical concepts throughout the semester and beyond.
6. Materials and Methods
To evaluate students’ reactions to the data projects, we gathered data from the 2021 Spring and Fall semesters of the classes mentioned above. Since the Media & Politics course was offered in both Spring and Fall, we have data from a total of four classes. All classes were upper-division undergraduate political science classes taught at the same large southern research university. The first two courses, Media & Politics and Social Influence in Political Behavior, were both electives. The third course, Research Methods, was required for all political science majors. The spring 2021 semester of the Media & Politics class was taught in a flex format which included online asynchronous lectures and one weekly in-person meeting. The fall 2021 semester of the course was taught as a standard, in-person class with meetings twice a week. Likewise, the Social Influence class was also an in-person upper-division class from Fall 2021. The Research Methods class came from Spring 2021. It was entirely online, asynchronous, and co-taught with another instructor. The data were drawn only from Pietryka’s section. Each class included the data projects described above. In addition, the Research Methods course included four other data projects that followed a similar structure but focused on other concepts.
We used two distinct datasets in our analysis. First, we gathered data while the Media & Politics students completed their data projects, embedding questions at the end of the surveys that students used to enter their data. Second, we added custom questions to the course evaluations that students completed at the end of the semester. We included these custom questions for all classes except the spring semester of Media & Politics.
Each dataset offers distinct advantages. The first dataset is more immediate and offers a higher response rate—virtually all students (n = 69) responded to these questions even though they could opt out of these items with no penalty. Since they were gathered during the data-entry stage of the assignments, however, these evaluations do not reflect students’ reactions to the subsequent discussions and personalized reports based on the aggregated data. The end-of-semester evaluations are more holistic—reflecting all portions of the assignments in relation to the rest of the course material. Yet, the response rates to the end-of-semester evaluations tended to be lower, with roughly half of the students responding in each class, some of whom opted out of sharing their evaluations with instructors. The usable response rate to any item in the evaluations was 36% in the Media class (n = 14), 36% in the Social Influence class (n = 14), and 40% in the Research Methods class (n = 37). In terms of demographics, in the self-reported student evaluation data, 25% of the students were seniors, 40% were juniors, 29% were sophomores, and 5% were first years. Students tended to report high grade point averages (GPA), with 63% reporting a 3.5 average or better on the standard 4-point scale; 22% reported a GPA from 3 to 3.49, and the rest reported a GPA between 2 and 2.99.
7. Results
7.1. Analysis of Dataset 1: Collected from Students while Completing the Projects
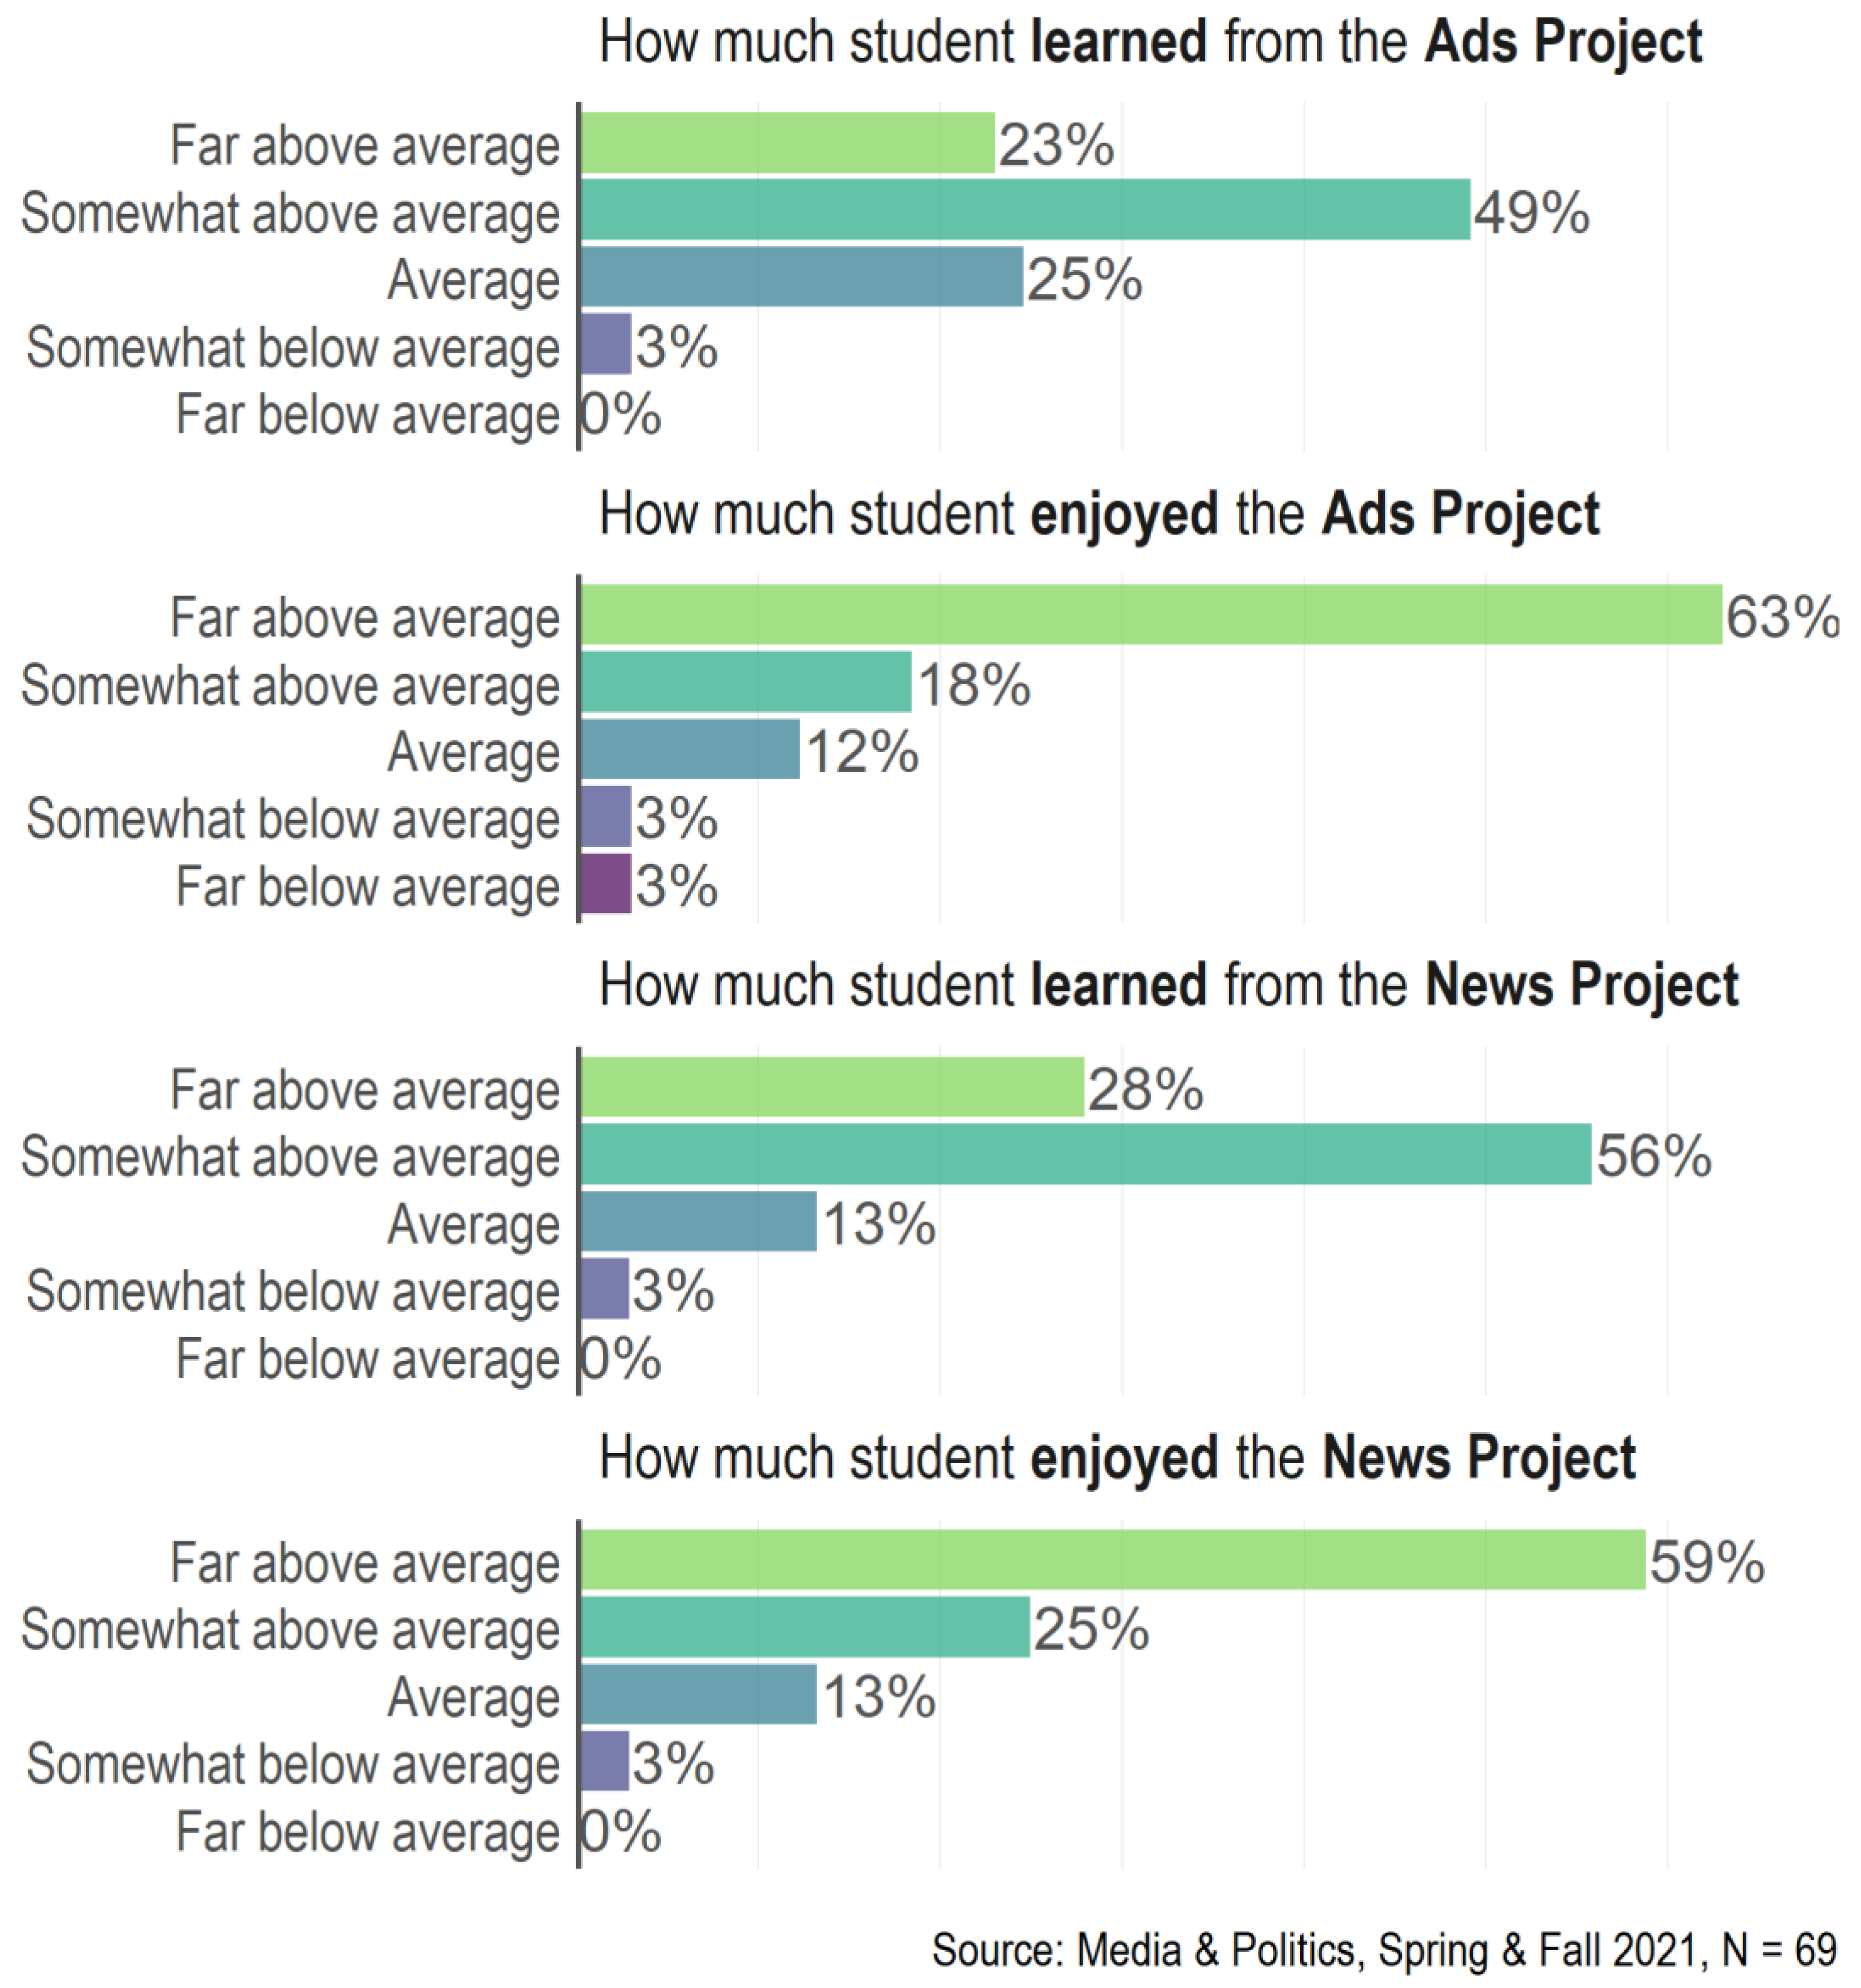
In both semesters of the Media & Politics class, we included this prompt after both the Ads Project and the News Project:
“Compared to other college assignments you have completed that take similar amounts of time, how would you rate this assignment in terms of…
Each of these items measured a different facet of student engagement. As
Figure 5 shows, 72% of students reported that they
learned more from the
Ads Project than a typical college assignment, and 84% reported that they
enjoyed it more than a typical assignment. We see a similar pattern for the
News Project, with large majorities finding it both educational and enjoyable. For each project, the rating of student enjoyment was greater on average than the rating of student learning, although research suggests that the two are related—when students enjoy a project or assignment, they are more likely to learn from it [
49].
7.2. Analysis of Dataset 2: End-of-Semester Evaluations
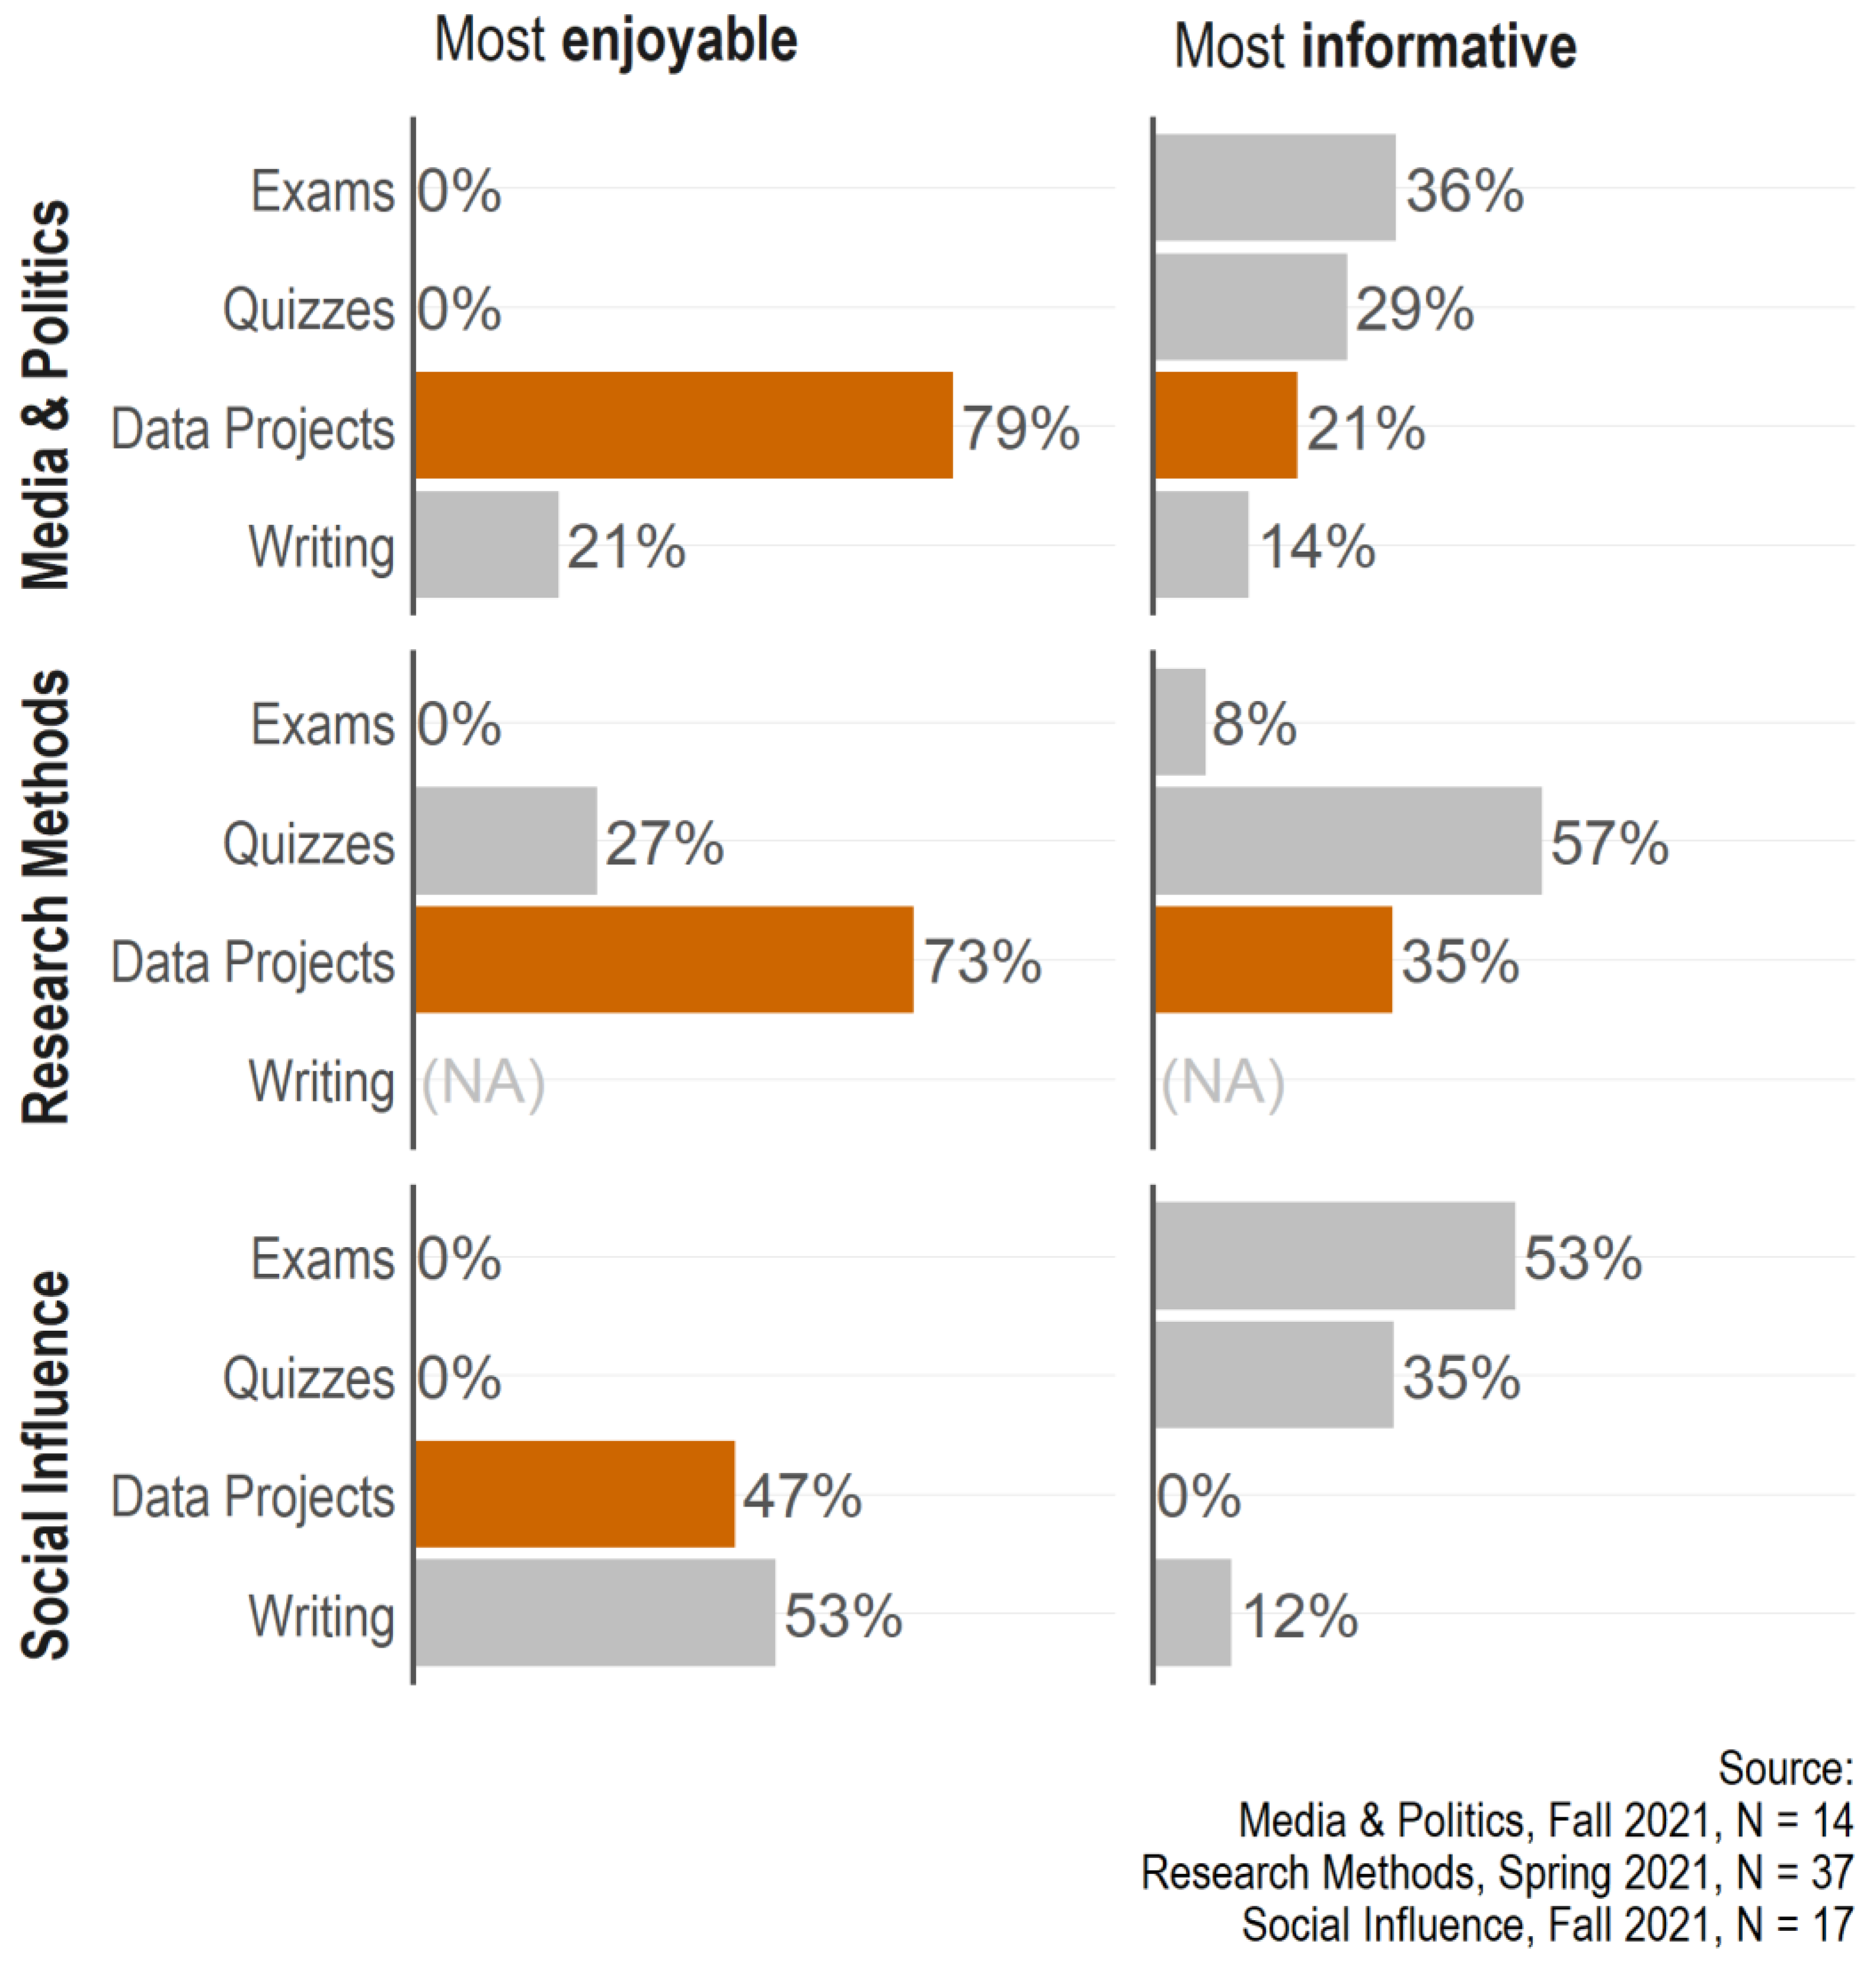
We next turn to our second dataset, which came from the end-of-semester evaluations. In each class, we asked students to rank the data projects on two dimensions relative to the other assessment methods in the class:
“Which set of assessments in this class did you find most enjoyable to complete? For this question, please focus only on how much you enjoyed completing the assessments, not how much you learned from them”;
“Which set of assessments in this class did you find most informative to complete? For this question, please focus only on how much you learned from completing the assessments, not how much you enjoyed them”.
These questions were intended to measure the same facets of engagement we examined in the first dataset. In the Media & Politics class and the Social Influence class, students had four options: the exams, quizzes, writing, or data projects. The Research Methods items omitted the writing option since no writing assessments were required in that class.
Figure 6 plots students’ responses to those questions. In the Media & Politics class, 79% found the data projects to be the most enjoyable assessments, and 21% found them to be the most informative. Likewise, 73% of the Research Methods class found the data projects to be the most enjoyable, and 35% found them the most informative. In the Social Influence class, which included only one relevant assignment, only 47% found the data project to be the most enjoyable, and none found it to be the most informative.
For comparison’s sake, on average, students chose the exams as the most informative assessment in both the Media & Politics class and the Social Influence class. In both classes, the exams required brief essays that encouraged the students to synthesize the material from throughout the semester. Students were given opportunities to revise and resubmit. Thus, the exams were intended not just as assessments, but also as incentives for students to engage with the material on a deeper level than they otherwise would. In contrast, the Research Methods exams were standardized across instructors and followed a more traditional format that included mostly multiple-choice and short-answer questions. In all three classes, the quizzes were also typically multiple-choice questions.
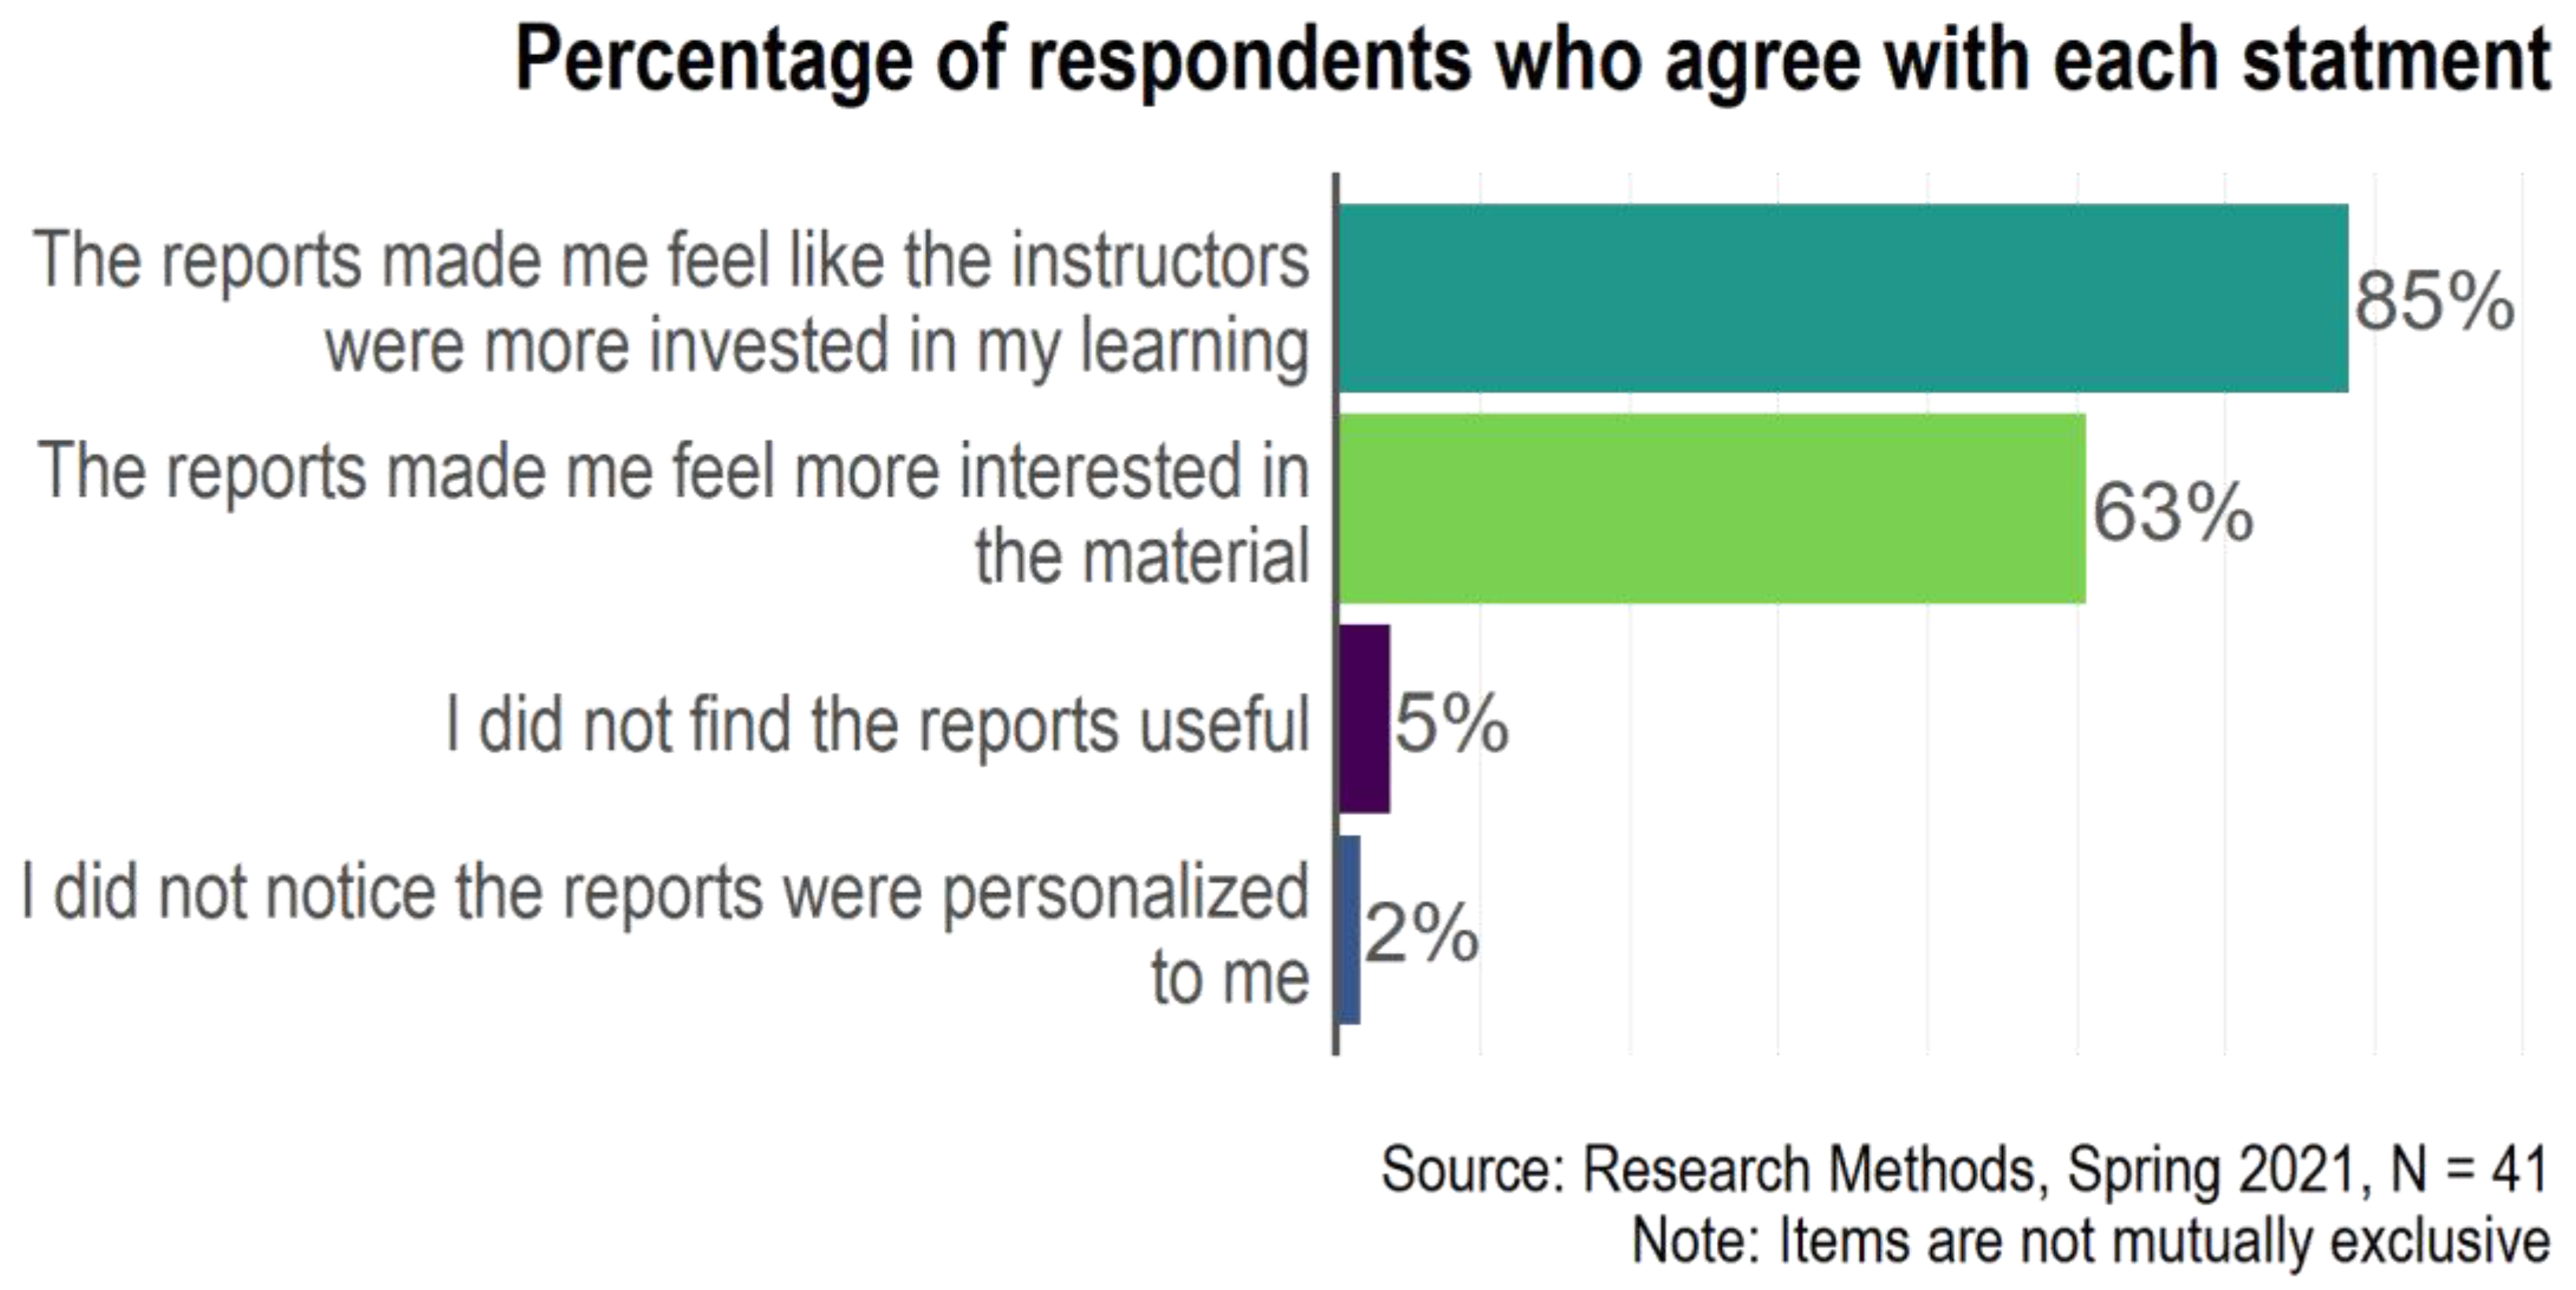
Since the Research Methods class relied so heavily on collaborative data projects, we included an additional battery about students’ perceptions of the personalized reports that summarized their results and compared them to the rest of the class. The prompt asked:
“After most assignments, the instructor emailed you a report with personalized results based on the data you entered. What did you think of these reports? (Check all that apply): The reports made me feel more interested in the material; The reports made me feel like the instructors were more invested in my learning; I did not notice the reports were personalized to me; I did not find the reports useful.”
As shown in
Figure 7, the personalized reports tended to make students feel like the instructors were invested in their learning (85% agreement) and increased students’ interest in the material (63% agreement). Thus, the reports seemed to build rapport between the instructor and students and engage the students in the material. Only two students stated that they did not find the reports useful, and only one did not notice that the reports were personalized.
8. Discussion
To summarize the results from both datasets, most students found the data projects more engaging than typical college assessments. The data projects were particularly useful for helping students enjoy the material and feel connected to the instructor. Though many students found the data projects informative, this benefit was less common than enjoyment or connection. While completing the data projects in the Media & Politics class, students found them to be more informative and more enjoyable than typical college assignments (
Figure 5). After the semester, most students in the Media & Politics class and Research Methods class reported these projects to be more enjoyable than the other class assessments, and about half did so in the Social Influence class (
Figure 6). Though less than a majority, many students also found these projects to be the most informative in the Media & Politics class and Research Methods classes, though none did in the Social Influence class. The Research Methods evaluations indicated that these assignments helped many students engage with the material and feel more connected to the instructor (
Figure 7). The literature indicates that participating in research is a high-impact practice that can have long-lasting positive implications for students (Ishiyama and Breuning 2003). Contributing to these in-class data projects can introduce students to research in a supportive environment where research and math anxiety may be less likely to be triggered (Papanastasiou and Zembylas 2008, Leiter 2022).
The results support the efficacy of the data projects, but, before instructors implement them in their own classrooms, they should consider the limitations of our data and several common barriers that can impede their implementation. We address each below and offer suggestions to ease implementation.
The data used in this analysis were limited in scope, because they came from a single instructor during a single calendar year at a single university. Therefore, we could not examine how the student responses might vary in other settings. Nonetheless, the classes did vary considerably in size, format, and content, as discussed above. The effective number of responses was also limited because, unlike a national survey, the observations were not independent from one another—one student’s experience was likely to influence other students in the class. Finally, the analysis relied on students’ self-reported learning rather than objective measures of student learning. Yet self-reported learning is still an essential element of students’ college experience, and our interests focus not only on learning, but also student interest and student–instructor rapport—two outcomes for which self-reports are intrinsically relevant.
To attain the benefits we found in our analysis, instructors must also overcome several common barriers. The largest barrier we encountered was the initial time the instructor must take to design the survey, perform the initial analysis, and generate the reports. Once these tasks are completed, they are easily repeatable, but, for a new project, significant time must be spent writing clear survey questions, carrying out data analysis, and communicating the conclusions effectively.
To ease implementation, we recommend keeping the first project simple and refining the materials each semester as needed. Since most of the work is finished during the first semester the project is used, instructors will have more time to hone the materials in subsequent semesters. For instance, the data-entry interface may be as simple as a spreadsheet for the first semester. The next semester, the instructor can invest additional time creating a web interface, which students tend to find more compelling—or less intimidating—than a spreadsheet. A web interface can also discourage common errors with automated validation checks. For example, in the Media & Politics News Project, students had to examine articles on four different days so they could see the change and continuity in news content. Yet, every semester, at least one student tried to collect all four days’ worth of data on a single day. When aggregating the data, the R code automatically identified these attempted submissions and emailed the student to request that they re-submit the assignment after gathering data on four separate days.
For many projects, the surveys require no prior training, but some projects will also benefit if students receive additional instruction before they enter data. In the Media & Politics class, the aggregated results offered greater reliability and validity when students received guided practice prior to their official data entry. This training required additional time for preparation, but also offered students deeper involvement with the research methods.
Though smaller classes can benefit from these methods, they often become more informative in larger classes. In the Research Methods class, for example, the larger the class, the more obviously the aggregated results reflected the central limit theorem. Likewise, in smaller classes, instructors may need to make greater efforts to ensure the anonymity of each student in the aggregated results and personalized reports. For instance, we did not provide students with a partisan breakdown of the Media & Politics course in Spring 2021 because only a handful of the 21 students self-identified as Republican. This challenge can be overcome by combining the current class with data from previous semesters. The usefulness of this approach for large classes is a real comparative advantage. Most engagement and rapport-building measures require a significant investment of personal time by the instructor and/or teaching assistants, making them difficult to apply to large classes (e.g., Gordon et al. 2009). On the contrary, our approach works even better in larger classes, with no additional effort on the part of the instructor.
9. Conclusions
Most instructors want to engage students more fully in learning course concepts. We proposed collaborative data projects as one resource-effective way to engage students while also building rapport. Our data showed that, by inviting students into a collaborative project—where they can see their contribution as one part of a whole—and giving them individualized feedback on that contribution, instructors found that students were more engaged in the class, enjoyed the material more, and felt like their learning mattered to the instructor. In such an environment, students are more likely to learn and be successful [
32,
50].
Additionally, the process of facilitating student collaboration and providing personalized feedback was simplified through using R, a software program that collects and merges student data. Other programs will work for the same procedures, and, undoubtably, new ones will emerge in the future. We include both the specific R packages and the details of the procedures we used in the
Supplemental Information. Furthermore, because the student inputs and subsequent analyses are unique based on the data students gather, the kinds of assignments we proposed make cheating less likely and reduce the administrative burden that otherwise exists due to changing questions each semester to discourage cheating.
Although the collaborative data projects we discussed here were from the social sciences, many fields could employ projects based on the same principles. Biology instructors could assign students to collect data samples from trees, insects, or pond water outside of class. English instructors could assign students to identify themes in a set of poems. Business instructors could assign students to view marketing materials from different companies and evaluate them based on criteria relevant to the course. The specific content of the collaborative data project can vary depending on the learning goals of the course. The key elements to the approach we suggest here are that: 1. the students are contributing to a collaborative project; and 2. the students receive personalized feedback about their contributions. The data we collected show that, with these two elements, students are more interested and engaged in the material and have greater rapport with the instructor.
Author Contributions
Conceptualization, M.T.P. and R.A.G.; Methodology, M.T.P.; Software, M.T.P.; Validation, M.T.P.; Formal Analysis, M.T.P.; Investigation, M.T.P.; Resources, R.A.G.; Data Curation, M.T.P.; Writing—Original Draft Preparation, M.T.P. and R.A.G.; Writing—Review and Editing, M.T.P. and R.A.G.; Visualization, M.T.P.; Supervision, M.T.P. and R.A.G.; Project Administration, M.T.P.; Funding Acquisition, n/a. All authors have read and agreed to the published version of the manuscript.
Funding
This research received no external funding.
Institutional Review Board Statement
The study was conducted in accordance with the Declaration of Helsinki and approved by the Institutional Review Board of Florida State University (STUDY00002952, 15 February 2022).
Informed Consent Statement
Informed consent was waived because this analysis relied on secondary analysis of data gathered for instruction and instructor evaluation. This research was approved as exempt by the Institutional Review Board, as discussed above.
Data Availability Statement
Acknowledgments
We thank Kerstin Hamann for thoughtful suggestions on a previous draft of this manuscript. We also thank Juan David Irigoyen Borunda and Giulia Venturini for providing invaluable teaching assistance for the courses discussed in this article. Finally, we thank the students who participated in the projects reported here.
Conflicts of Interest
The authors declare no conflict of interest.
References
- Fox, K.; Bryant, G.; Srinivasan, N.; Lin, N.; Nguyen, A. Time for Class—COVID-19 Edition Part 2: Planning for a Fall Like No Other; Tyton Partners: New York, NY, USA, 2020. [Google Scholar]
- Lester, D. A review of the student engagement literature. Focus Coll. Univ. Sch. 2013, 7, 1–7. [Google Scholar]
- Carini, R.M.; Kuh, G.D.; Klein, S.P. Student engagement and student learning: Testing the linkages. Res. High. Educ. 2006, 47, 1–32. [Google Scholar] [CrossRef]
- Kuh, G.D.; Kinzie, J.; Buckley, J.A.; Bridges, B.K.; Hayek, J.C. What Matters to Student Success: A Review of the Literature; Jossey-Bass: San Francisco, CA, USA, 2006. [Google Scholar]
- Kezar, A.; Maxey, D. Faculty matter: So why doesn’t everyone think so. Thought Action 2014, 2014, 29–44. [Google Scholar]
- Diette, T.M.; Raghav, M. Class Size Matters: Heterogeneous Effects of Larger Classes on College Student Learning. East. Econ. J. 2015, 41, 273–283. [Google Scholar] [CrossRef]
- Bettinger, E.; Doss, C.; Loeb, S.; Rogers, A.; Taylor, E. The effects of class size in online college courses: Experimental evidence. Econ. Educ. Rev. 2017, 58, 68–85. [Google Scholar] [CrossRef]
- Kezar, A.; DePaola, T.; Scott, D.T. The Gig Academy: Mapping Labor in the Neoliberal University; Johns Hopkins University Press: Baltimore, MD, USA, 2019. [Google Scholar]
- Jacobs, J.A.; Winslow, S.E. Overworked Faculty: Job Stresses and Family Demands. Ann. Am. Acad. Political Soc. Sci. 2004, 596, 104–129. [Google Scholar] [CrossRef]
- Gonzales, L.D.; Ayers, D.F. The convergence of institutional logics on the community college sector and the normalization of emotional labor: A new theoretical approach for considering the community college faculty labor expectations. Rev. High. Educ. 2018, 41, 455–478. [Google Scholar] [CrossRef]
- R Core Team. R: A Language and Environment for Statistical Computing. 2022. Available online: https://www.r-project.org/ (accessed on 27 September 2022).
- Zepke, N.; Leach, L. Improving student engagement: Ten proposals for action. Act. Learn. High. Educ. 2010, 11, 167–177. [Google Scholar] [CrossRef]
- Bell, T.H. National Commission on Excellence in Education: A Nation at Risk; Government Printing Office: Washington, DC, USA, 1983.
- Bonwell, C.C.; Eison, J.A. Active Learning: Creating Excitement in the Classroom. 1991 1878380087; George Washington University: Washington, DC, USA, 1991. [Google Scholar]
- Prince, M. Does active learning work? A review of the research. J. Eng. Educ. 2004, 93, 223–231. [Google Scholar] [CrossRef]
- Wilson, B.M.; Pollock, P.H.; Hamann, K. Does active learning enhance learner outcomes? Evidence from discussion participation in online classes. J. Political Sci. Educ. 2007, 3, 131–142. [Google Scholar] [CrossRef]
- McConnell, D.A.; Chapman, L.; Czajka, C.D.; Jones, J.P.; Ryker, K.D.; Wiggen, J. Instructional utility and learning efficacy of common active learning strategies. J. Geosci. Educ. 2017, 65, 604–625. [Google Scholar] [CrossRef]
- Akçayır, G.; Akçayır, M. The flipped classroom: A review of its advantages and challenges. Comput. Educ. 2018, 126, 334–345. [Google Scholar] [CrossRef]
- Gilboy, M.B.; Heinerichs, S.; Pazzaglia, G. Enhancing Student Engagement Using the Flipped Classroom. J. Nutr. Educ. Behav. 2015, 47, 109–114. [Google Scholar] [CrossRef]
- Fisher, R.; Perényi, Á.; Birdthistle, N. The positive relationship between flipped and blended learning and student engagement, performance and satisfaction. Act. Learn. High. Educ. 2018, 22, 97–113. [Google Scholar] [CrossRef]
- Krain, M. The Effects of Different Types of Case Learning on Student Engagement. Int. Stud. Perspect. 2010, 11, 291–308. [Google Scholar] [CrossRef]
- Ömer, D. Student Engagement in Blended Learning Environments with Lecture-Based and Problem-Based Instructional Approaches. J. Educ. Technol. Soc. 2012, 15, 310–322. [Google Scholar]
- Dong, J.-J.; Hwang, W.-Y.; Shadiev, R.; Chen, G.-Y. Pausing the classroom lecture: The use of clickers to facilitate student engagement. Act. Learn. High. Educ. 2017, 18, 157–172. [Google Scholar] [CrossRef]
- Remón, J.; Sebastián, V.; Romero, E.; Arauzo, J. Effect of using smartphones as clickers and tablets as digital whiteboards on students’ engagement and learning. Act. Learn. High. Educ. 2017, 18, 173–187. [Google Scholar] [CrossRef]
- Guthrie, R.; Carlin, A. Waking the dead: Using interactive technology to engage passive listeners in the classroom. AMCIS 2004 Proc. 2004, 358, 2952–2959. [Google Scholar]
- Allen, L.K.; Crossley, S.A.; Snow, E.L.; McNamara, D.S. L2 writing practice: Game enjoyment as a key to engagement. Lang. Learn. Technol. 2014, 18, 124–150. [Google Scholar]
- Subhash, S.; Cudney, E.A. Gamified learning in higher education: A systematic review of the literature. Comput. Hum. Behav. 2018, 87, 192–206. [Google Scholar] [CrossRef]
- Hernik, J.; Jaworska, E. The effect of enjoyment on learning. In Proceedings of the INTED2018 Conference, Valencia, Spain, 5–7 March 2018; pp. 508–514. [Google Scholar]
- Glazier, R.A. Building rapport to improve retention and success in online classes. J. Political Sci. Educ. 2016, 12, 437–456. [Google Scholar] [CrossRef]
- Glazier, R.A. Connecting in the Online Classroom: Building Rapport between Teachers and Students; Johns Hopkins University Press: Baltimore, MD, USA, 2021. [Google Scholar]
- Garrison, D.R.; Anderson, T.; Archer, W. Critical inquiry in a text-based environment: Computer conferencing in higher education. Internet High. Educ. 1999, 2, 87–105. [Google Scholar] [CrossRef]
- Jaggars, S.S.; Xu, D. How Do Online Course Design Features Influence Student Performance? Comput. Educ. 2016, 95, 270–284. [Google Scholar] [CrossRef]
- Frisby, B.N.; Martin, M.M. Instructor–Student And Student–Student Rapport in the Classroom. Commun. Educ. 2010, 59, 146–164. [Google Scholar] [CrossRef]
- Felten, P.; Lambert, L.M. Relationship-Rich Education: How Human Connections Drive Success in College; Johns Hopkins University Press: Baltimore, MD, USA, 2020. [Google Scholar]
- Henderson, M.; Ryan, T.; Boud, D.; Dawson, P.; Phillips, M.; Molloy, E.; Mahoney, P. The usefulness of feedback. Act. Learn. High. Educ. 2021, 22, 229–243. [Google Scholar] [CrossRef]
- Skurat Harris, H.; Meloncon, L.; Hewett, B.; Mechenbier, M.X.; Martinez, D. A call for a purposeful pedagogy-driven course design in OWI. Res. Online Lit. Educ. 2019, 2. [Google Scholar]
- Gaytan, J. Comparing Faculty and Student Perceptions Regarding Factors That Affect Student Retention in Online Education. Am. J. Distance Educ. 2015, 29, 56–66. [Google Scholar] [CrossRef]
- Gallien, T.; Oomen-Early, J. Personalized Versus Collective Instructor Feedback in the Online Courseroom: Does Type of Feedback Affect Student Satisfaction, Academic Performance and Perceived Connectedness With the Instructor? Int. J. E-Learn. 2008, 7, 463–476. [Google Scholar]
- Glazier, R.A.; Harris, H.S. Instructor Presence and Student Satisfaction Across Modalities: Survey Data on Students Preferences in Online and On-campus Courses. Int. Rev. Res. Open Distrib. Learn. 2021, 22, 77–98. [Google Scholar] [CrossRef]
- Cunningham, J.M. Composition students’ opinions of and attention to instructor feedback. J. Response Writ. 2019, 5, 3. [Google Scholar]
- Huss, J.A.; Eastep, S. The perceptions of students toward online learning at a Midwestern university: What are students telling us and what are we doing about it? IE Inq. Educ. 2013, 4, 5. [Google Scholar]
- Chang, N. Students’ views of feedback on electronic assignments. In Proceedings of the 2019 International Conference on Pedagogy, Communication and Sociology (ICPCS 2019), Ningbo, China, 25–26 May 2019; pp. 64–69. [Google Scholar]
- Woods, D. Students Viewing of Feedback: An Exploration of Technology-Mediated Learning. J. Educ. Technol. Syst. 2022, 51, 46–62. [Google Scholar] [CrossRef]
- Ackerman, D.S.; Gross, B.L. Instructor Feedback: How Much Do Students Really Want? J. Mark. Educ. 2010, 32, 172–181. [Google Scholar] [CrossRef]
- Loepp, E.D. Beyond Polls: Using Science and Student Data to Stimulate Learning. J. Political Sci. Educ. 2018, 14, 17–41. [Google Scholar] [CrossRef]
- Cooper, K.M.; Haney, B.; Krieg, A.; Brownell, S.E. What’s in a name? The importance of students perceiving that an instructor knows their names in a high-enrollment biology classroom. CBE—Life Sci. Educ. 2017, 16, ar8. [Google Scholar] [CrossRef]
- Vallone, R.P.; Ross, L.; Lepper, M.R. The hostile media phenomenon: Biased perception and perceptions of media bias in coverage of the Beirut massacre. J. Personal. Soc. Psychol. 1985, 49, 577. [Google Scholar] [CrossRef]
- Dyck, J.L.; Gee, N.R. A sweet way to teach students about the sampling distribution of the mean. Teach. Psychol. 1998, 25, 192–195. [Google Scholar] [CrossRef]
- Crocco, F.; Offenholley, K.; Hernandez, C. A Proof-of-Concept Study of Game-Based Learning in Higher Education. Simul. Gaming 2016, 47, 403–422. [Google Scholar] [CrossRef]
- Herrmann, K.J. The impact of cooperative learning on student engagement: Results from an intervention. Act. Learn. High. Educ. 2013, 14, 175–187. [Google Scholar] [CrossRef]
| Publisher’s Note: MDPI stays neutral with regard to jurisdictional claims in published maps and institutional affiliations. |
© 2022 by the authors. Licensee MDPI, Basel, Switzerland. This article is an open access article distributed under the terms and conditions of the Creative Commons Attribution (CC BY) license (https://creativecommons.org/licenses/by/4.0/).


