Article

Validity and Reliability of Adapted Self-Efficacy Scales in Malaysian Context Using PLS-SEM Approach

by
Najah Hazirah Mohd Dzin
and
Yoon Fah Lay
*
Faculty of Psychology and Education, University Malaysia Sabah, Kota Kinabalu 88400, Sabah, Malaysia
*
Author to whom correspondence should be addressed.
Educ. Sci. 2021, 11(11), 676; https://doi.org/10.3390/educsci11110676
Submission received: 25 August 2021 / Revised: 13 October 2021 / Accepted: 18 October 2021 / Published: 22 October 2021

Abstract

:
Self-efficacy scales have been used widely across curriculum and demographic structures, while retaining their objectivity in a specific domain. This pilot study aimed to test the validity and reliability of adapted scales that incorporated four sources of self-efficacy (mastery experiences, vicarious experiences, social persuasion, and emotional and physiological states), as well as science self-efficacy in the Malaysian context. A total of 109 students participated in this study. Data were analyzed through confirmatory factor analysis (CFA), by using the partial least square structural equation modelling (PLS-SEM) approach. The reliability criteria were determined through outer loading and composite reliability (CR). The assessment of convergent validity was performed using the average variance extracted (AVE), while the discriminant validity of this instrument was confirmed using the heterotrait–monotrait criterion (HTMT), along with the bootstrapping procedure. The CR values were at a satisfactory level, and two indicators were eliminated (PM3 and PMPR6) to improve the AVE values of the construct. All the values were assessed in the HTMT criterion, along with the confidence intervals in the range recommended to prove discriminant validity. The assessment of validity and reliability, through PLS-SEM, indicated that the scales used in this study are valid and statistically reliable.

1. Introduction

Self-efficacy is a dynamic construct and changes along with the learning process [1]. A student who goes through a learning phase from childhood to adulthood does not necessarily maintain the same level of self-efficacy throughout the process. Furthermore, self-efficacy is specific to the domain. The level of a student’s self-efficacy may vary across different subjects. However, various opinions revolve around this matter. Some researchers state that self-efficacy assessments are more stable due to their objectivity, thus causing them to be unaffected by social comparisons and affective changes [2]. Other researchers, however, argue that self-efficacy is a less stable construct and often results in various findings in terms of self-efficacious aspects, as compared to the other constructs, such as the self-concept in measuring the effect on a student’s achievements [3].
However, self-efficacy is an important element of motivation, especially in terms of intrinsic motivation and self-regulation in science learning [4]. The prominent impact of self-efficacy on motivation enables this aspect to be used as a factor to measure performance and achievement [5]. Previous studies have proven that self-efficacy does not only correlate with motivation, but also has a significant relationship with science achievement [6,7]. In fact, self-efficacy can affect students’ science achievements at various levels of education [5,7,8,9].
In the classroom, science self-efficacy influences students’ choices in science-related tasks, the efforts they contribute to the completion of those tasks, as well as students’ determination when facing difficulties in those tasks [10,11]. Originally, students may have set out different goals for their tasks. Some of them may want to obtain good grades, please their teacher, or just want to work more efficiently [1]. These goals are greatly influenced by the development of students’ competences in their learning phase. Hence, this leads to changes in the level of the students’ self-efficacy throughout the learning process.
Since self-efficacy is dynamic, the question arises about the sources that influence the level of self-efficacy in the students. Due to this reason, most researchers extend their study to the factors that influence the level of students’ self-efficacy [6]. One of the most well-known theories on the source of self-efficacy is the one proposed by Albert Bandura. He proclaimed that students’ self-efficacy is formed through four main sources, namely, mastery experience, vicarious experience, social persuasion, as well as emotional and physiological states [10]. These four sources have various strengths of influences.
Mastery experience is a situation in which students gain real experience through past successes. However, without the help of influences from other sources, mastery experience will not be able to influence self-efficacy alone [12]. Vicarious experiences, on the other hand, are gained from individual observations of the agents’ experiences. Social persuasion is more influential in students’ self-efficacy if the persuasion refers to something more specific [13]. Emotional and physiological states refer to situations experienced by students, such as feelings of anxiety and stress, derived from doing homework in school.
The source of self-efficacy does not directly affect the students’ self-efficacy. It is often assessed cognitively [14]. The information obtained is arbitrated and combined by students through their perceptions of their abilities, levels of task difficulty, amount of effort expended, external assistance received, number and pattern of successes and failures that have occurred, comparison with observed models, and credibility of social persuasion [1,15].
The measurements in a study need to have high validity and reliability. Therefore, the scales used in this study are of no exception either. Construct-related validity is the validity that serves as evidence that the measurement of the instrument is consistent with the related theories [16]. The construct-related validity of the scale for this study was associated with convergent validity and discriminant validity. The reliability of the scale lies on the stability of the instrument. In this study, the instrument reliability was measured using the internal consistency reliability.
This study used a combination of several scales that were adapted, modified, and translated into Malay language to measure the source of self-efficacy and science self-efficacy. Therefore, the main purpose of this study was to validate the adapted, modified, and translated scales that were used to measure the sources of self-efficacy and science self-efficacy. The construct-related validity and reliability of the scales were obtained through the partial least square structural equation modelling approach (PLS-SEM). Under this approach, the objectives of the study focused on proving the validity and reliability through (i) the reliability of the constructs (outer loading and composite reliability (CR)), (ii) convergent validity (average variance extracted (AVE)), and (iii) discriminant validity (heterotrait–monotrait criterion (HTMT)).

2. Literature Reviews

2.1. Science Self-Efficacy Scale

Previous findings demonstrate that the level of students’ science self-efficacy was at a moderate level [6,17]. In fact, past studies have also proven that students who are not in science streams have lower science self-efficacy than science stream students [2,18]. This scenario also happens in Malaysia. In Malaysia, most secondary school students avoid going into science streams due to their beliefs that the pure science subjects are extremely difficult subjects [19].
Nevertheless, the study of the influence of self-efficacy in the domain of science is not something new and began long ago. The diversity of the scale used to measure science self-efficacy in the past studies may either spread across various domains or be specific to the domain of science only. Furthermore, the selection of the scale also depends on the researcher’s intention. Although previous studies focused on samples of students majoring in science, the instrument used to measure the level of self-efficacy is general in nature and is not confined to the subject of science [20].
Specifically, the motivated strategies for learning questionnaire (MSLQ), developed by Pintrich and De Groot [21], is widely used by researchers to measure the level of science self-efficacy [9,11,22,23]. The items in self-efficacy measurements only represent several subscales in the instrument. In fact, the instrument often has general characteristics that can be used to measure students’ motivations. However, recently used self-efficacy instruments are more focused on and specific to certain domains, thus can measure self-efficacy more effectively.
A few Asian researchers have shown great interest in using science learning self-efficacy (SLSE) [24,25,26] in self-efficacy studies. This scale measures science self-efficacy with the presence of five dimensions, comprising conceptual understanding, higher order thinking skills, practical work, daily life applications, and science communication. A study used the SLSE scale to make a cross-cultural comparison in the level of science self-efficacy between Taiwanese and Singaporean students [26]. In this study, exploratory analysis was performed to validate the SLSE through Varimax rotation, in order to verify the structure of each dimension. As a result, the students’ responses were grouped into five orthogonal dimensions. The satisfactory Cronbach Alpha values and the Eigenvalue were the indication that this scale had strong psychometric features to assess science self-efficacy.
Another study that utilized this scale focused on investigating the relationship between the self-efficacy and achievement in science subjects among rural secondary school students in Malaysia [24]. The researchers retained features such as the total items and the original Likert scale used in the scale. However, due to the difference in language background, the original scale was translated to the Malay language. The high Cronbach Alpha values that resulted from the process of validation ensured that the SLSE scales used in this study are suitable to be used to assess science self-efficacy in students.

2.2. Sources of Self-Efficacy Scale

Over the past decade, the sources of self-efficacy have become an important aspect in the research on self-efficacy. Initiatives to build scales of sources of self-efficacy are observed in some research [6,27,28,29]. Most scales focusing on the sources of self-efficacy in education are constructed towards career choice and the students’ achievements. As one of the characteristics of self-efficacy is domain specific, most constructed scales focus on a specific or a particular domain, based on the field or construct under study. However, in the context of the science domain, the scarcity of existing scales resulted in most researchers having to modify scales from other domains [6,12,17]; for example, researchers might have to adapt a mathematic source of self-efficacy scale to the science domain [6].
The sources of middle school mathematics self-efficacy scale, constructed by Usher and Pajares, is a widely used scale for measuring the sources of self-efficacy in the context of secondary schools [30]. This scale is proven to have high reliability and validity, as well as having the ability to describe strong psychometric features [17]. The original version measured Bandura’s proposed source of self-efficacy using a five-point Likert scale. This scale was originally used to measure the source of self-efficacy of secondary school students in the mathematics domain. Due to the flexibility of this scale, it has also been applied to other domains by researchers [17,31,32,33]. One clear example was by Chen and Usher, who specifically adapted this scale to be used in the domain of science [17].
However, in contrast with what proposed by Bandura regarding vicarious experience as a second strong source of self-efficacy after mastery experiences, most studies were unable to prove this point [30,34,35,36,37]. The same issue was also visible in this scale. This may be due to the way the items were presented in writing. The items used to measure vicarious experiences were unable to indicate individuals acting as social models in the source. In order to rectify this, Ahn, Bong, and Kim proposed new vicarious experiences and social persuasion scales [27] that include three social models, namely, teachers, families, and peers, due to their strong influences on individual learning that were highlighted in the past literature [38,39,40].
The new vicarious experiences and social persuasion scales were validated using three different samples and two domains for each sample in Korea. The final version of this scale contains 15 items on vicarious experiences and 16 items of social persuasion, with confirmed social model divisions. The researchers suggest using this instrument as a subscale to replace the vicarious experiences and social persuasion items in the sources of middle school mathematics self-efficacy scale. As this scale has been tested in different domains, such as mathematic, English as a foreign language in Korea, and the Korean language, this scale, therefore, presents solid evidence that it is flexible and applicable to any domain studied by researchers.

2.3. Significance of the Study

The evolution in the learning of science is parallel with the changing times. Although every country has its own unique learning curriculum, most countries share similarities in terms of science subjects offered to their students; for instance, in Malaysia, students from the age of 13 to 16, who have entered the realm of secondary school, will study general science. After that, they will be given the option to choose their subject of interest. Students who are interested in science can choose to delve into pure science subjects, such as biology, physics, and chemistry. For students who did not choose these pure science subjects, general science subjects are compulsory for them, as the Malaysian government sees the importance of inculcating science-based knowledge to the younger generations.
However, over the past decades, Malaysia has recorded inconsistent achievements in average science scores in international assessments, such as TIMSS and PISA [41,42]. This scenario is directly linked to students’ negative attitudes towards science [43,44]. Malaysian secondary school students have the tendency to avoid science streams, due to their preconceptions that pure science subjects are extremely difficult subjects to learn [19].
Based on this, the Malaysian Ministry of Education has implemented a comprehensive new curriculum for both primary and secondary school levels. The new curriculum was developed as a result of drastic educational reform, as documented in the Malaysian Education Blueprint 2013–2025 [45]. The standard curriculum for secondary school (KSSM) was introduced in the year of 2017, for form one students [46]. Thus, a pioneer batch of students were in form four in 2020. For the purpose of this study, a total of 109 students who were learning the general science subject from the first batch of students were selected as the sample. Their views of the new curriculum for science subjects, in terms of science self-efficacy, were gathered and analyzed in this study.
The psychometric structure of a scale may differ across cultural backgrounds. Therefore, it is important to reconfirm that the scale used is relevant in the context of this study. The psychometric structure of all the scales used in this study was reconfirmed using the partial least square structural equation modeling (PLS-SEM) approach. This is necessary because the original scale is modified and translated to the Malaysian context. Prior to that, content and face validation were performed to uphold the quality of the scale.

3. Materials and Methods

3.1. Sample

This study adopted a quantitative approach using the survey design. In addition, a multistage sampling method was adopted for this study. This study was conducted in the west coast division of Sabah, Malaysia. Out of the seven districts in the west coast of Sabah, two district education offices were selected through a random sampling method. Next, the researchers selected a few secondary schools from the two districts for the pilot study. Lastly, purposive sampling was used to select form four students who took general science subject to meet the needs of the study. Form four students in Malaysia have similar characteristics to international grade 10 students. They are around 16 years old and are studying in secondary schools. However, the science curriculum in Malaysia might be different to other countries.
The best sample size determination method for structural equation modeling in a study is based on power analysis with specified features [47]. The minimum sample size in this study was determined through calculations based on G*Power software version 3 [48]. Based on the calculations, a total of 74 minimum sample numbers in reference to the structural model were proposed for this study. However, previous studies have suggested that using 100 to 200 samples is a good starting point for studies related to path estimation analysis, especially for structural equation model [49,50]. Therefore, in order to satisfy this requirement, the researchers collected data from 109 samples. The samples were considered to be homogenous as all schools in Malaysia use the same curriculum and syllabus, as stipulated by Malaysian Ministry of Education.

3.2. Instrument

In this study, all original scales involving sources of self-efficacy and science self-efficacy were translated into Malay language and were later combined as a scale. Table 1 shows the code used in this scale. The finalized items with code abbreviations in English are shown in Appendix A as references.
Several scales were adapted, modified, and translated for the purposes of this study. The sources of middle school mathematics self-efficacy scale were used for the purpose of measuring sources of self-efficacy through mastery experiences (PM) as well as emotional and physiological states (KEF) [30]. In addition, sources of self-efficacy through vicarious experiences (PMP) as well as social persuasions (PS) were measured using the new vicarious experiences and social persuasion scales [27]. Science learning self-efficacy (SLSE) was selected to measure science self-efficacy [25]. There are five dimensions highlighted in this instrument. They are the dimension of conceptual understanding (EKSPK), dimension of higher order thinking skills (EKSKBAT), dimension of daily application (EKSHARIAN), dimension of science communication (EKSKOM) and dimension of practical tasks (EKSAMALI).
All items in original scales were retained in this study. However, some modifications were made to fulfil the objectives of this study. Firstly, the 11-point semantic differential scale was used in this study to replace the 5-point Likert scale in the original instruments. Next, all items from three original scales were combined into a single scale to represent the structural model for this study. In addition, back-to-back translation was performed by a panel [51,52]. The translation process ensured that there was no change in the meanings, concepts and instructions stated in the translated version compared to the original scale. Lastly, content validity and face validity were carried out prior to pilot study. Both validities are important in determining whether the translated scale is truly appropriate for measuring the external and internal context of the study [53].

3.3. Procedures

The procedure of conducting the study was initiated by applying for permission from the faculty. After that, permission to enter the school was obtained from Education Policy Planning and Research Division, Ministry of Education and Sabah State Education Department. The process of data collection was carried out in four schools in September 2020. The scale was administrated during science sessions in their respective classrooms. Briefing to the students was performed prior to the data collection. This procedure was to make sure that the students were fully aware of the fact that the scale does not function as a test. It only elicits students’ own perceptions and should not be pressurized by the expectations from the schools. They were also given adequate time to answer the instruments and all students managed to finish answering the scale in 20 min.

3.4. Data Analysis

Structural equation modeling (SEM) is a new measurement alternative labeled as a second-generation measurement method in multivariate analysis. SEM analysis techniques display various advantages over first-generation multivariate analysis methods. In SEM analysis, the combination of factor analysis and regression methods gives researchers the advantage of studying the relationship between the observed variable and the latent variable. Among the advantages of SEM techniques is that all these relationships can be studied at the same time or simultaneously.
Both covariance-based (CB-SEM) and partial least squares (PLS-SEM) are the most widely used SEM analysis techniques in recent studies. The use of CB-SEM and PLS-SEM techniques are complementary, yet differ in various aspects, especially goals, statistical methods, and analysis requirements [54]. Technically, researchers chose to use the PLS-SEM analysis method as there is no theory or stable results that confirm the ability of science self-efficacy as a mediator between source of self-efficacy and science achievement in previous studies.
The model proposed in the framework for this study is a hierarchical component model (HCM), which involves both higher order component (HOC) and lower order component (LOC). In the PLS-SEM analysis method, the reflective–reflective relationships that exist between higher order and lower order components are denoted as type I model. Therefore, the construct validity and reliability of the scale is followed by measurement model assessment in PLS-SEM method.
The validity and reliability of the scale were tested through confirmatory factor analysis method (CFA) by using partial least squares structural equation modelling (PLS-SEM) method. The assessment of the reliability of the scale was reported by the composite reliability (CR) and outer loading values. Meanwhile, convergent validity for this scale was assessed through the average variance extracted (AVE) values. In this study, discriminant validity was determined through the HTMT criterion. Table 2 summarizes the acceptance criteria for the reported values for the purpose of validity and reliability of the scale.
The value of outer loading represents the reliability of the indicator in the construct. The recommended value for outer loading should exceed 0.7. The square value of the standard outer loading represents communality, i.e., the extent to which the indicator is described by endogenous constructs in a model [66]. However, when the outer loading value is between 0.4 and 0.7, the decision to maintain, change or delete an item depends on conditions such as high outer loading value for other items and criteria such as CR and AVE values. The outer loading value viewed together with the AVE value was used to obtain convergent validity for the scale. The AVE value can only be calculated when there is a square value of the outer loading used for the purpose of calculating the mean value [67]. The recommended value is above 0.5, which means that more than 50% variance for reflective indicators has been considered to explain the latent variable.
In addition, several criterions considered for discriminant validity were proposed such as cross-loading values, Fornell-Larcker criterion and heterotrait–monotrait criterion (HTMT) [47]. In past studies, the discriminant validity analysis was mostly assessed from the cross-loading values as the first step followed by Fornell-Larcker criterion and HTMT table assessment [54]. In this method, the value of cross loading for items that belong to the construct must be the highest among all other items in the scale. Meanwhile, the Fornell-Larcker criterion states that the square root value of AVE must be higher than the correlation value of the construct along with all other constructs. The assessment was finalized with HTMT value analysis in the table provided. In this step, the HTMT values should not exceed the value of 0.90 to meet the requirement of discriminant validity for the measurement model [64].
However, the new assessment of HTMT criterion has become the main method in recent studies over cross-loading and the Fornell-Larcker criterion due to better data presentation [65,66,68]. The first step in this method is the same as previous assessment of HTMT criterion. The next step has a bigger difference with the older method, as it should be followed by bootstrapping method. The bootstrapping method is performed to confirm the range of HTMT confidence intervals that has gone through bias-corrected and accelerated confidence intervals. In this step, the discriminant validity was assessed through the values of confidence intervals shown in the table. The range of the confidence interval should be in range below 1. If a value of “1” is displayed in upper bound, this indicates that the item used has poor discriminant validity [65].

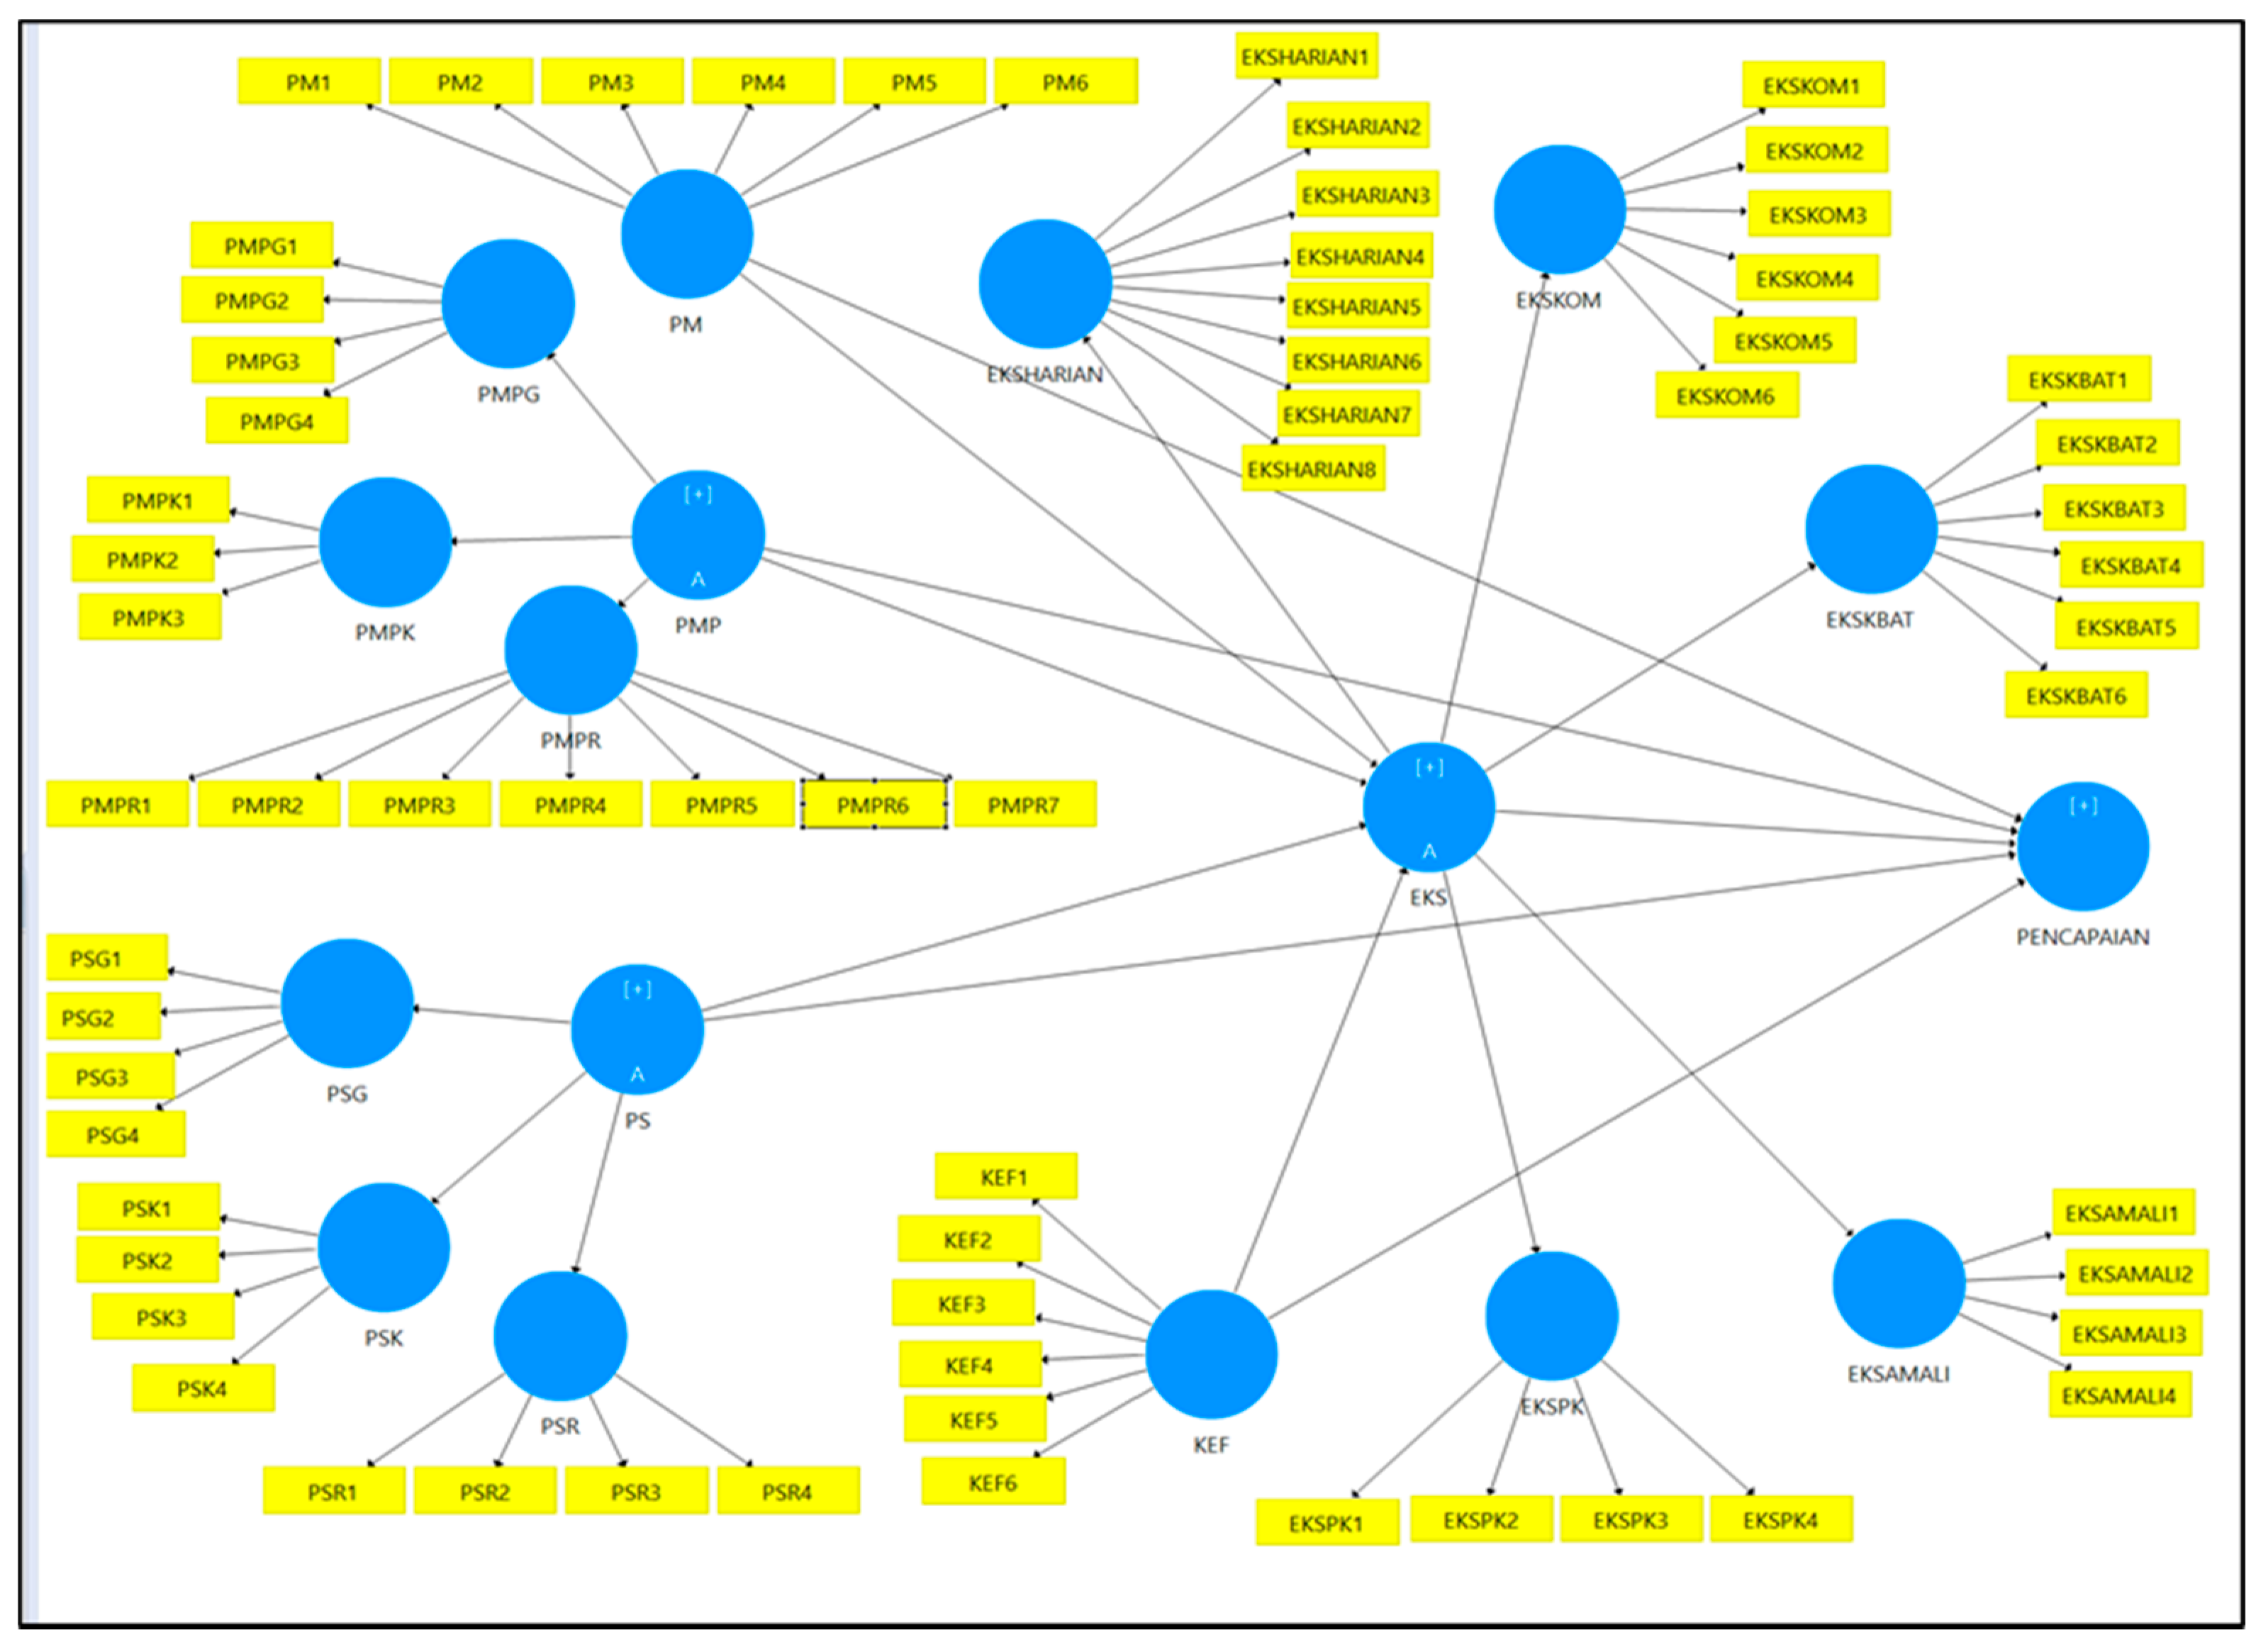
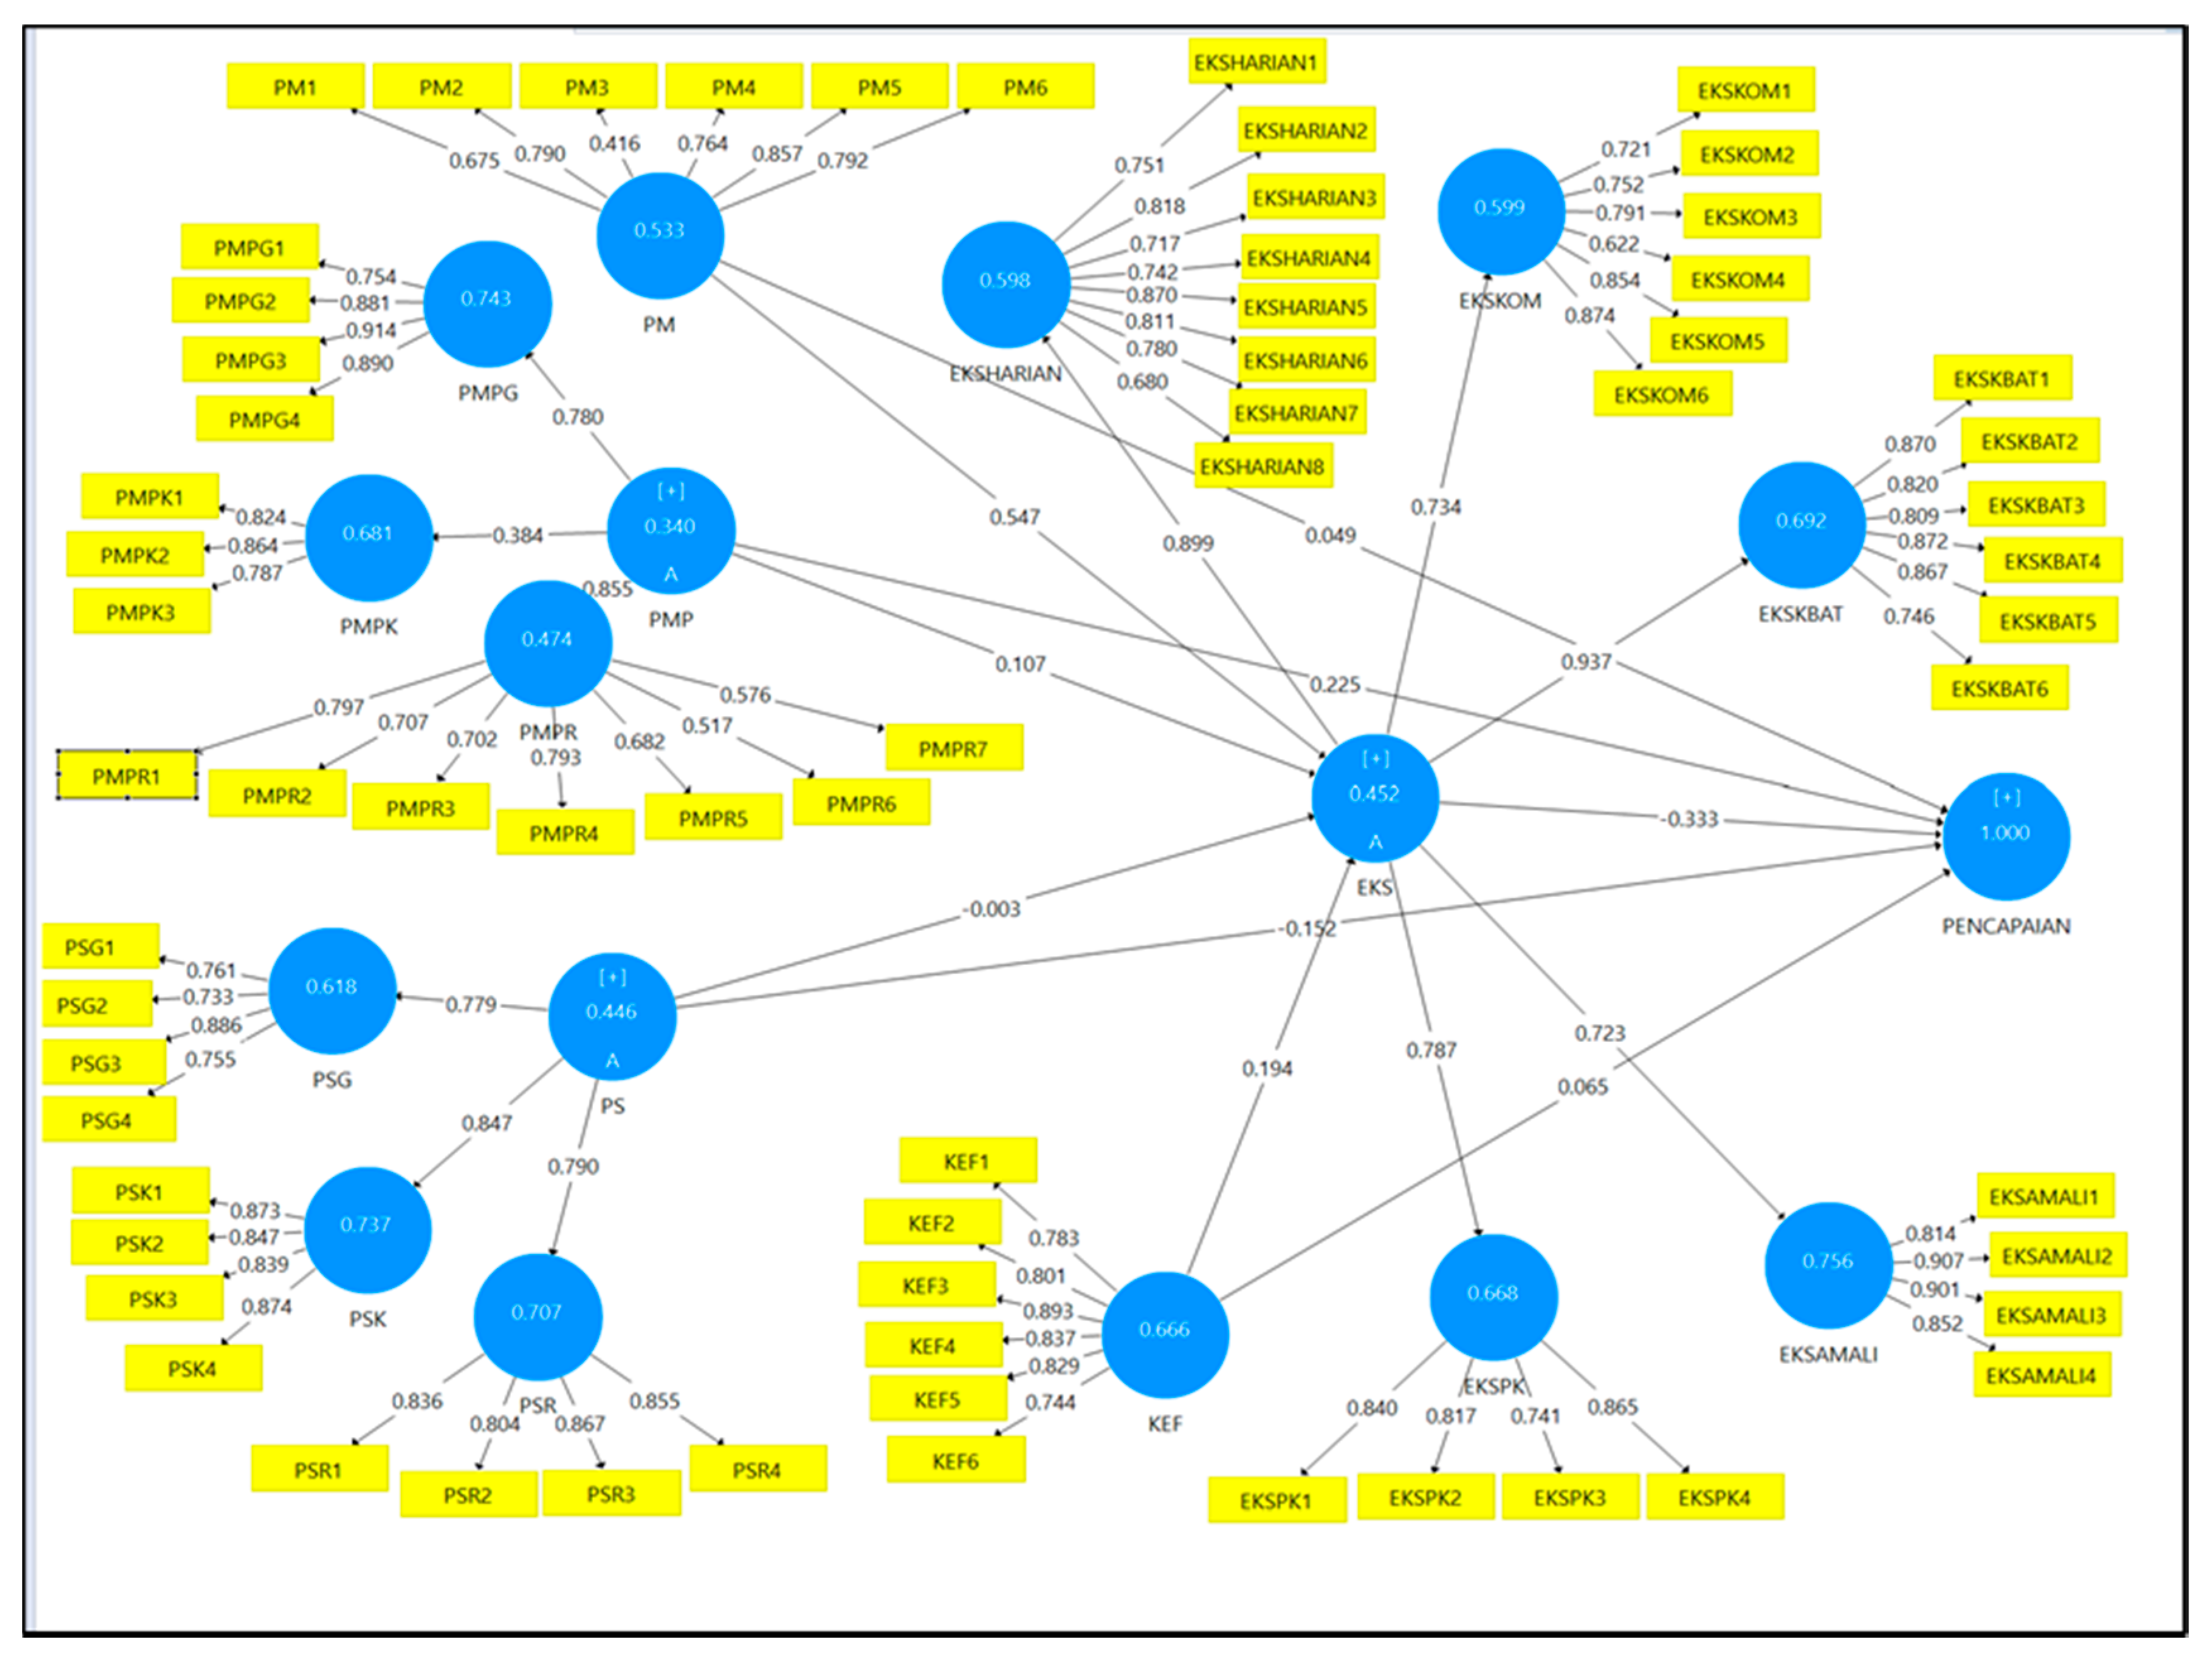
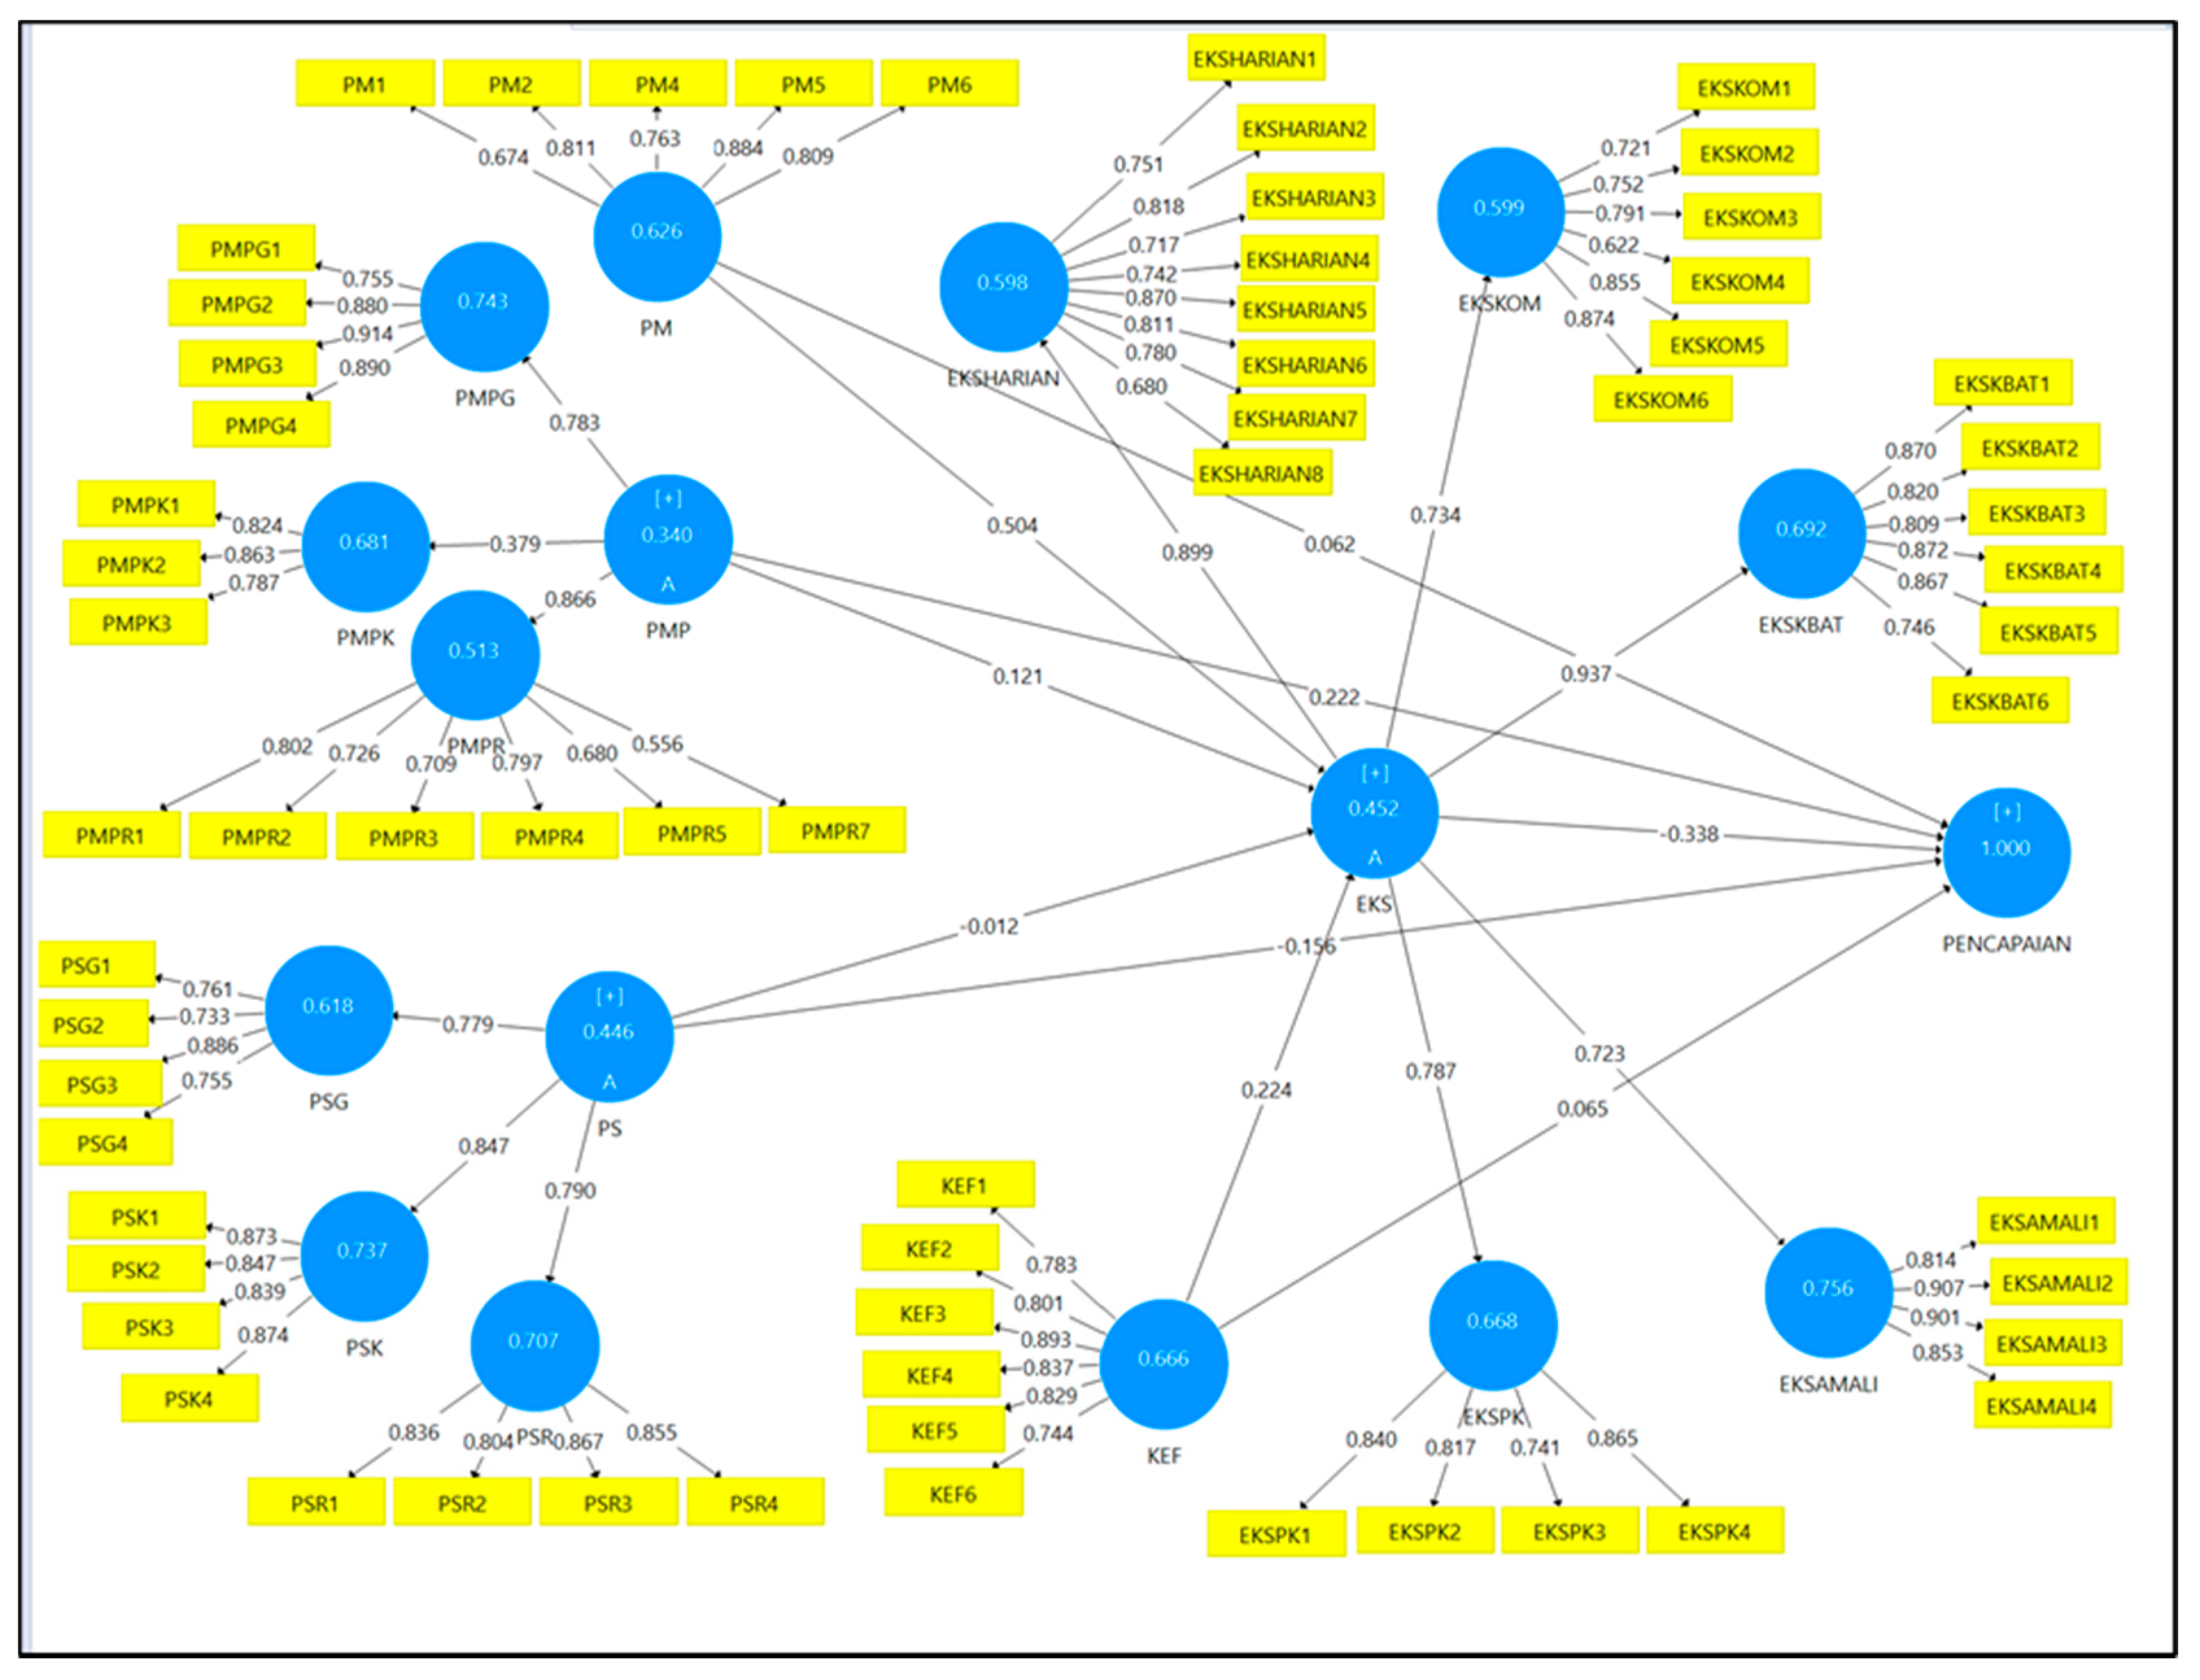
3.5. Structural Equation Modeling

Figure 1 displays the structural equation model for this study. The main objective for the actual study is to test the mediation effect of science self-efficacy for the relationship between sources of self-efficacy and science achievement. It is well known that sources of self-efficacy affect the level of individual self-efficacy both theoretically and statistically [6,10,12,17,69]. On the other hand, past studies confirmed that self-efficacy has a direct effect on science achievement [6,11,22,24,70]. While recent studies confirm the role of self-efficacy as a mediator between several constructs and science achievement in their proposed model [71,72], minimal studies tested the possibility of self-efficacy as a mediator between the self-efficacy sources and science achievement. Some previous researchers proposed a similar model, but in different settings [73,74]. Due to this, researchers proposed the structural model as shown in Figure 1. This is a higher order structural equation model in the form of reflective–reflective relationships [67]. Four sources of self-efficacy, namely, mastery experiences (PM), vicarious experiences (PMP), social persuasion (PS) as well as physiological and emotional states (KEF) act as separate exogenous sources. Achievement acted as endogenous source in this study. Science self-efficacy (EKS) acts as multi-role where EKS is exogenous for the source of self-efficacy, exogenous for achievement as well as a mediator in the structural equation of this model. PMP, PS and EKS are higher order constructs that have dimensions that act as lower order constructs. The weight of all higher order constructs had been set as mode A as suggested by past literature [75]. However, only lower order constructs were analyzed for the purpose of validity and reliability of the questionnaire instrument.
Science achievement in this study refers to the current performance of students in science subjects. Science achievement is measured through student actual test scores based on a set of objective questions. This objective test is a paper and pencil test that contains 50 questions and includes 5 chapters in the new science syllabus in the standard curriculum for secondary school (KSSM) for the form four students (Chapter 1: Safety Measures in Laboratory, Chapter 2: Emergency Help, Chapter 3: Techniques in Measuring the Parameters of Body Health, Chapter 4: Green Technology for Environmental Sustainability and Chapter 5: Genetic). The psychometric features including reliability and validity of this test were already established through Rasch dichotomous measurement model. All the students take the same set of questions at the same time and place. Since the presented model only used actual test scores to represent student achievement, the reliability and validity for this construct were omitted from this kind of analysis. This is because the produced reliability only shows true perfect score of 1.

4. Results

4.1. Construct Reliability and Convergent Validity

The reliability of the construct is determined by the value of outer loading and the value of CR. Meanwhile, the convergent validity is determined through the AVE value. Table 3 shows the values specified for each indicator before the adjustment is made. The assessment of the reliability of the indicator is performed through the value of outer loading. In the table, the outer loading value for the entire indicator exceeds the level of 0.7, as recommended, except for the indicators EKSHARIAN8, EKSKOM4, PM1, PM3, PMPR3, PMPR5, PMPR6, and PMPR7. However, all the indicators below the 0.7 level passed the 0.4 level, with the lowest value of 0.416 being by PM3. These indicators are conditionally accepted, through the CR and AVE values, for the constructs that are the hosts of the indicators [57,58].
In Table 3, the CR values for all the constructs are at a satisfactory level. Although there are some constructs that have a CR value beyond the 0.9 level, they are still acceptable because they are below the 0.95 level [67,76]. The result from the convergent validity assessment using AVE values indicated that all the constructs passed the acceptance level of 0.5, except for PMPR. Therefore, the removal of the indicator was conducted to observe the change in AVE values. Based on the reliability criteria in the SMART-PLS analysis, the AVE value for this PMPR can be increased by removing the indicators that are below the 0.7 level. Although PMPR3, PMPR5, PMPR6, and PMPR7 are below the 0.7 level, indicator removal should be initiated from the indicator with the lowest outer loading overall. In the table, the outer loading indicator PM3 has the lowest value compared to the other indicators that were finally selected to be removed for the first round of analysis.
After the removal of PM3, the model was reanalyzed to obtain values of outer loading, the CR, and the new AVE after realignment occurred. The item removal process was repeated until the AVE value below the 0.5 level increased and exceeded that level. Since there was no increase in the AVE value for PMPR, the item removal process was repeated against the PMPR6 indicator. Table 4 shows the convergent reliability and validity values after the removal of the second indicator PMPR6. When PMPR6 removal occurred, the AVE value for PMPR increased to 0.513. The values of outer loading, CR, and AVE for each construct and indicator involved after adjustment finally reached an acceptable and satisfactory level. Thus, the reliability and convergent validity of the scale is established through the removal of two items, namely, PM3 and PMPR6.

4.2. Discriminant Validity

The evaluation of the discriminant validity of the scale is determined through the HTMT criterion. Although previous studies considered cross-loading values, as well as Fornell-Larcker criteria, to detect the discriminant validity of the scale, these two criteria did not appear to be able to detect most items with poor discriminant validity. Therefore, researchers proposed to evaluate the HTMT criterion as the main assessment for the discriminant validity of a structured model [65]. In a reflective measurement model, discriminant validity is proved when the HTMT value for each construct does not exceed the level of 0.9 [64]. Next, a bootstrapping technique was performed to obtain the actual HTMT confidence interval. In the process, the researchers set up a sample of 5000 samples with a choice of complete bootstrapping technique [77]. A confidence interval of 95% was applied in this technique. The HTMT confidence interval should not show a value of “1” to confirm the discriminant validity of the construct.
Table 5 and Table 6 show the HTMT criterion between the constructs in the structured model for this study. The HTMT values shown in this table are values that are outside the brackets. Based on the HTMT values displayed, all these values are below the maximum level of acceptance, with the highest HTMT value being 0.879 (EKSHARIAN, EKSKBAT). Meanwhile, the HTMT confidence interval is shown through the values in parentheses. The confidence interval shown is the confidence interval that has gone through the bias-corrected and accelerated confidence interval. In Table 5 and Table 6, all the confidence interval values shown do not contain the value “1”. If a value of “1” is displayed, this indicates that the item used has poor discriminant validity [65]. The evaluation through the HTMT criteria in this pilot study proved the existence of strong discriminant validity for the scale used in this study.

4.3. Comparison of Structural Equation Modelling

The validity and reliability of the questionnaire items is evident after the elimination of two indicators (PM3 and PMPR6). Figure 2 and Figure 3 display a comparison of the structural equation model before and after item elimination. The values shown in both the figures are the outer loading values for each indicator, indicated by the arrow. Meanwhile, the number shown in the circular shape is the value of the average variance extracted (AVE) for each lower order construct. However, the values of outer loading and AVE shown by the higher order constructs (PMP, PS, and EKS) should be ignored, as the values do not display the actual values of outer loading and AVE for higher order constructs [75].
Figure 2 displays the outer loading and average variance extracted (AVE) values of the structural equation model before the elimination of indicators. All the outer loading values displayed for the lower order construct exceed 0.4. However, the AVE value for PMPR is 0.474, which is below the acceptance level of 0.5. The process of elimination of indicators is started from the indicator with the lowest value. In this case, the indicator that needs to be removed is PM3, since this indicator has the lowest outer loading value. After the elimination process occurs, the calculation process is performed again until the AVE PMPR value reaches the acceptance level of 0.5.
Figure 3 displays the outer loading and average variance extracted (AVE) values of the structural equation model after the elimination of two indicators, namely, PM3 and PMPR6. After the elimination process occurs, all the outer loading values pass the acceptance level of 0.4. The AVE value for PMPR has also reached the acceptance level of 0.513. This also proves the validity and reliability of this scale.

5. Discussion and Conclusions

The main purpose of this study is to validate the adapted, modified and translated scales that were used to measure the sources of self-efficacy and science self-efficacy. The assessment of validity and reliability through partial least square structural equation modeling proves that the scale used in this study is valid and statistically reliable. This proves the psychometric features of the scale to be used in further analysis of this study.
This paper strictly defines another method to validate the items in the science self-efficacy scale (SLSE), the sources of middle school mathematics self-efficacy scale, as well as the new vicarious and persuasions scale. In the present work, the researchers were focused on validating the science self-efficacy constructs based on five dimensions that originated from the SLSE scale by Lin and Tsai [25]. The findings show consistency in terms of psychometric features across the different kinds of validation methods used by the researchers. The original method differs in terms of statistical analysis, but both the analyses show that this scale has strong psychometric features to be used as a scale to assess the science self-efficacy constructs. Another study that uses this scale in the Malaysian context uses another method of validation, through Cronbach Alpha values in SPSS software from the present work [24]. However, the present work uses a different measurement scale from previous studies, as the researchers introduced the semantic differential scale to assess more information on this construct. This matter proves that this scale can also be used in different measurement scales, depending on the context of the study.
In this study, the self-efficacy sources based on Bandura’s theory were assessed separately in each source. The researcher focused on validating both mastery experiences, and emotional and psychological states as constructs. Both sources were assessed using a subscale that originated from Usher and Pajares; therefore, perhaps the researchers provided part of the answers to the future direction of the research suggested by the original study [78]. This study shows that both subscales can be used in different cultural contexts and domains. In addition, this study also provides the stability of psychometric features across different measurement scales since the researchers decided to use the semantic differential scale over the Likert scale in the original study.
Meanwhile, the validation of vicarious experiences and social persuasion constructs shows that the items are statistically valid and reliable through cross-cultural validation, as suggested by the original study of Ahn et al. [27]. The present work also provides new additional information, as this scale can be used in the science domain as well as semantic differential scales. To conclude, this scale is suitable for use on study samples that have similar characteristics to the sample used in this study, especially form four students who take science subjects in the Malaysian context.
There are some limitations of the study that need to be addressed by the researcher to clarify the state of the study. This study used a small sample and limited location due to the pandemic situation. As a consequence, the findings of the study cannot be generalized to the actual population. On the other hand, future studies could extend this scale to a larger sample in a different context. Moreover, the use of actual test scores may result in poor information about the structure of achievement constructs. Therefore, subsequent studies should emphasize the use of instruments that had been validated through the proposed model.

Author Contributions

Conceptualization, Y.F.L.; methodology, Y.F.L.; software, N.H.M.D.; validation, N.H.M.D.; formal analysis, N.H.M.D.; investigation, N.H.M.D.; resources, N.H.M.D.; data curation, N.H.M.D.; writing—original draft preparation, N.H.M.D.; writing—review and editing, Y.F.L.; visualization, Y.F.L.; supervision, Y.F.L.; project administration, N.H.M.D. All authors have read and agreed to the published version of the manuscript.

Funding

This research received no external funding.

Institutional Review Board Statement

The proposal of this study has been presented and approved by the Research Ethics Committee during a proposal vetting at the Faculty of Psychology and Education, Universiti Malaysia Sabah. The proposal has also been approved by the Educational Planning and Research Division (EPRD) of the Malaysian Ministry of Education (ref. no: KPM.600-3/2/3-eras (7138) dated 17 April 2020) and Sabah State Education Department (ref. no: JPNSBH.SPS.600-1/1/1(007).

Informed Consent Statement

Informed consent was obtained from all subjects involved in the study.

Data Availability Statement

The data that support the findings of this study are available on request from the corresponding author. The data are not publicly available due to privacy or ethical restrictions.

Conflicts of Interest

The authors declare no conflict of interest.

Appendix A

The scale used with the presence of dimensions and code abbreviations.
Table A1. Item Description.
ITEM DESCRIPTION
SUBSCALE 1: SOURCES OF SELF-EFFICACY
CodeItem
Dimension: Mastery Experiences (PM)
PM1I make excellent grades on science tests.
PM2I have always been successful with science.
PM3Even when I study very hard, I do poorly in science.
PM4I got good grades in science on my last report card.
PM5I do well on science assignments.
PM6I do well on even the most difficult science assignments.
Dimension: Vicarious Experiences (PMP)
PMPGVicarious Experiences from Teacher
PMPG1My science teacher is really good at science.
PMPG2My science teacher explains science problems very well.
PMPG3My science teacher can solve even the most difficult science problems.
PMPG4My science teacher clearly explains even the most difficult science ideas.
PMPKVicarious Experience from Family
PMPK1I have a family member who is really good at science.
PMPK2I have a family member who explains science problems very well.
PMPK3I have a family member who has a science-related career.
PMPRVicarious Experience from Peer
PMPR1I have a friend who is really good at science.
PMPR2I have a friend who explains science problems very well.
PMPR3I have a friend who wants to have a science-related career.
PMPR4I have a friend who can solve even the most difficult science problems.
PMPR5I have a friend who receives compliments on his or her work in science.
PMPR6I have a friend who has received an award in a science -related competition.
PMPR7Most of my friends get good grades in science.
Dimension: Social Persuasions (PS)
PSGSocial Persuasions by Teacher
PSG1When I am struggling with science, my teacher tells me that I can do well.
PSG2My teacher tells me that everyone can do well in science if he or she tries hard.
PSG3My teacher has given me advice on how to do better in science.
PSG4My teacher compliments me on my effort in science.
PSKSocial Persuasions by Family
PSK1When I am struggling with science, my family tells me that I can do well.
PSK2My family tells me that everyone can do well in science if he or she tries hard.
PSK3My family has given me advice on how to do better in science.
PSK4My family compliments me on my effort in science.
PSRSocial Persuasions by Peer
PSR1When I am struggling with science, my friends tell me that I can do well.
PSR2My friends tell me that everyone can do well in science if he or she tries hard.
PSR3My friends have given me advice on how to do better in science.
PSR4My friends compliment me on my effort in science.
Dimension: Emotion and Physiological States (KEF)
KEF1Just being in science class makes feel stressed and nervous. *
KEF1Doing science work takes all of my energy. *
KEF2I start to feel stressed-out as soon as I begin my science work. *
KEF3My mind goes blank and I am unable to think clearly when doing science work. *
KEF4I get depressed when I think about learning science. *
KEF5My whole body becomes tense when I have to do science. *
SUBSCALE 2: SCIENCE LEARNING SELF-EFFICACY
Dimension: Conceptual Understanding (EKSPK)
EKSPK1I can explain scientific laws and theories to others.
EKSPK2I can choose an appropriate formula to solve a science problem.
EKSPK3I can link the contents among different science subjects (for example biology, chemistry and physics) and establish the relationships between them.
EKSPK4I know the definitions of basic scientific concepts (for example, gravity, photosynthesis, etc.) very well.
Dimension: Higher-Order Cognitive Skills (EKSKBAT)
EKSKBAT1I am able to critically evaluate the solutions of scientific problems.
EKSKBAT2I am able to design scientific experiments to verify my hypotheses.
EKSKBAT3I am able to propose many viable solutions to solve a science problem.
EKSKBAT4When I come across a science problem, I will actively think over it first and devise a strategy to solve it.
EKSKBAT5I am able to make systematic observations and inquiries based on a specific science concept or scientific phenomenon.
EKSKBAT6When I am exploring a scientific phenomenon, I am able to observe its changing process and think of possible reasons behind it.
Dimension: Practical Work (EKSAMALI)
EKSAMALI1I know how to carry out experimental procedures in the science laboratory.
EKSAMALI2I know how to use equipment (for example measuring cylinders, measuring scales, etc.) in the science laboratory.
EKSAMALI3I know how to set up equipment for laboratory experiments.
EKSAMALI4I know how to collect data during the science laboratory.
Dimension: Everyday Application (EKSHARIAN)
EKSHARIAN1I am able to explain everyday life using scientific theories.
EKSHARIAN2I am able to propose solutions to everyday problems using science.
EKSHARIAN3I can understand the news/documentaries I watch on television related to science.
EKSHARIAN4I can recognize the careers related to science.
EKSHARIAN5I am able to apply what I have learned in school science to daily life.
EKSHARIAN6I am able to use scientific methods to solve problems in everyday life.
EKSHARIAN7I can understand and interpret social issues related to science (for example, nuclear power usage and genetically modified foods) in a scientific manner.
EKSHARIAN8I am aware that a variety of phenomena in daily life involve science-related concepts.
Dimension: Science Communication (EKSKOM)
EKSKOM1I am able to comment on presentations made by my classmates in science class.
EKSKOM2I am able to use what I have learned in science classes to discuss with others.
EKSKOM3I am able to clearly explain what I have learned to others.
EKSKOM4I feel comfortable discussing science content with my classmates.
EKSKOM5In science classes, I can clearly express my own opinions.
EKSKOM6In science classes, I can express my ideas properly.
* Reversed score item.

References

  1. Schunk, D.H. Self-Efficacy: Educational Aspects. In International Encyclopedia of the Social & Behavioral Sciences-Science Direct; Elsevier Ltd.: Amsterdam, The Netherlands, 2001; pp. 13820–13822. [Google Scholar] [CrossRef]
  2. Ferrell, B.; Barbera, J. Analysis of Students’ Self-Efficacy, Interest, And Effort Beliefs in General Chemistry. Chem. Educ. Res. Pract. 2015, 16, 318–337. [Google Scholar] [CrossRef]
  3. Jansen, M.; Scherer, R.; Schroeders, U. Students’ Self-Concept and Self-Efficacy in The Sciences: Differential Relations to Antecedents and Educational Outcomes. Contemp. Educ. Psychol. 2015, 41, 13–24. [Google Scholar] [CrossRef]
  4. Sanfeliz, M.; Stalzer, M. Science Motivation in the Multicultural Classroom: Students construct science knowledge through active participation. Sci. Teach. 2003, 70, 64–66. [Google Scholar]
  5. Bedford, S. Growth Mindset and Motivation: A Study into Secondary School Science Learning. Res. Pap. Educ. 2017, 32, 424–443. [Google Scholar] [CrossRef]
  6. Britner, S.L.; Pajares, F. Sources of Science Self-efficacy Beliefs of Middle School Students. J. Res. Sci. Teach. 2006, 43, 485–499. [Google Scholar] [CrossRef]
  7. Pajares, F.; Britner, S.L.; Valiante, G. Relation between Achievement Goals and Self-Beliefs of Middle School Students in Writing and Science. Contemp. Educ. Psychol. 2000, 25, 406–422. [Google Scholar] [CrossRef] [PubMed]
  8. Andrew, S. Self-Efficacy as A Predictor of Academic Performance in Science. J. Adv. Nurs. 1998, 27, 596–603. [Google Scholar] [CrossRef] [PubMed]
  9. Ng, B.L.; Liu, W.C.; Wang, J.C. Student Motivation and Learning in Mathematics and Science: A Cluster Analysis. Int. J. Sci. Math. Educ. 2016, 14, 1359–1376. [Google Scholar] [CrossRef]
  10. Bandura, A. Self-Efficacy: The Exercise of Control; Worth Publishers: New York, NY, USA, 1997. [Google Scholar]
  11. Kirbulut, Z.D.; Uzuntiryaki-Kondakci, E. Examining the Mediating Effect of Science Self-Efficacy on The Relationship between Metavariables and Science Achievement. Int. J. Sci. Educ. 2019, 41, 995–1014. [Google Scholar] [CrossRef]
  12. Kıran, D.; Sungur, S. Middle School Students’ Science Self-Efficacy and Its Sources: Examination of Gender Difference. J. Sci. Educ. Technol. 2012, 21, 619–630. [Google Scholar] [CrossRef]
  13. Cheung, D. Secondary School Students’ Chemistry Self-Efficacy: Its Importance, Measurement, And Sources. In Affective Dimensions in Chemistry Education; Springer: Berlin/Heidelberg, Germany, 2015; pp. 195–215. [Google Scholar]
  14. Bandura, A. Social Foundations of Thought and Action: A Social Cognitive Theory, 2nd ed.; Prentice-Hall: Hoboken, NJ, USA, 1986; ISBN 9780138156145. [Google Scholar]
  15. Schunk, D.H. Self-Efficacy and Academic Motivation. Educ. Psychol. 1991, 26, 207–231. [Google Scholar]
  16. Ruel, E.; Wagner, W.E.; Gillespie, B.J. The Practice of Survey Research; SAGE Publications: Thousand Oaks, CA, USA, 2015. [Google Scholar]
  17. Chen, J.; Usher, E. Profiles of The Sources of Science Self-efficacy. Learn. Individ. Differ. 2013, 24, 11–21. [Google Scholar] [CrossRef] [Green Version]
  18. Bryan, R.R.; Glynn, S.M.; Kittleson, J.M. Motivation, Achievement, And Advanced Placement Intent of High School Students Learning Science. Sci. Educ. 2011, 95, 1049–1065. [Google Scholar] [CrossRef]
  19. Curriculum Development Division. Guide to the Implementation of Science, Technology, Engineering and Mathematics (STEM) in Teaching & Learning; Ministry of Education Malaysia: Putrajaya, Malaysia, 2016. [Google Scholar]
  20. Lent, R.W.; Brown, S.D.; Larkin, K.C. Relation of Self-Efficacy Expectations to Academic Achievement and Persistence. J. Couns. Psychol. 1984, 31, 356. [Google Scholar] [CrossRef]
  21. Pintrich, P.R.; De Groot, E.V. Motivational and Self-Regulated Learning Components of Classroom Academic Performance. J. Educ. Psychol. 1990, 82, 33. [Google Scholar] [CrossRef]
  22. Kapucu, S. Predicting Physics Achievement: Attitude Towards Physics, Self-Efficacy of Learning Physics, and Mathematics Achievement. In Asia-Pacific Forum on Science Learning & Teaching; The Education University of Hong Kong, Department of Science and Environmental Studies: Hong Kong, 2017; Volume 18. [Google Scholar]
  23. Kurbanoglu, N.; Akin, A. The Relationships Between University Students’ Chemistry Laboratory Anxiety, Attitudes, And Self-Efficacy Beliefs. Aust. J. Teach. Educ. 2010, 35, 48–59. [Google Scholar] [CrossRef]
  24. Jamil, N.L.; Mahmud, S.N.D. Self-Efficacy Relationship on Science Achievement Amongst National Secondary School Students. Creat. Educ. 2019, 10, 2509. [Google Scholar] [CrossRef] [Green Version]
  25. Lin, T.J.; Tsai, C.C. A Multi-Dimensional Instrument for Evaluating Taiwanese High School Students’ Science Learning Self-Efficacy in Relation to Their Approaches to Learning Science. Int. J. Sci. Math. Educ. 2013, 11, 1275–1301. [Google Scholar] [CrossRef]
  26. Lin, T.J.; Tan, A.L.; Tsai, C.C. A Cross-Cultural Comparison of Singaporean and Taiwanese Eighth Graders’ Science Learning Self-Efficacy from A Multi-Dimensional Perspective. Int. J. Sci. Educ. 2013, 35, 1083–1109. [Google Scholar] [CrossRef]
  27. Ahn, H.S.; Bong, M.; Kim, S.I. Social Models in The Cognitive Appraisal of Self-Efficacy Information. Contemp. Educ. Psychol. 2017, 48, 149–166. [Google Scholar] [CrossRef]
  28. Hampton, N.Z. Sources of Academic Self-Efficacy Scale: An Assessment Tool for Rehabilitation Counselors. Rehabil. Couns. Bull. 1998, 41, 260–277. [Google Scholar]
  29. Matsui, T.; Matsui, K.; Ohnishi, R. Mechanisms Underlying Math Self-Efficacy Learning of College Students. J. Vocat. Behav. 1990, 37, 225–238. [Google Scholar] [CrossRef]
  30. Usher, E.L.; Pajares, F. Sources of Academic and Self-Regulatory Efficacy Beliefs of Entering Middle School Students. Contemp. Educ. Psychol. 2006, 31, 125–141. [Google Scholar] [CrossRef]
  31. Pei-Boon, O.; Wan Jaafar, W.M.; Chin-Siang, A.; Nee-Nee, C. Psychometric Properties of The Sources of Counseling Self Efficacy in A Sample of Malaysian Secondary School Counselors. SAGE Open 2020, 10, 1–12. [Google Scholar] [CrossRef] [Green Version]
  32. Uzuntiryaki-Kondakci, E.; Senay, A. Predicting Chemistry Achievement through Task Value, Goal Orientations, and Self-Efficacy: A Structural Model. Croat. J. Educ. 2015, 17, 725–753. [Google Scholar] [CrossRef] [Green Version]
  33. van Rooij, E.C.M.; Fokkens-Bruinsma, M.; Goedhart, M. Preparing Science Undergraduates for A Teaching Career: Sources of Their Teacher Self-Efficacy. Teach. Educ. 2019, 54, 270–294. [Google Scholar] [CrossRef]
  34. Joët, G.; Usher, E.L.; Bressoux, P. Sources of Self-Efficacy: An Investigation of Elementary School Students in France. J. Educ. Psychol. 2011, 103, 649. [Google Scholar] [CrossRef] [Green Version]
  35. Lent, R.W.; Lopez, F.G.; Bieschke, K.J. Mathematics Self-Efficacy: Sources and Relation to Science-Based Career Choice. J. Couns. Psychol. 1991, 38, 424. [Google Scholar] [CrossRef]
  36. Lent, R.W.; Lopez, F.G.; Brown, S.D.; Gore, P.A. Latent Structure of the Sources of Mathematics Self-Efficacy. J. Vocat. Behav. 1996, 49, 292–308. [Google Scholar] [CrossRef]
  37. Pajares, F.; Johnson, M.J.; Usher, E.L. Sources of Writing Self-Efficacy Beliefs of Elementary, Middle, and High School Students. Res. Teach. Engl. 2007, 42, 104–120. [Google Scholar]
  38. Schunk, D.H.; Meece, J.L. Self-Efficacy Development in Adolescence. In Self-Efficacy Beliefs of Adolescents; Information Age Publishing: Charlotte, NC, USA, 2006; Volume 5, pp. 71–96. [Google Scholar]
  39. Song, J.; Bong, M.; Lee, K.; Kim, S.I. Longitudinal Investigation into The Role of Perceived Social Support in Adolescents’ Academic Motivation and Achievement. J. Educ. Psychol. 2015, 107, 821. [Google Scholar] [CrossRef] [Green Version]
  40. Wentzel, K.R. Social Relationships and Motivation in Middle School: The Role of Parents, Teachers, And Peers. J. Educ. Psychol. 1998, 90, 202. [Google Scholar] [CrossRef]
  41. Hin, K.K. PISA 2018 and Malaysia. Int. J. Adv. Res. Educ. Soc. 2020, 2, 12–18. [Google Scholar]
  42. Phang, F.A.; Khamis, N.; Nawi, N.D.; Pusppanathan, J. TIMSS 2019 Science Grade 8: Where Is Malaysia Standing? Asean J. Eng. Educ. 2020, 4, 37–43. [Google Scholar]
  43. Lay, Y.F.; Ng, K.T.; Parahakaran, S. Contributing Factors to TIMSS 2011 Eighth Graders’ Science Achievement: A Comparison between Malaysia and Singapore; Universiti Malaysia Sabah Press: Kota Kinabalu, Malaysia, 2020. [Google Scholar]
  44. Ismail, M.E.; Samsudin, M.A.; Amin, N.F.M.; Kamarudin, N.; Daud, K.A.M.; Halim, L. Contributing Factors to Science Achievement in TIMSS Malaysia: Direct Model and Indirect Model. Int. J. Eng. Technol. 2018, 7, 423–428. [Google Scholar] [CrossRef]
  45. Ministry of Education Malaysia. Malaysia Education Blueprint 2013–2025 (Preschool to Post-Secondary Education); Ministry of Education Malaysia: Putrajaya, Malaysia, 2013. [Google Scholar]
  46. Curriculum Development Division. Form 4 and 5 Curriculum and Assessment Standard Documents: The Science Standard Curriculum for Secondary School (KSSM); Ministry of Education Malaysia: Putrajaya, Malaysia, 2018. [Google Scholar]
  47. Hair, J.F.; Hult, G.T.M.; Ringle, C.M.; Sarstedt, M. A Primer on Partial Least Squares Structural Equation Modeling (PLS-SEM), 2nd ed.; SAGE Publications: Thousand Oaks, CA, USA, 2017. [Google Scholar]
  48. Faul, F.; Erdfelder, E.; Lang, A.G.; Buchner, A. G* Power 3: A Flexible Statistical Power Analysis Program for The Social, Behavioral, And Biomedical Sciences. Behav. Res. Methods 2007, 39, 175–191. [Google Scholar] [CrossRef]
  49. Hoyle, R.H. Structural Equation Modeling: Concepts, Issues, and Applications; SAGE Publications: Thousand Oaks, CA, USA, 1995. [Google Scholar]
  50. Kline, T. Psychological Testing: A Practical Approach to Design and Evaluation; SAGE Publications: Thousand Oaks, CA, USA, 2005. [Google Scholar]
  51. Brislin, R.W. Back-Translation for Cross-Cultural Research. J. Cross-Cult. Psychol. 1970, 1, 185–216. [Google Scholar] [CrossRef]
  52. Jones, P.S.; Lee, J.W.; Phillips, L.R.; Zhang, X.E.; Jaceldo, K.B. An Adaptation of Brislin’s Translation Model for Cross-Cultural Research. Nurs. Res. 2001, 50, 300–304. [Google Scholar] [CrossRef]
  53. Jackson, S.L. Research Methods: A Modular Approach, 3rd ed.; Cengage Learning: Boston, MA, USA, 2014. [Google Scholar]
  54. Hair, J.F.; Hult, G.T.M.; Ringle, C.M.; Sarstedt, M. A Primer on Partial Least Squares Structural Equation Modeling (PLS-SEM), 1st ed.; SAGE Publications: Thousand Oaks, CA, USA, 2014. [Google Scholar]
  55. Nunnally, B.; Bernstein, I.R. Psychometric Theory; Oxford University: Oxford, UK, 1994. [Google Scholar]
  56. Hair, J.F.; Anderson, R.E.; Babin, B.J.; Black, W.C. Multivariate Data Analysis: A Global Perspective; Pearson Education: London, UK, 2010. [Google Scholar]
  57. Hulland, J. Use of Partial Least Squares (PLS) In Strategic Management Research: A Review of Four Recent Studies. Strateg. Manag. J. 1999, 20, 195–204. [Google Scholar] [CrossRef]
  58. Byrne, B. Structural Equation Modeling with AMOS: Basic Concepts, Applications and Programmings; Routledge: Abingdon, UK, 2016. [Google Scholar]
  59. Bagozzi, R.P.; Yi, Y.; Phillips, L.W. Assessing Construct Validity in Organizational Research. Adm. Sci. Q. 1991, 36, 421–458. [Google Scholar] [CrossRef]
  60. Hair, J.F.; Ringle, C.M.; Sarstedt, M. PLS-SEM: Indeed A Silver Bullet. J. Mark. Theory Pract. 2011, 19, 139–152. [Google Scholar] [CrossRef]
  61. Bagozzi, R.P.; Yi, Y. On The Evaluation of Structural Equation Models. J. Acad. Mark. Sci. 1988, 16, 74–94. [Google Scholar] [CrossRef]
  62. Fornell, C.; Larcker, D.F. Evaluating Structural Equation Models with Unobservable Variables and Measurement Error. J. Mark. Res. 1981, 18, 39–50. [Google Scholar] [CrossRef]
  63. Kline, R.B. Principles and Practice of Structural Equation Modeling; Guilford Publications: New York, NY, USA, 2015. [Google Scholar]
  64. Gold, A.H.; Malhotra, A.; Segars, A.H. Knowledge Management: An Organizational Capabilities Perspective. J. Manag. Inf. Syst. 2001, 18, 185–214. [Google Scholar] [CrossRef]
  65. Henseler, J.; Ringle, C.M.; Sarstedt, M. A New Criterion for Assessing Discriminant Validity in Variance-based Structural Equation Modeling. J. Acad. Mark. Sci. 2015, 43, 115–135. [Google Scholar] [CrossRef] [Green Version]
  66. Avkiran, N.K.; Ringle, C.M. Partial Least Squares Structural Equation Modeling: Recent Advances in Banking and Finance; Springer International Publishing: Berlin/Heidelberg, Germany, 2018. [Google Scholar]
  67. Hair, J.F.; Risher, J.; Sarstedt, M.; Ringle, C.M. When To Use and How to Report the Results of PLS-SEM. Eur. Bus. Rev. 2018, 31, 2–24. [Google Scholar] [CrossRef]
  68. Voorhees, C.M.; Brady, M.K.; Calantone, R.; Ramirez, E. Discriminant Validity Testing in Marketing: An Analysis, Causes for Concern, and Proposed Remedies. J. Acad. Mark. Sci. 2016, 44, 119–134. [Google Scholar] [CrossRef]
  69. Sheu, H.B.; Lent, R.W.; Miller, M.J.; Penn, L.T.; Cusick, M.E.; Truong, N.N. Sources of Self-Efficacy and Outcome Expectations in Science, Technology, Engineering, And Mathematics Domains: A Meta-Analysis. J. Vocat. Behav. 2018, 109, 118–136. [Google Scholar] [CrossRef]
  70. Aurah, C. Investigating the Relationship between Science Self-Efficacy Beliefs, Gender, and Academic Achievement, among High School Students in Kenya. J. Educ. Pract. 2017, 8, 146–153. [Google Scholar]
  71. Ucar, F.M.; Sungur, S. The Role of Perceived Classroom Goal Structures, Self-Efficacy, And Engagement in Student Science Achievement. Res. Sci. Technol. Educ. 2017, 35, 149–168. [Google Scholar] [CrossRef]
  72. Zysberg, L.; Schwabsky, N. School Climate, Academic Self-Efficacy and Student Achievement. Educ. Psychol. 2021, 41, 467–482. [Google Scholar] [CrossRef]
  73. Mohamadi, F.S.; Asadzadeh, H. Testing the Mediating Role of Teachers’ Self-Efficacy Beliefs in The Relationship Between Sources of Efficacy Information and Students Achievement. Asia Pac. Educ. Rev. 2012, 13, 427–433. [Google Scholar] [CrossRef]
  74. Phan, H.P. Relations Between Informational Sources, Self-Efficacy and Academic Achievement: A Developmental Approach. Educ. Psychol. 2012, 32, 81–105. [Google Scholar] [CrossRef]
  75. Sarstedt, M.; Hair, J.F.; Cheah, J.H.; Becker, J.M.; Ringle, C.M. How To Specify, Estimate, and Validate Higher-Order Constructs in PLS-SEM. Australas. Mark. J. 2019, 27, 197–211. [Google Scholar] [CrossRef]
  76. Tavakol, M.; Dennick, R. Making Sense of Cronbach’s Alpha. Int. J. Med Educ. 2011, 2, 53. [Google Scholar] [CrossRef]
  77. Hair, J.F.; Sarstedt, M.; Ringle, C.M.; Gudergan, S.P. Advanced Issues in Partial Least Squares Structural Equation Modeling; SAGE Publications: Thousand Oaks, CA, USA, 2018. [Google Scholar]
  78. Usher, E.L.; Pajares, F. Sources of Self-efficacy in Mathematics: A Validation Study. Contemp. Educ. Psychol. 2009, 34, 89–101. [Google Scholar] [CrossRef]
Figure 1. Structural equation model with indicators displayed for each construct.
Education 11 00676 g001
Figure 2. Outer loading and average variance extracted (AVE) values before elimination of indicators. The following code abbreviations are mastery experiences (PM); vicarious experiences (PMP) with the following dimensions: vicarious experiences towards teacher (PMPG), vicarious experiences towards family (PMPK), vicarious experiences towards peers (PMPR); social persuasion (PS) with the following dimensions: social persuasion by teacher (PSG), social persuasion by family (PSK), social persuasion by peers (PSR); physiological and emotional states (KEF); science self-efficacy (EKS) with the following dimensions: conceptual understanding (EKSPK), higher order thinking skills (EKSKBAT), practical work (EKSAMALI), daily life application (EKSHARIAN), science communications (EKSKOM); achievement (PENCAPAIAN).
Education 11 00676 g002
Figure 3. Outer loading and average variance extracted (AVE) values after elimination of indicators. The following code abbreviations are mastery experiences (PM); vicarious experiences (PMP) with the following dimensions: vicarious experiences towards teacher (PMPG), vicarious experiences towards family (PMPK), vicarious experiences towards peers (PMPR); social persuasion (PS) with the following dimensions: social persuasion by teacher (PSG), social persuasion by family (PSK), social persuasion by peers (PSR); physiological and emotional states (KEF); science self-efficacy (EKS) with the following dimensions: conceptual understanding (EKSPK), higher order thinking skills (EKSKBAT), practical work (EKSAMALI), daily life application (EKSHARIAN), science communications (EKSKOM); achievement (PENCAPAIAN).
Education 11 00676 g003
Table 1. Variables and code used in this scale.
VariablesCode
Mastery ExperiencesPM
Vicarious ExperiencesPMP
Dimensions:
Vicarious Experiences Towards TeacherPMPG
Vicarious Experiences Towards FamilyPMPK
Vicarious Experiences Towards PeersPMPR
Social PersuasionPS
Dimensions:
Social Persuasion by TeacherPSG
Social Persuasion by FamilyPSK
Social Persuasion by PeersPSR
Physiological and Emotional StatesKEF
Science Self EfficacyEKS
Dimensions:
Conceptual UnderstandingEKSPK
Higher Order Thinking SkillsEKSKBAT
Practical WorkEKSAMALI
Daily Life ApplicationEKSHARIAN
Science CommunicationsEKSKOM
All code abbreviations were based on original language of research.
Table 2. Acceptance criteria of reliability and validity for reflective measurement model assessments in PLS-SEM.
CategoriesIndexesAssumptionsReferences
Internal Consistency ReliabilityComposite
Reliability (CR)
CR < 0.6 (low)[54]
CR: 0.7–0.9 (satisfied)[55]
CR: 0.6–0.7[54]
(Acceptable for exploratory research)
CR > 0.90[54]
(The probability of multicollinearity issues)
Indicator ReliabilityOuter LoadingOuter Loading > 0.7 (suggested)[56]
0.4 ≤ Outer loading < 0.7[57,58]
(Acceptable with certain condition)
Outer loading < 0.4 (should be eliminated)[59,60]
Convergent ValidityAverage Variance Extracted (AVE)AVE > 0.50
[47,61,62]
Discriminant ValidityHTMT CriterionHTMT 0.85 (Stringent Criterion)[63]
HTMT 0.90 (Conservative Criterion)[64]
−1 < HTMT < 1[65]
with bootstrapping technique applied
(Liberal Criterion)
Table 3. Summary of outer loading, composite reliability and average variance extracted of constructs and indicators before adjustment.
Construct CodeIndicatorOuter LoadingCRAVE
EKSAMALIEKSAMALI10.8140.9250.756
EKSAMALI20.907
EKSAMALI30.901
EKSAMALI40.852
EKSHARIANEKSHARIAN10.7510.9220.598
EKSHARIAN20.818
EKSHARIAN30.717
EKSHARIAN40.742
EKSHARIAN50.87
EKSHARIAN60.811
EKSHARIAN70.78
EKSHARIAN80.68
EKSKBATEKSKBAT10.870.9310.692
EKSKBAT20.82
EKSKBAT30.809
EKSKBAT40.872
EKSKBAT50.867
EKSKBAT60.746
EKSKOMEKSKOM10.7210.8980.599
EKSKOM20.752
EKSKOM30.791
EKSKOM40.622
EKSKOM50.854
EKSKOM60.874
EKSPKEKSPK10.840.8890.668
EKSPK20.817
EKSPK30.741
EKSPK40.865
KEFKEF10.7830.9230.666
KEF20.801
KEF30.893
KEF40.837
KEF50.829
KEF60.744
PMPM10.6750.8680.533
PM20.79
PM30.416
PM40.764
PM50.857
PM60.792
PMPGPMPG10.7520.920.743
PMPG20.882
PMPG30.915
PMPG40.89
PMPKPMPK10.820.8650.681
PMPK20.862
PMPK30.792
PMPRPMPR10.7940.8620.475
PMPR20.7
PMPR30.699
PMPR40.79
PMPR50.682
PMPR60.536
PMPR70.584
PSGPSG10.7610.8650.618
PSG20.733
PSG30.866
PSG40.755
PSKPSK10.8730.9180.737
PSK20.847
PSK30.839
PSK40.874
PSRPSR10.8360.9060.707
PSR20.804
PSR30.867
PSR40.855
Table 4. Summary of outer loading, composite reliability and average variance extracted of constructs and indicators after adjustment.
Construct CodeIndicatorOuter LoadingCRAVE
EKSAMALIEKSAMALI10.8140.9250.756
EKSAMALI20.907
EKSAMALI30.901
EKSAMALI40.853
EKSHARIANEKSHARIAN10.7510.9220.598
EKSHARIAN20.818
EKSHARIAN30.717
EKSHARIAN40.742
EKSHARIAN50.87
EKSHARIAN60.811
EKSHARIAN70.78
EKSHARIAN80.68
EKSKBATEKSKBAT10.870.9310.692
EKSKBAT20.82
EKSKBAT30.809
EKSKBAT40.872
EKSKBAT50.867
EKSKBAT60.746
EKSKOMEKSKOM10.7210.8980.599
EKSKOM20.752
EKSKOM30.791
EKSKOM40.622
EKSKOM50.855
EKSKOM60.874
EKSPKEKSPK10.840.8890.668
EKSPK20.817
EKSPK30.741
EKSPK40.865
KEFKEF10.7830.923 0.666
KEF20.801
KEF30.893
KEF40.837
KEF50.829
KEF60.744
PMPM10.6740.8930.626
PM20.811
PM3
PM40.763
PM50.884
PM60.809
PMPGPMPG10.7550.920.743
PMPG20.88
PMPG30.914
PMPG40.89
PMPKPMPK10.8240.8650.681
PMPK20.863
PMPK30.787
PMPRPMPR10.8020.8620.513
PMPR20.726
PMPR30.709
PMPR40.797
PMPR50.68
PMPR6
PMPR70.556
PSGPSG10.7610.8650.618
PSG20.733
PSG30.866
PSG40.755
PSKPSK10.8730.9180.737
PSK20.847
PSK30.839
PSK40.874
PSRPSR10.8360.9060.707
PSR20.804
PSR30.867
PSR40.855
Table 5. Heterotrait–monotrait (HTMT) criterion (part I).
EKSAMALIEKSHARIANEKSKBATEKSKOM
EKSHARIAN0.591
(0.409,0.754)
EKSKBAT0.693
(0.556,0.803)
0.879
(0.778,0.957)
EKSKOM0.543
(0.357,0.71)
0.627
(0.437,0.786)
0.68
(0.5,0.822)
EKSPK0.54
(0.366,0.691)
0.745
(0.618,0.852)
0.865
(0.773,0.947)
0.484
(0.299,0.67)
KEF0.243
(0.134,0.451)
0.433
(0.289,0.599)
0.402
(0.264,0.565)
0.378
(0.235,0.559)
PM0.475
(0.289,0.651)
0.613
(0.457,0.754)
0.609
(0.446,0.754)
0.595
(0.386,0.779)
PMPG0.399
(0.241,0.578)
0.376
(0.219,0.549)
0.334
(0.178,0.503)
0.43
(0.261,0.602)
PMPK0.266
(0.14,0.476)
0.126
(0.1,0.359)
0.186
(0.113,0.404)
0.118
(0.102,0.336)
PMPR0.322
(0.176,0.528)
0.369
(0.261,0.56)
0.292
(0.187,0.481)
0.346
(0.223,0.524)
PSG0.192
(0.119,0.376)
0.303
(0.207,0.512)
0.282
(0.188,0.482)
0.356
(0.232,0.547)
PSK0.123
(0.09,0.311)
0.417
(0.246,0.615)
0.298
(0.189,0.472)
0.371
(0.205,0.552)
PSR0.216
(0.138,0.421)
0.128
(0.115,0.339)
0.176
(0.126,0.365)
0.243
(0.145,0.436)
Table 6. Heterotrait–monotrait (HTMT) criterion (part II).
EKSPKKEFPMPMPG
KEF0.409
(0.246,0.6)
PM0.643
(0.468,0.795)
0.409
(0.243,0.572)
PMPG0.287
(0.175,0.464)
0.255
(0.129,0.467)
0.535
(0.37,0.686)
PMPK0.165
(0.099,0.386)
0.102
(0.095,0.308)
0.163
(0.116,0.335)
0.118
(0.048,0.340)
PMPR0.216
(0.148,0.439)
0.387
(0.25,0.57)
0.421
(0.3,0.595)
0.485
(0.301,0.672)
PSG0.303
(0.174,0.518)
0.376
(0.205,0.588)
0.5
(0.333,0.676)
0.522
(0.336,0.734)
PSK0.259
(0.156,0.44)
0.282
(0.172,0.484)
0.422
(0.247,0.61)
0.372
(0.194,0.566)
PSR0.153
(0.12,0.371)
0.061
(0.076,0.258)
0.312
(0.185,0.501)
0.357
(0.189,0.54)
PSKPSGPMPRPMPK
PMPR 0.337
(0.184,0.572)
PSG 0.427
(0.283,0.65)
0.176
(0.123,0.415)
PSK 0.596
(0.393,0.794)
0.307
(0.191,0.509)
0.341
(0.141,0.586)
PSR0.547
(0.35,0.734)
0.5
(0.288,0.777)
0.527
(0.328,0.725)
0.389
(0.168,0.609)
Publisher’s Note: MDPI stays neutral with regard to jurisdictional claims in published maps and institutional affiliations.

