
How Financial Performance and State-Owned Enterprise (SOE) Values Are Affected by Good Corporate Governance and Intellectual Capital Perspectives


Abstract
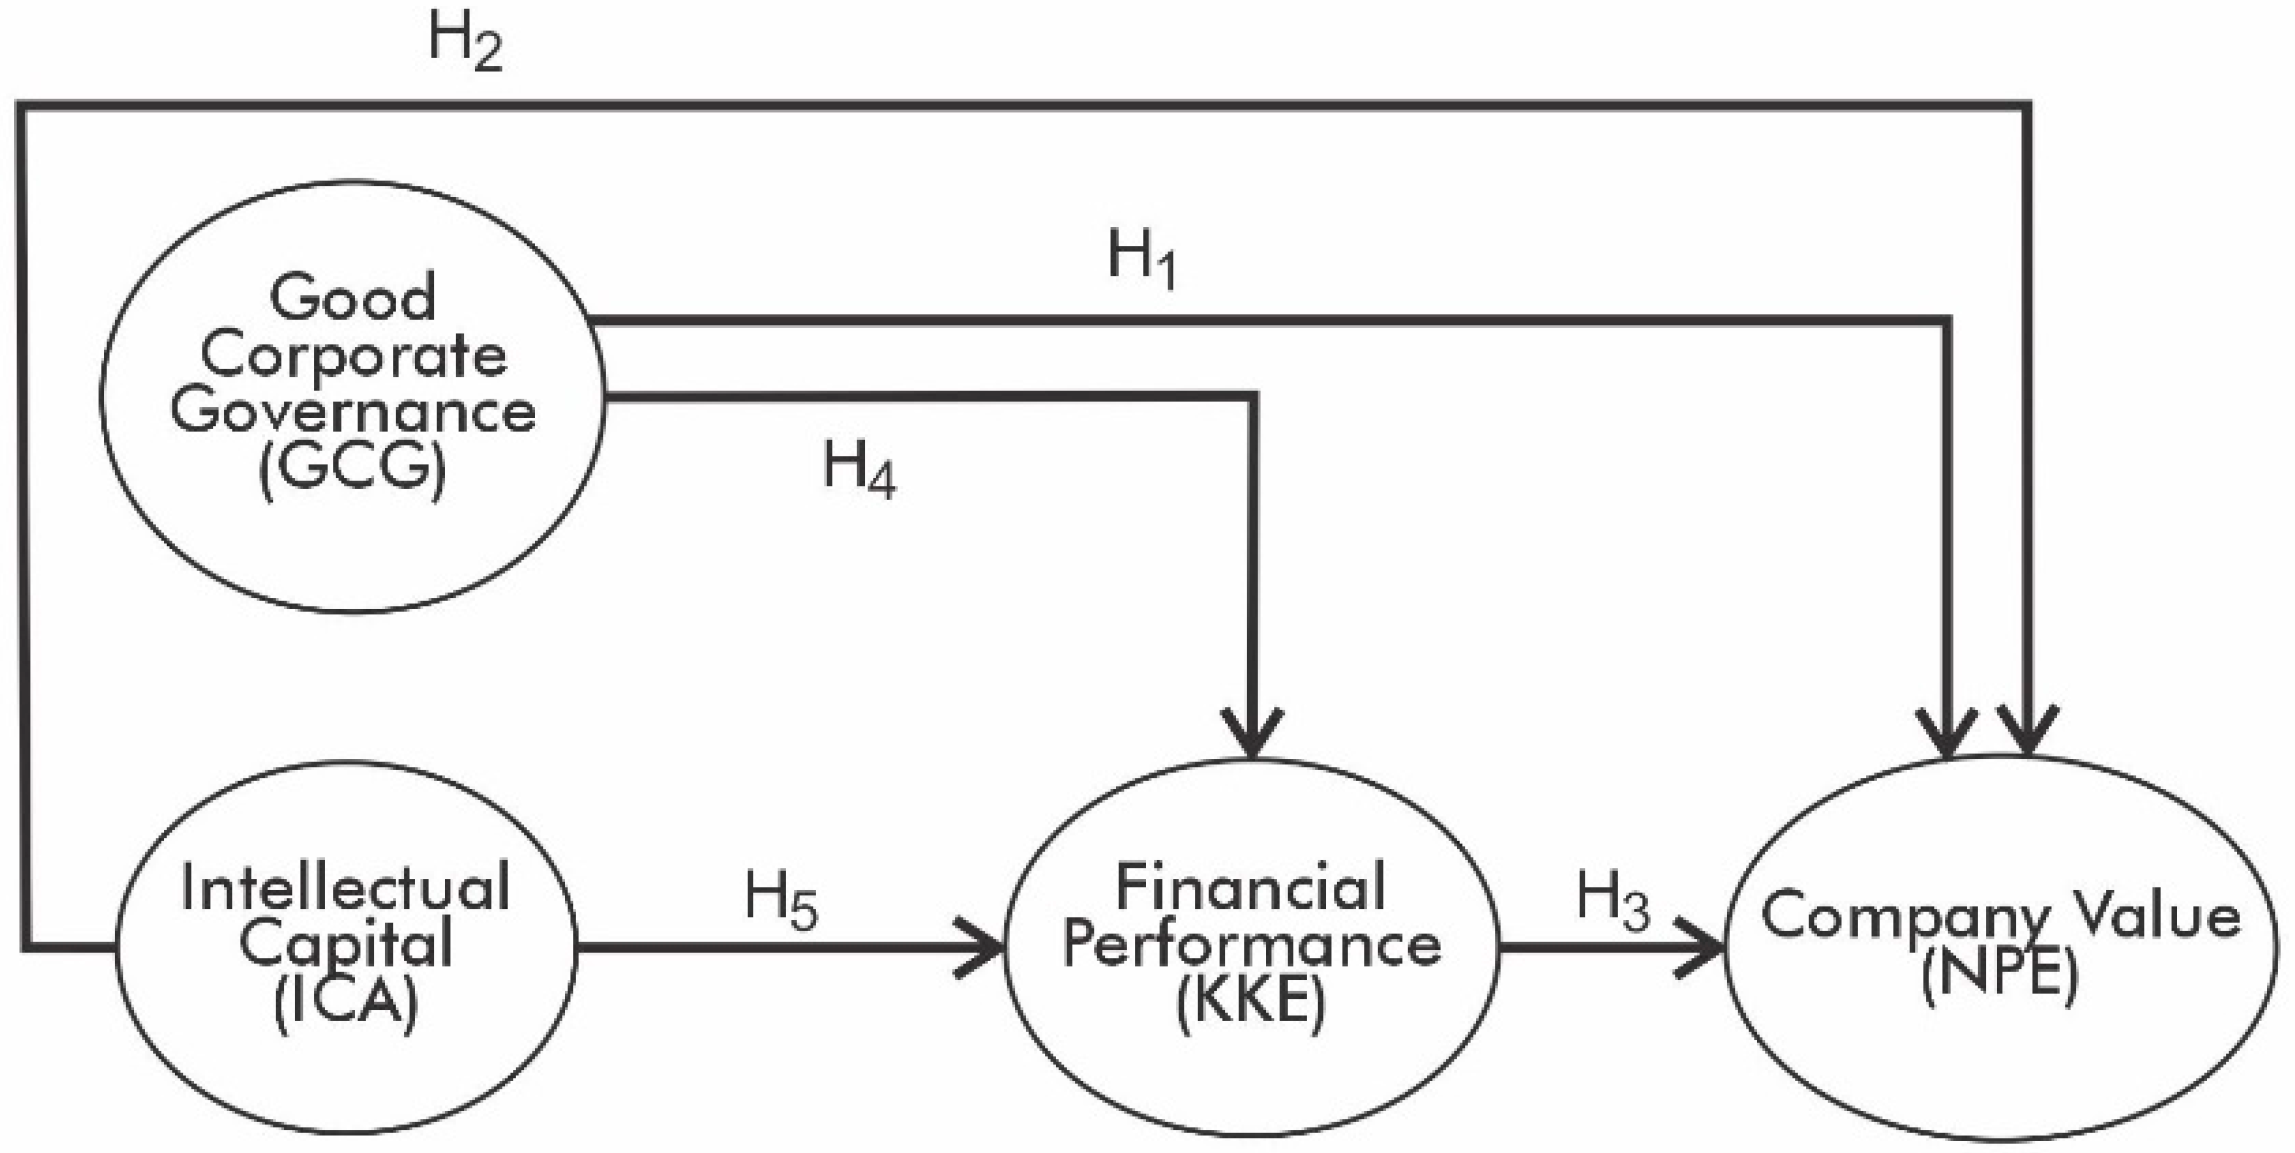
:1. Introduction
Literature Review
2. Methodology
3. Results
3.1. Evaluation Results of Measurement Model (Outer Model)
3.2. Results of Structural Model Evaluation (Inner Model)
3.3. Results of Hypothesis Testing
3.4. Results of the Evaluation of Indirect Effects
4. Conclusions
Author Contributions
Funding
Institutional Review Board Statement
Informed Consent Statement
Conflicts of Interest
Appendix A
- Reports on financial information and results of operations of the company, including comparative analysis with the previous year, as well as the underlying reasons if there is a decline;
- The company’s objectives are disclosed publicly on the company’s website;
- Report on shared ownership structure, including voting rights;
- Reports on rights in decision-making, special voting rights, and the right to participate in making trading decisions and modifying joint assets;
- Company expansion report accompanied by open procedures;
- Report on the composition of the board of commissioners and their income, and allowances such as stock options;
- Disclosures related to risk management in the future (interest rate risks, derivative transaction risks, dependence on certain commodities).
- Reports on future CSR programs (at least one year into the future);
- Procedures for recruitment, career path, remuneration, and rewards and punishments for employees;
- Clear procedures for purchasing goods, including auctions;
- Corporate governance structure and policies disclosed on the company’s website;
- Report of the company’s internal auditors;
- Non-financial performance reports;
- Independent auditor’s report;
- Disclosure of CSR on the company’s website;
- Open disclosure of the whistle-blower procedure which can be read by all internal and external parties.
- Performance accountability report per department;
- Board of director’s accountability report;
- Board of commissioner’s accountability report;
- The independent commissioner’s accountability report;
- Independent auditor’s report accompanied by the responsibilities of the management;
- Audit committee accountability report.
- Reports related to the implementation of the GMS in accordance with the provisions of the Ministry of SOEs;
- Report on the duties and responsibilities of the board of directors according to the regulations of the Minister of SOEs;
- Regulation on commissioners in accordance with the BUMN law;
- Company introduction program report according to the regulations of the Minister of SOEs;
- Regulation on the audit committee according to the BUMN law;
- Report on the accountability of the risk management monitoring committee in accordance with the regulations of the Minister of State-Owned Enterprises;
- Report on the accountability of the nomination and remuneration committee in accordance with the regulations of the Minister of State-Owned Enterprises;
- Accountability report of the corporate secretary according to the BUMN law.
- Managerial accountability report in managing the company effectively and efficiently;
- Accountability report on the realization of the program implemented and the reasons if it is not realized.
- Accountability report regarding the policies taken by the company, including governance and the environment;
- Follow-up accountability reports related to whistle-blower reports received by the company, including the frequency of meetings according to the provisions.
- There are clear duties and responsibilities in all work units;
- The existence of an audit report including findings and recommendations from the internal auditor;
- There is a review procedure from the audit committee on matters that require the attention of the commissioners and the supervisory board, as well as the duties of the commissioners and other supervisory boards;
- Report on the provisions of the audit committee in accordance with the regulations of the Minister of State-Owned Enterprises;
- Reports if there are violations related to conflicts of interest.
- There is an explanation regarding voting rights, including foreign investors and minority shareholders, and whether there has been a change in voting rights;
- There are clear procedures regarding voting, including disclosing the costs involved when submitting votes;
- There is clarity regarding company policies through the GMS, including the percentage of votes;
- Insider trading reports;
- Reports related to payable transactions, including changes in debt policy, investment, as well as company expansion.
References
- Abramov, Alexander, Alexander Radygin, and Maria Chernova. 2017. State-owned enterprises in the Russian market: Ownership structure and their role in the economy. Russian Journal of Economics, Science Direct 3: 1–23. [Google Scholar] [CrossRef]
- Adedeji, Babatunji Samuel, Tze San Ong, Md Uzir Hossain Uzir, and Abu Bakar Abdul Hamid. 2020. Corporate governance and performance of medium-sized firms in Nigeria: Does sustainability initiative matter? Corporate Governance: The International Journal of Business in Society 20: 401–27. [Google Scholar] [CrossRef]
- Ali, Awais, Fu Qiang, and Sadia Ashraf. 2018. Regional dynamics of ownership structure and their impact on firm performance and firm valuation. Review of International Business and Strategy 28: 129–47. [Google Scholar] [CrossRef]
- Alipour, Mohammad. 2012. The effect of intellectual capital on firm performance: An investigation of Iran insurance companies. Measuring Business Excellence 16: 53–66. [Google Scholar] [CrossRef]
- Altman, E. I., and T. P. McGough. 1974. Evaluation of a company as a going concern. Journal of Accountancy 138: 50–57. [Google Scholar]
- Anifowose, Mutalib, Hafiz Majdi Abdul Rashid, Hairul Azlan Annuar, and Hassan Ibrahim. 2018. Intellectual capital efficiency and corporate book value: Evidence from Nigerian economy. Journal of Intellectual Capital 19: 644–68. [Google Scholar] [CrossRef] [Green Version]
- Bashir, Uzma, Ummara Fatima, Sundas Sohail, Farhat Rasul, and Rabia Mehboob. 2018. Internal Corporate Governance and Financial Performance Nexus; a Case of Banks of Pakistan. Journal of Finance and Accounting 6: 11–17. [Google Scholar] [CrossRef] [Green Version]
- Bohdanowicz, Leszek. 2015. The impact of ownership structure on supervisory board size and diversity: Evidence from the Polish two-tier board model. Procedia Economics and Finance 23: 1420–25. [Google Scholar] [CrossRef] [Green Version]
- Busrai, A. 2019. Is Corporate Governance an HR Responsibility? NHRD Network Journal 12: 311–16. [Google Scholar] [CrossRef]
- Chakrawal, A. K. 2006. Corporate Governance and Accountability. Asia Pacific Business Review 2: 88–97. [Google Scholar] [CrossRef]
- Wu, Ming-Chin Chen, Shu-Ju Cheng, and Yuhchang Hwang. 2005. An empirical investigation of the relationship between intellectual capital and firms’ market value and financial performance. Journal of Intellectual Capital 6: 157–76. [Google Scholar]
- Brigham, Eugene F., and Joel F. Houston. 2006. Fundamentals of Financial Management: Dasar-Dasar Manajemen Keuangan. Jakarta: Salemba Empat. [Google Scholar]
- Britto, Daniel Pitelli, Eliane Monetti, and Joao da Rocha Lima Jr. 2014. Intellectual capital intangible intensive firms: The case of Brazilian real estate companies. Journal of Intellectual Capital 15: 333–48. [Google Scholar] [CrossRef] [Green Version]
- Carlucci, D., D. Celenza, and F. Rossi. 2014. Intellectual capital and performance of listed companies: Empirical evidence from Italy. Measuring Business Excellence 18: 22–35. [Google Scholar]
- Chowdhury, Leena Afroz Mostofa, Tarek Rana, Mahmuda Akter, and Mahfuzul Hoque. 2018. Impact of intellectual capital on financial performance: Evidence from the Bangladeshi textile sector. Journal of Accounting & Organizational Change 14: 429–54. [Google Scholar]
- Deep, R., and K. P. Narwal. 2014. Intellectual Capital and its Association with Financial Performance: A Study of Indian Textile Sector. International Journal of Management and Business Research 4: 43–54. [Google Scholar]
- Eberhart, Robert. 2012. Corporate governance systems and firm value: Empirical evidence from Japan’s natural experiment. Journal of Asia Business Studies 6: 176–96. [Google Scholar] [CrossRef]
- Effendi, Muh Arief. 2009. The Power of Good Corporate Governance: Teori dan Implementasi. Jakarta: Salemba Empat. [Google Scholar]
- Fidanoski, Filip, Kiril Simeonovski, and Vesna Mateska. 2014. The impact of board diversity on corporate performance: New evidence from Southeast Europe. Corporate Governance in the US and Global Settings 17: 81–123. [Google Scholar]
- Ghosh, Shantanu Kumar, and Santi Gopal Maji. 2015. Empirical Validity of Value Added Intellectual Coefficient Model in Indian Knowledge-based Sector. Global Business Review 16: 947–62. [Google Scholar] [CrossRef]
- Ghozali, I. 2008. Structural Equation Modeling: Metode Alternatif Dengan Partial Least Square (PLS). Semarang: Badan Penerbit Universitas Diponegoro. [Google Scholar]
- Ghozali, Imam, and Hengky Latan. 2017. Partial Least Squares: Konsep, Metode dan Aplikasi Menggunakan Program Warp PLS 5.0, 3rd ed. Semarang: Badan Penerbit Universitas Diponegoro. [Google Scholar]
- Gittinger, J. P. 1986. Analisis Ekonomi Proyek Pertanian (Terjemahan). Jakarta: Universitas Indonesia Press. [Google Scholar]
- Halim, E. H., G. Mustika, R. N. Sari, R. Anugerah, and Z. Mohd-Sanusi. 2017. Corporate governance practices and financial performance: The mediating effect of risk management committee at manufacturing firms. Journal of International Studies 10: 272–89. [Google Scholar] [CrossRef] [Green Version]
- Hamdan, A. 2018. Intellectual capital and firm performance. International Journal of Islamic and Middle Eastern Finance and Management. [Google Scholar] [CrossRef]
- Husnan, Suad, and Enny Pudjiastuti. 2006. Dasar-Dasar Manajemen Keuangan Edisi Kelima. Yogyakarta: UPP AMP YKPN. [Google Scholar]
- Irfana, Muhammad Jauhan. 2012. Analisis Pengaruh Debt Default, Kualitas Audit, Opinion Shopping Dan Kepemilikan Perusahaan Terhadap Penerimaan Opini Audit Going Concern. Diponegoro Journal of Accounting 1: 656–65. [Google Scholar]
- Janošević, Stevo, Vladimir Dženopoljac, and Nick Bontis. 2013. Intellectual capital and financial performance in Serbia. Knowledge and Process Management 20: 1–11. [Google Scholar] [CrossRef]
- Jarbou, Loay, Jamal Abu-Serdaneh, and Muhannad Atmeh. 2018. Ownership Structure and Conservatism’s Impact on Jordanian Bank’s Financial Performance. The Journal of Developing Areas 52: 183–97. [Google Scholar] [CrossRef]
- Javaid, Muhammad Irfan, and Attiya Yasmin Javid. 2018. Efficacy of going concern prediction model for creditor oriented regime via liquidation. Journal of Applied Accounting Research 19: 552–73. [Google Scholar] [CrossRef]
- Kallamu, Basiru Salisu. 2016. Impact of the Revised Malaysian Code on Corporate Governance on Audit…. Global Journal of Management and Business Research 16: 21–30. [Google Scholar]
- Kasmir, S. E. 2011. Analisis Laporan Keuangan. Jakarta: PT. Raja Grafindo Persada. [Google Scholar]
- Laoworapong, Mongkon, Somchai Supattarakul, and Fredric Willian Swierczek. 2015. Corporate governance, board effectiveness, and performance of Thai listed firms. AU Journal of Management 13: 25–40. [Google Scholar]
- Lassoued, Mongi. 2018. Corporate governance and financial stability in Islamic banking. Managerial Finance 44: 524–39. [Google Scholar] [CrossRef]
- Lin, Karen Jingrong, Xiaoyan Lu, Junsheng Zhang, and Ying Zheng. 2020. State-owned enterprises in China: A review of 40 years of research and practice. China Journal of Accounting Research Elsevier 13: 31–55. [Google Scholar] [CrossRef]
- Manes-Rossi, Francesca, Giuseppe Nicolò, Adriana Tiron Tudor, and Gianluca Zanellato. 2021. Drivers of Integrated Reporting by State-Owned Enterprises in Europe: A Longitudinal Analysis. Meditari Accountancy Research, Emerald Publishing Limited 29: 586–616. [Google Scholar] [CrossRef]
- Mardikanto, Totok. 2014. CSR (Corporate Social Responsibility) (Tanggungjawab Sosial Korporasi). Bandung: Alfabeta. [Google Scholar]
- Mishra, Rakesh Kumar, and Sheeba Kapil. 2018. Effect of board characteristics on firm value: Evidence from India. South Asian Journal of Business Studies 7: 41–72. [Google Scholar] [CrossRef]
- Mouritsen, Jan, Heine T. Larsen, and Per N. D. Bukh. 2001. Intellectual capital and the ‘capable firm’: Narrating, visualising and numbering for managing knowledge. Accounting, Organizations and Society 26: 735–62. [Google Scholar] [CrossRef]
- Nazari, J. A., and I. M. Herremans. 2007. Extended VAIC model: Measuring intellectual capital components. Journal of Intellectual Capital. [Google Scholar] [CrossRef]
- Nhon, Hoang Thanh, Bui Quang Thong, and Nguyen Van Phuong. 2018. The impact of intellectual capital dimensions on Vietnamese information communication technology firm performance: A mediation analysis of human and social capital. Academy of Strategic Management Journal 17: 1–15. [Google Scholar]
- Nimtrakoon, Sirinuch. 2015. The relationship between intellectual capital, firms’ market value and financial performance. Journal of Intellectual Capital 16: 587–618. [Google Scholar] [CrossRef]
- Nkundabanyanga, Stephen Korutaro, Joseph M. Ntayi, Augustine Ahiauzu, and Samuel K. Sejjaaka. 2014. Intellectual capital in Ugandan service firms as mediator of board governance and firm performance. African Journal of Economic and Management Studies 5: 300–40. [Google Scholar] [CrossRef]
- Ozkan, Nasif, Sinan Cakan, and Murad Kayacan. 2017. Intellectual capital and financial performance: A study of the Turkish Banking Sector. Borsa Istanbul Review 17: 190–98. [Google Scholar] [CrossRef] [Green Version]
- Pal, Karam, and Sushila Soriya. 2012. IC performance of Indian pharmaceutical and textile industry. Journal of Intellectual Capital 13: 120–37. [Google Scholar] [CrossRef]
- Pertanian, D. T. I. 2006. Masalah Kebaruan Dalam Penelitian Teknologi Industri Pertanian The Novelty Issues In The Agroindustrial Research. Work 400: 140. [Google Scholar]
- Phusavat, Kongkiti, Narongsak Comepa, Agnieszka Sitko-Lutek, and Keng-Boon Ooi. 2011. Interrelationships between intellectual capital and performance. Industrial Management & Data Systems 111: 810–29. [Google Scholar]
- Pulic, Ante. 1998. Measuring the performance of intellectual potential in knowledge economy. Paper Presented at the 2nd McMaster Word Congress on Measuring and Managing Intellectual Capital by the Austrian Team for Intellectual Potential, Vienna, Austria, 2 October 1998; pp. 1–20. [Google Scholar]
- Purba, M. P. 2009. Asumsi Going Concern: Suatu Tinjauan Terhadap Dampak Krisis Keuangan. Yogyakarta: Graha Ilmu. [Google Scholar]
- Rachmawati, Andri, and Hanung Triatmoko. 2007. Analisis faktor-faktor yang mempengaruhi kualitas laba dan nilai perusahaan. Simposium Nasional Akuntansi X 10: 1–26. [Google Scholar]
- Rashid, Kashif, and Sardar M. N. Islam. 2013. Corporate governance, complementarities and the value of a firm in an emerging market: The effect of market imperfections. Corporate Governance (Bingley) 13: 70–87. [Google Scholar] [CrossRef]
- Riahi-Belkaoui, Ahmed. 2003. Intellectual capital and firm performance of US multinational firms. Journal of Intellectual Capital 4: 215–26. [Google Scholar] [CrossRef]
- Safitri, Dian Anggraeni. 2015. Sustainability Report Terhadap Kinerja Keuangan Dan Pasar. Jurnal Ilmu & Riset Akuntansi 4: 1–15. [Google Scholar]
- Scafarto, Vincenzo, Federica Ricci, and Francesco Scafarto. 2016. Intellectual capital and firm performance in the global agribusiness industry: The moderating role of human capital. Journal of Intellectual Capital 17: 530–52. [Google Scholar] [CrossRef]
- Scott, William Robert. 1997. Financial Accounting Theory. Upper Saddle River: Prentice Hall, vol. 343. [Google Scholar]
- Shahwan, Tamer Mohamed. 2015. The effects of corporate governance on financial performance and financial distress: Evidence from Egypt. Corporate Governance 15: 641–62. [Google Scholar] [CrossRef]
- Shukeri, Siti Norwahida, Ong Wei Shin, and Mohd Shahidan Shaari. 2012. Does board of director’s characteristics affect firm performance? Evidence from Malaysian public listed companies. International Business Research 5: 120. [Google Scholar] [CrossRef] [Green Version]
- Siagian, Ferdinand, Sylvia V. Siregar, and Yan Rahadian. 2013. Corporate governance, reporting quality, and firm value: Evidence from Indonesia. Journal of Accounting in Emerging Economies 3: 4–20. [Google Scholar] [CrossRef]
- Sircar, S., R. Agrawal, S. K. Shanthi, K. S. Reddy, and N. K. Srivastava. 2015. Does governance structure have any effect on firm performance during the financial crisis. Journal of Strategy and Management 8: 368–83. [Google Scholar]
- Badingatus Solikhah, S. E., and Wahyu Meiranto. 2010. Implikasi Intellectual Capital terhadap Financial Performance, Growth dan Market Value; Studi Empiris dengan Pendekatan Simplisitic Specification. In Makalah Disampaikan Dalam Simposium Nasional Akuntansi XIII. Purwokerto: Universitas Jendral Soedirman Purwokerto. [Google Scholar]
- Solimun, Adji Achmad Rinaldo, and Nurjannah Fernandes. 2017. Metode Statistika Multivariat Pemodelan Persamaan Struktural (SEM) Pendekatan WarpPLS. Malang: Universitas Brawijaya Press. [Google Scholar]
- Sripada, Chandrasekhar. 2019. Executive Education in India: Now and in the Future. NHRD Network Journal 12: 64–67. [Google Scholar] [CrossRef]
- Sucuahi, William, and Jay Mark Cambarihan. 2016. Influence of profitability to the firm value of diversified companies in the Philippines. Accounting and Finance Research 5: 149–53. [Google Scholar] [CrossRef] [Green Version]
- Sugiyono. 2010. Metode Penelitian Bisnis (Cetakan ke-15). Bandung: Penerbit Alfabeta. [Google Scholar]
- Sugiyono. 2018. Metode Penelitian Kuantitatif, Kualitatif, Dan R&D. Alfabeta: Penerbit CV. [Google Scholar]
- Sunarsih, N. M., and N. P. Y. Mendra. 2012. Pengaruh modal intelektual terhadap nilai perusahaan dengan kinerja keuangan sebagai variabel intervening pada perusahaan yang terdaftar di Bursa Efek Indonesia. Simposium Nasional Akuntansi XV 1: 1–10. [Google Scholar]
- Tagesson, Torbjörn, and Peter Öhman. 2015. To be or not to be—Auditors’ ability to signal going concern problems. Journal of Accounting & Organizational Change 11: 175–92. [Google Scholar]
- Ulum, Ihyaul. 2017. Intellectual Capital (Model Pengukuran, Framework Pengungkapan, dan Kinerja Organisasi). Malang: UMM Press. [Google Scholar]
- Veronica, Theodora Martina. 2013. Pengaruh good corporate governance, corporate social responsibility & kinerja keuangan terhadap nilai perusahaan. Jurnal Dinamika Manajemen 4: 1–11. [Google Scholar]
- Vo, D. H., and T. M. Nguyen. 2014. The impact of corporate governance on firm performance: Empirical study in Vietnam. International Journal of Economics and Finance 6: 1–13. [Google Scholar] [CrossRef]
- Wiagustini, N. L. P. 2010. Dasar-Dasar Manajemen Keuangan. Denpasar: Cetakan Pertama. [Google Scholar]
- Wright, Stephen, and Andrew Smithers. 2000. Valuing Wall Street: Protecting Wealth in Turbulent Markets. Hoboken: McGraw-Hill. [Google Scholar]
- Zulmawan, W. 2019. Legal Risk Management BUMN. Jakarta: Kencana. [Google Scholar]


| No | Name of SOE | Tobin’s Q |
|---|---|---|
| 1 | Adhi Karya | 0.68 |
| 2 | Aneka Tambang | 0.48 |
| 3 | Bukit Asam | 0.74 |
| 4 | Cement Baturaja | 0.89 |
| 5 | State Gas | 0.86 |
| 6 | Garuda Indonesia | 0.52 |
| 7 | Indo Farma | 0.59 |
| 8 | Jasa Marga | 0.98 |
| 9 | Chemical Farma | 1.35 |
| 10 | Krakatau Steel | 0.40 |
| 11 | Development Housing | 0.99 |
| 12 | Semen Indonesia | 1.60 |
| 13 | Telkom Indonesia | 1.61 |
| 14 | Tin | 0.58 |
| 15 | Wijaya Karya | 1.20 |
| 16 | Waskita Karya | 0.85 |
| 17 | BNI | 0.56 |
| 18 | BRI | 0.32 |
| 19 | BTN | 0.52 |
| 20 | Mandiri | 0.58 |
| ∑ Percentage above 1 | 20% |
| Variable | Indicator | Weight | p-Value |
|---|---|---|---|
| GCG | Transparency | 0.302 | <0.001 |
| GCG | Accountability | 0.257 | 0.004 |
| GCG | Responsibility | 0.274 | 0.002 |
| GCG | Independence | 0.205 | 0.018 |
| GCG | Fairness | 0.231 | 0.009 |
| ICA | Structural Capital Efficiency | 0.333 | <0.001 |
| ICA | Human Capital Efficiency | 0.221 | 0.012 |
| ICA | Relational Capital Efficiency | −0.336 | <0.001 |
| ICA | Capital Employed Efficiency | 0.343 | <0.001 |
| KKE | Return On Assets | 1.000 | <0.001 |
| NPE | Tobin’s Q | 1.000 | <0.001 |
| Model Fit and Quality Indices | Criteria Fit | Results | Information |
|---|---|---|---|
| Average Path Coefficient (APC) | p < 0.05 | p < 0.001 | Fit |
| Average R-Squared (ARS) | p < 0.05 | p = 0.006 | Fit |
| Average Adjusted R-squared (AARS) | p < 0.05 | p = 0.011 | Fit |
| Average Block VIF (AVIF) | Acceptable if ≤ 5, ideality ≤ 3.3 | 1.215 | Fit |
| Average Full Collinearity VIF (AFVIF) | Acceptable if ≤ 5, ideality ≤ 3.3 | 1.237 | Fit |
| Tenenhaus GoF (GoF) | Small ≥ 0,1, Medium ≥ 0.25, Large ≥ 0.36 | 0.424 | Fit |
| Simpson’s Paradox Ratio (SPR) | Acceptable if ≥ 0.7, Ideality = 1 | 0.8 | Fit |
| R-Squared Contribution Ratio (RSCR) | Acceptable if ≥ 0.9, Ideality = 1 | 0.915 | Fit |
| Statistical Suppression Ratio (SSR) | Acceptable if ≥ 0.7 | 1 | Fit |
| Non-linear Bivariate Causality Direction Ratio (NLBCDR) | Acceptable if ≥ 0.7 | 0.5 | Not Fit |
| Exogenous | Endogenous | Path Coefficient | p-Value | Description |
|---|---|---|---|---|
| GCG | NPE | 0.419 | <0.001 | Accepted |
| ICA | NPE | 0.116 | 0.123 | Rejected |
| KKE | NPE | 0.228 | 0.010 | Received |
| GCG | KKE | 0.299 | 0.001 | Received |
| ICA | KKE | 0.423 | <0.001 | Accepted |
| Exogenous | Mediation | Endogenous | Indirect | p-Value | Description |
|---|---|---|---|---|---|
| GCG | KKE | NPE | 0.068 | 0.01 | Accepted |
| ICA | KKE | NPE | 0.097 | 0.04 | Accepted |
Publisher’s Note: MDPI stays neutral with regard to jurisdictional claims in published maps and institutional affiliations. |
© 2021 by the authors. Licensee MDPI, Basel, Switzerland. This article is an open access article distributed under the terms and conditions of the Creative Commons Attribution (CC BY) license (https://creativecommons.org/licenses/by/4.0/).
Share and Cite
Hermanto, Y.B.; Lusy, L.; Widyastuti, M. How Financial Performance and State-Owned Enterprise (SOE) Values Are Affected by Good Corporate Governance and Intellectual Capital Perspectives. Economies 2021, 9, 134. https://doi.org/10.3390/economies9040134
Hermanto YB, Lusy L, Widyastuti M. How Financial Performance and State-Owned Enterprise (SOE) Values Are Affected by Good Corporate Governance and Intellectual Capital Perspectives. Economies. 2021; 9(4):134. https://doi.org/10.3390/economies9040134
Chicago/Turabian StyleHermanto, Yustinus Budi, Lusy Lusy, and Maria Widyastuti. 2021. "How Financial Performance and State-Owned Enterprise (SOE) Values Are Affected by Good Corporate Governance and Intellectual Capital Perspectives" Economies 9, no. 4: 134. https://doi.org/10.3390/economies9040134
APA StyleHermanto, Y. B., Lusy, L., & Widyastuti, M. (2021). How Financial Performance and State-Owned Enterprise (SOE) Values Are Affected by Good Corporate Governance and Intellectual Capital Perspectives. Economies, 9(4), 134. https://doi.org/10.3390/economies9040134